TRANSMITTAL Florida Institute of Technology Department of Marine and Environmental Systems TO: Dr. Stephen Wood Dept. of Marine and Environmental Systems Florida Institute of Technology 150 W. University Blvd. Melbourne, FL 32901 FROM: Senior Design: Blue/Green Energy Department of Marine and Environmental Systems 150 W. University Blvd. Melbourne, FL 32901 RE: Final Report DATE SUBMITTED: July 24, 2009 Dr. Wood, Please review the attached Final Report for the Blue/Green System. Blue/Green Energy Cheryl Skibski __________________________________ Brian Eckert __________________________________ James Boyle __________________________________ Deric Hausmann __________________________________ Kelly Dunn __________________________________
Transcript
TRANSMITTAL Florida Institute of Technology Department of Marine and Environmental Systems TO: Dr. Stephen Wood Dept. of Marine and Environmental Systems Florida Institute of Technology 150 W. University Blvd. Melbourne, FL 32901 FROM: Senior Design: Blue/Green Energy Department of Marine and Environmental Systems 150 W. University Blvd. Melbourne, FL 32901 RE: Final Report DATE SUBMITTED: July 24, 2009 Dr. Wood, Please review the attached Final Report for the Blue/Green System. Blue/Green Energy
Cheryl Skibski __________________________________
Brian Eckert __________________________________
James Boyle __________________________________
Deric Hausmann __________________________________
Kelly Dunn __________________________________
Blue/Green Energy The Blue/Green Energy System
Florida Institute of Technology Department of Marine and Environmental Systems Ocean Engineering Design 2009 Presented by: Cheryl Skibski Kelly Dunn Deric Hausmann James Boyle Brian Eckert
ACKNOWLEDGEMENTS We would like to thank: Dr. Wood for his ability to help all of us on this project, for teaching us the elements of a design process, and sharing with us real life situations that may be encountered. Austin Plastics for their gracious discount and for their time in providing information regarding plastic materials. The Florida Tech Machine Shop staff for their help and time given in the production of our ocean energy device. Dr. Sahoo for helping complete the wave force calculations. PreSealed Systems for their gracious donation of the PVC Pipe. Maaco Auto Painting for their gracious time put into painting the body sections and Salter Duck. Mr. Greg Pebbles for training and providing us with the safety equipment needed for construction of our device. Ms. Stephanie Hopper for providing us with space at the machine shop and providing needed materials. Swain’s Lab CCBC for providing us with additional space. The DMES Office Staff for providing copies, reimbursements, and cash for purchases. Without your help this project would not be possible.
1.0 Executive Summary 6 2.0 Introduction 7
2.1 Motivation 7 2.2 Objectives 7 2.3 Time line 9 2.4 Organization 10
3.0 Background 11 3.1 Historical 11
3.1.1 The Pelamis 12 3.1.2 The Salter Duck 14
3.2 Basic Theory 15 4.0 Procedures 16
4.1 Project Overview 16 4.2 Design Process 17
5.0 Safety Plan 19 5.1 Hazard Analysis (HA) 19
5.1.1 Description of Materials/Conditions 19 5.1.2 Environmental impact analysis 21
5.2 Human Safety Analysis (HSA) 21 5.2.1 Personal Protection Equipment (PPE) 21 5.2.2 General Work Safety 22 5.2.3 University Insurance 22
5.3 Failure Modes and Effects Analysis (FMEA) 22 5.3.1 Points of Flexure 23 5.3.2 Internal Cable Runs 23 5.3.3 External Mooring Cable 23 5.3.4 Lost of Buoyancy 23 5.3.5 Hydraulic System 24
8.1 Salter Duck 26 8.1.1 Construction 26 8.1.2 Coating the Ducks with Fiberglass 28
8.2 Hinge Construction and Design Optimization 32 8.2.1 Introduction 32 8.2.2 Construction 33 8.2.3 Final Assembly 40 8.2.4 Hinge Optimization 42
9.0 Function Decomposition Structure 45 9.1 Hinge Power Generation System 46 9.2 Salter Duck Power Generation System 49 9.3 Hydraulic Oil Flow Optimization 52
TABLE OF CONTENTS
2
9.4 Expansion Tank 55 9.5 Pelton Wheel and Alternator Housing 56
9.5.1 Introduction 56 9.5.2 Theory 56 9.5.3 Pelton Wheel 58 9.5.4 Housing Construction 60
10.0 Computer Models 63 11.0 Deployment 64
11.1 Laws and Regulations 64 11.2 Environmental and Sustainability Constraints 64 11.3 Health and Safety Constraints 65 11.4 Political and Ethnical Constraints 66
12.0 Budget 67 13.0 Results 68
13.1 Theoretical Wave Force Calculations 68 13.1.1 Wave Particle Velocity and Acceleration 69 13.1.2 Wave Force Calculations 69 13.1.3 Force Coefficients 70 13.1.4 Final Calculated Forces 73
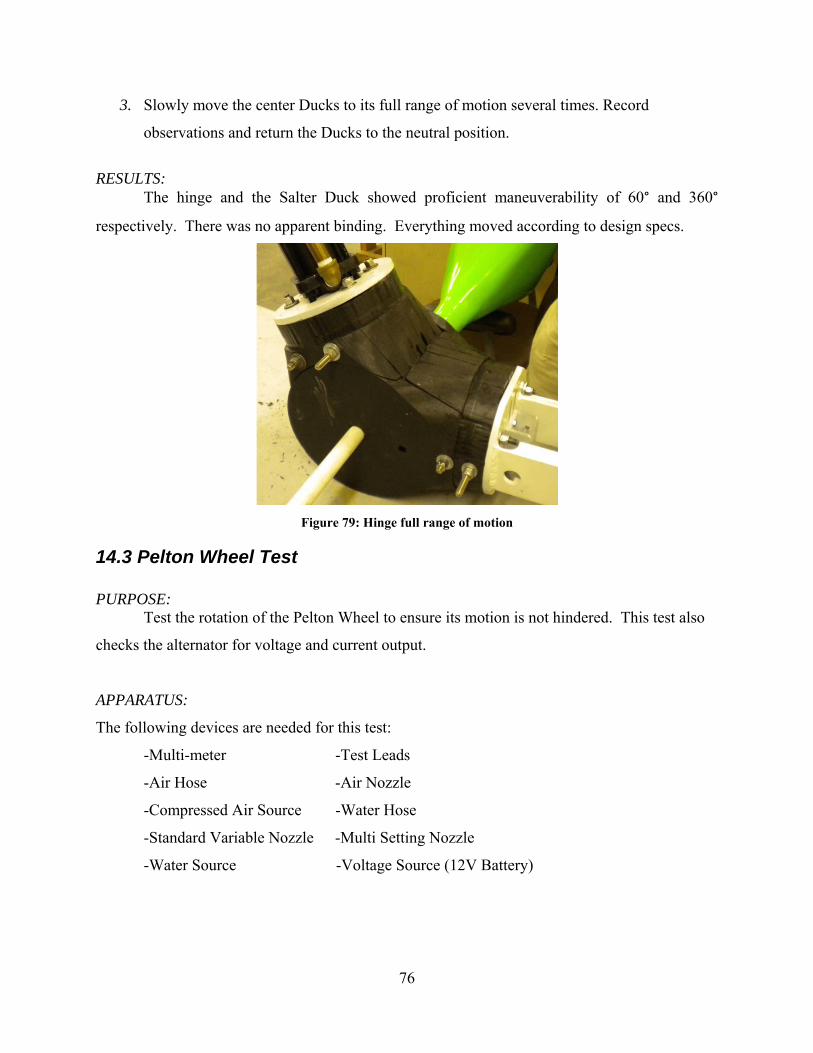
14.0 Testing Results 74 14.1 Structural Test 74 14.2 Maneuverability Dry test 75 14.3 Pelton Wheel Test 76 14.4 Hydraulic Pressure Test 78
Figure 1: List of Tasks 9 Figure 2: Average Cost/kWh of Various Energy Technologies (Price) 11 Figure 3: The Pelamis 12 Figure 4: The Salter Duck (Price) 14 Figure 5: Characteristics of Waves (Dean & Dalrymple) 15 Figure 6: Energy in Waves (Henderson) 15 Figure 7: Initial Hybrid Mockup 16 Figure 8: The Entire Body Design 17 Figure 9: Initial System Evolution 17 Figure 10: A Safer Joint System's Evolution 18 Figure 11: Final Hinge Design 19 Figure 12: Hot Wire Cutter Jig 26 Figure 13: Hot Wire Cutting the Duck 26 Figure 14: Salter Duck 27 Figure 15: Completed Duck before Sanding 28 Figure 16: Drilling hole in Salter Duck for the PVC Pipe 28 Figure 17: Initial Cloth Layout 29 Figure 18: Vacuum Bagging 29 Figure 19: Post Glassing Operations 29 Figure 20: Hand Laid Fiberglass on Duck 30 Figure 21: Application of another coat of Epoxy Resin 30 Figure 22: Cylinder and Salter Duck after painting 31 Figure 23: Entire Structure 31 Figure 24: Aluminum Duck Attachment Piece 31 Figure 25: The Hinge 32 Figure 26: Starboard Specifications 34 Figure 27: Individual Layers cut using Chop Saw 34 Figure 28: Layers after CNC Operation 35 Figure 29: Half of hinge after milling 35 Figure 30: Beginning Stage of Hinge Sanding 36 Figure 31: Hinge with cut out layers 37 Figure 32: Hinge at mid construction showing cable groves 37 Figure 33: End of hinge showing cable pass through 38 Figure 34: Pinchless Joint Demonstration 38 Figure 35: Duck Driven Hydraulic System 39 Figure 36: Demonstrating the Cable Pass Through 39 Figure 37: Construction of the Hinge 41 Figure 38: Final Construction of the Hinge 41 Figure 39: Fully Assembled Hinge demonstrating the pinchless feature 42 Figure 40: Current Configuration of Hinge 43 Figure 41: Internal System Diagram 45 Figure 42: Belt Couple System Showing Internal Belt Races 46 Figure 43: Aluminum Support Structure 46 Figure 44: Hinge -Cable Drive System 47
4
Figure 45: Assembled Hinge-Cable Drive System 47 Figure 46: Constructed Internal System 48 Figure 47: Grove on the Hinge 48 Figure 48: Tensioner 49 Figure 49: Plumbing for Salter Duck Hydraulic Cylinder 49 Figure 50: Cam System 50 Figure 51: Cam 50 Figure 52: Fiberglass Rod Used to Push Cam 50 Figure 53: The Rubber Insert of the Expansion Chamber 51 Figure 54: Pressure Regulator with Pressure Gauge 52 Figure 55: The hydraulic cylinder being cut on the lathe 52 Figure 56: Holes Drilled Before (left) and After (right) 53 Figure 57: Hydraulic Hose 54 Figure 58: Hydraulic Oil 54 Figure 59: Expansion tank 55 Figure 60: Pelton Wheel Housing 56 Figure 61: Typical Multi-Jet Pelton Wheel Turbine (Pensche 2004) 57 Figure 62: System Outline 58 Figure 63: Pelton Wheel Dimensions 59 Figure 64: Pelton Wheel and Close up of Spoon 59 Figure 65: Pelton Wheel Attached to Alternator 59 Figure 66: Holding Reservoir of Pelton Wheel (Pensche 2004) 60 Figure 67: Alternator 60 Figure 68: Alternator Housing 61 Figure 69: Final Pelton Wheel Housing 61 Figure 70: Sealed End of Pelton Wheel Housing 62 Figure 71: Blue/Green System 63 Figure 72: The Hinge 63 Figure 73: Reynold's Number 71 Figure 74: Keulegan-Carpenter Number 71 Figure 75: CD versus Reynolds Number for Various Values of Kc 72 Figure 76: CM versus Reynolds Number for Various Values of Kc 72 Figure 77: Horizontal Wave Forces On Duck Sections 73 Figure 78: PVC Pipe breaking 75 Figure 79: Hinge full range of motion 76 Figure 80: Set up of Compressed Air Test 77 Figure 81: Set up and Nozzle for Test 1 77 Figure 82: Set up and Nozzle for Test 2 78 Figure 83: Fully Assembled Hydraulic System 79 Figure 84: Moving Hinge Up and Down 79 Figure 85: Observation of the Pressure Regulator (Approx. 24 PSI) 80
5
LIST OF TABLES
Table 1: Flow Rate Comparison 53 Table 2: List of Materials 67 Table 3: Data for Calculations 68 Table 4: Maximum Fluid Particle Velocity and Acceleration 69 Table 5: Calculated Maximum Force Numbers 74 Table 6: Calculated Hurricane Force Numbers 74 Table 7: Test Results for Water onto Pelton Wheel 78 Table 8: Total Hours Worked: January – July 84 Table 9: Daily Recorded Hours 84
6
1.0 Executive Summary The demand for energy is rapidly growing as modern technology develops. With this
high energy demand, the pollution producing methods of the past need to be replaced with the
clean, renewable energy producing methods of tomorrow. Blue/Green Energy intends to design
and implement an affordable wave energy device, the Blue/Green System, which will service the
state of Florida and any other coastal region.
The Blue/Green System will harness energy from the waves by two methods. The
cylindrical shape of the system will allow the device to float on the ocean’s surface. The up and
down movement of large waves will collect the wave energy. At the same time, the device will
use Salter ducks to extract energy from the smaller waves. Both methods will work in unison,
converting mechanical energy into electrical energy.
7
2.0 Introduction A renewable energy system is a complex design of multiple factors working in unison to
create energy. Our design team decided to design and build a system to work in the ocean. From
the first design of this system to the final product, many plans were created and carried out. This
report contains the ideas worked on throughout the design process and detailed explanations.
2.1 Motivation Blue/Green Energy’s primary motivation is to build an ocean energy device that will
combine two proven ocean energy techniques into a single more effective system with minimal
impact to the environment. This will be done in a team work environment to accomplish
individual and group goals and to learn to work with each other.
2.2 Objectives Blue/Green Energy, in developing the Blue/Green System, set forth the following objectives:
Research history and current methods of generating energy via ocean waves.
Design an affordable wave energy device that will service the state of Florida and any
other coastal region.
Conduct a feasibility study to determine the best possible method to gather the energy
and transmit it back to shore.
Research low cost materials and energy consumption to create those materials for lowest
possible energy cost in manufacturing our device.
Build relationships with local businesses to aid us in the acquisitions of materials via
donations and or discounts.
Develop good business practices by communicating with businesses and thanking them
for their help.
Design innovative components through the use of computer aided design software.
Conduct a patent search for similar and or existing designs.
Devise methods to produce and implement our design.
Construct a working scaled version of our design.
Be able to generate from 2 to 18 kW of energy via our device.
8
Harness energy (converting mechanical energy into electrical energy) from the waves by
two methods.
Use a cylindrical shape to sit on the surface of the ocean that will move up and
down with the waves to extract energy from swell waves.
Use a Salter duck to extract energy from the small capillary waves on the surface
of the ocean.
Devise a feasible mooring method for our device.
Create test methods and procedures to analyze and verify design elements of our entire
system.
Research and test for best placement location of our device (surf zone, far offshore, etc.).
Make observations along Florida’s Space coast to gather a picture of wave action in the
region.
Participate in a Marine Field Project focusing on data collection of the Ocean
environment.
Create a written proposal to deliver to professors and the Florida Tech academic
community.
Present our design and results at the annual Senior Design Showcase.
Research the possibility of patenting our design and or portions thereof.
9
2.3 Time line The list of tasks is shown below. The timeline, located in the Appendix, was completed in
Microsoft Project.
Figure 1: List of Tasks
10
2.4 Organization The organization of our team is as follows: Cheryl Skibski
• Team leader • Ensures all necessary paperwork for Senior Design is completed in a timely manner • Environmental specialist • Team public relations and liaison specialist • Machinist
James Boyle
• Hydraulic/mechanical system • Alternator and generator devices • Team organizational specialist • Systems analyst • Machinist
Kelly Dunn
• CAD Modeling • Initial concept design and modifications • Machine shop leader • Electrical Systems assembly • Machinist
Brian Eckert
• Head scheduler • Mooring system • Structural systems assembly • Maintain team finances • Machinist
Deric Hausmann
• General systems assembly and installation • Test location researcher • Material selection and acquisitions • Machinist
11
3.0 Background
3.1 Historical The search for harnessing the energy of the ocean waves has gone on for more than two
hundred years. In the late 1700’s wave energy was sought to drive mechanical devices such as
mills and pumps. The push for wave energy was put on hold due to the popularity of steam
engines during that time (Scigliano). The wave energy issue heated up again during the 1970’s.
Alternative forms of energy were of great interest at that time due to the oil embargo crisis. This
led to research and development programs throughout the world, most of which were
government supported. Some of the first countries to participate in the search for wave energy
included the United Kingdom, Japan, Portugal, and Norway (HRMC). However, since the
seventies many more countries including India, Indonesia, Canada, and Australia have also
begun government supported wave projects. Today, the search for commercially viable wave
energy continues where most of these projects are being built by small privately owned
engineering companies.
The figure below displays a graph of the U.S cost in cents/kWh used for each energy
device (Price). It displays the difference between tidal, wave, and nuclear energy technologies.
The wave devices range from turbines, wave terminators and attenuators.
Figure 2: Average Cost/kWh of Various Energy Technologies (Price)
12
Wave attenuators are usually long, slender, segmented devices that lay on the surface of
the ocean. These devices lay parallel with the wave direction. The long slender nature of the
device causes wave height differences along its segments which in turn cause the device to bend
at the joints connecting the segments. This bending motion drives hydraulic pumps for energy
generation (U.S. Department of the Interior). Wave terminating devices are oriented
perpendicular to the wave direction and take advantage of the wave slamming into it. These
devices are generally near shore installations. The idea of combining the wave attenuator and
wave terminator into one system proved to be economical and beneficial. The two ocean energy
devices decided on are described below.
3.1.1 The Pelamis Pelamis Wave Power LTD (Private Limited Company) is the manufacturer of a hinged
contour device system used to generate energy into renewable electricity generated from the
motion of ocean waves. The device, Pelamis Wave Energy Converter, is a design made of
connected runs of pipe-like sections, hinged together in one long sea snake like device. As
waves pass underneath the sections, bending at the hinged joint converts the ocean’s wave
movement into generated electricity.
The wave-induced relative motions due to the
buoyancy of the pipe-like sections of the Pelamis are
resisted by hydraulic cylinders. The cylinders pump
high pressure oil through hydraulic accumulators and
into hydraulic motors. The hydraulic motors turn
generators to produce electricity which is fed down
an ‘umbilical cable’ to a junction where several
devices can be connected together. This junction is
placed on the sea floor and is then linked to shore
through a single sea floor cable.
The Pelamis prototype, deployed in August 2004 in the North Sea, is the world’s first
commercial scale machine to generate electricity directly to the mainland electrical grid simply
from ocean wave energy. The device currently generates electricity for the European Marine
Energy Centre (EMEC) in Orkney, Scotland. In 2006, the prototype was upgraded to have the
Figure 3: The Pelamis (Pelamis Wave Power)
13
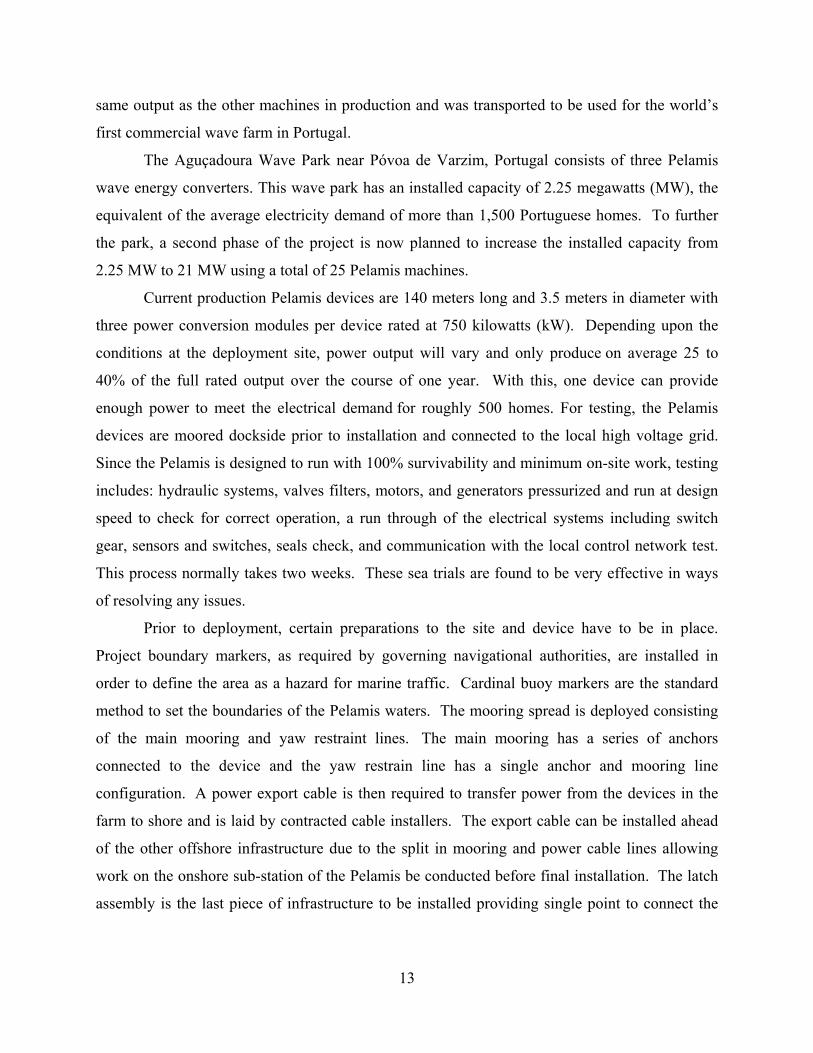
same output as the other machines in production and was transported to be used for the world’s
first commercial wave farm in Portugal.
The Aguçadoura Wave Park near Póvoa de Varzim, Portugal consists of three Pelamis
wave energy converters. This wave park has an installed capacity of 2.25 megawatts (MW), the
equivalent of the average electricity demand of more than 1,500 Portuguese homes. To further
the park, a second phase of the project is now planned to increase the installed capacity from
2.25 MW to 21 MW using a total of 25 Pelamis machines.
Current production Pelamis devices are 140 meters long and 3.5 meters in diameter with
three power conversion modules per device rated at 750 kilowatts (kW). Depending upon the
conditions at the deployment site, power output will vary and only produce on average 25 to
40% of the full rated output over the course of one year. With this, one device can provide
enough power to meet the electrical demand for roughly 500 homes. For testing, the Pelamis
devices are moored dockside prior to installation and connected to the local high voltage grid.
Since the Pelamis is designed to run with 100% survivability and minimum on-site work, testing
includes: hydraulic systems, valves filters, motors, and generators pressurized and run at design
speed to check for correct operation, a run through of the electrical systems including switch
gear, sensors and switches, seals check, and communication with the local control network test.
This process normally takes two weeks. These sea trials are found to be very effective in ways
of resolving any issues.
Prior to deployment, certain preparations to the site and device have to be in place.
Project boundary markers, as required by governing navigational authorities, are installed in
order to define the area as a hazard for marine traffic. Cardinal buoy markers are the standard
method to set the boundaries of the Pelamis waters. The mooring spread is deployed consisting
of the main mooring and yaw restraint lines. The main mooring has a series of anchors
connected to the device and the yaw restrain line has a single anchor and mooring line
configuration. A power export cable is then required to transfer power from the devices in the
farm to shore and is laid by contracted cable installers. The export cable can be installed ahead
of the other offshore infrastructure due to the split in mooring and power cable lines allowing
work on the onshore sub-station of the Pelamis be conducted before final installation. The latch
assembly is the last piece of infrastructure to be installed providing single point to connect the
14
Pelamis machines to both the main moorings and the power cables. The Pelamis machines are
monitored and controlled by a shore based control station.
3.1.2 The Salter Duck One of the early inventors of wave energy devices was Dr. Stephen Salter of Edinburgh
University. Dr. Salter was the leader of a team in Edinburgh that began researching wave energy
in 1976. The research led to the development of a device called the Salter Duck, also referred to
the Edinburgh Duck. The Salter Duck acts as a teardrop shaped wave terminator system oriented
perpendicular to the direction of the wave with the nose of the teardrop facing the oncoming
wave. This device was designed to sit on top of the water, rotate, and “bob” up and down with
the wave. The bobbing and rotating motion of the duck is used to pump internal hydraulics
driving an electrical generator. This enables the Salter Duck to be highly efficient in extracting
energy from the transverse motion of the waves. The figure below shows how the Salter Duck
works with the mooring design (Edinburgh).
Figure 4: The Salter Duck (Price)
Advantages of the Salter Duck include its high efficiency and its small size. The Salter
Duck has an efficiency of 80 to 90%. For a wave with 96% energy going into the Salter Duck,
the duck will absorb 90% of the energy by the bobbing and rotating motion. Only 6% of wave
energy is lost due to viscous friction (Edinburgh). Due to the small size of the duck, many Salter
ducks can be placed in a small area which allows more energy to be harnessed from the ocean
waves.
15
3.2 Basic Theory To better understand the goal of our group it is important to know the theory behind the
invention. The first important topic to discuss is wave characteristics. The Blue/Green System
relies on waves to create energy. Waves are a created by a combination of factors related to its
environment. There are forces present attempting to deform the water surface at all times.
These forces include gravity, wind stress, and atmospheric pressure. Characteristics such as
wave length (L), wave height (H), and the free surface displacement (η) are all affected by these
forces. The figure below shows each of these characteristics in a simple wave.
Figure 5: Characteristics of Waves (Dean & Dalrymple) The Blue/Green System intends to extract the energy from the forces acted onto the
wave. Waves can be categorized into high energy or low energy waves as seen in Figure 6. The
square of the amplitude, wave height over two (H/2), is directly related to the energy transported
in the wave. It is important to note that in waves the energy is transported and not matter.
Figure 6: Energy in Waves (Henderson) Now that this concept has been mentioned let us take a look at the average energy density per
unit area of a wave. Using linear wave theory we can come up with the following equation:
16
[1] 2
81 gHE ρ= (J/m2)
Where ρ is the fluid density, g is the gravity constant, and H is the wave height. Further
derivation and analysis yields the wave energy flux:
[2] CgEP *= (W/m) Where E is the energy density and is the group velocity or the energy transport velocity of the
waves.
4.0 Procedures
4.1 Project Overview In an effort to maximize energy production capabilities we decided to combine the
Pelamis and Salter Duck systems as shown in Figure 7. The Salter Duck will extract the smaller
gravity waves and the hinged contour device, such as the Pelamis, will extract from the swell
waves. The Salter duck can be sized according to the size of waves the ducks will encounter. We
have designed our system to use relatively small ducks to extract energy from small (1-2ft)
waves.
Figure 7: Initial Hybrid Mockup
Similar to the Pelamis system, our Blue/Green System consists of long cylinders
connected with joints that bend both vertically. Attached to these joints is a cable system which
translates the bending motion induced by the waves into a pumping motion on hydraulic
cylinders. In addition, the back and forth motion of the Salter Ducks will also be converted to
hydraulic fluid flow. The hydraulic fluid is pumped into an expansion tank creating pressure.
17
The pressure produced drives the fluid through an electric generator creating electricity. The
final design can be seen in Figure 8.
Figure 8: The Entire Body Design
4.2 Design Process Our initial design went through numerous variations to arrive at its current configuration.
The body sections are made out of PVC pipe and the joints can universal end caps. Figure 9
displays the idea of using an end cap joint component.
Figure 9: Initial System Evolution
In this stage of the design process, safety considerations were brought up over the pinch
points present in the universal cap design. At high angles of bend the two faces of the caps could
collide, creating a pinching motion and further create damage. This device is intended for near
18
shore installation meaning that encounters with swimmers need to be considered. With these
concerns in mind a complete redesign of the joint was undertaken.
The next step of this design was to create a safer design that eliminates the pinch areas. It
was observed that if the hinge tabs in the universal cap were enlarged and given a circular
profile, then no pinch points would be present. The evolution of this rounded joint is presented in
Figure 10.
Figure 10: A Safer Joint System's Evolution
As you can see in Figure 10, several ideas were tried at first. The initial concept was to
have interlocking layers that formed a pinch-less joint. The model was expanded from 3
interlocking discs per side to 10 interlocking discs per side. The layers were then reduced to the
minimum number of layers to speed up production time. The result was the final design
structure shown in Figure 11. The final design of the joint is having 8 layers per side. Some
slight revisions were also made in the design to accommodate an 8.1” non-standard donated PVC
Pipe. The layers are made out of 1 inch thick Starboard plastic, which is cheaper, durable, and
corrosion resistant. This allowed for further investigation of energy extraction mechanisms due
to increased working space within the model.
19
Figure 11: Final Hinge Design
5.0 Safety Plan
5.1 Hazard Analysis (HA)
5.1.1 Description of Materials/Conditions Numerous materials will be utilized in the manufacturing of the Blue/Green Energy
project. Each of these materials are either hazardous or can pose a hazard depending on the
situation in which they are used. Also, the manufacturing and testing process itself will pose
hazardous conditions that we need to be aware of. The following paragraphs discuss hazards
associated with the materials and different processes associated with the project.
Polyvinyl Chloride (PVC) is considered a non-hazardous material and stable under
normal conditions. However, when heated, PVC gives off fumes which could cause respiratory
issues. Also, heated PVC could cause burns when contacted with the skin. We may have to heat
the PVC at some point to make it more pliable and will take proper precautions. Cutting PVC
could be hazardous due to flying debris from the cutting blade and also the blade itself. We will
be cutting PVC to desired lengths during the project and will be aware of the safety hazards that
come with it.
Starboard is a High Density Polyethylene product that contains UV inhibitors making it
perfect for the marine environment. As with PVC, Starboard is considered non-hazardous.
However, there are dangers associated with heating and cutting the material. When cutting the
material dust particles could be inhaled or get into the eyes. Also, Starboard could give off
fumes if it is heated. Dealing with heated material could result in thermal burning.
20
Epoxy and resin mixes will be used extensively throughout the project. These materials
do contain hazardous ingredients. These ingredients are Diglycidyl and Alkylglycidyl Ethers,
Modified Aliphatic Amines, and Nonyl Phenol. The ethers are contained in the resin and the
Amines and Phenol is in the epoxy hardener. Both the resin and epoxy hardeners are considered
stable, however when mixed they create an exothermic reaction. In large quantities, this reaction
can cause smoke and fire hazards. Both the resin and the epoxy hardener can cause skin and eye
irritation or burns. It is important to note that when handling these materials that they do not
come into contact with the skin and to work in a well ventilated area.
Fiberglass will be used in conjunction with the epoxy/resin mix in this project.
Fiberglass itself is not considered to be a hazardous material by OSHA standards. It is, however,
a very irritating material. It is considered a mechanical irritant. The dust from the fibers can
cause irritation to the skin, eyes, nose and mouth. This product should be worked with in a well
ventilated area with proper skin, eye, and respiratory protection.
A limited amount of pressure treated wood will also be used in the Blue/Green System.
This wood does contain some ingredients that are hazardous. These ingredients are
Pentachlorophenol and Petroleum Solvents. Pentachlorophenol is a substance known to be
absorbed into the skin and is very irritating. This product is also irritating to the eyes. Pressure
treated wood should not be burned because it gives off many toxic fumes. When working with
this material, skin and eye protection should be worn in a ventilated area.
Hydraulic fluid will be used inside the power unit to drive the turbine. The fluid is not a
hazardous substance. Over exposure can be irritating to the eyes, skin, and respiratory system.
This product is flammable and should be kept away from excessive heat.
At some point, Acetone may be used for cleaning during the manufacturing process.
Acetone is a hazardous substance in terms of skin and eye contact, ingestion, and inhalation.
Acute hazards from Acetone include skin and eye irritation. This substance is toxic to the central
nervous system, liver, reproductive system, kidneys, and skin. Acetone is extremely flammable
and therefore should be kept away from open flames and excessive heat.
The Blue/Green System unit will be coated with a product called Intersleek for bio-
fouling resistance. This product does contain hazardous ingredients. These ingredients include
Ethyl Benzene, Xylenes, Mica, Titanium Dioxide, and Wollastonite. Intersleek can cause skin
and eye irritation from contact, as well as dizziness, nausea, and many other effects if ingested or
21
inhaled. This product is flammable and therefore should be kept away from heat and open
flames.
The manufacturing and testing processes of the Blue/Green System project pose hazards.
During the manufacturing process we will be doing lots of cutting and machining which itself is
hazardous. During the testing process we will be in the ocean installing the final product in the
water. This process will involve drowning hazard.
5.1.2 Environmental impact analysis All of the materials listed in the previous section should be stored properly so as to avoid
any hazardous situations. All materials will be stored in open, well ventilated areas away from
heat and open flames. The Acetone will be stored in a cool, well ventilated, segregated area
away from direct sunlight as per the MSDS. All materials will be labeled and containers will be
closed to avoid evaporation.
Disposal of all materials will be in accordance with all local, state, and federal
regulations. Based on the Florida Department of Environmental Protection, all hazardous wastes
must be disposed of properly. The hazardous waste generator must first check to see if the waste
is subject to Land Disposal Restrictions. Once that is determined, a list of hazardous materials
and levels of these materials must be generated. Then a determination can be made on whether
the waste must be treated before sent to land disposal. Any used hydraulic fluid will be recycled
in sealed and labeled containers.
5.2 Human Safety Analysis (HSA)
5.2.1 Personal Protection Equipment (PPE) At this time the students will be wearing full length clothing, closed toed shoes, gloves,
safety goggles, and respirators. During the work on any PVC, the students will be wearing full
respirators to help prevent the inhalation of any harmful fumes or particles. In the presence of
any materials that create fumes proper ventilation will be in place and respirators worn. For
machine shop work, the students will be adhering to the safety regulations that are in place at the
time the work is being done. For any work involving power tools, the students will read and
understand the owner/operators manual, as well as have full knowledge of how to properly use
the tools. The students will have a full understanding of the safety issues discussed in the owner/
22
operators manual, and a copy will be on hand at all times. While the power tool is in operation,
the students will be wearing full length clothing, closed toed shoes, safety goggles, and
respirators in the case that harmful fumes and particles that may be present. During testing, when
the Blue/Green System is in the water, all students will stay a fair distance from the device in
order to prevent any harm coming upon the students. If any diving is necessary, the diver will
have taken all of the necessary diving courses from the Florida Institute of Technology, and be
certified to dive and have taken the corresponding CPR test. While on the water, if lightning
suddenly becomes present, all students will immediately vacate the area and seek shelter as soon
as possible. All safety regulations provided by the Florida Institute of Technology and the
Department of Marine and Environmental Systems will be followed and adhered to.
5.2.2 General Work Safety Our group has identified several Occupational Safety and Health Administration (OSHA)
statutes that affect our project work. The following OSHA regulations will be reviewed by each
member:
PART 1904 Recording and Reporting Occupational Injuries and Illness PART 1905 Rules of Practice PART 1910 Occupational Safety and Health Standards PART 1924 Safety Standards Applicable to Workshops and Rehab. Facilities
Members will ensure that when working in the Machine shop the appropriate Personal Protection
Equipment will be used and any applicable Material Safety Data Sheet will be readily available.
5.2.3 University Insurance All project work will be conducted under the Department of Marine and Environmental
Systems and under the advice of Dr. Stephen Wood. At this time all project activities are
covered under the Florida Tech Insurance.
5.3 Failure Modes and Effects Analysis (FMEA) • The anticipated points of failure for our structure is:
o Salter Ducks attachment to the fiberglass rod failure o PVC cylinder body sections attachment to center hinge failure o Hinge interlayer flexing and plastic deformation o PVC Cylinder body section failure midsection
23
o Internal leaking of water tight compartments o Leaking of hydraulic plumbing o Hydraulics draw air instead of oil o Pelton Wheel becomes flooded o Hydraulics resistance is greater than the wave force
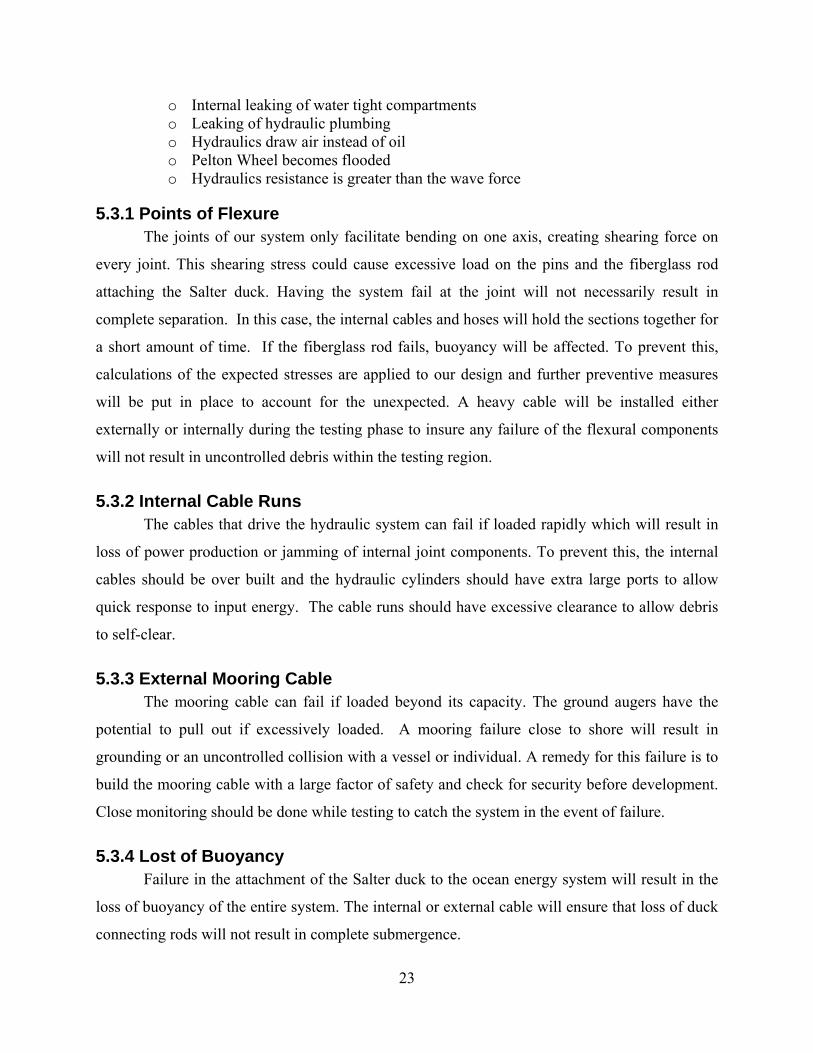
5.3.1 Points of Flexure The joints of our system only facilitate bending on one axis, creating shearing force on
every joint. This shearing stress could cause excessive load on the pins and the fiberglass rod
attaching the Salter duck. Having the system fail at the joint will not necessarily result in
complete separation. In this case, the internal cables and hoses will hold the sections together for
a short amount of time. If the fiberglass rod fails, buoyancy will be affected. To prevent this,
calculations of the expected stresses are applied to our design and further preventive measures
will be put in place to account for the unexpected. A heavy cable will be installed either
externally or internally during the testing phase to insure any failure of the flexural components
will not result in uncontrolled debris within the testing region.
5.3.2 Internal Cable Runs The cables that drive the hydraulic system can fail if loaded rapidly which will result in
loss of power production or jamming of internal joint components. To prevent this, the internal
cables should be over built and the hydraulic cylinders should have extra large ports to allow
quick response to input energy. The cable runs should have excessive clearance to allow debris
to self-clear.
5.3.3 External Mooring Cable The mooring cable can fail if loaded beyond its capacity. The ground augers have the
potential to pull out if excessively loaded. A mooring failure close to shore will result in
grounding or an uncontrolled collision with a vessel or individual. A remedy for this failure is to
build the mooring cable with a large factor of safety and check for security before development.
Close monitoring should be done while testing to catch the system in the event of failure.
5.3.4 Lost of Buoyancy Failure in the attachment of the Salter duck to the ocean energy system will result in the
loss of buoyancy of the entire system. The internal or external cable will ensure that loss of duck
connecting rods will not result in complete submergence.
24
5.3.5 Hydraulic System The hydraulic system can leak. This hydraulic failure will only result in loss of power
production. Environmental concerns are mediated by using environmentally friendly oils like
canola.
5.4 MSDS Sheets The following MSDS sheets are located in the Blue-Green Power team binder: • Science Lab Acetone • JEFFCO 1308NC Epoxy Resin • Owens-Corning Woven Unidirectional Fiberglass Fabric • Mobil Hydraulic Oil 15 Special • International Paint Intersleek Tie-Coat Base Gray • Hughes Brothers, Inc Pressure Treated Wood • Compression Polymers Corp. Starboard
6.0 Customer Requirements The Blue/Green System is designed to work from coastal homes or rural villages, to small
communities and even cities. For the average consumer, a single Blue/Green unit will provide most of
the needs at a price comparable to other alternative energy offerings. This same unit would provide a
small village with enough power to provide lighting for the community, desalination and pumping of
water, and refrigeration. Since coastal regions around the world are rapidly developed and densely
populated, Blue/Green offers clean power near the point of use.
Scalability is achieved by implementation of wave farms. These wave farms are easily
interconnected onshore to local electrical grids by using codes and practices established by the
alternative energy industry. This will allow for the deployment of systems sized from 1kW to
1MW or larger by simply adding on units.
The Blue/Green system can be built to virtually any size to accommodate the different
wave parameters of the location. Blue/Green was originally designed to work off the east coast
of Florida but can be implemented for any coastal region. Given the dynamic scalability of the
Blue/Green System and the environmental concerns of the current generation, Blue/Green is
posed to fulfill the needs of a growing coastal population.
25
7.0 Engineering Specifications The Blue/Green System Specifications are as follows:
• Overall Design length: 14.2 ft • Design width (including ducks): 8 ft • Design weight: 240 lbs.
• Turbine type: Pelton Wheel • Number of turbines per system: 1
• Subsection length(s): 5 ft • Number of subsections: 2 • Number of Ducks: 4 • Subsection composition
o Foam Core: Polystyrene 1.5 inch layer o Outer Shell: 8” Schedule 40 PVC Pipe
• Duck Dimensions
o Duck length: 3ft o Duck width: 1ft o Duck height: 1.5 ft
• Duck Composition o Inner core: 1.5 inch diameter, ¼ inch wall, fiberglass tube o Foam core: Polystyrene o Outer Shell: 3 layers fiberglass mat, 1 layer fiberglass cloth.
Mat weight: To be determined Cloth weight: To be determined
• Range of motion for the Hinge: 60° • Range of motion of the Duck: 360°
• Joint Composition: 1 inch layers of HDPE bolted together with stainless hardware
• Hydraulic System
o Hydraulic Cylinders: 2 o Hydraulic Cylinder diameter: 2” and 3” o Hydraulic Cylinder Through: 6” and 8”
• Hosing: ½ diameter • Accumulator tank: 2.1 gallons with 8” outer diameter
• Operating Temperature: 70 degrees • Operating Regions: Atlantic Ocean or Indian River • Operating fluid: Mineral Oil
26
8.0 Manufacturing Process
8.1 Salter Duck
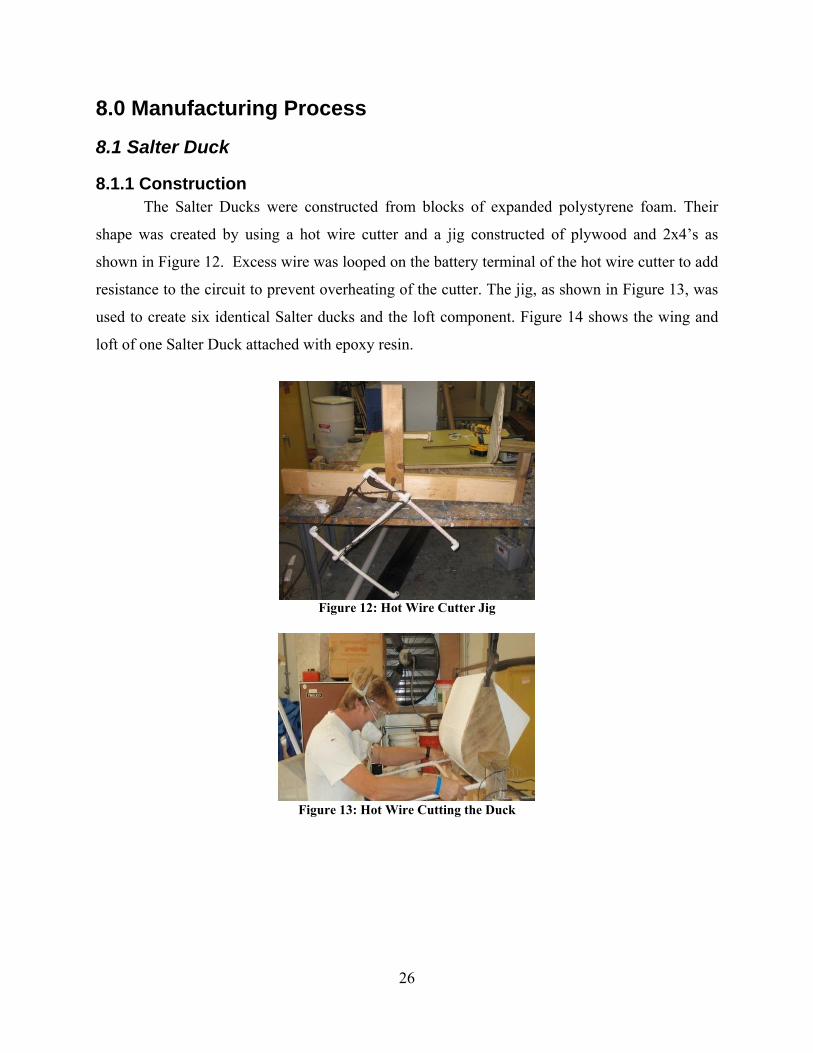
8.1.1 Construction The Salter Ducks were constructed from blocks of expanded polystyrene foam. Their
shape was created by using a hot wire cutter and a jig constructed of plywood and 2x4’s as
shown in Figure 12. Excess wire was looped on the battery terminal of the hot wire cutter to add
resistance to the circuit to prevent overheating of the cutter. The jig, as shown in Figure 13, was
used to create six identical Salter ducks and the loft component. Figure 14 shows the wing and
loft of one Salter Duck attached with epoxy resin.
Figure 12: Hot Wire Cutter Jig
Figure 13: Hot Wire Cutting the Duck
27
Figure 14: Salter Duck
After the epoxy resin cured, the edges were sanded down to provide a neat and clean look
for each Salter Duck.
In order to mount the fiberglass rod to the ducks, a hole was drilled and a 2” inner
diameter PVC pipe was inserted. This pipe will serve as the mounting cavity for the fiberglass
rod. To drill this 36” hole a special extension bit was fabricated.. The bit consisted of a 4’ piece
of round stock threaded at one end to a standard drill chuck head. Since 2” drill bits are costly
and the material we were drilling through was very soft, a simple solution was to utilize a wire
brush head.
Once the hole was made, the hot wire cutter was inserted into the hole and was used to
widen it a couple of inches in diameter. This was done so that some play would be present to
facilitate alignment of the duck’s rotational axis and to center the PVC pipe if the initial hole had
been drilled off angle. After the alignment and positioning, 2 part foam was mixed and applied
to fill the voids between the duck and the PVC pipe. This resulted in the two ducks being
aligned with each other and firmly attached to the PVC.
28
Figure 15: Completed Duck before Sanding
Figure 16: Drilling hole in Salter Duck for the PVC Pipe
8.1.2 Coating the Ducks with Fiberglass
There were two options available for the fiberglass work on the Salter Ducks. The first
option was vacuum bagging and the other option was hand laying of the fiberglass. Both
processes began with an initial layout of the fiberglass cloths, as shown in Figure 17. Figure 18
demonstrates the vacuum bagging process. The vacuum bagging method left the final product
with numerous surface anomalies that needed to be sanded and filled. These operations
consumed a lot of time and it was concluded that hand laying the cloth resulted in a better final
product. The better result from the hand laying technique stems from the fact that the cloth could
29
be manipulated during the curing process and tension could be applied to remove excess folds
and creases.
Figure 17: Initial Cloth Layout
Figure 18: Vacuum Bagging
Figure 19: Post Glassing Operations
Hand laying also allowed one to get rid of the discrepancies in the structure, such as
ridges and air bubbles, which results in increased strength. Figure 20 displays the final product of
30
the hand laid fiberglass Salter Duck. After completion of the fiberglass work, each Duck was
sanded down and coated with epoxy resin.
Figure 20: Hand Laid Fiberglass on Duck
Figure 21: Application of another coat of Epoxy Resin
The ducks and cylinder were sanded and primed to create a professional look. The PVC pipe was
cut off and a 3 ft 1” diameter fiberglass rod was inserted. Additional fiberglass mat was inserted
to provide stability for the fiberglass rod. The fiberglass rod was attached to only two of the four
ducks being used for this prototype. The Salter duck and cylinder were painted by Maaco Auto
Painting. Figures 22 and 23 show the final components after painting.
31
Figure 22: Cylinder and Salter Duck after painting
Figure 23: Entire Structure
Figure 24 displays the aluminum attachment. The device attaches the ducks to the fiberglass rod.
Out of the four ducks, two ducks were attached using this method. The other two ducks had the
fiberglass rod attached using the fiberglass mat.
Figure 24: Aluminum Duck Attachment Piece
32
8.2 Hinge Construction and Design Optimization
Figure 25: The Hinge
8.2.1 Introduction The Blue/Green Energy System’s unique feature is its hinge. Pictured above, Figure 25,
one can see that the hinge incorporates separate fingers to create a pinch-less pivotal system. One
side of the hinge is black, and the other is white to represent the two halves of the working hinge.
Our group decided to integrate the mechanical systems of the Blue/Green to work with and
around this setup.
One of the drawbacks of other hinged wave energy devices is that they are required to be
in marked areas that forbid boaters and swimmers to enter. This is due to the fact that the hinges
on these other systems create dangerous pinch points that could prove fatal to a passer-by. The
Blue/Green Energy System does not require a restricted area due to the nature in where this
system will operate.
The major variable in calculating wave energy is the wave’s height. The taller the wave,
the more energy the wave contains. For this hinged system to work in all coastal areas of the
world, the wave heights must reach their maximum and be close enough to shore to send power
via cables. A logical choice for the systems operating location is the breaker area near shore.
This provides tall waves, and does not require long stretches of wire to be run underwater. The
dilemma in operating the Blue/Green in this area comes from swimmers who would use the
system as a float.
To summarize, the Blue/Green system will work in the breaker area to obtain a maximum
wave height and shorten any underwater wiring and mooring. Due to the breaker zone being a
33
high traffic area, the hinge could not incorporate any pinch points, thus the finger joint system
was implemented.
8.2.2 Construction From the initial implication of the hinge, it was apparent that we would only be building
a smaller prototype of a final working design, and that we would not be able to construct the
hinge with normal tools available to us because of the rounded shapes. Plus, since we were
going to build three working hinges, we needed to make the components multiple times. The
obvious choice before us would be to construct the hinge on the CNC mill, which could cut out
all of the complex curves without problems. The second dilemma was the limited budget we
were given. We could not afford a solid piece of material to construct the hinge, yet this set us in
the mind for an easier way to CNC the complex shape.
Each half of the hinge was constructed out stacks of the selected material. With this
construction setup, each layer can then have its own individual cut-outs and slots for the internal
pulleys, bolt holes, and groves for the piston shaft and cam. This method would also cut down
on our material consumption due to many of the smaller components of the hinge that could be
individually cut out. With this in mind, we decided each layer should be one inch thick. The
plan stated that each layer would go onto the CNC mill, have the initial outline cut out, the
internal holes drilled, and a 1/8 inch pattern be cut onto the bottom and top to insure locking.
For the material selection, the hinge designers wanted to use steel. It is a cheap metal
that would not wear form the constant wave action, it would give a weight source at each hinge
to ensure throw with each wave, and it could easily have bushings mounted onto it. Yet due to
budget restraints, our group decided upon one inch thick Starboard. Starboard is a PVC material
ideal for the ocean environments. It is UV resistant, and has a mild corrosion control better than
normal construction PVC. Fortunately, we were able to get a good deal on the board as we
bought leftover scrap that was just enough for the three hinges we needed. Shown below in
Figure 26 are the specifications of the Starboard material from the product website. Notice the
strength of the material is quite resilient with a high tensile and elongation factor, yet is soft
enough where it can be worn down from a constant friction.
34
Figure 26: Starboard Specifications
For the initial cut on the CNC, we wanted to set one large section of starboard in at a time
and have the CNC cut out multiple pieces. Complications arose as the CNC operator mentioned
that this would not work on the mill. We then opted to only cut out one layer from precut
individual pieces seen in Figure 27. The group decided that one quarter of the hinge should be
cut out at a time without the individual holes and paths.
Figure 27: Individual Layers cut using Chop Saw
35
A total of 5 layers of Starboard 10” x 16” in size were bolted together to be completed on
the CNC machine. Then the same program can be rerun and the machine only requires 3 reloads.
Unfortunately, this method would require a lot more material then we had available to us at the
time given our budget, and it was quickly discovered that there would only be enough material
for one working hinge. Secondly, the CNC took time loading the one quarter of the hinge.
Figure 28 shows a quarter of the hinge completed on the CNC at a time. In Figure 29, one can
see two quarters joined together to make one half of the hinge.
Figure 28: Layers after CNC Operation
Figure 29: Half of hinge after milling
With the two quarters bolted together, the hinge was sanded with a belt sander to remove
all of the mill lines. As can be seen in Figure 30, most of the mill lines were removed, but on the
edge of the hinge, there was to be a flush mount for the main PVC body of the system to rest.
Unfortunately, without the finishing pass on the CNC mill, this lip had to be taken care of with a
hand router. The hand router was not able to give us the smooth edge we required to create a
36
perfect water tight fitting and another sacrifice was made in that the internal system would
remain flooded during operations. For our testing purposes, this was deemed acceptable, but the
hydraulics would then be running in salt water.
By now the system was deemed a full prototype. The system in construction would only
exist to prove the technology and not to create any full amounts of power. With the internal
hydraulics now exposed to the salt water due to the ill fitting hinge on the PVC, certain
modifications were changed to allow the system to be modified. These changes shall be
discussed in the hydraulics section.
Figure 30: Beginning Stage of Hinge Sanding
After the exterior preparation was finished, the separate layers were taken apart and the
individual work was done on them that the CNC mill did not do. First, certain layers had a full
circle cut from them to allow the other half of the hinge to work as seen in Figure 31. Next,
groves were cut from the center two layers on one hinge to provide a resting spot for the cable
that would run across the hinge. These groves were made by placing the two layers on a
turntable on the mill. A rounded vertical cutting bit was attached to the mill, and a quarter inch
grove was cut into the plastic along the travel area of the cable. These two cuts can be seen in
the center of the hinge in Figure 32. The cables pass through from one side of the hinge to
another. One side works as a stop, while the other allows a pass through where the cables will
attach to the hydraulics. The Starboard plastic is soft as seen in Figure 26, and if any cable were
to run across the material, the material would be eaten away quickly. For the initial design, the
cable only comes into contact with the starboard when it is stationary, and this only occurs on the
outer radius of the hinge where the groves were cut. From the cut grove, the cable goes through
37
the other half of the hinge and to the pulleys attached to the hydraulics. For this set up, slots
were drilled and cut in order to allow the cable to pass through, yet with the complete bend of the
hinge, the cables would have ended up going outside of the system. To remedy this, holes were
drilled through the two center sections that had the pass through for the cables that allowed for a
pulley to be integrated into the system.
Figure 31: Hinge with cut out layers
Figure 32: Hinge at mid construction showing cable groves
In Figure 33, the cable is shown going across the radius of one half of the hinge and
through the other half to attach to the hydraulics. Notice in the figure that the pass through are
not just holes, but slots. This is intended to accommodate the swaying motion the hydraulic may
encounter. In Figure 34, the hinge has been split in half to demonstrate the interaction of the
38
internal components of the hinge. One can see in the figure the pulleys that hold the cables off of
the starboard. Underneath the hand are the cables which are not causing any sort of pinch. In
the center of the hinge is the mocked up cam system that will be driving the other half of the
hydraulic system.
Figure 33: End of hinge showing cable pass through
Figure 34: Pinchless Joint Demonstration
With the cable driven hydraulic system on the hinge finished, the duck driven cam
system needed to be cut from the hinge. Unlike the cable driven hydraulic system on one half of
the hinge which depends on the bending movement of the full system, the duck driven hydraulics
only needed to be hard bolted to the hinge.
The two center layers of the hinge had a 6” hole drilled though the center of the rotating
hinge section to allow clearance for the 4” cam. Since the duck driven hydraulic is operated
from the cam in the center of the hinge, a large 1.3” pass through hole was drilled through the
base of the hinge to the center area to allow able clearance for the 1.25” hydraulic shaft. The
ducks were originally designed to have a 1.5” fiberglass rod hold them to the hinge, but due to
39
financial restraints, we had to settle for a 1” fiberglass rod, yet this proved to be a positive fault
for our current prototype system because the fiberglass rod is attached to the cam in the center of
the hinge and with a smaller rod diameter, the cam could then have a max displacement of 2”
versus 1”. Since the end of the hydraulic shaft was modified for two rollers, the two center
layers of the hinge also needed to be widened to allow for clearance during full contraction.
Figure 35: Duck Driven Hydraulic System
With the majority of the internal components installed inside the hinge, the hydraulic
brackets were assembled and ready for final attachment onto the hinge. The brackets needed to
be mounted through the hinge to ensure that the wave stresses would not shear the hydraulics
from the hinge. A series of lag bolts was suggested and may have worked, yet the ends of the
hinge were becoming busy and an array of four bolts was used. The four bolts on each end of
the hinge went through two of the short layers of the hinge on each side. The four holes were
then recessed on the internal end of the hinge to prevent interaction between the rotation of the
hinge and the head of the bolt. The final assembly of the hinge and hydraulic brackets can be
seen in Figure 36.
Figure 36: Demonstrating the Cable Pass Through
40
8.2.3 Final Assembly The hinge assembly incorporates:
• Eight layers per hinge half
• Four cables that operate the swell wave hydraulics
• Four internal pulleys for each cable
• Two layers with pass through slots for cables
• Two layers with a 6” gap for cam operation
• Salter Duck fiberglass rod pass through
• 4” Brass cam to operate the Salter hydraulics
• Stanchions for the main body attachments
• Hollows for the main hydraulic attachments
To be able to install each component listed above as well as the aluminum hydraulic
brackets, the hinge had to be built one layer at a time from the duck up. This proved to be a slow
process as each component in each layer was free floating in the hinge until the next layer was
attached. Also, the whole assembly could not be bolted together until the whole hinge was
complete, thus the hinge was in a constant state of slack until the final layer was attached.
Using the Ducks fiberglass rod and the threaded rods as a guide, the first layer of the
hinge was laid into place which consisted of the two halves of the hinge not interconnected. The
second layer was the first ‘locking’ layer as it brought both halves of the hinge together. The
shorter half of the second layer has two of the four bolts that hold the cable driven hydraulics’
bracket. These first two layers of the hinge have no internal components and their main purpose
of the hinge is for material strength in absorbing shear stress from the waves. The third layer
works like the first two layers in that it is a solid component with no internal working
components, and the smaller half of the hinge incorporates two of the four bolts for the duck
driven hydraulics’ bracket. The third layer has the mounting hole for the internal pulleys used
for keeping the cable in a linear path to the hydraulics. Here the two pulleys and shafts are
inserted into the holes and the next two halves are placed over the pulleys. The next two layers
are the middle layers that housing the working internal components of the assembly. Both layers
are oriented in the same direction, versus switching orientation like the previous layers. Once
the layers have been placed over the pulleys, the hydraulic brackets should be installed on either
side of the hinge. This helps in holding the assembly together, but also the duck driven hydraulic
41
has to be installed next before other layers can be installed. To ease in assembly of the duck
driven hydraulic, the shorter half of the fifth layer can be installed so the second set of bolts for
the bracket may be used shown in Figure 37.
Figure 37: Construction of the Hinge
Once in this state, the hydraulic, which is pre installed onto the bracket, has the two
rollers installed onto the end of the shaft once the shaft has been inserted into the hinge. The 4”
cam is then installed over the duck shaft and set in place using its two set screws. The rest of the
fifth layer is ready to install at this time. Afterwards the last two layers are symmetrical to the
first two layers and are easily installed onto the assembly seen in Figure 38.
Figure 38: Final Construction of the Hinge
After the final layer is assembled, the three threaded rods can be bolted onto the system
holding the whole hinge in one final piece. Carefully tighten the bolts and test the hinge a few
42
times to make sure no components are pinching. At this point the hinge should have both
hydraulic brackets installed, the duck driven hydraulic shaft fully assembled including both
rollers, the cam set on the duck shaft, the pulleys for the cable and the cables going through the
hinge. Once the hinge has been tested to ensure that all internal components are working
properly, the hinge is ready to have all of the exterior components installed.
From this point on the hinge will act as the main working force of the entire system and
will have the most moving components. For the current prototype system we have been
building, this hinge is in its ideal state. It transfers large rolling wave’s motion into a high
pressure system and houses the Duck’s cam system. The hinge of this system is the point of
focus for the future studies of this device and has many possibilities and potential.
Figure 39: Fully Assembled Hinge demonstrating the pinchless feature
8.2.4 Hinge Optimization This device is only a prototype stage of development. Due to budget and time
constraints, a full sized optimized version of the system could not be constructed. Although,
thanks to this prototype device, many of the previously unseen flaws were addressed and certain
design changes were made. For a next build for students, a few modifications can be made to the
current hinge, yet for a full build with proper funding, a completely new hinge would be
constructed that only follows the working pattern of the current hinge and nothing more.
For students continuing to work on the system in future Senior Design classes, the hinge
would only need a few optimizations. For instance, the internal pulleys that hold the cable in
position for the hydraulic drive are currently only a round piece of aluminum and a brass rod
positioned into holes. The pulley system needs a stronger rod as the current one is currently
43
under a high amount of stress that in time will misalign the rod. Next the pulley needs to be
made from high grade steel, such as stainless steel, and include bearings to increase in the
efficiency of the system. The fiberglass rod for the duck is currently aligned by the Starboard
material and has no bearing system at the moment. Plus the fiberglass rod is too small and needs
either a thicker fiberglass rod or a rod of the same diameter, but made from stainless steel. The
duck’s hydraulic shaft also has no bearings to help in system efficiency. Students working on
the system in the future can work on making the hinge more efficient as our current team spent
most of the time in the R&D and actual building of the prototype hinge.
Figure 40: Current Configuration of Hinge
For a proper build of the system that will be used in industry, the hinge will be not only
larger, but also made from an entirely different material. The current material, Starboard, was
only used because of its pliability, its very low coefficient of friction and it being a rigid material
that was also affordable for the current budget. The optimized version of the hinge would be
constructed from steel. Steel is an affordable material that would not wear form the constant
wave action. The steel hinge would weigh significantly more than the current hinge which
would cause a greater pivotal force on the system. With the greater energy from the pivotal force
enacting on the hinge, the force would be directly transferred to the hydraulics, which will allow
for a more efficient yet resistant hydraulic to be put into the hinge. With such a hydraulic, a
greater flow and higher pressure can be achieved with the system that will then be able to drive a
larger Pelton wheel connected to a larger alternator.
44
The size of the hinge all depends on the scale of the system. Normal waves alter around
the world and for the system to be at its peak efficiency it needs to be scaled up or down. The
body of the system can be easily lengthened to accommodate certain wave patterns, scaling the
hinge would alter too many internal components, thus once the full size system’s diameter is
chosen, the hinge size will be optimized around that and not vary between model. Once the size
has been determined, the overall weight of the hinge may greatly exceed buoyancy forces and
certain areas of the hinge would need to be altered. Though, with the system made from a strong
metal versus plastic, the hinge could afford to have hollow areas that the current design does not.
Although, the full size system would also have larger ducks that need a great amount of weight
to set their waterline to its optimal height.
With the steel hinge in place, more bearings could be incorporated into the system that
would increase the efficiency. Currently, only pressed in bearings could be used in the hinge,
but with a steel system, more efficient bearings that could be mounted onto the hinge itself could
be used. This also allows the hinge to be made water tight between the layers, thus eliminated
another possibility of water leaking through the hydraulics mounted to the hinge itself.
Other optimizations of the hinge include the rerouting of the cable and hydraulic hose
being incorporated inside the system. For the current configuration the cable was passed on the
outer radius of the hinge to maximize throw. With a larger hinge, the cable can be made
completely internal, thus eliminating the possibilities of someone being harmed by the cable.
Currently the hydraulic lines run outside of the system to get from one side of the hinge to
another. This is again due to the lack of space and time in the current configuration. The full
sized hinge will have adequate room to hold any hydraulic hose and provide ample room to
prevent any pinching while in motion. Plus, just as the hosing will have a space to pass though
the hinge internally, all of the wiring from the sensors and alternator will also pass through the
hinge.
The current prototype of the hinge is what will be used for creating the patent of the
system, yet will retain this optimization for the final design. More work still needs to be finished
for this system to be sent off to industry. The next phase for the hinge is to create the 3D
working model of the optimized system just described. This current hinge has laid the
groundwork but much more work on this system is required in the future.
45
9.0 Function Decomposition Structure The Blue/Green System can be broken down into three main components: the duck
power generation, the hinge power generation, and the generator power generation.
The diagram in Figure 41 shows the layout of the internal system. Each part is explained
in detail.
Figure 41: Internal System Diagram
For the power extraction of our system, the design involved a hydraulic cylinder mounted
to one side of the joint with the rod coupled to an offset groove in the opposite joint. This allows
for one side of the joint to extract the bending motion of the main body while the other side be
used for the ducks. Our system would use a cable or belting to couple our joint to the hydraulic
cylinder. This would allow a small motion to be amplified via gear ratio modification and be able
to couple the rotation of the joint to the translation of the cylinder rod. This allows for efficient
transfer of energy and greatly frees up internal space for duck energy extraction. Having the
cable travel around the outside of the structure opens up the internal region for development of
duck power take-off components. The cable will be self tensioning and conform to the outer
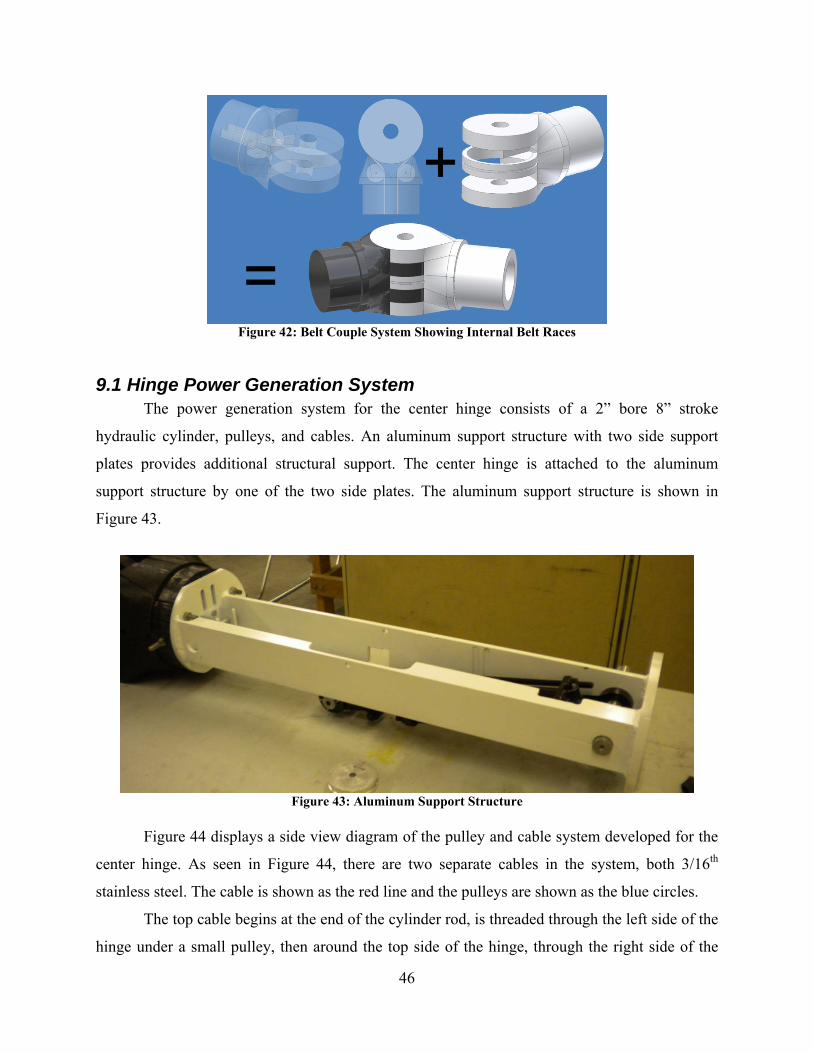
diameter of the device. This method of coupling will be finalized and pursued.
46
Figure 42: Belt Couple System Showing Internal Belt Races
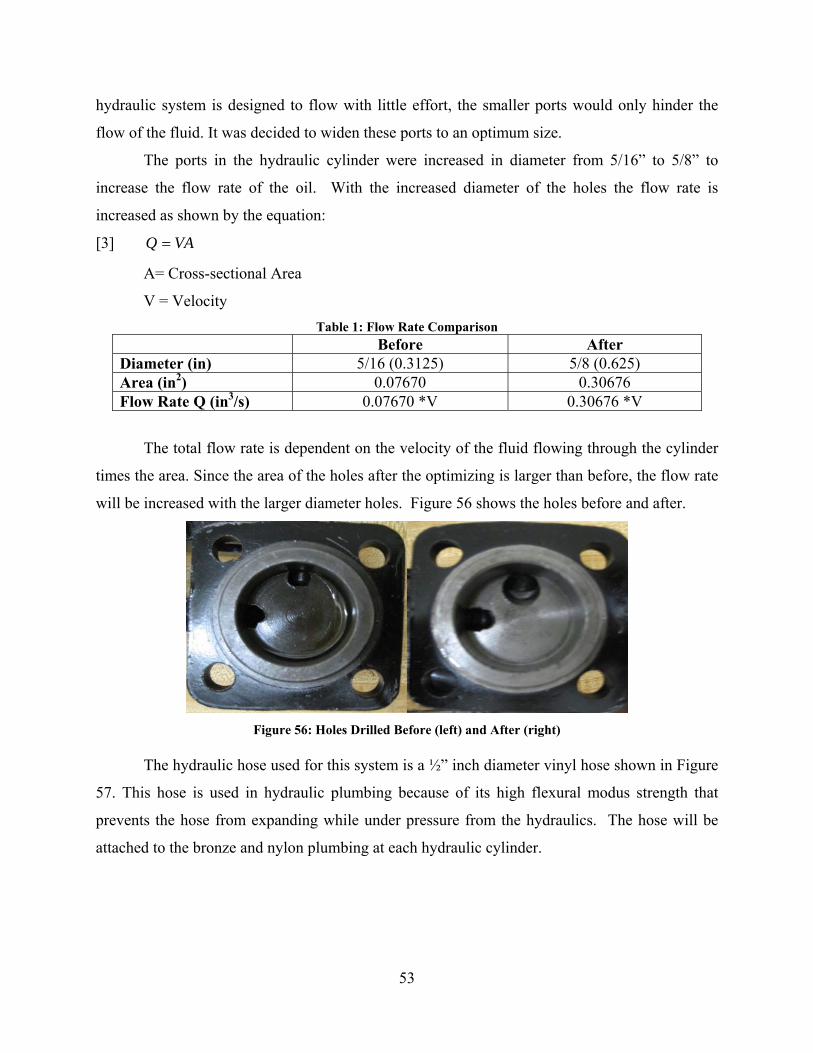
9.1 Hinge Power Generation System The power generation system for the center hinge consists of a 2” bore 8” stroke
hydraulic cylinder, pulleys, and cables. An aluminum support structure with two side support
plates provides additional structural support. The center hinge is attached to the aluminum
support structure by one of the two side plates. The aluminum support structure is shown in
Figure 43.
Figure 43: Aluminum Support Structure
Figure 44 displays a side view diagram of the pulley and cable system developed for the
center hinge. As seen in Figure 44, there are two separate cables in the system, both 3/16th
stainless steel. The cable is shown as the red line and the pulleys are shown as the blue circles.
The top cable begins at the end of the cylinder rod, is threaded through the left side of the
hinge under a small pulley, then around the top side of the hinge, through the right side of the
47
hinge, around a spring loaded tensioner, and then back to the end of the cylinder were it
terminates. This cable is responsible for extending the hydraulic cylinder.
The bottom cable also begins at the end of the hydraulic cylinder rod, however, it
proceeds to the left around a pulley, then through the left side of the hinge, around the bottom,
out the right side of the hinge, through a spring loaded tensioner and then terminates back were it
began. This cable is responsible for retracting the cylinder rod.
Figure 44: Hinge -Cable Drive System
Figure 45: Assembled Hinge-Cable Drive System
48
Figure 46: Constructed Internal System
The cable design allows for the cable to lay in a grove on the plastic hinge without
moving whereby keeping the cable from chewing up the plastic hinge. The grove is shown in
Figure 47. As the hinge moves back and forth, the cable pressure increases and decreases on the
hinge but it does not create a sawing effect.
Figure 47: Grove on the Hinge
Originally, plans for the top cable called for its beginning and end at the left end of the
hinge. The cable would then be threaded around pulleys on the end of the cylinder rod and then
back through the hinge and terminating back at the left end of the hinge. This proved to be
incorrect after our first dry test. With the top cable threaded around an extra pulley, it caused an
imbalance in the pulling rates of the cables. The imbalance caused the hinge to lock up due to
both hinges trying to pull at the same time instead of one tensioning while the other relaxed.
After figuring out our problem we immediately changed to the previously mentioned top cable
set up.
In order to adjust the cable tension on the hinge-cable system we fabricated tensioners.
The tensioners, seen in Figure 48, were made using three inch lengths of one inch diameter
49
aluminum tubing, quarter inch eye bots, washers, and springs. The springs were installed as a
shock absorber for the cable system. The current springs have a stiffness of about 50 lb/in.
Figure 48: Tensioner
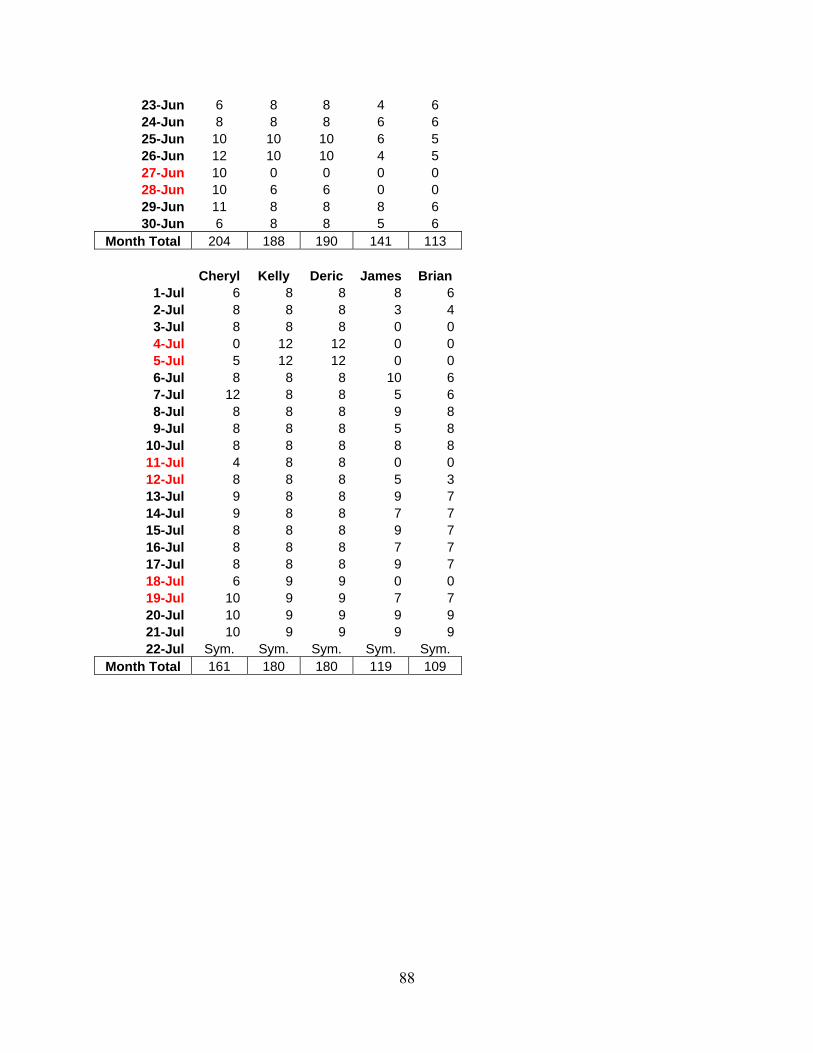
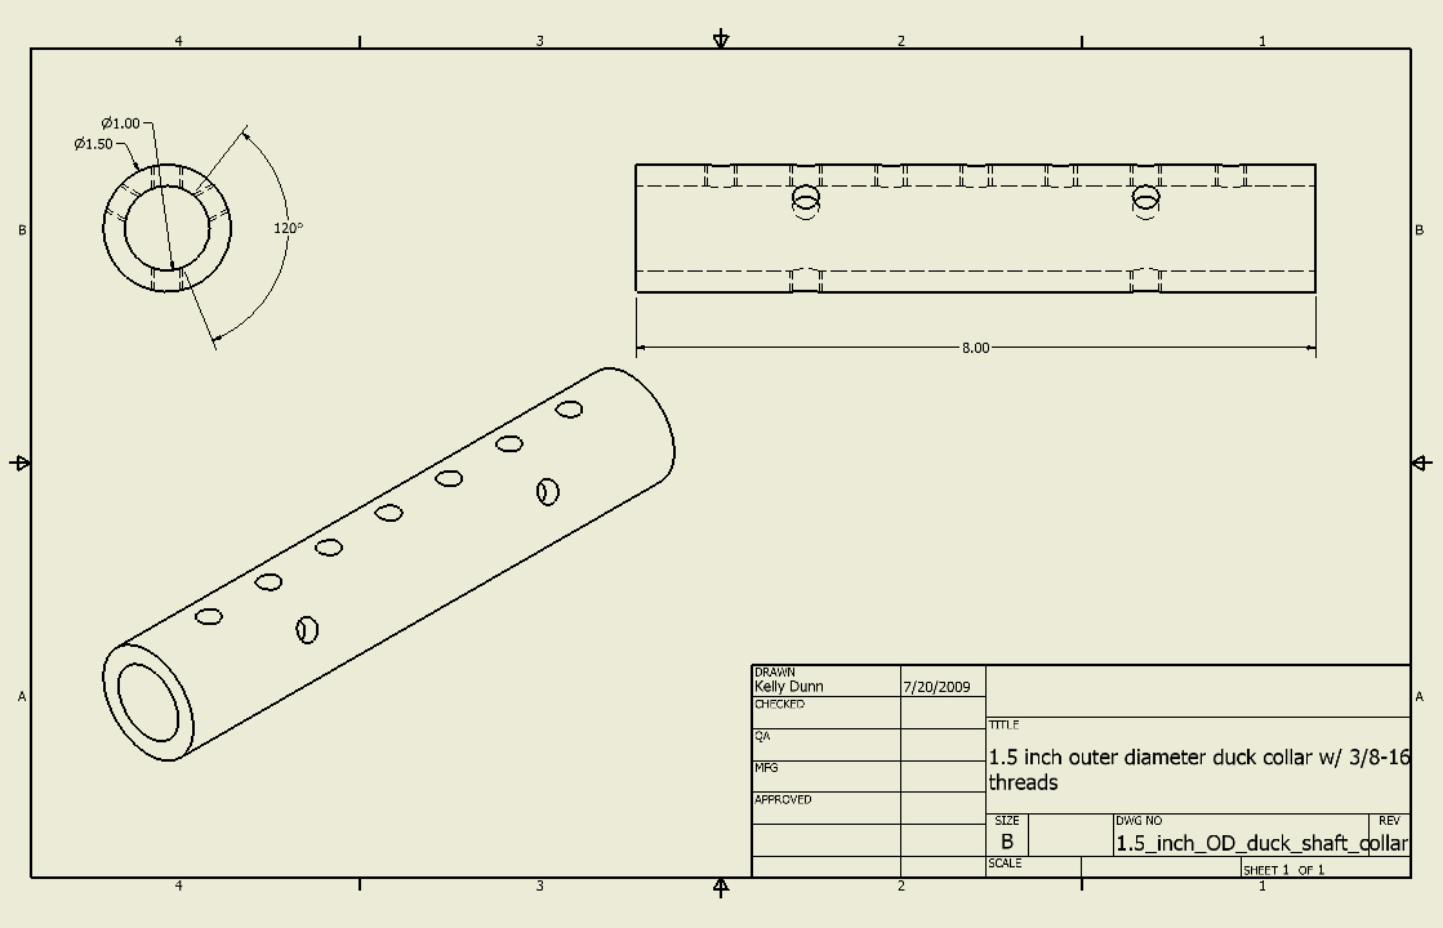
9.2 Salter Duck Power Generation System The Salter Duck power generation system consists of a 3” bore and 6” stroke hydraulic
cylinder, rollers, and a cam. The hydraulic cylinder is attached to aluminum plates to provide
additional support, along with 7/16th threaded rods. One aluminum plate is used to attach the
power generation system to the center hinge. The other aluminum plate contains drilled holes to
allow for plumbing to pass through. The plumbing includes all one way valves, fittings, and T’s
needed for the hosing.
Figure 49: Plumbing for Salter Duck Hydraulic Cylinder
The detailed drawing and photo of the cam system are shown in Figure 50. A cam system
is best suited for the Salter Duck due to its full 360° rotational axis. The Salter Duck is attached
to a fiberglass rod that is inserted through the center hinge. This fiberglass rod has a cam
attached to it. The cam is located in the hollow cavity within the center hinge. The cam is shown
in Figure 51. The cam is constructed from a 4 inch diameter round stock brass. A 1” diameter
50
hole was drilled ½” from the outer diameter of the brass. The cam will move as the Salter Ducks
nod with the wave motion. This causes the cam to push against the rod of the hydraulic cylinder.
The hydraulic cylinder rod is flattened to fit two rollers as shown in Figure 52. With the pushing
of the hydraulic cylinder rod, the hydraulic fluid is pumped into the plumbing. As the ducks
rotate back and forth the cam will apply force on the rod and pump the working fluid through the
system.
Figure 50: Cam System
Figure 51: Cam
Figure 52: Fiberglass Rod Used to Push Cam
51
A difficult component of cam systems is the return spring. Since a spring requires work
to deform, this system raises the minimum wave energy requirement. A solution that mediates
the need for a spring is to bleed 5 psi from a separate accumulator into the back chamber of the
cylinder forcing the rod back out slowly. This separate accumulator is an expansion chamber
and runs off one atmosphere of fluid. As the other half of the cylinder is moved back and forth
by the wave forces and constant 5 psi, the expansion chamber expands and contracts with
hydraulic fluid. The rubber insert of the expansion chamber is made from a bicycle tube and
PVC housing.
Figure 53: The Rubber Insert of the Expansion Chamber
A pressure regulator is used to maintain high pressure in the Pelton wheel line. The
pressure regulators will be located within the plumbing of the expansion tank and the Pelton
wheel. A Milton heavy duty pressure regulator was purchased with a 2/8” N.P.T. The 2”
pressure gauge is from Northern Industrial and has a working range of 0-200 PSI.
Another pressure regulator is used in line from the Duck hydraulics to the high pressure
line. This regulator sends a constant 5 psi to the Duck hydraulic which will be used to reset the
duck after a wave has recently rotated it.
52
Figure 54: Pressure Regulator with Pressure Gauge
9.3 Hydraulic Oil Flow Optimization
The current hydraulic cylinders used on the Blue/Green System were too long for the
design. There was a size constraint on the PVC body, so the cylinders had to be cut down 1.5”
for fitting purposes. This allowed for the original heat treated hardened steel rods to be used for
clamping the hydraulics together without having to purchase a new rod. To accomplish this
work, the hydraulics were disassembled and the cylinder was run on the lathe to cut an extra 1.5”
off of the overall length and tapered at the end seen in Figure 55. Oil was used to prevent a warp
on the cylinder.
Figure 55: The hydraulic cylinder being cut on the lathe
When the hydraulics were disassembled, it was discovered that the hydraulics’ internal
inlets and outlets cross sectional area was far less than their external 5/8” fittings. Since the
53
hydraulic system is designed to flow with little effort, the smaller ports would only hinder the
flow of the fluid. It was decided to widen these ports to an optimum size.
The ports in the hydraulic cylinder were increased in diameter from 5/16” to 5/8” to
increase the flow rate of the oil. With the increased diameter of the holes the flow rate is
increased as shown by the equation:
[3] VAQ =
A= Cross-sectional Area
V = Velocity Table 1: Flow Rate Comparison
Before After Diameter (in) 5/16 (0.3125) 5/8 (0.625) Area (in2) 0.07670 0.30676 Flow Rate Q (in3/s) 0.07670 *V 0.30676 *V
The total flow rate is dependent on the velocity of the fluid flowing through the cylinder
times the area. Since the area of the holes after the optimizing is larger than before, the flow rate
will be increased with the larger diameter holes. Figure 56 shows the holes before and after.
Figure 56: Holes Drilled Before (left) and After (right)
The hydraulic hose used for this system is a ½” inch diameter vinyl hose shown in Figure
57. This hose is used in hydraulic plumbing because of its high flexural modus strength that
prevents the hose from expanding while under pressure from the hydraulics. The hose will be
attached to the bronze and nylon plumbing at each hydraulic cylinder.
54
Figure 57: Hydraulic Hose
The hydraulic hose will be used to interconnect both hydraulic cylinders by moving
around the outside of the hinge. Both low and high pressure hoses from the hinge pulley and
cable system will extend out of the PVC body section, around the hinge, and back to the PVC
body section to meet up with the plumbing of the cam system of the Salter Duck. The high
pressure hose will also travel out of the main body to the accumulator/expansion tank on the
hinge and pulley half of the system. On the Salter Duck half of the system the high and low
pressure hoses will exit the main body and reenter next to the Pelton wheel.
The hydraulic fluid for this device is Traveller All Season Hydraulic Oil ISO V6 46 (SAE
20 equivalent). Two containers were purchased at 2 gallons each. This particular hydraulic oil
protects against rust, corrosion, foaming, and oxidation. Since the hydraulic fluid drives the
Pelton wheel in air, high foaming could occur. If too much foaming enters the system, the low
pressure draw line on the bottom of the collection chamber would suck air into the system
causing a loss in fluid velocity due to air compression.
Figure 58: Hydraulic Oil
55
9.4 Expansion Tank Our internal hydraulic system design uses a water expansion tank; the tank serves as an
accumulator for the hydraulic fluid. The expansion tank is required to linearize the intermittently
absorbed fluctuations. The tank was purchased from Grainger and has a maximum capacity of
2.1 gallons and contains a pre-charge pressure of 12 psi. It has a maximum working pressure of
100 psi but our design will have low pressures of about 40 psi maximum. The tank dimensions
are: height 12.5 inches and a diameter of 8 inches. The inlet/outlet connection is a standard NPT
1/2 inch male connection.
Figure 59: Expansion tank
56
9.5 Pelton Wheel and Alternator Housing
Figure 60: Pelton Wheel Housing
9.5.1 Introduction The Blue/Green Energy System converts the wave energy into rotational energy into
electricity by means of a Pelton wheel. The Pelton Wheel or Impulse Turbine is one of the most
efficient means of converting a high pressure head into rotational energy. The wheel is 30-100%
efficient of the maximum discharge of a single jet configuration, and 10-100% efficient for a
multi jet turbine (Pensche 2004.) For our current prototype, we worked on developing a single
jet turbine due to budget and size constraints. Many design implications were developed for our
project before the one shown in Figure 60 was chosen. The previous designs before the ones
chosen were disregarded due to size constraints and complexity. In the final version of the build,
the previous design will be reconfigured back into the overall scheme of the Pelton Wheel
housing.
9.5.2 Theory The design for the Blue/Green Energy system will be using hydraulic oil versus water
which will affect the density based calculations. The hydraulic energy of the system is defined
by the equation below from Pensche (2004):
57
[4]
= Specific Hydraulic Energy of the device
= Fluid Density
= Pressure at section x
= Water Velocity in section x
= Elevation of the section x
Note: The subscripts 1 and 2 in the above equation represent the upstream and
downstream measurement section of the turbine respectively and are defined by the IEC
standards. Using the equation, the head of the turbine can be measured converting the equation
19.2 MATLAB Programming Code clear all; clc; h=16.25; data=load('Wave_buoy_data08newest.dat'); H=data(:,9); %Wave heights based on NDBC data T=data(:,11); rho=1025; g=9.81; [a,b]=max(data); max_WH=a(9); max_WH_row=b(9); max_WH_period=data(max_WH_row,11); disp(['Max Wave Height (m)=' num2str(max_WH)]); disp(['Period of Max Wave Height (s)=' num2str(max_WH_period)]); for i=1:length(T) [k(i),L(i)]=newton_lin_disp(T(i),h); end avg_k=sum(k)/length(k); avg_L=sum(L)/length(L); disp(['Average Wavelength (m)=' num2str(avg_L)]); L=L'; C=L./T; avg_T=sum(T)/length(T); disp(['Average Period (s)=' num2str(avg_T)]); avg_H=sum(H)/length(H); disp(['Average Wave Height (m)=' num2str(avg_H)]); E=(1/8)*rho*g*(H.^2); %Wave energy per unit area [J/m^2] e=sum(E); avg_E=e/length(E); %average wave energy per unit area per year disp(['Average Wave Energy (J/m^2)=' num2str(avg_E)]); for j=1:length(k) n(j)=(.5)*(1+(2*k(j)*h)/(sinh(2*k(j)*h))); end n=n'; Ef=E.*C.*n; avg_Ef=sum(Ef)/length(Ef); disp(['Average Wave Energy Flux (W/m)=' num2str(avg_Ef)]); %P=((rho*g^2)/(64*pi))*((H^2)*T)
90
19.3 MATLAB Programming Function function [k,L]=newton_lin_disp(T,h) k0=1; tol=.00001; g=9.81; i=1; No=30; while i<=No; k=k0-(g*k0*tanh(k0*h)-(2*pi/T)^2)/(g*tanh(k0*h)+g*k0*h*(1-(tanh(k0*h)^2))); i=i+1; k0=k; end %disp(['k=' num2str(k)]); L=(2*pi)/k;
19.4 Wave Force Calculations Given Data h (m) 16.15 ν (m2/s) 1.19E‐06
g (m/s2) 9.81 A (m2) 0.070686
σ 0.8812 V (m3) 0.070686
ρ 1030 u (m/s) 1.511595z (m) 1 du/dt (m/s2) 1.332067
Duck D (m) 0.3 Reynolds Number 3.82E+05Cylinder D (m) 0.2 Kc 35.92559CD 0.6 CM 1.75
Maximum for 2008 Hurricane Frances
H (m) 3.31 H(m) 7.33 T (s) 7.13 T (s) 8.44 L (m) 70.82 L(m) 90.25 K 0.0887 K 0.06962