72
TRANSPARENCY INTERNATIONAL E.V. FINANCIAL STATEMENTS FOR THE YEAR ENDED 31 DECEMBER 2019

TRANSPARENCY INTERNATIONAL E.V. FINANCIAL STATEMENTS FOR THE YEAR ENDED 31 DECEMBER 2019

Transparency International is a global movement with one vision: a world in which government, business, civil society and the daily lives of people are free of corruption. Through more than 100 chapters worldwide and an international secretariat in Berlin, we are leading the fight against corruption to turn this vision into reality.
© 2020 Transparency International. All rights reserved.

TABLE OF CONTENTS TABLE OF CONTENTS .................................................................................................................................. 1
GENERAL INFORMATION ............................................................................................................................ 2
MANAGING DIRECTOR’S REPORT ............................................................................................................. 4
AUDIT REPORT ........................................................................................................................................... 10
CONSOLIDATED STATEMENT OF FINANCIAL POSITION ....................................................................... 13
CONSOLIDATED STATEMENT OF COMPREHENSIVE INCOME ............................................................. 14
CONSOLIDATED STATEMENT OF CHANGES IN RESERVES ................................................................. 15
CONSOLIDATED STATEMENT OF CASH FLOWS .................................................................................... 16
NOTES ......................................................................................................................................................... 17
ANNEXES ..................................................................................................................................................... 50

2 GENERAL INFORMATION FOR THE YEAR ENDED 31 DECEMBER 2019
GENERAL INFORMATION Board of Directors: NAME COUNTRY NOTES
Delia Ferreira Rubio Argentina
Rueben Lifuka Zambia
Robert Barrington United Kindgom Until Nov. 2019
A.J. Brown Australia
Boris Divjak Bosnia and Herzegovina Until Nov. 2019
Karen Hussmann Germany
Samuel Kimeu Kenya
David Ondráčka Czech Republic
Oya Özarslan Turkey
Kol Preap Cambodia
Alberto Precht Rorris Chile
Natalia Soebagjo Indonesia Until Nov. 2019
François Valerián France Elected Nov. 2019
Eka Gigauri Georgia Elected Nov. 2019
Linda Ofori-Kwafo Ghana Elected Nov. 2019

3 GENERAL INFORMATION FOR THE YEAR ENDED 31 DECEMBER 2019
Managing Director: Daniel Eriksson
Address: Alt Moabit 96 10559 Berlin Germany Tel: +49 - 30 - 34 38 20 0 Fax: +49 - 30 - 34 70 39 12 email: [email protected] website: www.transparency.org
Registration: Registration office: Amtsgericht Charlottenburg Registration number: VR 13598 B Date of latest change: 19/06/2018
Tax registration:
Registration office: Finanzamt für Körperschaften I Tax number: 27/678/51105 Date of latest triennial exemption: 19/12/2019 Value Added Tax (VAT) identification number: DE273612486
Auditors:
Mazars GmbH & Co.KG Wirtschaftsprüfungsgesellschaft Steuerberatungsgesellschaft Alt-Moabit 2 10557 Berlin Germany
Banks:
Commerzbank AG Theodor-Heuss-Platz 6 10877 Berlin Germany
Deutsche Bank AG Unter den Linden 13/15 10117 Berlin Germany
Bank of America NA 100 North Tryon Street Charlotte, NC 28255 United States KBC Bank Avenue Marnix 31 1000 Brussels Belgium
4 MANAGING DIRECTOR’S REPORT FOR THE YEAR ENDED 31 DECEMBER 2019
MANAGING DIRECTOR’S REPORT FOR THE YEAR ENDED 31 DECEMBER 2019
The Managing Director presents the annual report on the affairs of Transparency International e.V. for the year ended 31 December 2019.
GOVERNANCE STRUCTURE
The TI Movement Transparency International (TI) is an unincorporated, international coalition, which has the objective to stop corruption and promote transparency, accountability and integrity at all levels and across all sectors of society. The TI movement consists of more than 100 National Chapters, Chapters in Formation and National Contacts in different countries throughout the world and an international Secretariat in Berlin. Additionally, the movement comprises Transparency International Liaison Office to the European Union (TI-EU), based in Brussels, and Friends of Transparency International (FOTI) based in New York. The Secretariat, TI-EU and FOTI present their accounts on a consolidated basis and are collectively referred to as TI-S in this report . All other movement entities are referred to as coalition partners.
TI-Secretariat Transparency International e.V. (the Secretariat) is an incorporated membership association registered in Berlin and recognised as being exempt from income tax in Germany. Its governing document is the Charter of Transparency International.
The members of the association comprise individuals and independent entities. Individual Members are the funders of the organization. Independent entities are awarded the “National Chapter” status through a formal accreditation process. Members have voting rights at Membership Meetings.
Representatives of National Chapters and Individual Members meet on an annual basis at the Annual Membership Meeting (AMM) to learn from each other, coordinate their activities, hold the Board of Directors to account and elect new Board members. The Board is comprised of twelve members who are elected for a three-year term and hold the Secretariat to account, including by review and approval of its budget. The Board has several committees, including the Finance and the Risk and Audit Committees, which advise the Board on financial matters.
The Secretariat’s operations are led by the Managing Director, who has registered power of attorney for the organisation. The Managing Director is appointed by the Chair and the Vice-Chair, with approval by the Board of Directors and reports to it.
5 MANAGING DIRECTOR’S REPORT FOR THE YEAR ENDED 31 DECEMBER 2019
OBJECTIVES AND ACTIVITIES
Overview In line with the TI Charter, the main objective of TI-S is “to take action to combat corruption and prevent criminal activities arising from corruption so as to help build a world in which government, politics, business, civil society and the daily lives of people are free of corruption, because of the potential of corruption to undermine economic development, generate poverty, foster political instability and create global insecurity”.
In particular, this is done by:
• Raising public awareness of the occurrence and impact of corruption; • Developing coalitions to address it; • Developing and disseminating tools to curb it; • Promoting transparency and accountability in politics and business; • Monitoring the control of corruption; and • Supporting institutions and mechanisms to combat it.
2019 Achievements and Impacts
To harness public outrage against corruption, strengthen democracy and address key corruption issues, we made significant progress with our work as looked through the priority areas set by our 2020-strategy: people and partners; prevention, enforcement and justice; and a strong movement.
TI engaged, empowered and protected people and partners. Advocacy and Legal Advice Centres (ALACs) enabled citizens to pursue corruption complaints and strategically litigated around issues they raised. Our movement made it safer for citizens to blow the whistle and empowered activists to tackle corruption on issues such as land rights, public procurement and gendered forms of corruption. New and existing partnerships delivered on anti-corruption priorities.
To ensure prevention, enforcement and justice, TI assessed numerous countries’ anti-corruption frameworks and worked with them and international organisations to address weaknesses. TI also identified shortcomings in justice systems and supported strategic cross-border cases to expose and prosecute corruption.
Transparency International continued to strengthen its global network of anti-corruption experts. To do this we developed our understanding of corruption and how to stop it, and shared knowledge. We coordinated our national, regional and global activities and ensured sustainability through strong partnerships, and skills- and capacity-building. We also brought our movement together to strategise on key contemporary corruption trends and wider integrity issues.
To ensure consistency and focus of our advocacy work, we used our movement’s expertise and resources on two key areas: dirty money and political integrity. Dirty money work focused on the systems, actors and methods that facilitate the transactions, transfers and investments stemming from corrupt deals. Political integrity looked at the legislative, policy and enforcement gaps that hinder transparency and accountability in political decision-making processes.
In both these areas, a significant number of Chapters across regions developed expertise, policy messaging and research analysis, and successfully engaged decision-makers to drive initial change. Throughout 2019, the Secretariat convened Chapters to more closely coordinate and further develop these areas of work.

6 MANAGING DIRECTOR’S REPORT FOR THE YEAR ENDED 31 DECEMBER 2019
Our work resulted in a number of tangible achievements, that are being described in more detailed as part of TI Annual Report. The below key outcomes give a sense of our global impact during the past year:
• Following sustained pressure and expert guidance from Transparency International, the European Union (EU) adopted a directive on whistleblower protection in October 2019. Many of our recommendations were included in the agreed text.
• For the first time, our Global Corruption Barometer included gender-specific questions that revealed the impact of corruption on women in Latin America, the Caribbean, the Middle East and North Africa.
• Transparency International secured an appraisal of recommendations on beneficial ownership transparency in the Financial Action Task Force’s (FATF) strategic review. FATF is a global inter-governmental anti-money laundering standard setter.
• 3.36 million people visited the Transparency International website to learn more about corruption and how to stop it.
• We ensured that the European Commission’s supranational risk assessment report identified the golden visa industry as a sector that poses money laundering and terrorist financing risks to the EU. It will now be monitored.
• Our Advocacy and Legal Advice Centres in 58 countries provided free and confidential legal advice to witnesses and victims of corruption. Mobile centres in Latin America and Sub-Saharan Africa travelled to hard-to-reach communities to receive citizens’ complaints.
Plans for the Future
Transparency International is getting ready for the next decade. Our current strategic cycle ends by the end of 2020 and as the largest anti-corruption Movement in the world, we will aim to continue being ahead of the curve when it comes to fighting corruption worldwide. In 2019, we conducted a comprehensive research into the trends that are likely to affect the global socio-political and economic environment and therefore the very manifestations of corruption in different settings.
The Covid-19 crisis, however, shifted global trends in ways that have a strong influence on TI’s work. The need for transparency and accountability have rarely been more important: leaders must act and allocate funds openly and with integrity to keep people safe from the virus and ensure those infected get adequate health care. Corruption cannot take people’s lives, but neither can corrupt leaders use the crisis to weaken democracy. As such, TI is acting promptly to monitor the development of the Covid-19 crisis and act swiftly as needed to ensure that the key principles we stand for are preserved during these exceptional times.
Meanwhile, our strategy development process is in full swing and will entail considerable consultation with both internal and external stakeholders. The final Strategy will be presented to the Movement at our Annual Membership Meeting (AMM) 2020.
In preparation for the strategy implementation, TI-S will sustain our successful work around the two global advocacy priorities - political integrity and dirty money - supported by our two flagship products – Corruption Perceptions Index (CPI) & Global Corruption Barometer (GCB); will enhance our relationships within the Movement; and will strengthen our own organisational development.
Our main expected achievements this year are a global coalition for clean politics, the establishment of a dirty money expert group, the launch of a report on the role of banks in cross-border corruption cases, as well as to scale up our Integrity Pact (IP) approach to other geographical areas.
We will also actively participate in all major global and regional events (UN, Open Governance Partnership, G20, IMF, CoE, OECD, World Bank) to influence agendas and enable change at the global level. More concretely, this implies:
7 MANAGING DIRECTOR’S REPORT FOR THE YEAR ENDED 31 DECEMBER 2019
• maintaining our thematic leadership within OGP; • strengthening beneficial ownership frameworks at FATF and IMF; • advocating for an EU anti-money laundering body; • laying the ground for TI to access and influence at UNGASS 2021; • advocating for stronger OECD enforcement of foreign bribery; • pushing for increased scrutiny and control of golden visa schemes in the EU; • advocating for anti-corruption SDG commitments at the UN HLPF; • achieving greater openness by major bodies, companies, and business and professional
associations to discuss political integrity issues in particular political finance.
We further want to maintain our work on whistle-blower protection, grand corruption, SDGs, climate governance integrity and strengthen our partnerships with other NGOs and civil society organisations to advocate for an open civil society space, using the G20 in Saudi Arabia as a starting point.
We will maximize opportunities for policy development and enforcement at the national level through deepened collaboration with investigative journalists, building relationships with law enforcement, direct advocacy towards authorities, and greater engagement with the private sector.
An important part of our work is building a stronger Movement. In 2020, we will continue working on strengthening the Movement, beginning with the implementation of the governance changes approved at the 2019 AMM. Additionally, we are continuously working on a stronger cooperation across regions through institutional network development initiatives, a consistent approach to campaigning and joint programming through and beyond the TI-S coordinated projects. Key to these network building and development efforts are our flagship products GCB and CPI that create a common narrative and provide the space for a unified global voice. To sustain this global voice, in 2020 we commit to tackling the growing threat to the civic space and hence to the work of some of our Chapters and other anti-corruption activists. We are currently working on an action plan to better support our Chapters grappling with these issues. Our regional meeting will be important learning spaces for exchanging on these and other matters, and for amplifying the voice of anti-corruption activists and efforts at the regional level.
We also want to achieve better alignment of our communications, advocacy, and fundraising support to the Movement. A highlight will be our new website and accompanying content strategy with audience analysis to support advocacy and fundraising priorities. In addition, to strengthen our internal communication and information sharing we will rollout the software suite Salesforce. Salesforce will support more effective project and event management, as well as strengthen effectiveness in other areas of our work, from fundraising to monitoring, evaluation and learning.
Further, we firmly believe that our organisation is only as strong as the sum of our staff. Therefore, we will rollout a new HR framework that will include a new recruitment strategy and a performance management framework. We will also perform an organisational cultural audit, implement a number of staff engagement initiatives, and continue with our leadership training programme.
Beyond these strategic and operational priorities, we further want to minimise our environmental impact. The creation of a new environmental policy and carbon footprint tracking and reduction will be key in minimising the environmental impact of our work.
Overall, our operational plan for 2020 will allow us to sustain and advance the achievements of the past and strengthen our Movement to be ready for the corruption challenges of the future.
8 MANAGING DIRECTOR’S REPORT FOR THE YEAR ENDED 31 DECEMBER 2019
RISK MANAGEMENT The Board has ultimate responsibility for risk management and to ensure that there are structures and processes in place for the effective management of risk. Responsibility for risk oversight has been delegated to the Risk and Audit Committee, which reports and provides advice regularly to the Board.
The Secretariat’s risk management infrastructure has been overhauled in 2017, through the adoption of an internationally established framework, the COSO1, and through the compilation of a revised risk register. The risk register takes into account internal assessments as well as the results of evaluations performed by external reviewers. The main areas of focus of the risk register are Governance, Strategy and reputation, Financial sustainability, Organizational model, Data security, Personal security and Brand integrity.
The Risk and Audit Committee has reviewed the risk management policy and the current risk register, and considers that they are sufficient to ensure that major risks are identified and systems are established to manage them. The Risk and Audit Committee receives quarterly updates on risk management, and on an annual basis reviews risk management systems and processes.
FINANCIAL REVIEW
Results review In 2019, the income of TI-S was €25,840,700, increased from prior year by €2,168,765 or 9.2% on a consolidated basis and by €2,238,898 or 9.9% for the Secretariat.
Restricted income increased by €832,790 or 4% compared to 2018 due to increased budget availability on certain projects which are approaching their final stage, when more activities are performed and reported.
After reinforcing their capacity to deliver on projects in 2018, in 2019 TI-S strengthened their core structure, resulting in a higher utilization of unrestricted income, which increased by €1,612,725 or 55% on a consolidated basis and €1,576,028 or 58% for the Secretariat.
Operating expenditure increased by €2,593,605 or 11.1% on a consolidated basis and €2,776,268 or 12.4% for the Secretariat only. This is predominantly a result of higher transfers to the movement, which increased by €2,484,579 or 24% on a consolidated basis (€2,584,388 or 24% for the Secretariat). Transfers to the movement have consistently grown in the past three years reaching a value of €12,821,779 on a consolidated basis (€13,159,271 for the Secretariat), which is the highest level in TI history and 49% of the overall expenditure of TI-S.
Staff costs increased by €535,667 or 7% on a consolidated basis (€525,611 or 8% for the Secretariat) as a result of the stabilization of the internal structure in Berlin. Other expenses decreased by €653,956 or 12% on a consolidated basis: half of the decrease is due to the reclassication of rental cost as depreciation and amortization, as a consequence of the implementation of a new accounting standard, IFRS 16. The remaining €318,756 decrease results from the combined effect of increased costs for consultancies and reduced expenditure on conferences and workshops. Consultancy costs funded a number of internal reviews and trainings; conference costs decreased due to the International Anti-Corruption Conference, which took place in Denmark in 2018, being organized on bi-yearly basis.
1 Committee of Sponsoring Organisations of the Tradeway Commission

9 MANAGING DIRECTOR’S REPORT FOR THE YEAR ENDED 31 DECEMBER 2019
The financial results present a gain of €459,525 on a consolidated basis (€482,190 for the Secretariat) due
to the accounting gains realized by the security portfolio held by the organization.
Reserves policy
The reserves policy approved by the Finance Committee has set a target for the total reserves as between
three and six months of total adjusted operating expenses plus commitments. The current level of reserves,
at €4,167,257 is above the minimum target and corresponds to approximately 3 months of adjusted
expenditure plus commitments.
Going Concern
No material uncertainties that cast significant doubt about the ability of TI-S to continue as a going concern
have been identified by management.
FINANCIAL STATEMENTS
TI-S presents the financial statements voluntarily. The decision to apply International Financial Reporting
Standards (IFRS) as adopted by the EU was first applied in 2007 in keeping with our core values and to
serve as a leader in terms of accountability, transparency and credibility.
Auditors
Mazars GmbH & Co. KG were appointed to audit the Financial Statements as of 31 December 2019.
27 May 2020
Daniel Eriksson
Managing Director
10 AUDIT REPORT FOR THE YEAR ENDED 31 DECEMBER 2019
AUDIT REPORT INDEPENDENT AUDITOR'S REPORT
To Transparency International e.V., Berlin
Opinion
We have audited the consolidated financial statements of Transparency International e.V., Berlin Group (referred to as “Association”), which comprise the Consolidated Statement of Financial Position as at December 31, 2019, the Consolidated Statement of Comprehensive Income, the Consolidated Statement of Changes in Reserves, the Consolidated Statement of Cash Flows for the year then ended and Notes to the Financial Statements, including a summary of significant accounting principles.
In our opinion, the accompanying consolidated financial statements give a true and fair view of the financial position of Transparency International e.V., Berlin, Group as at December 31, 2019, and of its financial performance and its cash flows for the year then ended in accordance with the International Financial Reporting Standards (IFRSs), as adopted by the EU.
Basis for Opinion
We conducted our audit in accordance with International Standards on Auditing (ISAs). Our responsibilities under those standards are further described in the Auditor’s Responsibilities for the Audit of the Financial Statements section of our report. We are independent of the Association within the meaning of the IESBA’s Code Of Ethics and have fulfilled our other responsibilities in accordance with these requirements. We believe that the audit evidence we have obtained is sufficient and appropriate to provide a basis for our opinion.
Responsibilities of Management and Those Charged with Governance for the Financial Statements
Management is responsible for the preparation of the consolidated financial statements in accordance with IFRS and for such internal control as management determines is necessary to enable the preparation of financial statements that are free from material misstatement, whether due to fraud or error.
In preparing the consolidated financial statements, management is responsible for assessing the Association’s ability to continue as a going concern, disclosing, as applicable, matters related to going concern and using the going concern basis of accounting unless management either intends to liquidate the Association or to cease operations, or has no realistic alternative but to do so.

11 AUDIT REPORT FOR THE YEAR ENDED 31 DECEMBER 2019
Those charged with governance are responsible for overseeing the Association’s financial reporting process.
Auditor’s Responsibilities for the Audit of the Financial Statements
Our objectives are to obtain reasonable assurance about whether the consolidated financial statements as a whole are free from material misstatement, whether due to fraud or error, and to issue an auditor’s report that includes our opinion. Reasonable assurance is a high level of assurance, but is not a guarantee that an audit conducted in accordance with ISAs will always detect a material misstatement when it exists. Misstatements can arise from fraud or error and are considered material if, individually or in the aggregate, they could reasonably be expected to influence the economic decisions of users taken on the basis of these consolidated financial statements.
As part of an audit in accordance with ISAs, we exercise professional judgment and maintain professional skepticism throughout the audit. We also:
• Identify and assess the risks of material misstatement of the consolidated financial statements, whether due to fraud or error, design and perform audit procedures responsive to those risks, and obtain audit evidence that is sufficient and appropriate to provide a basis for our opinion. The risk of not detecting a material misstatement resulting from fraud is higher than for one resulting from error, as fraud may involve collusion, forgery, intentional omissions, misrepresentations, or the override of internal control.
• Obtain an understanding of internal control relevant to the audit in order to design audit procedures that are appropriate in the circumstances, but not for the purpose of expressing an opinion on the effectiveness of the Association’s internal control.
• Evaluate the appropriateness of accounting policies used and the reasonableness of accounting estimates and related disclosures made by management.
• Conclude on the appropriateness of management’s use of the going concern basis of accounting and, based on the audit evidence obtained, whether a material uncertainty exists related to events or conditions that may cast significant doubt on the Association’s ability to continue as a going concern. If we conclude that a material uncertainty exists, we are required to draw attention in our auditor’s report to the related disclosures in the consolidated financial statements or, if such disclosures are inadequate, to modify our opinion. Our conclusions are based on the audit evidence obtained up to the date of our auditor’s report. However, future events or conditions may cause the Association to cease to continue as a going concern.
We communicate with those charged with governance regarding, among other matters, the planned scope and timing of the audit and significant audit findings, including any significant deficiencies in internal control that we identify during our audit.
12 AUDIT REPORT FOR THE YEAR ENDED 31 DECEMBER 2019
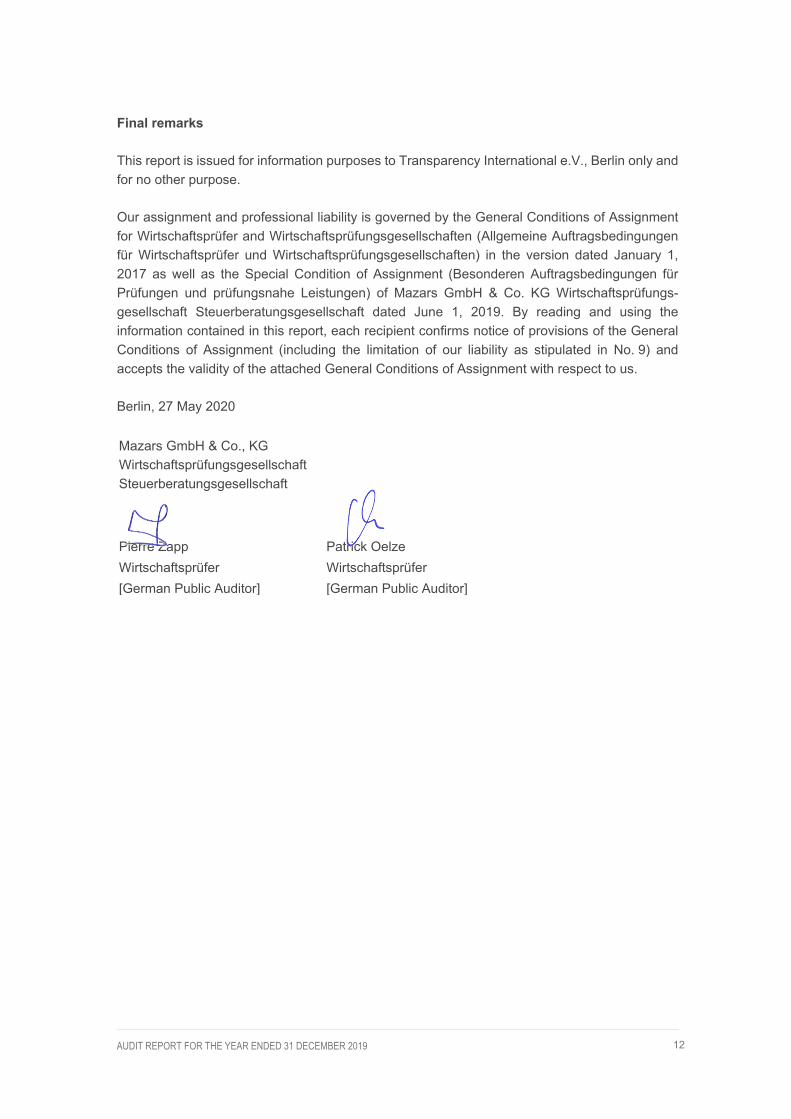
Final remarks
This report is issued for information purposes to Transparency International e.V., Berlin only and for no other purpose.
Our assignment and professional liability is governed by the General Conditions of Assignment for Wirtschaftsprüfer and Wirtschaftsprüfungsgesellschaften (Allgemeine Auftragsbedingungen für Wirtschaftsprüfer und Wirtschaftsprüfungsgesellschaften) in the version dated January 1, 2017 as well as the Special Condition of Assignment (Besonderen Auftragsbedingungen für Prüfungen und prüfungsnahe Leistungen) of Mazars GmbH & Co. KG Wirtschaftsprüfungs-gesellschaft Steuerberatungsgesellschaft dated June 1, 2019. By reading and using the information contained in this report, each recipient confirms notice of provisions of the General Conditions of Assignment (including the limitation of our liability as stipulated in No. 9) and accepts the validity of the attached General Conditions of Assignment with respect to us.
Berlin, 27 May 2020
Mazars GmbH & Co., KG Wirtschaftsprüfungsgesellschaft Steuerberatungsgesellschaft
Pierre Zapp Patrick Oelze Wirtschaftsprüfer Wirtschaftsprüfer [German Public Auditor] [German Public Auditor]

13 FINANCIAL STATEMENTS AS OF 31 DECEMBER 2019
Consolidated Statement of Financial Position ASSETS Notesall amounts are stated in Euros
Current AssetsCash and cash equivalents 3 12,114,848 13,904,865
Accounts receivable 1,865,645 1,507,984 Debtors 4 154,165 255,641 Accrued income 5 1,711,480 1,252,343
Advances to project partners 6 1,469,338 2,720,698
Other current assets 7 203,689 110,378
Current Assets, total 15,653,520 18,243,925
Non Current AssetsIntangible assets 8 24,490 22,204 Tangible assets 8 59,648 28,938 Right of use assets 8 1,788,975 - Investments 9 4,022,236 3,544,207 Other f inancial assets 9 88,211 88,211
Non Current Assets, total 5,983,560 3,683,560
Assets, total 21,637,080 21,927,485
LIABILITIES AND RESERVES Notesall amounts are stated in Euros
Current LiabilitiesAccounts payable 2,049,379 1,015,308
Liabilities to project partners 10 1,312,488 334,660 Liabilities to suppliers 11 736,891 680,648
Other current liabilities 12 558,947 654,741
Lease liabilities,current 13 273,996 -
Deferred income, current 14 8,873,785 12,159,009
Current Liabilities, total 11,756,107 13,829,058
Non Current LiabilitiesLease liabilities, non current 13 1,963,579 - Deferred income, non current 15 3,717,933 3,717,933 Other non current liabilities 9 1,250 1,250 Provisions 16 30,954 53,642
Non Current Liabilities, total 5,713,716 3,772,825
Reserves 17 4,167,257 4,325,602
Liabilities and Reserves, total 21,637,080 21,927,485 The notes on pages 16 to 48 form part of these f inancial statements
31 December 2018
31 December 2019 31 December 2018
31 December 2019
14 FINANCIAL STATEMENTS AS OF 31 DECEMBER 2019
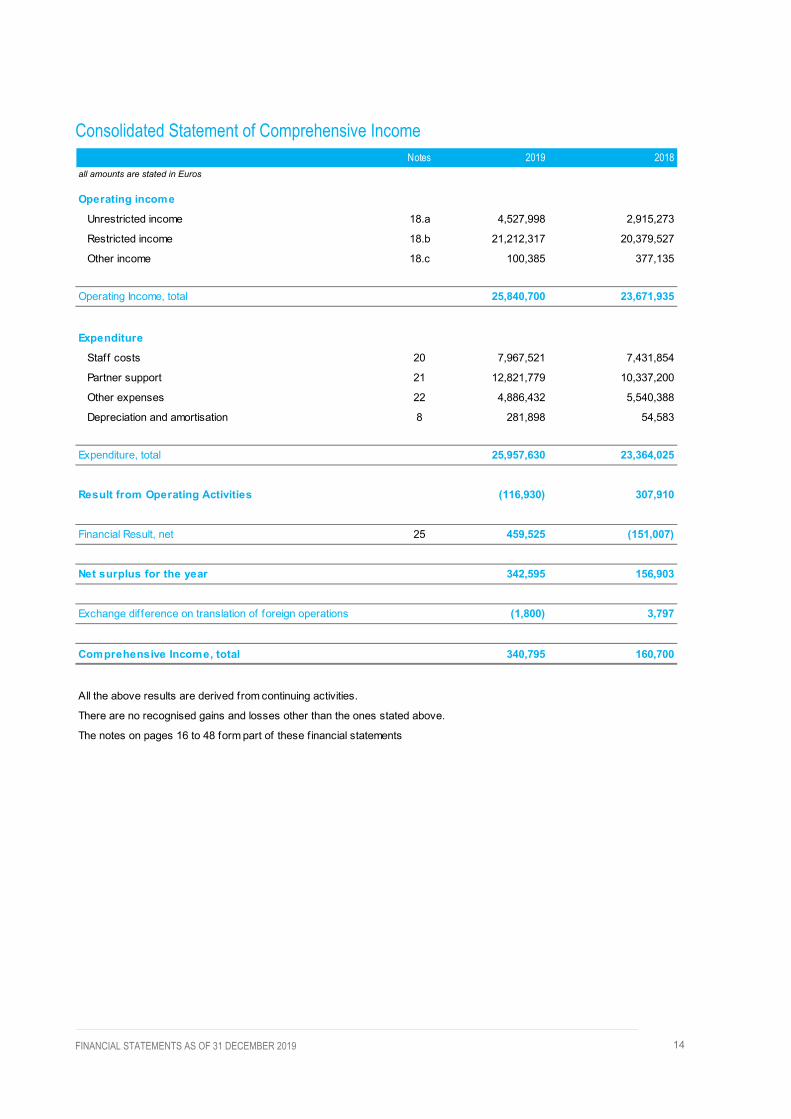
Consolidated Statement of Comprehensive Income
Notes 2019 2018all amounts are stated in Euros
Operating income
Unrestricted income 18.a 4,527,998 2,915,273
Restricted income 18.b 21,212,317 20,379,527
Other income 18.c 100,385 377,135
Operating Income, total 25,840,700 23,671,935
Expenditure
Staff costs 20 7,967,521 7,431,854
Partner support 21 12,821,779 10,337,200
Other expenses 22 4,886,432 5,540,388
Depreciation and amortisation 8 281,898 54,583
Expenditure, total 25,957,630 23,364,025
Result from Operating Activities (116,930) 307,910
Financial Result, net 25 459,525 (151,007)
Net surplus for the year 342,595 156,903
Exchange difference on translation of foreign operations (1,800) 3,797
Comprehensive Income, total 340,795 160,700
All the above results are derived from continuing activities.
There are no recognised gains and losses other than the ones stated above.
The notes on pages 16 to 48 form part of these f inancial statements

15 FINANCIAL STATEMENTS AS OF 31 DECEMBER 2019
Consolidated Statement of Changes in Reserves
Free Reserv es TotalSpecial Fund Netw ork Reserv e
all amounts are stated in Euros
Balance at 01 January 2018 3,244,023 774,500 150,000 (3,621) 4,164,902
Transferred reserves on consolidation of subsidiary - - - 3,797 3,797
Transfer from Net Surplus in 2018 156,903 - - - 156,903
Balance at 31 December 2018 3,400,926 774,500 150,000 176 4,325,602
Balance at 01 January 2019, as previously reported 3,400,926 774,500 150,000 176 4,325,602
Impact of change in accounting policy (499,140) (499,140)
Adjusted balance at 01 January 2019 2,901,786 774,500 150,000 176 3,826,462
Exchange difference on translating foreign operations - - - (1,800) (1,800)
Transfer from Net Surplus in 2019 342,595 - - - 342,595
Balance at 31 December 2019 3,244,381 774,500 150,000 (1,624) 4,167,257
The notes on pages 16 to 48 form part of these f inancial statements
Designated Reserv es Foreign currency translation reserv e
16 FINANCIAL STATEMENTS AS OF 31 DECEMBER 2019
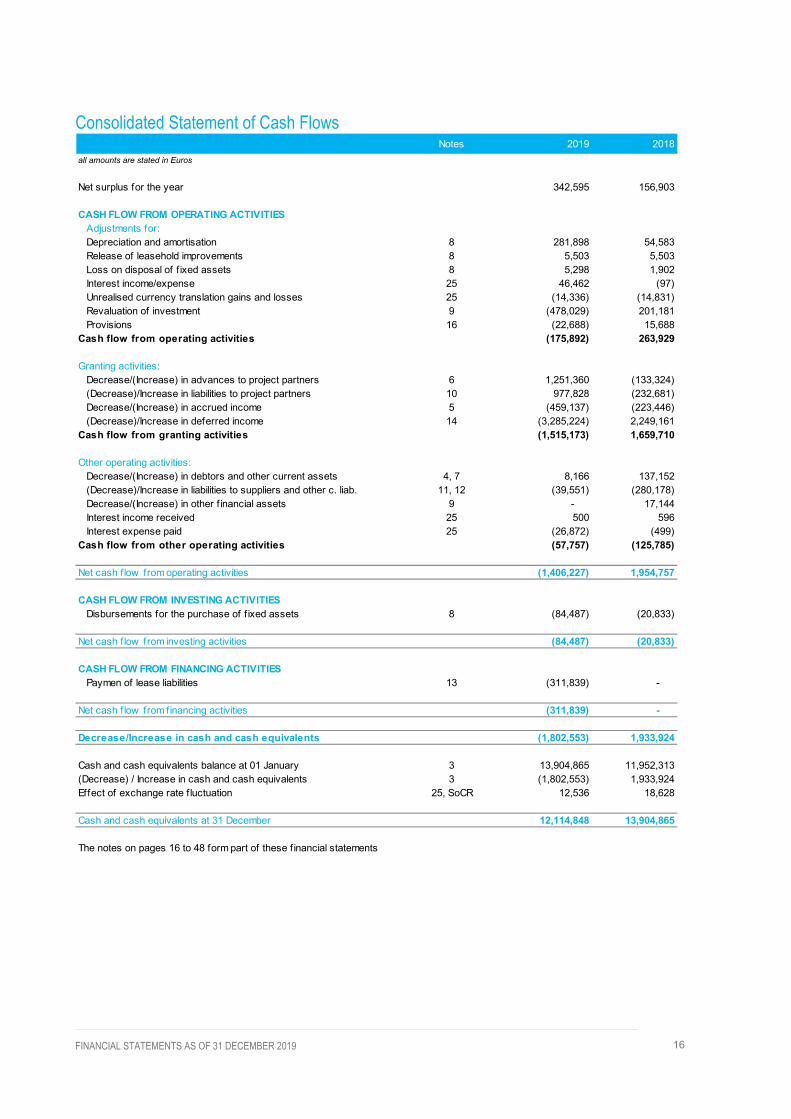
Consolidated Statement of Cash Flows
Notes 2019 2018all amounts are stated in Euros
Net surplus for the year 342,595 156,903
CASH FLOW FROM OPERATING ACTIVITIESAdjustments for:Depreciation and amortisation 8 281,898 54,583Release of leasehold improvements 8 5,503 5,503Loss on disposal of f ixed assets 8 5,298 1,902Interest income/expense 25 46,462 (97)Unrealised currency translation gains and losses 25 (14,336) (14,831)Revaluation of investment 9 (478,029) 201,181Provisions 16 (22,688) 15,688
Cash flow from operating activities (175,892) 263,929
Granting activities:Decrease/(Increase) in advances to project partners 6 1,251,360 (133,324)(Decrease)/Increase in liabilities to project partners 10 977,828 (232,681)Decrease/(Increase) in accrued income 5 (459,137) (223,446)(Decrease)/Increase in deferred income 14 (3,285,224) 2,249,161
Cash flow from granting activities (1,515,173) 1,659,710
Other operating activities:Decrease/(Increase) in debtors and other current assets 4, 7 8,166 137,152(Decrease)/Increase in liabilities to suppliers and other c. liab. 11, 12 (39,551) (280,178)Decrease/(Increase) in other f inancial assets 9 - 17,144Interest income received 25 500 596Interest expense paid 25 (26,872) (499)
Cash flow from other operating activities (57,757) (125,785)
Net cash f low from operating activities (1,406,227) 1,954,757
CASH FLOW FROM INVESTING ACTIVITIES Disbursements for the purchase of f ixed assets 8 (84,487) (20,833)
Net cash f low from investing activities (84,487) (20,833)
CASH FLOW FROM FINANCING ACTIVITIESPaymen of lease liabilities 13 (311,839) -
Net cash f low from financing activities (311,839) -
Decrease/Increase in cash and cash equivalents (1,802,553) 1,933,924
Cash and cash equivalents balance at 01 January 3 13,904,865 11,952,313(Decrease) / Increase in cash and cash equivalents 3 (1,802,553) 1,933,924Effect of exchange rate f luctuation 25, SoCR 12,536 18,628
Cash and cash equivalents at 31 December 12,114,848 13,904,865
The notes on pages 16 to 48 form part of these f inancial statements

17 FINANCIAL STATEMENTS AS OF 31 DECEMBER 2019
NOTES
Transparency International e.V. (henceforth referred to as the Secretariat) is a registered, incorporated association (“eingetragener Verein”) based at Alt-Moabit 96, 10559 Berlin, Germany. It acts as the secretariat of Transparency International (TI), the global civil society organisation leading the fight against corruption.
The financial statements comprise the Consolidated Statement of Financial Position, the Consolidated Statement of Comprehensive Income, the Consolidated Statement of Changes in Reserves, the Consolidated Statement of Cash Flows and the Notes to the Financial Statements for the year ended 31 December 2018. The area of consolidation is defined below. The financial statements are presented in units of Euros.
1. ACCOUNTING POLICIES The accounting policies adopted in the preparation of these consolidated financial statements are detailed below.
1.a Basis of preparation The financial statements have been prepared in accordance with International Financial Reporting Standards (IFRS) as adopted by the European Union (henceforth, Adopted IFRS).
The financial statements have been prepared voluntarily, under the historical cost basis. The accounting policies adopted in preparing these statements are consistent with those applied in the year ended 31 December 2017.
1.b Changes in adopted IFRS During the last reporting period, the following standards and interpretations have become effective. As such they been adopted by the Secretariat:
• IFRS 16 Leases • Prepayment Features with Negative Compensation – Amendments to IFRS 9 • Long-term Interests in Associates and Joint Ventures – Amendments to IAS 28 • Annual Improvements to IFRS Standards 2015 – 2017 Cycle • Plan Amendment, Curtailment or Settlement – Amendments to IAS 19 • Interpretation 23 Uncertainty over Income Tax Treatments.
TI applied IFRS 16 for the first time as of 1 January 2019. As part of the first-time application of IFRS 16, pn January 1, 2019, right of use assets and corresponding lease liabilities are recognized for all leases previously classified as operating leases under IAS 17. TI makes use of the option provided by IFRS 16 and waives recognition of the right of use assets and the lease liabiliies for leases with a term of up to twelve months ("current leases") and for leases of low-value assets. To measure the right of use assets, an amount equal to the lease liability was recognised, adjusted by the amount of lease payments made or deferred in advance for this lease. The initial recognition of the lease liabilities is determined as the present value of the lease payments to be made, discounted using the marginal borrowing rate at the date of initial application. The right of use assets are recognised in subsequent periods less accumulated depreciation and any necessary impairment losses in accordance with IAS 36. The figures for the comparative period are based on the accounting principles of IAS 17 and are not adjusted. The adjustments for IFRS 16 were therefore
18 FINANCIAL STATEMENTS AS OF 31 DECEMBER 2019
made in the opening balances as of January 1, 2019. Rights of use assets under leases totalling €2,030,185 were capitalised and, at the same time, lease liabilities of €2,529,324 were recognised. The difference was recognised as an adjustment to the opening balance of free reserves. The average incremental borrowing rate applied to lease liabilities as of January 1, 2019 is 0.85%. The capitalised rights of use assets relate to leased property. Certain new accounting standards and interpretations have been published that are not mandatory for 31 December 2019 reporting periods and have not been early adopted by the organization. These standards are not expected to have a material impact on the entity in the current or future reporting periods and on foreseeable future transactions.
1.c Preparation of the accounts on a going concern basis The reported consolidated net surplus amounts to €342,595, higher than prior years’ suprlus of €156,903 due to the favorable financial result. Projected funding for 2020 is considered adequate for sustainability: the 2020 budget approved by the Board in October 2019 indicates that grants awarded are sufficient to fund budgeted expenditure; in line with previous years, after the approval of the budget, additional income is expected to be secured through newly signed grants.
With reference to the liquidity at year end, current assets exceed current liabilities by €3,897,413; cash amounts to €12,114,848 or 56% of total assets. Cash flow shortages are not expected in the short and medium term. As such, there is no significant doubt on financial sustainability in the next 12-18 months. The accounts are therefore being prepared on a going concern basis.
1.d Use of estimates The preparation of financial statements in conformity with IFRS requires management to make judgements and estimates that affect the valuation of assets, income, liabilities and expenses. These estimates and judgements are based on assumptions that are considered reasonable in the circumstances. Actual results may differ from these estimates.
Estimates and underlying assumptions are reviewed on an ongoing basis. Revisions to accounting estimates are recognised in the period in which the estimates are revised and in any future periods affected.
1.e Area of consolidation These financial statements aggregate the results of the Secretariat with Friends of Transparency International (FOTI) and Transparency International Liaison Office to European Union AISBL (TI-EU) on a line-by-line basis. The entities are henceforth referred to collectively as TI-S in this report. A separate set of financial statements for the Secretariat is not presented.
Other entities belonging to the TI Movement –subsequently referred to as “coalition partners”- share common strategic goals and meet certain agreed accreditation requirements; however, these are fully independent from the Secretariat per the criteria set by IFRS 10 and therefore report separately.
1.e.1 Consolidated entities FOTI is a charity incorporated in the state of Minnesota, USA, and granted tax exempt status as per art. 501(c)3 of the United States Internal Revenue Code. It was founded in 2014 with the Secretariat as its sole member. The entity currently has no employees, and its registered address is:
1110 Vermont Avenue, suite 500, Washington, DC, 20005 – United States

19 FINANCIAL STATEMENTS AS OF 31 DECEMBER 2019
During 2019, the Secretariat and FOTI jointly implemented one project, which originated the following intragroup transactions:
Additionally, the Secretariat provided administrative and accounting services to FOTI on a pro-bono basis. The value of the services was estimated at €11,561 based on the resources employed, measured at standard cost.
TI-EU is a charity incorporated in Belgium, and granted international non-profit status (AISBL) as per the Belgian law of foundations of 27 June 1921. It was founded in 2010. As of 31 December 2019, the entity employed 14 staff and 2 interns, and its registered address is:
Rue de l’industrie 10, 1000 Bruxelles - Belgium
During 2019, the Secretariat and TI-EU jointly implemented ten projects, which originated the following intragroup transactions:
1.f Cash and cash equivalents
Cash and cash equivalents include cash in hand and cash at bank.
Cash and cash equivalents denominated in foreign currencies are measured at fair value, using the bank exchange rate at the date of the Statement of Financial Position.
1.g Current assets and liabilities
01-Jan-19 31-Dec-19
ProjectReceiv able/(pay able)
to FOTICash
paid/(receiv ed)Ex penditure
Receiv able/(pay able) to FOTI
all amounts are stated in Euros
Women, Land and Corruption 73,843 (125,767) 51,924 -
RELATED PARTY TRANSACTIONS between the Secretariat and FOTI
01-Jan-19 31-Dec-19
ProjectReceiv able/(pay able)
to TI-EUCash
paid/(receiv ed)(Ex penditure)
Receiv able/(pay able) to TI-EU
all amounts are stated in Euros
Core support (175,000) 175,458 (100,458) (100,000) Preventative Anti-Corruption for REDD+ 19,872 19,872 Integrity Pacts Phase I (13,961) 13,961 - Integrity Pacts Phase II (19,793) 51,064 (35,654) (4,383) Golden Visa campaign - Global Anti-CorruptionConsortium (GACC) - 24,400 (24,400) - Engage business in advancing global standards to stop corrupt money f low s (11,617) 875 (39,587) (50,329) Tow ard an EU Directive on Whistleblow ing (17,083) 50,638 (33,555) - Integrity Watch: online tools for the f ight against political corruption in Europe - 128,499 (64,815) 63,684 Financial Transparency Coalition Brussels Advocacy 8,176 33,756 (40,480) 1,452 Anti-Corruption Advocacy for Sustainable Development (87,436) 112,151 (18,328) 6,387
RELATED PARTY TRANSACTIONS between the Secretariat and TI-EU
20 FINANCIAL STATEMENTS AS OF 31 DECEMBER 2019
Current assets are measured at their recoverable amount, while current liabilities are measured at the amount expected to be paid. All current balances are due within one year.
Allowances for the impairment of “accounts receivable” and “advances to project partners” are made if the collection of the balance is doubtful. The amount of the allowance is the difference between the carrying amount of the asset and its recoverable amount.
1.h Non-Current assets Non-current assets include tangible and intangible fixed assets, and financial assets. The recognition criteria for each category of non-current asset is detailed below.
1.h.1 Tangible and intangible fixed assets Tangible assets include office equipment and furniture, while intangible assets comprise software, licences and leasehold improvements. Compliant with IAS 16 and 38, both are initially recorded at cost and thereafter presented at the lower of historical cost less accumulated depreciation and their recoverable amount.
TI-S can obtain licences for certain software at highly discounted or nil price. Availability of open source or favourably priced software is customary for charities; as such, licences obtained at these conditions are not considered in-kind donations in these financial statements.
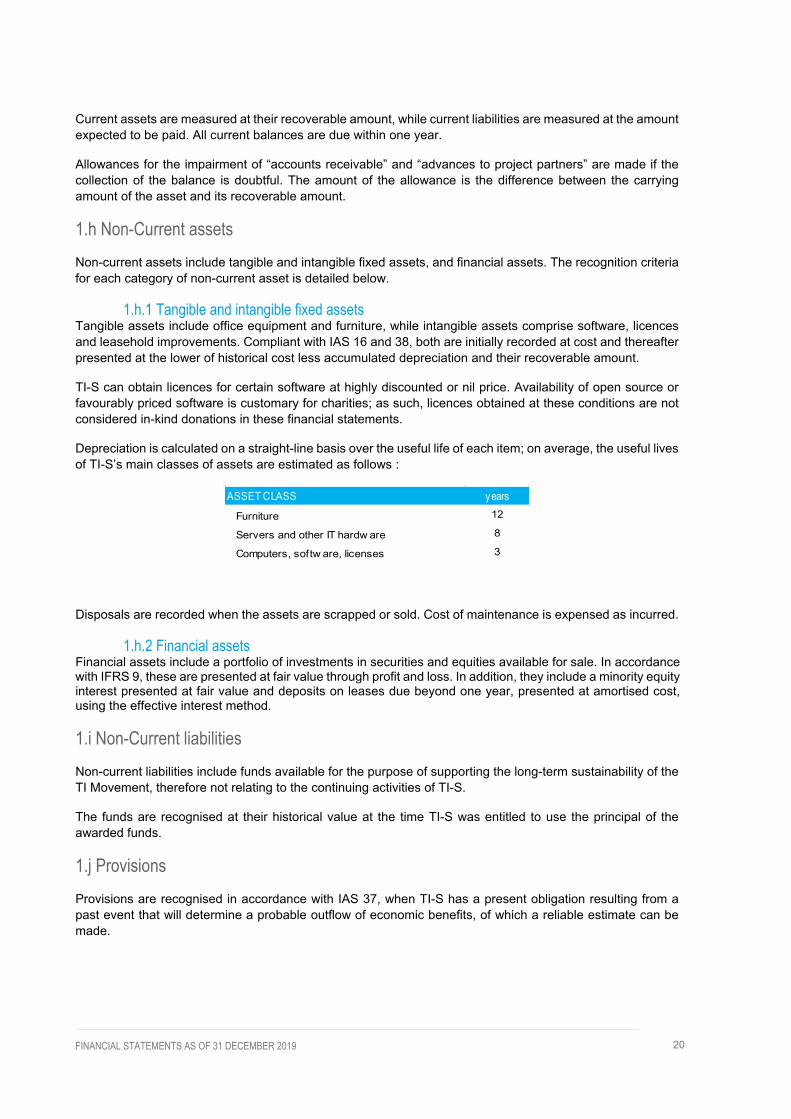
Depreciation is calculated on a straight-line basis over the useful life of each item; on average, the useful lives of TI-S’s main classes of assets are estimated as follows :
ASSET CLASS years
Furniture 12
Servers and other IT hardw are 8
Computers, softw are, licenses 3
Disposals are recorded when the assets are scrapped or sold. Cost of maintenance is expensed as incurred.
1.h.2 Financial assets Financial assets include a portfolio of investments in securities and equities available for sale. In accordance with IFRS 9, these are presented at fair value through profit and loss. In addition, they include a minority equity interest presented at fair value and deposits on leases due beyond one year, presented at amortised cost, using the effective interest method. 1.i Non-Current liabilities Non-current liabilities include funds available for the purpose of supporting the long-term sustainability of the TI Movement, therefore not relating to the continuing activities of TI-S.
The funds are recognised at their historical value at the time TI-S was entitled to use the principal of the awarded funds.
1.j Provisions Provisions are recognised in accordance with IAS 37, when TI-S has a present obligation resulting from a past event that will determine a probable outflow of economic benefits, of which a reliable estimate can be made.

21 FINANCIAL STATEMENTS AS OF 31 DECEMBER 2019
1.k Leases TI assesses at the inception of the contract whether an agreement constitutes or contains a lease. This is the case if the contract gives the right to control the use of an identified asset for a specified period of time in return for a fee.
1.k.1 TI as lessee TI recognises and measures all leases (except short-term leases and leases where the underlying asset is of minor value) using a single model. TI recognises liabilities for lease payments and rights of use assets for underlying asset.
1.k.2 Right of use assets TI records rights of use assets at the date of provision (i.e. the date on which the underlying leased asset is available for use). Rights of use assets are measured at cost less any accumulated depreciation and any accumulated impairment losses and are adjusted for any revaluation of the lease obligations. The cost of rights of use assets comprises the recognised lease obligations, the initial direct costs incurred and the lease payments made on or before the asset is made available for use, less any discounts received. Rights of use assets are amortised on a straight-line basis over the shorter of the lease term and the expected useful life of the leases as follows
- Office space: 8 years
If ownership of the leased asset is transferred to TI at the end of the lease term, or if the costs takes into account the exercise of a purchase option, depreciation is determined on the basis of the expected useful life of the leased asset.
1.k.3 Lease liabilities On the commitment date, TI recognizes the lease liability at the present value of the lease payments to be made over the lease term. Lease payments comprise fixed payments (including de facto fixed payments) less any lease discounts to be received, variable lease payments linked to an index or (interest) rate, and amounts expected to be paid under residual value guarantees. The lease payments also include the exercise price of a purchase option if it is reasonably certain that TI will actually exercise it and penalties for termination of the lease if the lease term reflects the organisation’s intention to exercise the termination option.
In calculating the present value of the lease payments, TI uses its incremental borrowing rate as of the commitment date because the interest rate underlying the lease cannot be readily determined. After the commitment date, the amount of lease liabilities is increased to reflect the higher interest expense and reduced to reflect the lease payments made. In addition, the carrying amount of the lease liabilities is revalued if there are changes in the lease, changes in the term of the lease, changes in lease payments (e.g. changes in future lease payments resulting from a change in the index or interest rate used to determine those payments) or a change in the assessment of a call option for the underlying asset.
TI applies to its short-term leases of designated assets, where relevant, the short-term lease exemption (i.e. leases that have a lease term not exceeding 12 months from the date of commitment and do not contain an option to purchase). TI also applies the low-value exception for leases of office equipment that are classified as low-value leases to leases of low-value assets. Lease payments for short-term leases and for leases based on a low-value asset are expensed on a straight-line basis over the term of the lease.
TI is not the lessor and therefore no information is required in this respect.

22 FINANCIAL STATEMENTS AS OF 31 DECEMBER 2019
1.l Changes in reserves Changes in reserves are accounted for in accordance with TI’s Charter. Additionally, the Secretariat is subject to the requirements of the German Tax Code (Abgabenordnung § 55, 62) which defines maximum and minimum levels of reserves, and requires that the reserves are used exclusively for charitable purposes, as defined in the charter.
1.m Accounting for income TI-S receives income mainly from grants, with residual amounts of funds being raised through individual donations, performance of charitable activities, and finance income. Regardless of the origin of the income, all contributors to income are henceforth defined as “donors”. The recognition criteria for each category of income is detailed below.
1.m.1 Grant income Grant income is accounted for in accordance with IAS 20. As such, income is recognised when there is reasonable assurance that (a) the grant will be received and (b) the entity will comply with the conditions attached to the grant. TI-S considers proviso (a) met when the formal offer of funding is communicated in writing. Proviso (b) is met when the activities required by the grant have been performed or the objectives upon which the grant is conditional have been met.
When entitlement is dependent on certain specific performance conditions, funds are identified as “restricted” and recognised as income when conditions are satisfied. This is usually proportional to the relevant expenditure incurred. When grants are awarded to cover the general expenditure of the organisation, they are identified as “unrestricted” and recognised as income when TI-S is entitled to their receipt, over the period they are intended to fund.
Grants received but not yet utilised are presented in the Statement of Financial Position as current liabilities under “deferred income”; grants committed and utilised but not yet received in cash are presented within current assets under “accrued income”.
1.m.2 Individual Donations Consistent with the provisions of IAS 20, individual donations are recognised when receivable. An individual donation is deemed to be receivable when actually received, e.g. in the case of voluntary cash payments collected via the Secretariat’s website; or when a contract is in place and any outstanding conditions under the contract have been met, e.g. contributions from legacies are recognised when the administrator confirms the transfer of title of the equity.
Donations in kind, if any, are recognised at fair value when received using a reliable estimate of the cost of the donated goods or services.
1.m.3 Income from charitable activities In a limited number of circumstances, TI-S receives income (“Zweckbetrieb”) as a remuneration for the performance of activities directly connected with its charitable purposes (“Gemeinnützigkeit”). The related income is recognised according to IAS 18 and therefore by reference to the stage of completion of the transaction at the end of the reporting period.
1.m.4 Finance income Finance income comprises interest income on deposits and exchange rate gains. Interest income and realised exchange rate gains are recognised when TI-S becomes entitled to them. Unrealised exchange rate gains are accounted for in compliance with IAS 21, as detailed in note 1.0.

23 FINANCIAL STATEMENTS AS OF 31 DECEMBER 2019
1.n Accounting for expenditure
Expenditure comprises operating expenditure incurred at TI-S, operating expenditure incurred by project partners, and finance costs. The recognition criteria for each category of expenditure are detailed below.
1.n.1 Operating expenditure incurred at TI-S Operating expenditure incurred at TI-S consists generally of staff costs, office running costs, travel costs and consultancy fees. Service and labour costs are recognised in line with the rendering of services and labour; purchases of goods are recognised when TI-S acquires title to their property.
In the case of leases pursuant to IAS 17, a distinction is made between finance leases and operating leases. Leases are classified as finance leases in accordance with IAS 17 if the lease agreement transfers substantially all the risks and rewards incidental to ownership to the lessee.
If the risks and rewards incidental to ownership essentially remain with the lessor, the leases are classified as operating leases for the lessee. Lease payments under operating leases are recognised as an expense in the income statement on a straight-line basis over the term of the lease, unless another systematic basis is more representative of the time pattern of benefits to the lessee.. Further information on leases is provided under note 24.
1.n.2 Operating expenditure incurred by project partners A portion of TI-S’s expenditure is incurred by project partners that recieve grants from TI-S, mostly for the implementation of grant-funded projects. Most project partners are National Chapters, National Chapters in Formation or National Contacts: these are referred to collectively as Coalition Partners. Expenditure is accounted for when incurred by the partner. TI-S estimates the expenditure incurred based on periodic reports issued by partners, which are assessed for accuracy and compliance with donor requirements and good accounting practice. In Annex 3 to these financial statements, TI-S differentiates between expenditure reported through final reports, supported by documentation in full compliance with donor requirements, and interim reports. Expenditure recognised on the basis of interim reports amounts to €9,478,658 (€7,126,642 in 2018). Grants disbursed but not yet spent by coalition partners are included in the Statement of Financial Position as “Advances to project partners”. Donor funds disbursed to finance those outstanding advances are included within “Deferred income, current”.
1.n.3 Finance costs Finance costs comprise interest cost on deposits and exchange rate losses. Interest costs are recognised on an accrual basis. Unrealised exchange rate losses are accounted for in compliance with IAS 21, as detailed in note 1.o.
1.n.4 Cost accounting and full cost recovery Direct expenditure is systematically allocated to projects and activities. Indirect costs are apportioned to each project according to a standard methodology based on staff taking part on the relevant project or activitiy. Indirect costs include expenditure related to financial, human resources, information technology, institutional governance and management, as well as office running costs. TI-S strives to achieve full cost recovery on every implemented project.
1.o Foreign currency translation
Unrealised exchange rate gains and losses are recognised at the date of the Statement of Financial Position, as a result of the conversion of all monetary assets and liabilities denominated in a foreign currency into

24 FINANCIAL STATEMENTS AS OF 31 DECEMBER 2019
Euros, at the exchange rate prevailing at year end. “Deferred income”, “accrued income” and “advances to project partners” are non-monetary items.
1.p Taxation The Secretariat is registered as an incorporated charity in Germany (“eingetragener Verein”, “Gemeinnützig”); it has no trading income, and therefore no liability for income tax (“Körperschaftssteuer” and “Gewerbesteuer”). The Secretariat is also registered as a small entrepreneur for VAT purposes; none of its income is subject to VAT, which implies that VAT paid on purchases is an unrecoverable cost.
1.q Pensions
The cost of pension and post-employment benefits schemes are included in the Statement of Comprehensive Income as they are incurred, according to IAS 19. None of these schemes are a defined benefit scheme.
2. FINANCIAL RISK MANAGEMENT Compliant with IFRS 7, TI-S discloses below an assessment of its exposure to financial risks, which include: market risk, credit risk and liquidity risk. Market risk is seen as resulting from the combination of foreign exchange risk, price risk and interest rate risk.
TI-S does not hold any derivative financial instruments, and measures most of its financial instruments at fair value, as noted in note 2.d.
2.a Market risk
2.a.1 Foreign exchange risk Foreign currency risk relates to the potential losses incurred as a consequence of the change in the value of its financial instruments denominated in foreign currencies, due to exchange rate fluctuations.
Since the majority of expenditure is incurred in Euros, TI-S seeks to maximise receipts in Euros, as a way to naturally hedge against exchange rate fluctuations.
Income received in foreign currencies is, however, significant. Per TI-S’s Foreign Exchange policy, foreign currency held (resulting from donations’ received) has to approximate the forecast expenditure to be incurred in each currency, thus maximising the natural currency hedge. When differences between budgets denominated in a foreign currency and forecast expenditure in Euros arise, they are monitored on a timely basis and, if necessary, discussed with the donor to adapt planned activities to existing funds.
The tables below summarise the currency exposure per foreign currency and risk class, as of 31 December 2019 and 31 December 2018:

25 FINANCIAL STATEMENTS AS OF 31 DECEMBER 2019
Other significant balances, including “advances to project partners”, “accrued income” and “deferred income” relate to non-monetary items, and therefore are not included as part of the currency exposure.
2.a.2 Price risk Transparency International is exposed to equity and debt security price risks because of investments available for sale. These are managed by a professional portfolio manager (Deutsche Bank) who mitigates the price risk arising from them.
2.a.3 Interest rate risk Interest rate risk relates to the additional costs or reduced income depending on changes in interest rates over time.
All bank deposits have a maturity date that is below one year; as of 31 December 2019, TI-S cash is invested in immediately available cash accounts.
2.b Credit risk Credit risk is the risk of financial loss due to a counterparty to a financial instrument failing to meet its contractual obligations. The carrying amount of TI-S’s financial assets represents its maximum credit exposure. Impairment losses, if any, are recognised in the Statement of Comprehensive Income.
CURRENCY EXPOSUREEUR GBP USD OTHER TOTAL
all amounts are stated in Euros
Investments 3,699,062 - 271,045 52,129 4,022,236
Cash and cash equivalents 11,911,158 6,787 196,903 - 12,114,848
Debtors 146,786 19 7,360 - 154,165
Other current assets 74,421 7,730 27,083 94,455 203,689
Liabilities to project partners (527,189) (689,153) (96,146) - (1,312,488)
Liabilities to suppliers (725,688) (3,845) (6,582) (776) (736,891)
Liabilities to other parties (103,444) - - - (103,444)
Foreign currency exposure 14,475,106 (678,462) 399,663 145,808 14,342,115
31 December 2019
CURRENCY EXPOSURE
EUR GBP USD OTHER TOTALall amounts are stated in Euros
Investments 3,336,039 - 180,536 27,632 3,544,207
Cash and cash equivalents 13,414,235 275,767 214,863 - 13,904,865
Debtors 237,033 2,825 15,783 - 255,641
Other current assets 73,977 7,730 27,083 1,588 110,378
Liabilities to project partners (316,697) (278) (16,444) (1,241) (334,660)
Liabilities to suppliers (649,230) (3,469) (27,924) (25) (680,648)
Liabilities to other parties (330,585) - (33) - (330,618)
Foreign currency exposure 15,764,772 282,575 393,864 27,954 16,469,165
31 December 2018
26 FINANCIAL STATEMENTS AS OF 31 DECEMBER 2019
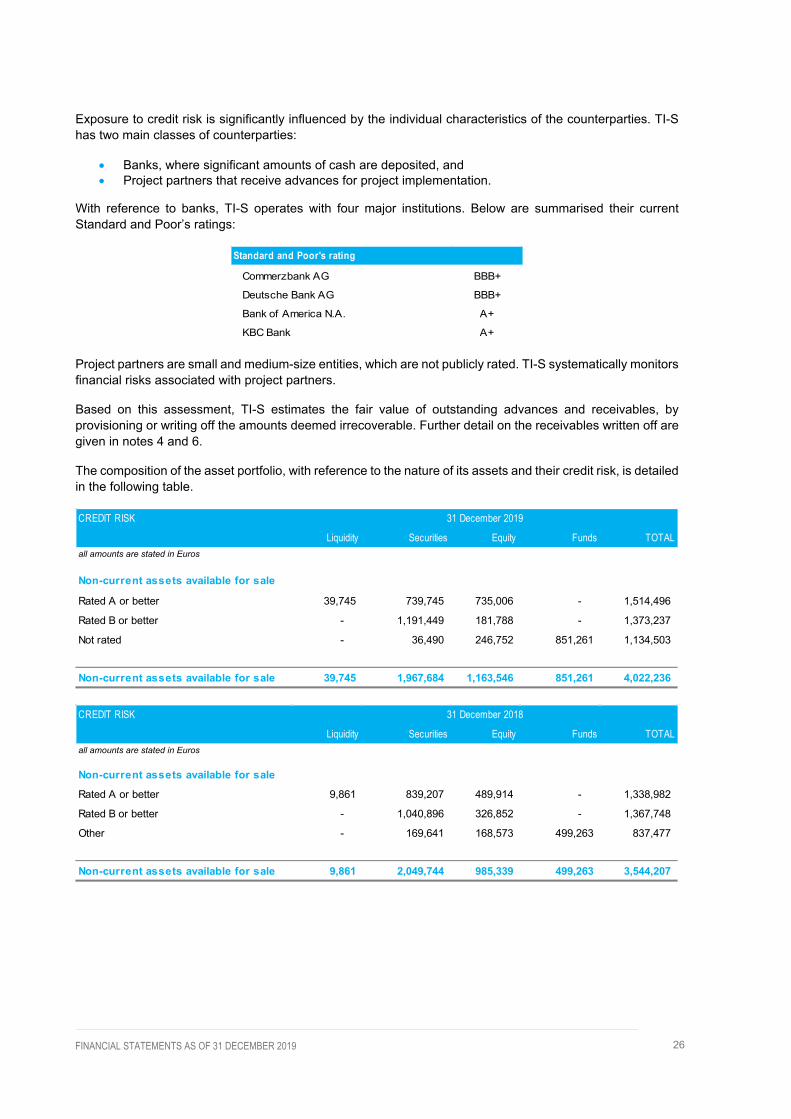
Exposure to credit risk is significantly influenced by the individual characteristics of the counterparties. TI-S has two main classes of counterparties:
• Banks, where significant amounts of cash are deposited, and • Project partners that receive advances for project implementation.
With reference to banks, TI-S operates with four major institutions. Below are summarised their current Standard and Poor’s ratings:
Project partners are small and medium-size entities, which are not publicly rated. TI-S systematically monitors financial risks associated with project partners.
Based on this assessment, TI-S estimates the fair value of outstanding advances and receivables, by provisioning or writing off the amounts deemed irrecoverable. Further detail on the receivables written off are given in notes 4 and 6.
The composition of the asset portfolio, with reference to the nature of its assets and their credit risk, is detailed in the following table.
Standard and Poor's rating
Commerzbank AG BBB+
Deutsche Bank AG BBB+
Bank of America N.A. A+
KBC Bank A+
CREDIT RISK
Liquidity Securities Equity Funds TOTALall amounts are stated in Euros
Non-current assets available for sale
Rated A or better 39,745 739,745 735,006 - 1,514,496
Rated B or better - 1,191,449 181,788 - 1,373,237
Not rated - 36,490 246,752 851,261 1,134,503
Non-current assets available for sale 39,745 1,967,684 1,163,546 851,261 4,022,236
31 December 2019
CREDIT RISK
Liquidity Securities Equity Funds TOTALall amounts are stated in Euros
Non-current assets available for sale
Rated A or better 9,861 839,207 489,914 - 1,338,982
Rated B or better - 1,040,896 326,852 - 1,367,748
Other - 169,641 168,573 499,263 837,477
Non-current assets available for sale 9,861 2,049,744 985,339 499,263 3,544,207
31 December 2018
27 FINANCIAL STATEMENTS AS OF 31 DECEMBER 2019
2.c Liquidity risk Liquidity risk is the risk that the organisation encounters difficultly in meeting the obligations associated with settling its financial liabilities by the delivery of cash.
TI-S has a robust financial monitoring and reporting system, which allows it to foresee liquidity needs well in advance, and assess them against expected receipts. Expected cash flows, however, are taken into consideration starting from the project-development stage, with the aim of minimising advanced expenditure and pressure on cash balances.
TI-S keeps a significant portion of its reserves in cash, to minimise liquidity risk. Moreover, it is in a position to borrow short-term liquidity from its banks, although this has not been necessary to date.
The Board of Directors and its Finance Committee receive regular updates on the Secretariat’s cash position.
2.d Fair value Most of TI-S’s financial assets are measured at fair value, consistent with the entity’s operating model, and the contractual terms of the instruments (IFRS 9).
Non-current financial assets are measured at fair value based on quoted prices in active markets for identical assets and liabilities, as provided by the portfolio manager. The carrying amount, less any impairment noted, e.g. on receivables and advances, is considered in line with their fair value.
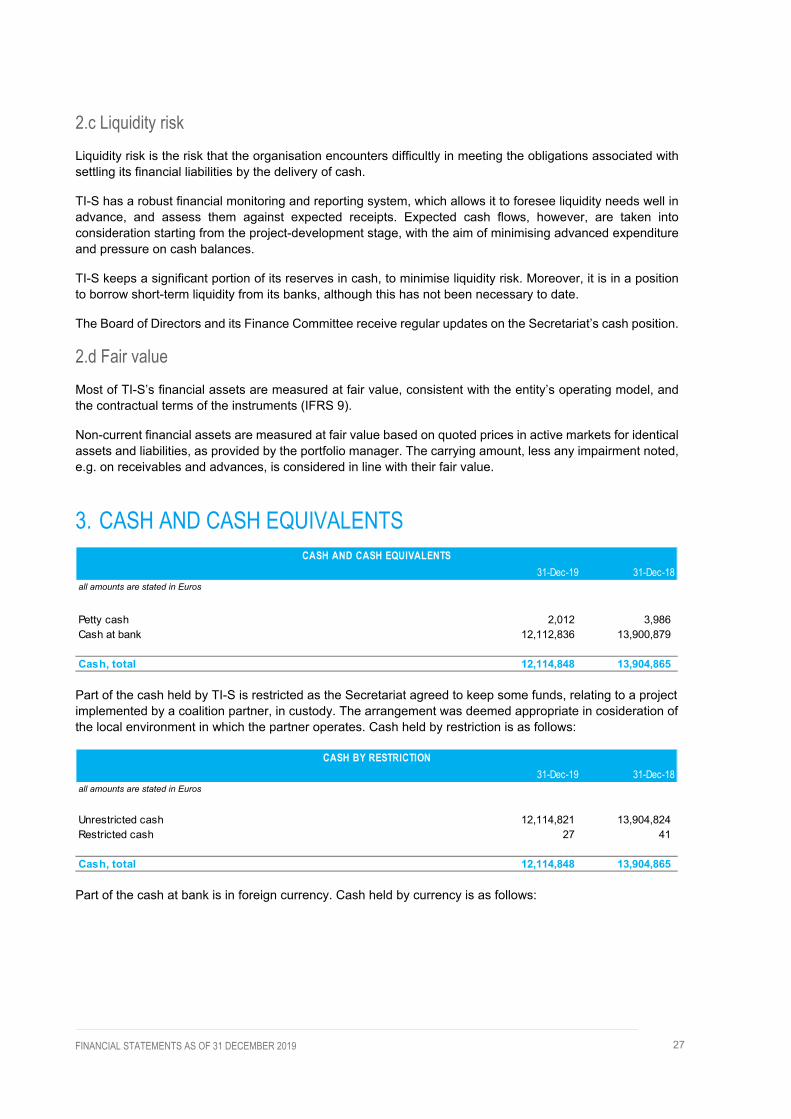
3. CASH AND CASH EQUIVALENTS
Part of the cash held by TI-S is restricted as the Secretariat agreed to keep some funds, relating to a project implemented by a coalition partner, in custody. The arrangement was deemed appropriate in cosideration of the local environment in which the partner operates. Cash held by restriction is as follows:
Part of the cash at bank is in foreign currency. Cash held by currency is as follows:
31-Dec-19 31-Dec-18all amounts are stated in Euros
Petty cash 2,012 3,986 Cash at bank 12,112,836 13,900,879
Cash, total 12,114,848 13,904,865
CASH AND CASH EQUIVALENTS
31-Dec-19 31-Dec-18all amounts are stated in Euros
Unrestricted cash 12,114,821 13,904,824 Restricted cash 27 41
Cash, total 12,114,848 13,904,865
CASH BY RESTRICTION

28 FINANCIAL STATEMENTS AS OF 31 DECEMBER 2019
Foreign currencies have been converted using the below exchange rates:
4. DEBTORS
Receivables from project partners mainly relate to balances unspent at the end of projects, which are to be given back in cash to TI-S. Receivables from others include mainly travel reimbursement requests.
“Receivables from project partners” and “receivables from others” are classified by ageing as follows:
On the basis of the analysis above (see note 2.b), TI-S establishes a provision for doubtful debts for amounts past the due date where there is no reasonable expectation of receiving the funds. Movements in the provisions are as follows:
foreign currency Euro foreign currency Euro
Euro 11,911,158 13,414,234 Pound Sterling 5,770 6,787 247,391 275,767 United States Dollar 221,083 196,903 246,083 214,863
Cash total 12,114,848 13,904,865
CASH BY CURRENCY31-Dec-19 31-Dec-18
31-Dec-19 31-Dec-18
Pound Sterling per Euro 0.8501 0.8971 United States Dollar per Euro 1.1228 1.1453
EXCHANGE RATES
31-Dec-19 31-Dec-18all amounts are stated in Euros
Receivables from project partners 146,852 181,782Receivables from others 23,462 93,206Receivables from personnel 27,484 24,286Provision for doubtful accounts (43,633) (43,633)
Debtors, total 154,165 255,641
DEBTORS
31-Dec-19 31-Dec-18all amounts are stated in Euros
Neither past due nor impaired 13,065 29,530Past due 1-30 days 3,707 62,842Past due 31-90 days 9,355 1,853Past due 91-150 days 829 15,899Past due greater than 150 days 143,358 164,864
Receivables from project partners and others, total 170,314 274,988
AGEING OF RECEIVABLES
29 FINANCIAL STATEMENTS AS OF 31 DECEMBER 2019
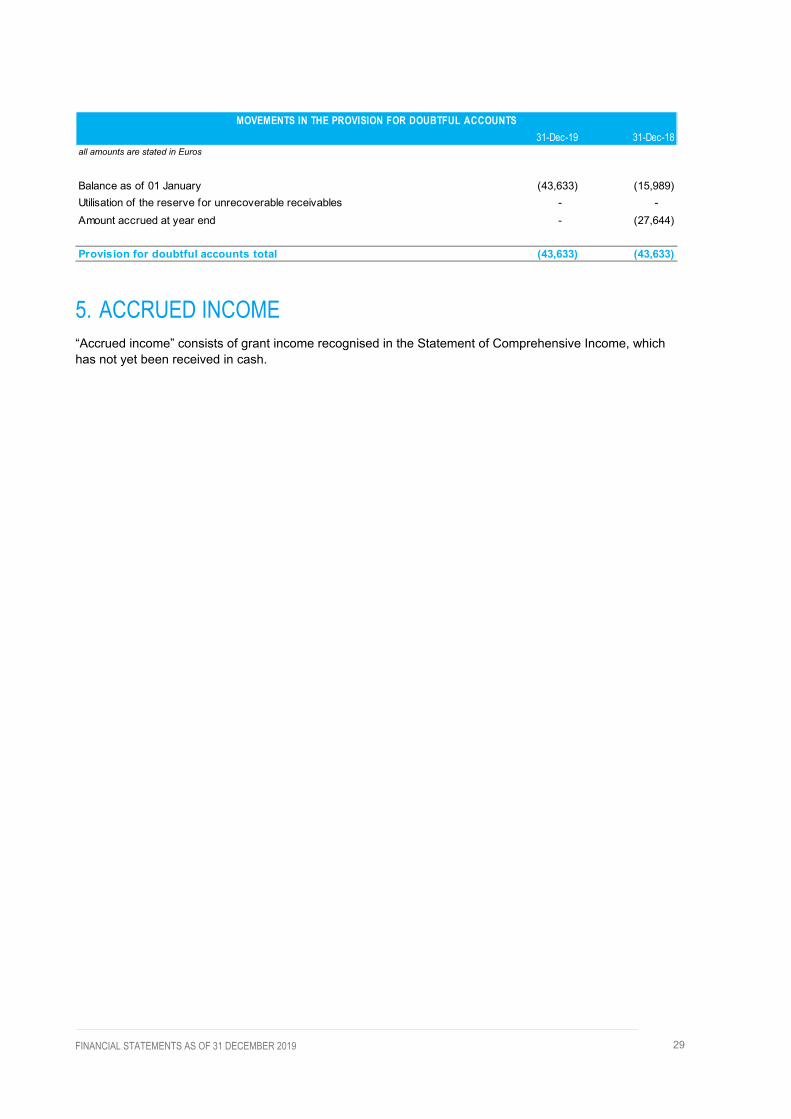
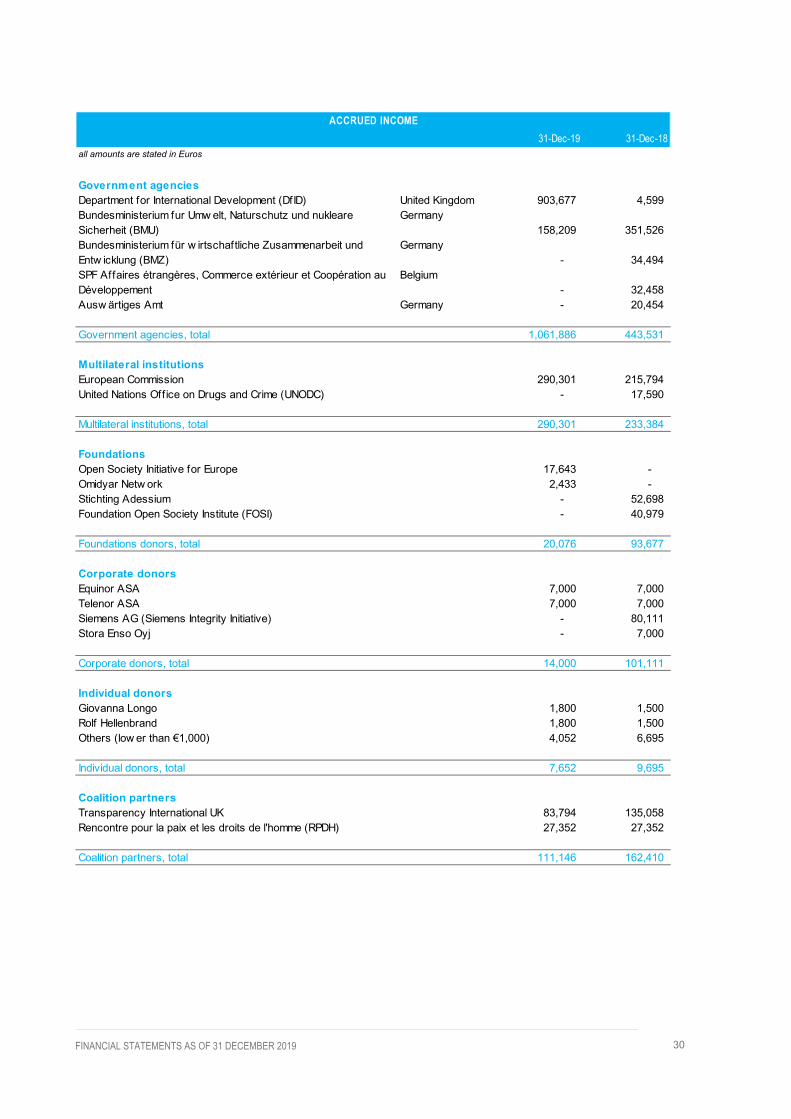
5. ACCRUED INCOME “Accrued income” consists of grant income recognised in the Statement of Comprehensive Income, which has not yet been received in cash.
31-Dec-19 31-Dec-18all amounts are stated in Euros
Balance as of 01 January (43,633) (15,989)Utilisation of the reserve for unrecoverable receivables - - Amount accrued at year end - (27,644)
Provision for doubtful accounts total (43,633) (43,633)
MOVEMENTS IN THE PROVISION FOR DOUBTFUL ACCOUNTS
30 FINANCIAL STATEMENTS AS OF 31 DECEMBER 2019
31-Dec-19 31-Dec-18all amounts are stated in Euros
Government agenciesDepartment for International Development (DfID) United Kingdom 903,677 4,599 Bundesministerium fur Umw elt, Naturschutz und nukleare Sicherheit (BMU)
Germany158,209 351,526
Bundesministerium für w irtschaftliche Zusammenarbeit und Entw icklung (BMZ)
Germany- 34,494
SPF Affaires étrangères, Commerce extérieur et Coopération au Développement
Belgium- 32,458
Ausw ärtiges Amt Germany - 20,454
Government agencies, total 1,061,886 443,531
Multilateral institutionsEuropean Commission 290,301 215,794 United Nations Office on Drugs and Crime (UNODC) - 17,590
Multilateral institutions, total 290,301 233,384
FoundationsOpen Society Initiative for Europe 17,643 - Omidyar Netw ork 2,433 - Stichting Adessium - 52,698 Foundation Open Society Institute (FOSI) - 40,979
Foundations donors, total 20,076 93,677
Corporate donorsEquinor ASA 7,000 7,000 Telenor ASA 7,000 7,000 Siemens AG (Siemens Integrity Initiative) - 80,111 Stora Enso Oyj - 7,000
Corporate donors, total 14,000 101,111
Individual donorsGiovanna Longo 1,800 1,500 Rolf Hellenbrand 1,800 1,500 Others (low er than €1,000) 4,052 6,695
Individual donors, total 7,652 9,695
Coalition partnersTransparency International UK 83,794 135,058 Rencontre pour la paix et les droits de l'homme (RPDH) 27,352 27,352
Coalition partners, total 111,146 162,410
ACCRUED INCOME
31 FINANCIAL STATEMENTS AS OF 31 DECEMBER 2019
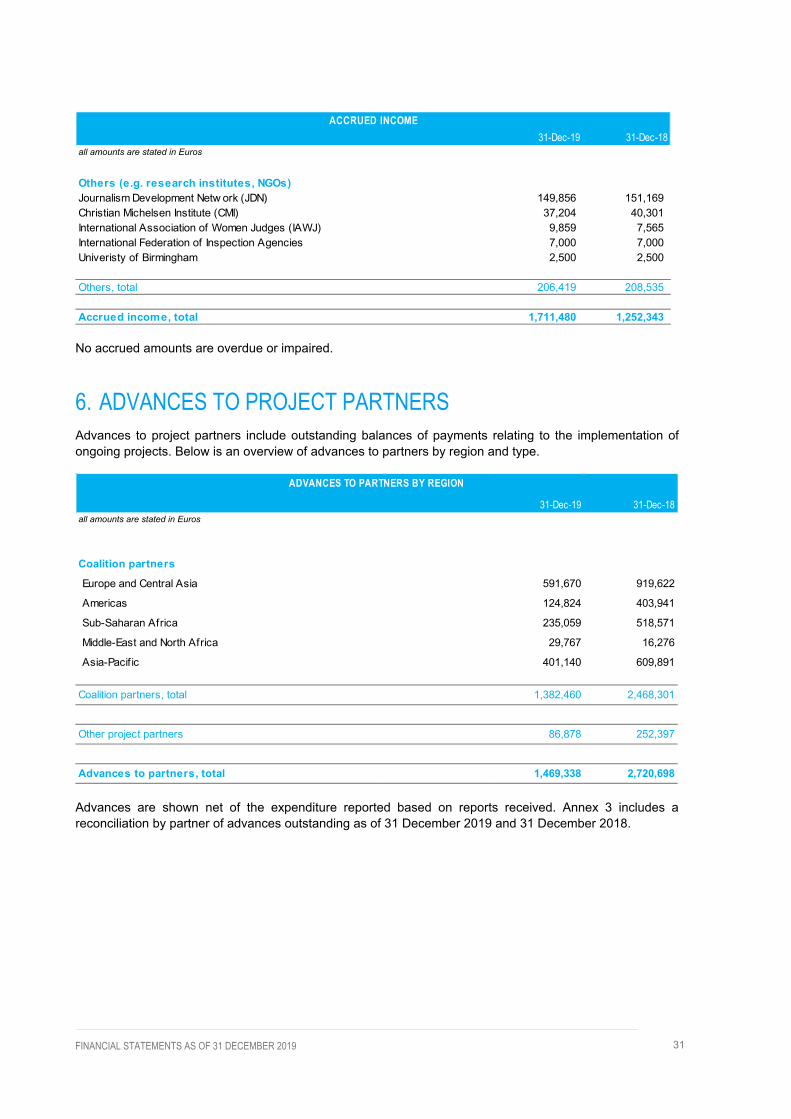
No accrued amounts are overdue or impaired.
6. ADVANCES TO PROJECT PARTNERS Advances to project partners include outstanding balances of payments relating to the implementation of ongoing projects. Below is an overview of advances to partners by region and type.
Advances are shown net of the expenditure reported based on reports received. Annex 3 includes a reconciliation by partner of advances outstanding as of 31 December 2019 and 31 December 2018.
31-Dec-19 31-Dec-18all amounts are stated in Euros
Others (e.g. research institutes, NGOs)Journalism Development Netw ork (JDN) 149,856 151,169 Christian Michelsen Institute (CMI) 37,204 40,301 International Association of Women Judges (IAWJ) 9,859 7,565 International Federation of Inspection Agencies 7,000 7,000 Univeristy of Birmingham 2,500 2,500
Others, total 206,419 208,535
Accrued income, total 1,711,480 1,252,343
ACCRUED INCOME
31-Dec-19 31-Dec-18all amounts are stated in Euros
Coalition partners
Europe and Central Asia 591,670 919,622
Americas 124,824 403,941
Sub-Saharan Africa 235,059 518,571
Middle-East and North Africa 29,767 16,276
Asia-Pacif ic 401,140 609,891
Coalition partners, total 1,382,460 2,468,301
Other project partners 86,878 252,397
Advances to partners, total 1,469,338 2,720,698
ADVANCES TO PARTNERS BY REGION

32 FINANCIAL STATEMENTS AS OF 31 DECEMBER 2019
7. OTHER CURRENT ASSETS
Other current assets are mostly related to advance payments of operating costs, including pension costs, rent, licences and membership fees.
8. TANGIBLE AND INTANGIBLE FIXED ASSETS
31-Dec-19 31-Dec-18all amounts are stated in Euros
Advances to suppliers 2,543 7,871Prepaid expenses 186,946 70,507Other 14,200 32,000
Other current assets, total 203,689 110,378
OTHER CURRENT ASSETS
all amounts are stated in Euros
Software Licences Leasehold
impovements Equipment Furniture TotalACQUISITION COSTBalance at 01 January 2019 131,660 18,739 30,270 655,448 26,140 862,257Additions - 24,882 - 58,950 655 84,487Disposals - - - (104,588) - (104,588)
Balance at 31 December 2019 131,660 43,621 30,270 609,809 26,795 842,155
DEPRECIATION AND AMORTISATIONBalance at 01 January 2019 129,190 17,810 11,465 631,273 21,377 811,115Depreciation / Amortisation for the year 849 16,244 - 21,993 1,601 40,687Release of leasehold improvement - - 5,503 - - 5,503Disposals - - - (99,289) - (99,289)
Balance at 31 December 2019 130,039 34,054 16,968 553,977 22,979 758,016
BOOK VALUE
Balance at 01 January 2019 2,470 929 18,805 24,175 4,763 51,142Balance at 31 December 2019 1,621 9,567 13,302 55,832 3,816 84,138
MOVEMENTS IN NON-CURRENT ASSETSTangible AssetsIntangible Assets

33 FINANCIAL STATEMENTS AS OF 31 DECEMBER 2019
TI has entered into leases for office space and operating and business equipment, which TI uses. TI's obligations under its leases are secured by the lessor's title to the leased assets.
TI has also entered into various leases with terms of twelve months or less and of minor value. TI applies to these leases the practical remedies available for short-term leases and to leases involving an asset of negligible value.
The carrying amount of lease assets, split by major class of asset, and new lease assets during the reporting period, are presented in the table below.
all amounts are stated in Euros
Software Licences Leasehold
impovements Equipment Furniture Total
ACQUISITION COST
Balance at 01 January 2018 146,976 26,198 30,270 755,528 30,766 989,738Additions 2,701 - - 18,132 - 20,833Disposals (18,017) (7,459) - (118,212) (4,626) (148,314)
Balance at 31 December 2018 131,660 18,739 30,270 655,448 26,140 862,257
DEPRECIATION AND AMORTISATION
Balance at 01 January 2018 146,976 24,111 5,962 700,578 19,814 897,441Depreciation / Amortisation for the year 231 1,158 - 48,907 4,287 54,583Release of leasehold improvement - - 5,503 - - 5,503Disposals (18,017) (7,459) - (118,212) (2,724) (146,412)
Balance at 31 December 2018 129,190 17,810 11,465 631,273 21,377 811,115
BOOK VALUE
Balance at 01 January 2018 - 2,087 24,308 54,950 10,952 92,297Balance at 31 December 2018 2,470 929 18,805 24,175 4,763 51,142
Tangible AssetsMOVEMENTS IN NON-CURRENT ASSETS
Intangible Assets
all amounts are stated in Euros
Land and Buildings Operating and Office
Equipment TotalCARRYING AMOUNTBalance at 01 January 2019 2,030,185 - 2,030,185Additions - - - Depreciation charge (241,210) - (241,210)
Balance at 31 December 2019 1,788,975 - 1,788,975
MOVEMENTS IN RIGHT OF USE ASSETS

34 FINANCIAL STATEMENTS AS OF 31 DECEMBER 2019
The following tables contain supplementary information in connection with lessee accounting. Expenses in connection with lease accounting.
9. FINANCIAL ASSETS An amount of €3,600,000 has been invested in a wealth management fund administered by Deutsche Bank. Its value at year-end was estimated at €4,019,736. Further details on the risk profile of the fund and its composition are included in note 2. Financial risk management.
Investments of €2,500 relate to a 10% stake in the International Civil Society Centre (ICSC), a global learning and exchange platform for international civil society organisations. These were purchased at their nominal value in 2009, but only €1,250 has been paid to date. The outstanding amount due of €1,250 is shown as “other non-current liabilities”.
Movements in investments for 2019 and 2018 are as follows:
“Other financial assets” relate to security bank deposits for office space in Berlin and Brussels. The total amount of security deposits is €88,211 at 31 December 2019 (2018: €88,211).
31-Dec-19all amounts are stated in Euros
Depreciation expense for right of use assets 241,210Interest expense for leasing liabilities 20,090Expenditure for short term leases 2,956Expenditure on leases of assets w ith negligible value 13,243
Lease costs, total 277,499
RIGHT OF USE ASSETS
31-Dec-19 31-Dec-18all amounts are stated in Euros
Opening balance as of 1 January 3,544,207 3,745,388
Investments - -
Yearly revaluation 505,224 (157,610)
Management fee (27,195) (43,571)
Investments, total 4,022,236 3,544,207
MOVEMENTS IN INVESTMENTS
35 FINANCIAL STATEMENTS AS OF 31 DECEMBER 2019
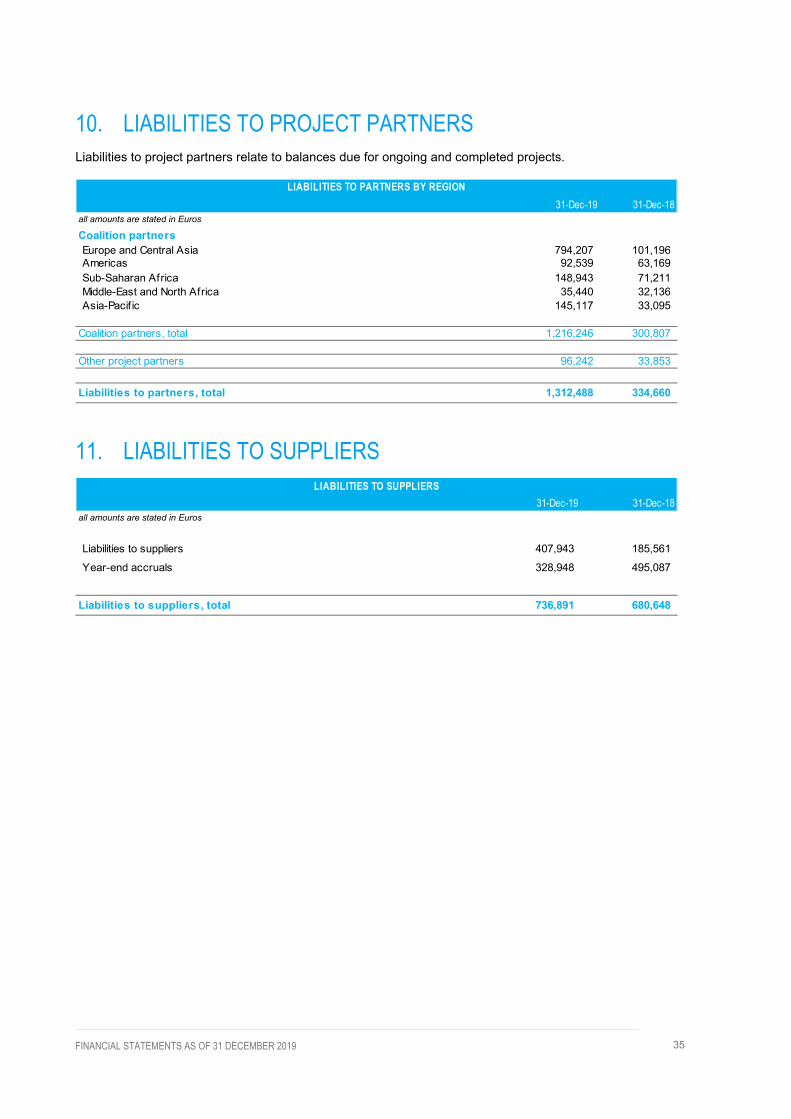
10. LIABILITIES TO PROJECT PARTNERS Liabilities to project partners relate to balances due for ongoing and completed projects.
11. LIABILITIES TO SUPPLIERS
31-Dec-19 31-Dec-18all amounts are stated in Euros
Coalition partnersEurope and Central Asia 794,207 101,196 Americas 92,539 63,169 Sub-Saharan Africa 148,943 71,211 Middle-East and North Africa 35,440 32,136 Asia-Pacif ic 145,117 33,095
Coalition partners, total 1,216,246 300,807
Other project partners 96,242 33,853
Liabilities to partners, total 1,312,488 334,660
LIABILITIES TO PARTNERS BY REGION
31-Dec-19 31-Dec-18all amounts are stated in Euros
Liabilities to suppliers 407,943 185,561
Year-end accruals 328,948 495,087
Liabilities to suppliers, total 736,891 680,648
LIABILITIES TO SUPPLIERS
36 FINANCIAL STATEMENTS AS OF 31 DECEMBER 2019
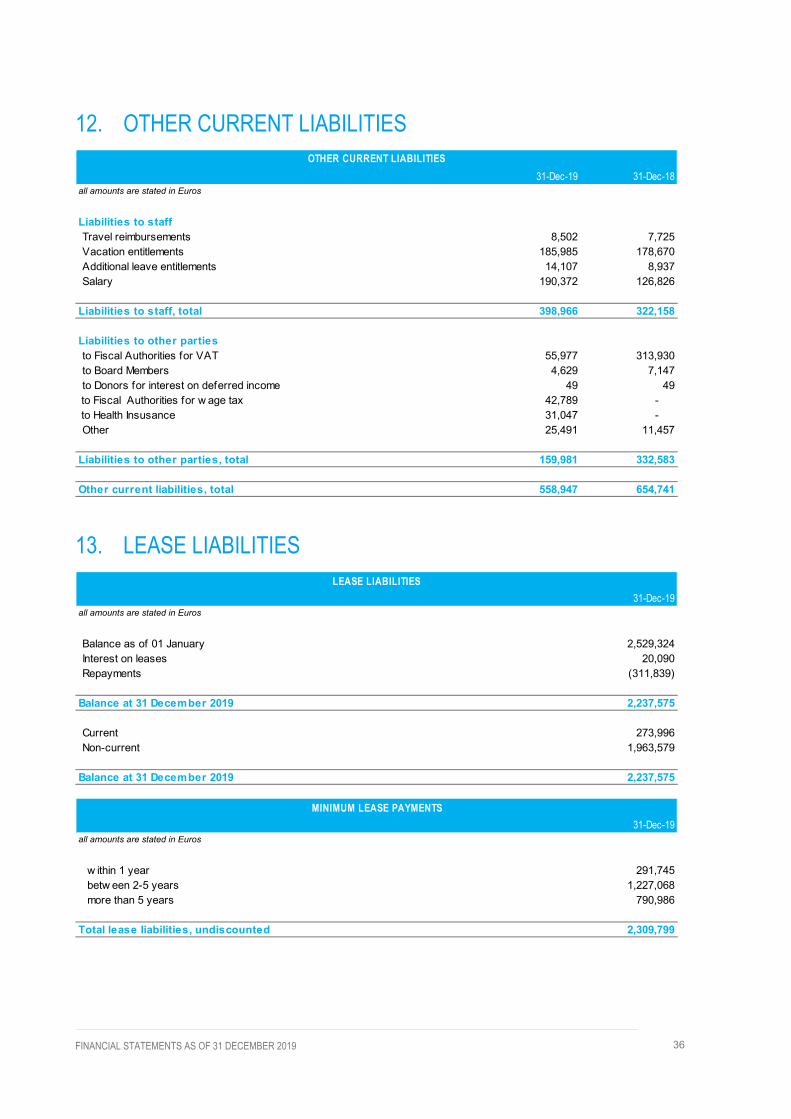
12. OTHER CURRENT LIABILITIES
13. LEASE LIABILITIES
31-Dec-19 31-Dec-18all amounts are stated in Euros
Liabilities to staffTravel reimbursements 8,502 7,725Vacation entitlements 185,985 178,670Additional leave entitlements 14,107 8,937Salary 190,372 126,826
Liabilities to staff, total 398,966 322,158
Liabilities to other partiesto Fiscal Authorities for VAT 55,977 313,930to Board Members 4,629 7,147to Donors for interest on deferred income 49 49
to Fiscal Authorities for w age tax 42,789 - to Health Insusance 31,047 - Other 25,491 11,457
Liabilities to other parties, total 159,981 332,583
Other current liabilities, total 558,947 654,741
OTHER CURRENT LIABILITIES
31-Dec-19all amounts are stated in Euros
Balance as of 01 January 2,529,324Interest on leases 20,090Repayments (311,839)
Balance at 31 December 2019 2,237,575
Current 273,996Non-current 1,963,579
Balance at 31 December 2019 2,237,575
31-Dec-19all amounts are stated in Euros
w ithin 1 year 291,745betw een 2-5 years 1,227,068more than 5 years 790,986
Total lease liabilities, undiscounted 2,309,799
LEASE LIABILITIES
MINIMUM LEASE PAYMENTS
37 FINANCIAL STATEMENTS AS OF 31 DECEMBER 2019
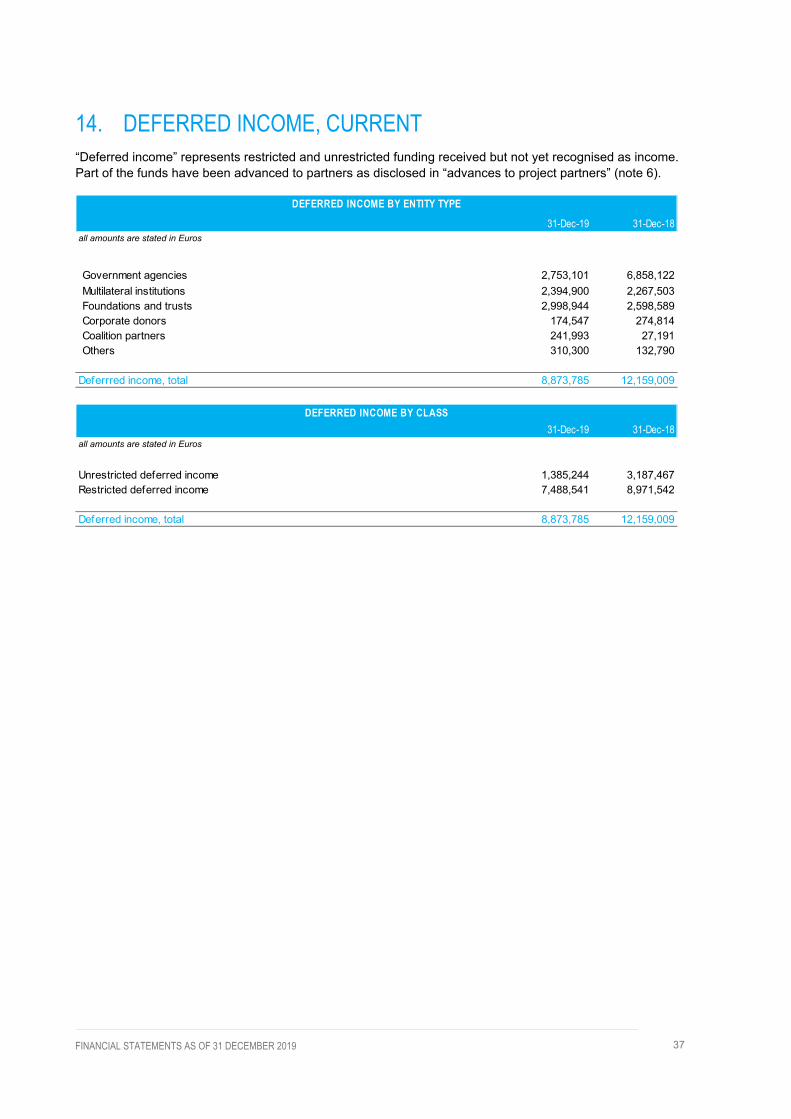
14. DEFERRED INCOME, CURRENT “Deferred income” represents restricted and unrestricted funding received but not yet recognised as income. Part of the funds have been advanced to partners as disclosed in “advances to project partners” (note 6).
31-Dec-19 31-Dec-18all amounts are stated in Euros
Government agencies 2,753,101 6,858,122Multilateral institutions 2,394,900 2,267,503Foundations and trusts 2,998,944 2,598,589Corporate donors 174,547 274,814Coalition partners 241,993 27,191Others 310,300 132,790
Deferrred income, total 8,873,785 12,159,009
DEFERRED INCOME BY ENTITY TYPE
31-Dec-19 31-Dec-18all amounts are stated in Euros
Unrestricted deferred income 1,385,244 3,187,467Restricted deferred income 7,488,541 8,971,542
Deferred income, total 8,873,785 12,159,009
DEFERRED INCOME BY CLASS
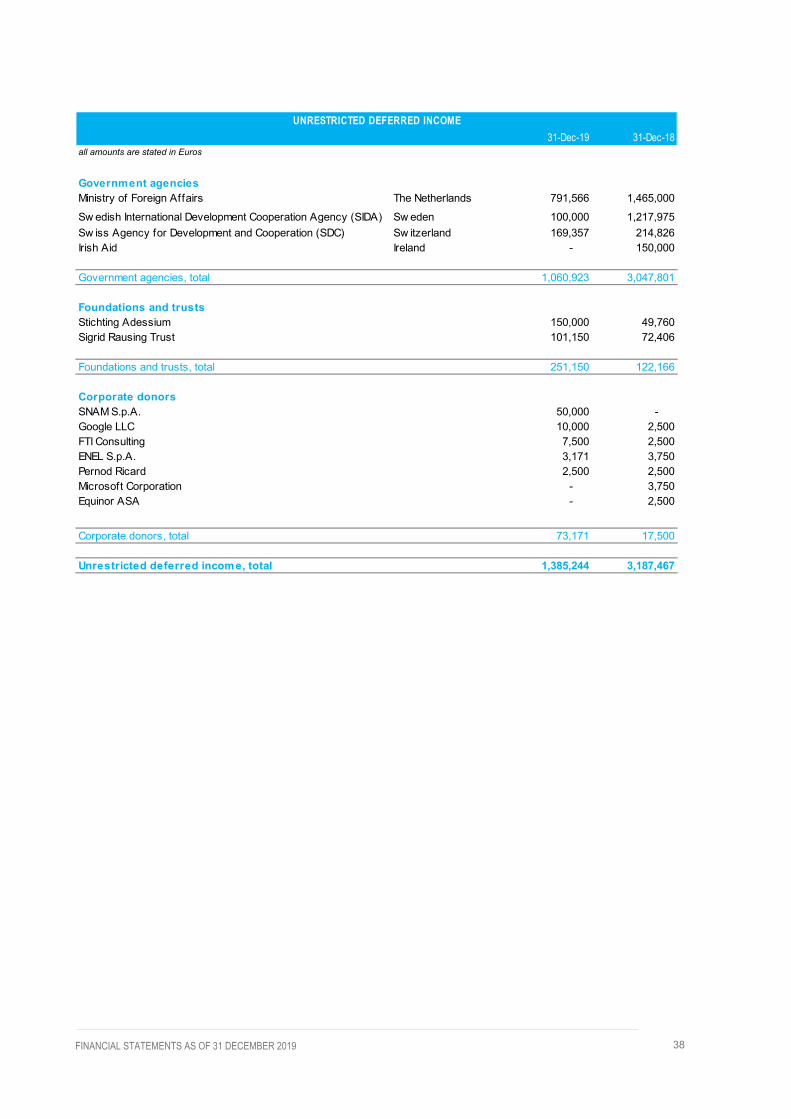
38 FINANCIAL STATEMENTS AS OF 31 DECEMBER 2019
31-Dec-19 31-Dec-18all amounts are stated in Euros
Government agenciesMinistry of Foreign Affairs The Netherlands 791,566 1,465,000
Sw edish International Development Cooperation Agency (SIDA) Sw eden 100,000 1,217,975Sw iss Agency for Development and Cooperation (SDC) Sw itzerland 169,357 214,826Irish Aid Ireland - 150,000
Government agencies, total 1,060,923 3,047,801
Foundations and trustsStichting Adessium 150,000 49,760Sigrid Rausing Trust 101,150 72,406
Foundations and trusts, total 251,150 122,166
Corporate donorsSNAM S.p.A. 50,000 - Google LLC 10,000 2,500FTI Consulting 7,500 2,500ENEL S.p.A. 3,171 3,750Pernod Ricard 2,500 2,500Microsoft Corporation - 3,750Equinor ASA - 2,500
Corporate donors, total 73,171 17,500
Unrestricted deferred income, total 1,385,244 3,187,467
UNRESTRICTED DEFERRED INCOME
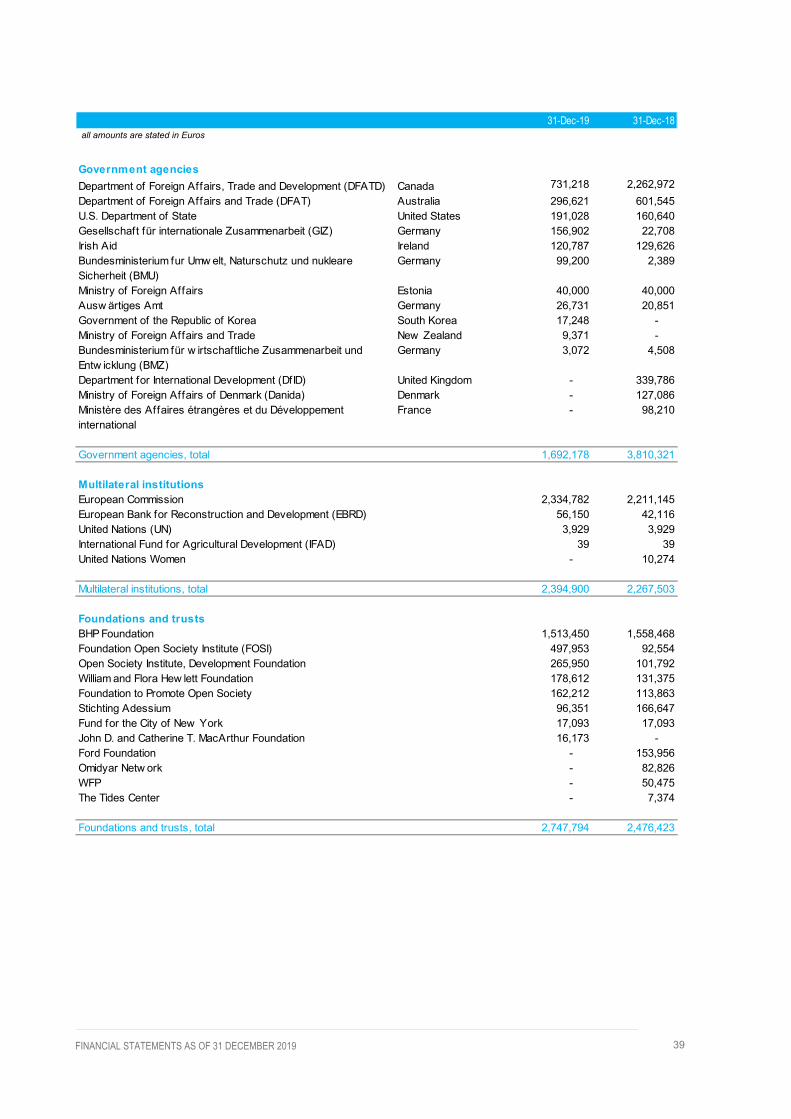
39 FINANCIAL STATEMENTS AS OF 31 DECEMBER 2019
31-Dec-19 31-Dec-18all amounts are stated in Euros
Government agenciesDepartment of Foreign Affairs, Trade and Development (DFATD) Canada 731,218 2,262,972Department of Foreign Affairs and Trade (DFAT) Australia 296,621 601,545U.S. Department of State United States 191,028 160,640Gesellschaft für internationale Zusammenarbeit (GIZ) Germany 156,902 22,708Irish Aid Ireland 120,787 129,626Bundesministerium fur Umw elt, Naturschutz und nukleare Sicherheit (BMU)
Germany 99,200 2,389
Ministry of Foreign Affairs Estonia 40,000 40,000Ausw ärtiges Amt Germany 26,731 20,851Government of the Republic of Korea South Korea 17,248 - Ministry of Foreign Affairs and Trade New Zealand 9,371 - Bundesministerium für w irtschaftliche Zusammenarbeit und Entw icklung (BMZ)
Germany 3,072 4,508
Department for International Development (DfID) United Kingdom - 339,786Ministry of Foreign Affairs of Denmark (Danida) Denmark - 127,086Ministère des Affaires étrangères et du Développement international
France - 98,210
Government agencies, total 1,692,178 3,810,321
Multilateral institutionsEuropean Commission 2,334,782 2,211,145European Bank for Reconstruction and Development (EBRD) 56,150 42,116United Nations (UN) 3,929 3,929International Fund for Agricultural Development (IFAD) 39 39United Nations Women - 10,274
Multilateral institutions, total 2,394,900 2,267,503
Foundations and trustsBHP Foundation 1,513,450 1,558,468Foundation Open Society Institute (FOSI) 497,953 92,554Open Society Institute, Development Foundation 265,950 101,792William and Flora Hew lett Foundation 178,612 131,375Foundation to Promote Open Society 162,212 113,863Stichting Adessium 96,351 166,647Fund for the City of New York 17,093 17,093John D. and Catherine T. MacArthur Foundation 16,173 - Ford Foundation - 153,956Omidyar Netw ork - 82,826WFP - 50,475The Tides Center - 7,374
Foundations and trusts, total 2,747,794 2,476,423
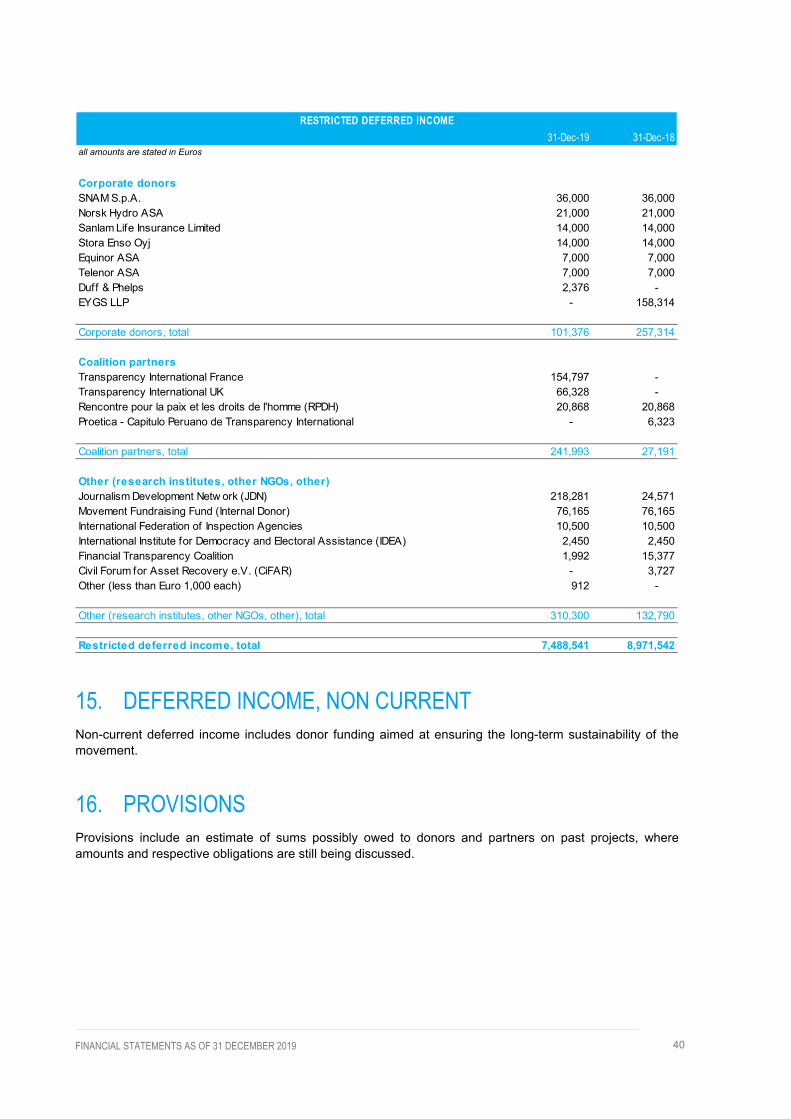
40 FINANCIAL STATEMENTS AS OF 31 DECEMBER 2019
15. DEFERRED INCOME, NON CURRENT Non-current deferred income includes donor funding aimed at ensuring the long-term sustainability of the movement.
16. PROVISIONS Provisions include an estimate of sums possibly owed to donors and partners on past projects, where amounts and respective obligations are still being discussed.
31-Dec-19 31-Dec-18all amounts are stated in Euros
Corporate donorsSNAM S.p.A. 36,000 36,000Norsk Hydro ASA 21,000 21,000Sanlam Life Insurance Limited 14,000 14,000Stora Enso Oyj 14,000 14,000Equinor ASA 7,000 7,000Telenor ASA 7,000 7,000Duff & Phelps 2,376 - EYGS LLP - 158,314
Corporate donors, total 101,376 257,314
Coalition partnersTransparency International France 154,797 - Transparency International UK 66,328 - Rencontre pour la paix et les droits de l'homme (RPDH) 20,868 20,868Proetica - Capitulo Peruano de Transparency International - 6,323
Coalition partners, total 241,993 27,191
Other (research institutes, other NGOs, other)Journalism Development Netw ork (JDN) 218,281 24,571Movement Fundraising Fund (Internal Donor) 76,165 76,165International Federation of Inspection Agencies 10,500 10,500International Institute for Democracy and Electoral Assistance (IDEA) 2,450 2,450Financial Transparency Coalition 1,992 15,377Civil Forum for Asset Recovery e.V. (CiFAR) - 3,727Other (less than Euro 1,000 each) 912 -
Other (research institutes, other NGOs, other), total 310,300 132,790
Restricted deferred income, total 7,488,541 8,971,542
RESTRICTED DEFERRED INCOME

41 FINANCIAL STATEMENTS AS OF 31 DECEMBER 2019
17. RESERVES Reserves totalling €4,167,257 at year-end (2018: 4,325,602) include two designated funds:
• Special fund, which is earmarked to support the organisational realignment with the Strategy • Network reserve, which has been established to support Coalition Partners in emergency situations
or facing governance challenges.
Foreign currency translation reserve results from the translation of the statements of Friends of Transparency International from US dollars into Euros.
31-Dec-19 31-Dec-18all amounts are stated in Euros
Balance as of 01 January 53,642 37,954
Release of provision (22,688) (7,000)
Amount accrued at year end - 22,688
Provisions, total 30,954 53,642
MOVEMENTS IN PROVISIONS
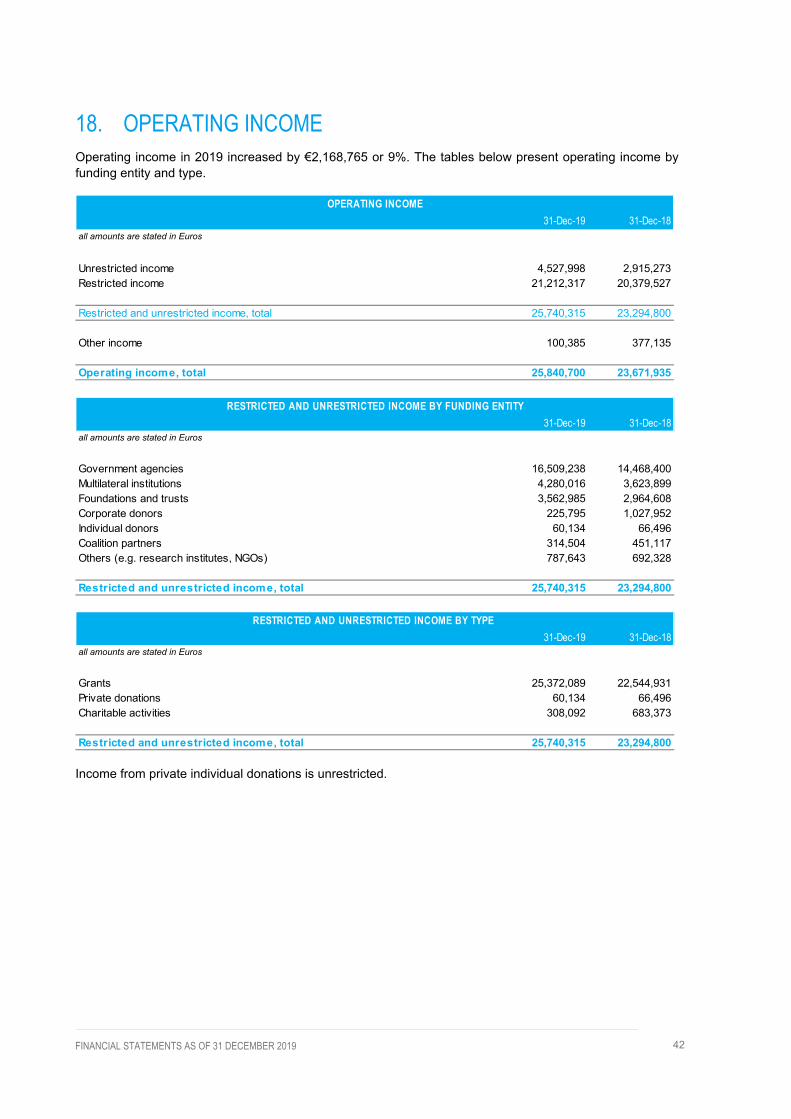
42 FINANCIAL STATEMENTS AS OF 31 DECEMBER 2019
18. OPERATING INCOME Operating income in 2019 increased by €2,168,765 or 9%. The tables below present operating income by funding entity and type.
Income from private individual donations is unrestricted.
31-Dec-19 31-Dec-18all amounts are stated in Euros
Unrestricted income 4,527,998 2,915,273Restricted income 21,212,317 20,379,527
Restricted and unrestricted income, total 25,740,315 23,294,800
Other income 100,385 377,135
Operating income, total 25,840,700 23,671,935
OPERATING INCOME
31-Dec-19 31-Dec-18all amounts are stated in Euros
Government agencies 16,509,238 14,468,400Multilateral institutions 4,280,016 3,623,899Foundations and trusts 3,562,985 2,964,608Corporate donors 225,795 1,027,952Individual donors 60,134 66,496Coalition partners 314,504 451,117Others (e.g. research institutes, NGOs) 787,643 692,328
Restricted and unrestricted income, total 25,740,315 23,294,800
RESTRICTED AND UNRESTRICTED INCOME BY FUNDING ENTITY
31-Dec-19 31-Dec-18all amounts are stated in Euros
Grants 25,372,089 22,544,931Private donations 60,134 66,496Charitable activities 308,092 683,373
Restricted and unrestricted income, total 25,740,315 23,294,800
RESTRICTED AND UNRESTRICTED INCOME BY TYPE

43 FINANCIAL STATEMENTS AS OF 31 DECEMBER 2019
18.a Unrestricted income
31-Dec-19 31-Dec-18all amounts are stated in Euros
Government agenciesSw edish International Development Cooperation Agency (SIDA) Sw eden 1,947,143 475,000Ministry of Foreign Affairs Netherlands 673,434 485,000Ministry of Foreign Affairs of Denmark (Danida) Denmark 665,053 432,708Irish Aid Ireland 500,000 200,000Sw iss Agency for Development and Cooperation (SDC) Sw itzerland 400,000 458,622Ministry for Foreign Affairs of Finland Finland - 600,000
Government agencies, total 4,185,630 2,651,330
Foundations and trustsStichting Adessium 132,994 97,006Sigrid Rausing Trust 82,458 72,691
Foundations and trusts, total 215,452 169,697
Corporate donorsSNAM S.p.A. 50,000 - Equinor ASA 7,500 5,000Pernod Ricard 5,000 2,500Microsoft Corporation 3,750 7,500ENEL S.p.A. 532 1,250Google LLC - 5,000Velik AB - 4,000FTI Consulting - 2,500
Corporate donors, total 66,782 27,750
Individual donorsNicolas Nemery 3,000 - Soren Fabian Heupel 2,270 1,400Patrick Kinsch 2,000 2,000Giovanna Longo 1,800 1,500Rolf Hellenbrand 1,800 2,700Joachim Terschluesen 1,689 - Johannes Wery 1,500 1,500Johann Peter Jessen 1,485 2,750R. Broscious JR 1,352 - Gregory Thomas 1,143 - Mellennesse Blackbird 1,049 - Laurenz Reichl 1,000 1,000Hildegard Wiemer 1,000 - Carlos Palacios 500 1,200Irene Staehelin - 8,856Poul Martin Rasmussen - 2,679Ulrich Rueckert - 1,571Sebastian Hoogenberk - 1,000Other (less than Euro 1,000 each) 38,546 38,340
Individual donors, total 60,134 66,496
Unrestricted income, total 4,527,998 2,915,273
UNRESTRICTED INCOME

44 FINANCIAL STATEMENTS AS OF 31 DECEMBER 2019
18.b Restricted income
31-Dec-19 31-Dec-18all amounts are stated in Euros
Government agenciesDepartment for International Development (DfID) United Kindgom 4,373,807 3,504,581 Department of Foreign Affairs, Trade and Development (DFATD) Canada 2,443,900 2,152,246 Bundesministerium für w irtschaftliche Zusammenarbeit und Entw icklung (BMZ)
Germany 1,348,310 1,530,938
Department of Foreign Affairs and Trade (DFAT) Australia 1,343,572 1,038,370 Ausw ärtiges Amt Germany 1,029,862 423,969 U.S. Department of State United States 743,799 602,765 Government of the Republic of Korea South Korea 285,307 - Bundesministerium fur Umw elt, Naturschutz und nukleare Sicherheit (BMU)
Germany 252,791 799,307
Ministry of Foreign Affairs of Denmark (Danida) Denmark 127,086 1,146,833 Irish Aid Ireland 118,839 100,001 Ministère des Affaires étrangères et du Développement international France 98,210 1,790 Gesellschaft für internationale Zusammenarbeit (GIZ) Germany 56,034 344,387 SPF Affaires étrangères, Commerce extérieur et Coopération au Développement
Belgium 42,542 101,154
Ministry of Foreign Affairs Estonia 40,000 63,468
Ministry of Foreign Affairs and Trade New Zealand 19,549 - Ministry of Foreign Affairs Norw ay - 7,261
Government agencies, total 12,323,608 11,817,070
Multilateral institutionsEuropean Commission 4,042,911 3,492,273 European Bank for Reconstruction and Development (EBRD) 105,975 13,717 Inter-American Development Bank (IDB) 65,699 - United Nations Office on Drugs and Crime (UNODC) 50,344 76,643 United Nations Women 15,087 1,992 United Nations Development Programme (UNDP) - 21,473 United Nations Office for Project Services (UNOPS) - 12,006 International Fund for Agricultural Development (IFAD) - 5,795
Multilateral institutions, total 4,280,016 3,623,899
Foundations and trustsBHP Foundation 1,904,449 1,049,313 Foundation Open Society Institute (FOSI) 350,275 891,227 Stichting Adessium 232,597 174,594 Open Society Institute, Development Foundation 168,771 106,668 William and Flora Hew lett Foundation 165,276 159,613 Ford Foundation 153,956 18,300
RESTRICTED INCOME

45 FINANCIAL STATEMENTS AS OF 31 DECEMBER 2019
A reconciliation of the income recognised against the cash received by funding entity is presented in Annex 1 of these financial statements. A reconciliation of income recognised against expenditure incurred by funding entity and project is presented in Annex 2 of these financial statements.
31-Dec-19 31-Dec-18all amounts are stated in Euros
Foundation to Promote Open Society 130,519 88,413 Omidyar Netw ork 100,259 116,980 Open Society Initiative for Europe 62,930 - WPF 51,924 73,843 John D. and Catherine T. MacArthur Foundation 19,203 - The Tides Center 7,374 20,615 Fidelity Charitable - 62,356
European Climate Foundation - 29,500
World Wide Web Foundation - 3,489
Foundations and trusts, total 3,347,533 2,794,911
Corporate donorsEYGS LLP 158,314 512,201 Siemens AG (Siemens Integrity Initiative) 699 488,001
Corporate donors, total 159,013 1,000,202
Coalition partnersTransparency International UK 180,470 200,715 Transparency International France 121,203 229,853 Transparency International Netherlands 6,508 - Proetica - Capitulo Peruano de Transparency International 6,323 - Rencontre pour la paix et les droits de l'homme - 12,743 Transparency International Hungary - 7,806
Coalition partners, total 314,504 451,117
Other (research institutes, other NGOs, other)Journalism Development Netw ork (JDN) 452,207 396,014 Christian Michelsen Institute (CMI) 142,404 141,273 International Association of Women Judges (IAWJ) 90,692 95,147 Financial Transparency Coalition 84,293 57,081 Citizens for Europe 6,000 - Civil Forum for Asset Recovery e.V. (CiFAR) 5,160 571 Other (less than Euro 1,000 each) 6,887 - n-ost - Netzw erk für Osteuropa-Berichterstattung e.V. - 2,242
Other (research institutes, other NGOs, other), total 787,643 692,328
Restricted income, total 21,212,317 20,379,527
RESTRICTED INCOME

46 FINANCIAL STATEMENTS AS OF 31 DECEMBER 2019
18.c Other income
Other income under “IACC fees” represents the share of the net fees from the International Anti-Corruption Conference (IACC) attributed to the Secretariat. Additional detailed disclosure on the finances of the IACC are provided on their website at www.iaccseries.org.
19. RELATED PARTY TRANSACTIONS IAS 24:9 notes that a related party is a person or entity that:
• Has control or joint control of the reporting entity; • Has a significant influence over the reporting entity; or • Is a member of the key management personnel of the reporting entity or of a parent of the
reporting entity.
Members of the Board of Directors and the Senior Management Team (SMT) constitute the key management personnel of the organisation for the year 2019 and are therefore considered related parties. Board Directors do not receive any remuneration; however, they received reimbursements totaling €37.340 (in 2018: €25,740). Senior Management Team members are employed by the entity and received salaries of €535.475 (in 2018: €418,877), not including pension contributions of €7,500 (in 2018: €9,375) and reimbursements of €3.230 (in 2018: €5,816).
Partners, including National Chapters, National Chapters in Formation and Contact groups, are legally and financially independent organisations registered in their countries. As such, the Secretariat cannot exert control or significantly influence them and no partner has, by itself, control or significant influence on the Secretariat.
20. STAFF COSTS Staff costs include salaries, wage tax and social security contributions for all staff, as well as contributions to an individual pension plan for directors.
31-Dec-19 31-Dec-18all amounts are stated in Euros
Maternity leave reimbursments 62,766 17,144 Travel expense reimbursements 18,733 43,317 Speakers' fees 1,975 150 Other 16,911 21,638 IACC fees - 294,886
Other income, total 100,385 377,135
OTHER INCOME
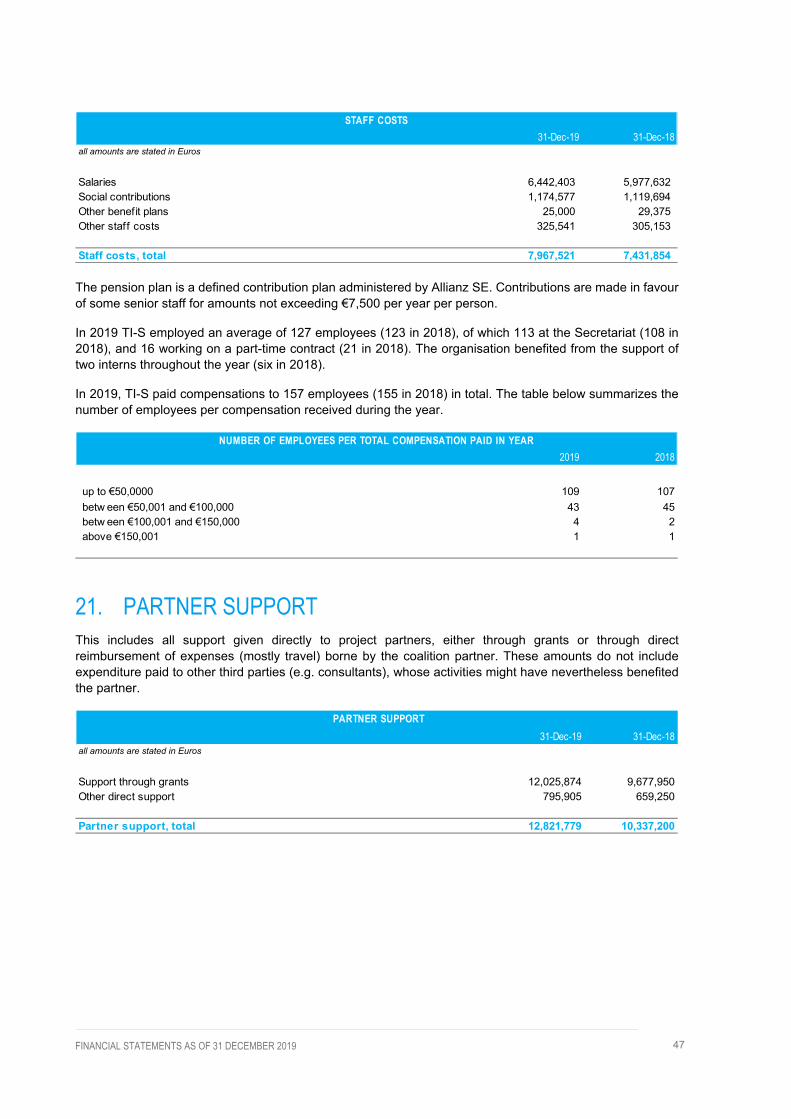
47 FINANCIAL STATEMENTS AS OF 31 DECEMBER 2019
The pension plan is a defined contribution plan administered by Allianz SE. Contributions are made in favour of some senior staff for amounts not exceeding €7,500 per year per person.
In 2019 TI-S employed an average of 127 employees (123 in 2018), of which 113 at the Secretariat (108 in 2018), and 16 working on a part-time contract (21 in 2018). The organisation benefited from the support of two interns throughout the year (six in 2018).
In 2019, TI-S paid compensations to 157 employees (155 in 2018) in total. The table below summarizes the number of employees per compensation received during the year.
21. PARTNER SUPPORT This includes all support given directly to project partners, either through grants or through direct reimbursement of expenses (mostly travel) borne by the coalition partner. These amounts do not include expenditure paid to other third parties (e.g. consultants), whose activities might have nevertheless benefited the partner.
31-Dec-19 31-Dec-18all amounts are stated in Euros
Salaries 6,442,403 5,977,632 Social contributions 1,174,577 1,119,694 Other benefit plans 25,000 29,375 Other staff costs 325,541 305,153
Staff costs, total 7,967,521 7,431,854
STAFF COSTS
2019 2018
up to €50,0000 109 107betw een €50,001 and €100,000 43 45betw een €100,001 and €150,000 4 2above €150,001 1 1
NUMBER OF EMPLOYEES PER TOTAL COMPENSATION PAID IN YEAR
31-Dec-19 31-Dec-18all amounts are stated in Euros
Support through grants 12,025,874 9,677,950Other direct support 795,905 659,250
Partner support, total 12,821,779 10,337,200
PARTNER SUPPORT

48 FINANCIAL STATEMENTS AS OF 31 DECEMBER 2019
Annex 3 of these financial statements includes a detailed breakdown by coalition partner of the expenditure supported by TI-S.
22. OTHER EXPENSES
23. SUPPORT COSTS
31-Dec-19 31-Dec-18all amounts are stated in Euros
Coalition partnersEurope and Central Asia 5,342,969 3,787,320 Americas 1,052,845 1,617,669 Sub-Saharan Africa 1,708,299 1,514,190 Middle-East and North Africa 513,302 198,346
Asia-Pacif ic 2,651,093 1,831,728
Coalition partners, total 11,268,508 8,949,253
Other project partners 1,553,271 1,387,947
Partner support, total 12,821,779 10,337,200
PARTNER SUPPORT
31-Dec-19 31-Dec-18all amounts are stated in Euros
Honoraria 2,062,245 1,916,347Travel expenses 1,257,078 1,867,972Maintenance, rent and leasing costs 252,670 574,299VAT not deductible 322,203 457,437Miscellaneous expenses 319,206 216,850Publications and communications 106,795 158,053Audits, Legal & advisory costs 524,495 319,796Office supplies 41,740 29,635
Other expenses, total 4,886,432 5,540,388
OTHER EXPENSES
31-Dec-19 31-Dec-18all amounts are stated in Euros
Support costs 2,217,217 2,254,716 Operating expenditure 25,957,630 23,364,025
Support costs as % of operating expenditure 9% 10%
SUPPORT COST

49 FINANCIAL STATEMENTS AS OF 31 DECEMBER 2019
24. COMMITMENTS AND CONTINGENCIES TI-S has commitments related to non-cancellable operating leases for buildings and office equipment. Total future minimum operating lease payments are as follows:
No contingent assets or liabilities to be disclosed in compliance with IAS 37 have been identified.
25. FINANCIAL RESULT
26. SUBSEQUENT EVENTS The outbreak of the pandemic caused by the virus COVID-19 has created significant challenges worldwide and impacted TI-S ways of working, e.g. by requiring staff to work from home for extended periods and events to be cancelled in 2020. However, none of these changes had impacts that require disclosure as subsequent event as per IAS 10. No other event occurred after 31 December 2019 requiring such disclosure.
additional property ex penses equipment additional property ex penses equipment
all amounts are stated in Euros
w ithin 1 year 79,573 14,721 268,576 16,199 betw een 2-5 years 112,729 38,626 593,189 53,347 more than 5 years - - - -
Commitments total 192,302 53,347 861,765 69,546
MINIMUM LEASE PAYMENTS
31-Dec-19 31-Dec-18
31-Dec-19 31-Dec-18all amounts are stated in Euros
InterestInterest income 500 596Interest cost (26,872) (499)Interest on leases (20,090) -
Interest cost or income, net (46,462) 97
Currency translationRealised gains on foreign exchange translation 11,415 8,616Realised losses on foreign exchange translation (24,987) (16,941)Unrealised gains and losses on foreign exchange translation 14,336 14,831
Gain or loss on currency translation, net 764 6,506
Gain or loss on investment portfolio 505,223 (157,610)
Financial result, net 459,525 (151,007)
FINANCIAL RESULT

50 FINANCIAL STATEMENTS AS OF 31 DECEMBER 2019
ANNEXES

Annex 1 -Donor funding schedule
B
Donor name Accrued Deferred Restricted Unrestricted Accrued Deferred
all amounts are stated in Euros
Government agencies
Auswärtiges Amt Germany (20,454) 20,851 1,056,196 (1,029,862) 26,732 26,731
Bundesministerium fur Umwelt, Naturschutz und nukleare
Sicherheit (BMU) Germany (351,526) 2,389 542,919 (252,791) (59,009) (158,209) 99,200
Bundesministerium für wirtschaftliche Zusammenarbeit und
Entwicklung (BMZ) Germany (34,494) 4,508 1,381,368 (1,348,310) 3,072 3,072
Department for International Development (DfID) UK
Project: FAST Open Contracting for Health Sector 223,750 689,455 (1,040,651) (127,446) (127,446)
Project: I-ACT Defense and Security 37,909 986,603 (1,434,354) (409,841) (409,841)
Project: I-ACT Global Standards (422) 904,566 (1,142,077) (237,935) (237,935)
Project: I-ACT Tracking Summit Commitments 7,202 496,648 (632,305) (128,455) (128,455)
Project: Legend - Land in Africa 70,925 57,673 (128,597)
Project: London Summit (4,177) 4,177
Department of Foreign Affairs and Trade (DFAT) Australia 601,545 1,038,648 (1,343,572) 296,621 296,621
Department of Foreign Affairs, Trade and Development
(DFATD) Canada 2,262,972 912,146 (2,443,900) 731,218 731,218
Gesellschaft für internationale Zusammenarbeit (GIZ) Germany 22,708 190,227 (56,034) 156,902 156,902
Government of the Republic of Korea South Korea 302,556 (285,307) 17,248 17,248
Irish Aid Ireland 279,626 460,000 (118,839) (500,000) 120,787 120,787
Ministère des Affaires étrangères et du Développement
international France 98,210 (98,210)
Ministry of Foreign Affairs Estonia 40,000 40,000 (40,000) 40,000 40,000
This schedule summarises the movements of funding by Donor. At the beginning of the year TI-S had either unused resources (deferred income) from contributors or had advanced its own resources on
donor-funded projects (accrued income), on the expectation of a future receipt. During the year, TI-S received additional financial resources (cash received/repaid). The sum of initial balances and resources
received constitutes the total available resources for the year. These were employed in the performance of activities, and, as such, recognised as income. At year-end, if the difference between available
resources and income recognised constituted the final balance with the donor, expressed as deferred income (resources received in excess of activities performed) or accrued income.
This annex rolls forward donor balances and shows actual cash flows by donor in the year.
A C D = A + B + C
Cash received/
(paid) during the
year
Income recognisedClosing
balance
of which:Funds available at 01-Jan
Annex 1 - page 1
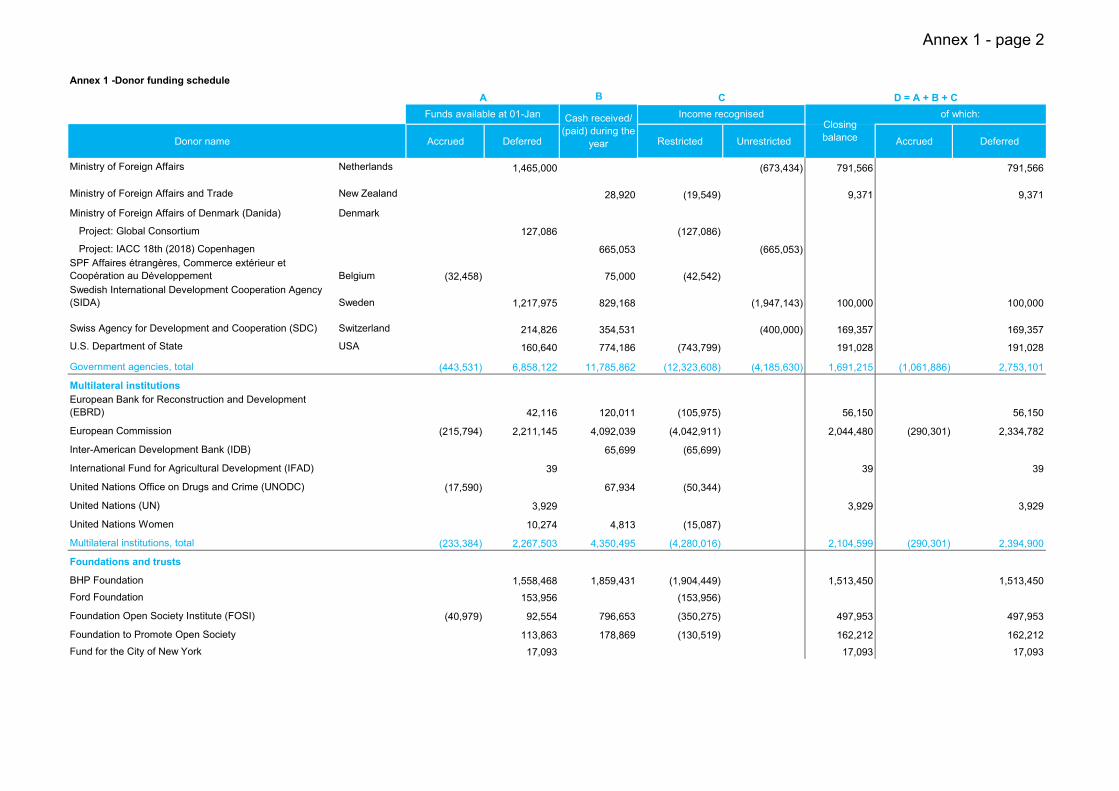
Annex 1 -Donor funding schedule
B
Donor name Accrued Deferred Restricted Unrestricted Accrued Deferred
Ministry of Foreign Affairs Netherlands 1,465,000 (673,434) 791,566 791,566
Ministry of Foreign Affairs and Trade New Zealand 28,920 (19,549) 9,371 9,371
Ministry of Foreign Affairs of Denmark (Danida) Denmark
Project: Global Consortium 127,086 (127,086)
Project: IACC 18th (2018) Copenhagen 665,053 (665,053)
SPF Affaires étrangères, Commerce extérieur et
Coopération au Développement Belgium (32,458) 75,000 (42,542)
Swedish International Development Cooperation Agency
(SIDA) Sweden 1,217,975 829,168 (1,947,143) 100,000 100,000
Swiss Agency for Development and Cooperation (SDC) Switzerland 214,826 354,531 (400,000) 169,357 169,357
U.S. Department of State USA 160,640 774,186 (743,799) 191,028 191,028
Government agencies, total (443,531) 6,858,122 11,785,862 (12,323,608) (4,185,630) 1,691,215 (1,061,886) 2,753,101
Multilateral institutions
European Bank for Reconstruction and Development
(EBRD) 42,116 120,011 (105,975) 56,150 56,150
European Commission (215,794) 2,211,145 4,092,039 (4,042,911) 2,044,480 (290,301) 2,334,782
Inter-American Development Bank (IDB) 65,699 (65,699)
International Fund for Agricultural Development (IFAD) 39 39 39
United Nations Office on Drugs and Crime (UNODC) (17,590) 67,934 (50,344)
United Nations (UN) 3,929 3,929 3,929
United Nations Women 10,274 4,813 (15,087)
Multilateral institutions, total (233,384) 2,267,503 4,350,495 (4,280,016) 2,104,599 (290,301) 2,394,900
Foundations and trusts
BHP Foundation 1,558,468 1,859,431 (1,904,449) 1,513,450 1,513,450
Ford Foundation 153,956 (153,956)
Foundation Open Society Institute (FOSI) (40,979) 92,554 796,653 (350,275) 497,953 497,953
Foundation to Promote Open Society 113,863 178,869 (130,519) 162,212 162,212
Fund for the City of New York 17,093 17,093 17,093
A C D = A + B + C
Funds available at 01-Jan Cash received/
(paid) during the
year
Income recognisedClosing
balance
of which:
Annex 1 - page 2

Annex 1 -Donor funding schedule
B
Donor name Accrued Deferred Restricted Unrestricted Accrued Deferred
John D. and Catherine T. MacArthur Foundation 35,376 (19,203) 16,173 16,173
Omidyar Network 82,826 15,000 (100,259) (2,433) (2,433)
Open Society Institute, Development Foundation 101,792 332,929 (168,771) 265,950 265,950
Open Society Initiative for Europe 45,288 (62,930) (17,643) (17,643)
Sigrid Rausing Trust 72,406 111,201 (82,458) 101,150 101,150
Stichting Adessium (52,698) 216,407 448,234 (232,597) (132,994) 246,351 246,351
The Tides Center 7,374 (7,374)
William and Flora Hewlett Foundation 131,375 212,513 (165,276) 178,612 178,612
WPF 50,475 1,449 (51,924)
Foundations and trusts, total (93,677) 2,598,589 4,036,941 (3,347,533) (215,452) 2,978,868 (20,076) 2,998,944
Corporate donors
Duff & Phelps 2,376 2,376 2,376
ENEL S.p.A. 3,750 (47) (532) 3,171 3,171
Equinor ASA (7,000) 9,500 5,000 (7,500) (7,000) 7,000
EYGS LLP 158,314 (158,314)
FTI Consulting 2,500 5,000 7,500 7,500
Google LLC 2,500 7,500 10,000 10,000
Microsoft Corporation 3,750 (3,750)
Norsk Hydro ASA 21,000 21,000 21,000
Pernod Ricard 2,500 5,000 (5,000) 2,500 2,500
Sanlam Life Insurance Limited 14,000 14,000 14,000
Siemens AG (Siemens Integrity Initiative) (80,111) 80,809 (699)
SNAM S.p.A. 36,000 100,000 (50,000) 86,000 86,000
Stora Enso Oyj (7,000) 14,000 7,000 14,000 14,000
Telenor ASA (7,000) 7,000 (7,000) 7,000
Corporate donors, total (101,111) 274,814 212,639 (159,013) (66,782) 160,547 (14,000) 174,547
A C D = A + B + C
Funds available at 01-Jan Cash received/
(paid) during the
year
Income recognisedClosing
balance
of which:
Annex 1 - page 3

Annex 1 -Donor funding schedule
B
Donor name Accrued Deferred Restricted Unrestricted Accrued Deferred
Coalition partners
Transparency International France 276,000 (121,203) 154,797 154,797
Transparency International Netherlands 6,508 (6,508)
Transparency International UK (135,058) 298,062 (180,470) (17,466) (83,794) 66,328
Rencontre pour la paix et les droits de l'homme (RPDH) (27,352) 20,868 (6,484) (27,352) 20,868
Proetica - Capitulo Peruano de Transparency International 6,323 (6,323)
Coalition partners, total (162,410) 27,191 580,570 (314,504) 130,847 (111,146) 241,993
Others (e.g. research institutes, NGOs)
Christian Michelsen Institute (CMI) (40,301) 145,501 (142,404) (37,204) (37,204)
Citizens for Europe 6,000 (6,000)
Civil Forum for Asset Recovery e.V. (CiFAR) 3,727 1,433 (5,160)
Financial Transparency Coalition 15,377 70,908 (84,293) 1,992 1,992
International Association of Women Judges (IAWJ) (7,565) 88,398 (90,692) (9,859) (9,859)
International Federation of Inspection Agencies (7,000) 10,500 3,500 (7,000) 10,500
International Institute for Democracy and Electoral
Assistance (IDEA) 2,450 2,450 2,450
Journalism Development Network (JDN) (151,169) 24,571 647,230 (452,207) 68,425 (149,856) 218,281
Movement Fundraising Fund (Internal Donor) 76,165 76,165 76,165
Univeristy of Birmingham (2,500) (2,500) (2,500)
Other (less than 1k) 7,800 (6,887) 912 912
Others (e.g. research institutes, NGOs), total (208,535) 132,790 967,270 (787,643) 103,881 (206,419) 310,300
Individual donors (9,695) 59,451 (60,134) (7,652) (7,652)
Adjustments
Grand totals (1,252,343) 12,159,009 21,993,228 (21,212,317) (4,527,998) 7,162,305 (1,711,480) 8,873,785
reference to financial statements note 5 14 * 18.b 18.a 5 14
* These transactions are part of the entity's operating cash flows and includes any transfers to Debtors.
A C D = A + B + C
Funds available at 01-Jan Cash received/
(paid) during the
year
Income recognisedClosing
balance
of which:
Annex 1 - page 4

Detailed programme information: Summary
Victims of
corruptions, ALACs
and Whistleblowing
Public demand for
accountability and
SDG
Anti-corruption
civil society
space
Money in
politicsBusiness integrity Grand corruption
Knowledge and
research - What
works
Organisational
standardsStrong presence
all amounts are stated in Euros
Restricted income
Government agencies 257,689 3,321,985 492,583 30,000 70,000 200,000 3,107,931 98,210 3,107,309 1,642,077 (4,175) 12,323,610
Multilateral institutions 90,352 1,333,009 192,170 765,850 477,657 1,420,532 446 4,280,015
Foundations and trusts 229,605 422,616 1,923,652 9,246 255,203 507,210 3,347,533
Corporate donors 699 158,314 159,012
Coalition partners 121,203 73,376 6,323 113,602 314,504
Other (research institutes, other NGOs, other) 90,692 536,499 142,404 18,047 787,643
Other income 118 12,218 3,344 3,828 (0) 4,334 420 64,226 5,239 6,658 100,385
Financial results 219 (2,368) 19 19 (81) (124) (4,606) 699 (6,930) (452) 495,795 (2,575) 479,615
A - Restricted and other income, total 699,187 5,178,152 495,946 192,170 1,954,370 1,385,343 978,250 4,528,191 354,532 3,173,755 1,712,175 497,305 642,942 21,792,317
Staff costs 155,004 1,211,991 264,588 42,662 163,146 666,915 433,336 1,532,756 100,652 62,937 3,173,151 (743,298) 903,680 7,967,521
Partner support 552,883 3,319,340 82,013 138,518 1,758,354 752,872 432,917 2,508,783 327,869 3,100,560 146,024 39,139 (337,492) 12,821,779
Other 67,970 722,594 152,961 16,672 64,384 259,202 177,641 928,689 74,179 10,258 1,387,331 1,060,289 266,249 5,188,419
B - Project costs, total 775,857 5,253,925 499,561 197,852 1,985,884 1,678,989 1,043,894 4,970,229 502,700 3,173,755 4,706,505 356,130 832,437 25,977,720
B-A - Utilisation of unrestricted funds by project 76,671 75,773 3,615 5,682 31,514 293,647 65,644 442,038 148,168 - 2,994,330 (141,175) 189,495 4,185,403
Total unrestricted income 4,527,998
Surplus for the year 342,595
Additional information included at: Page 2 Page 3, 4 Page 5 Page 5 Page 5 Page 6 Page 7 Page 8 Page 9 Page 9 Page10
This is a schedule of the project finances at the Secretariat detailing, for each project undertaken by the organisation, it details the restricted contributions (by donor) and expenditure incurred (by type). The difference between such income and expenditure
represents the project’s impact on unrestricted income. The Annex presents projects considering their contribution to the implementation of the strategy.
Other entit ies
TOTALCategory
Essential fundtions
Other costs (incl. reallocation of
support costs)
People and Partners Strong movement
Other international partnerships
Prevention, enforcement and justice
Annex 2 - page 1
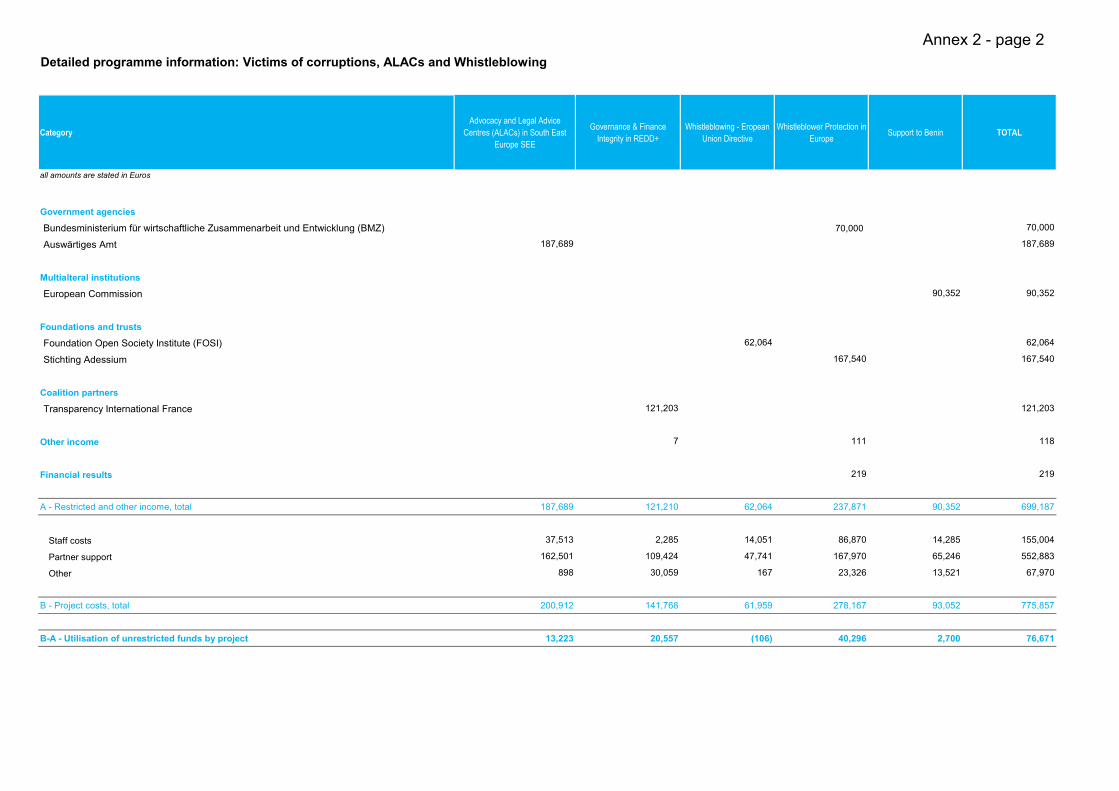
Detailed programme information: Victims of corruptions, ALACs and Whistleblowing
Category
Advocacy and Legal Advice
Centres (ALACs) in South East
Europe SEE
Governance & Finance
Integrity in REDD+
Whistleblowing - Eropean
Union Directive
Whistleblower Protection in
EuropeSupport to Benin TOTAL
all amounts are stated in Euros
Government agencies
Bundesministerium für wirtschaftliche Zusammenarbeit und Entwicklung (BMZ) 70,000 70,000
Auswärtiges Amt 187,689 187,689
Multialteral institutions
European Commission 90,352 90,352
Foundations and trusts
Foundation Open Society Institute (FOSI) 62,064 62,064
Stichting Adessium 167,540 167,540
Coalition partners
Transparency International France 121,203 121,203
Other income 7 111 118
Financial results 219 219
A - Restricted and other income, total 187,689 121,210 62,064 237,871 90,352 699,187
Staff costs 37,513 2,285 14,051 86,870 14,285 155,004
Partner support 162,501 109,424 47,741 167,970 65,246 552,883
Other 898 30,059 167 23,326 13,521 67,970
B - Project costs, total 200,912 141,768 61,959 278,167 93,052 775,857
B-A - Utilisation of unrestricted funds by project 13,223 20,557 (106) 40,296 2,700 76,671
Annex 2 - page 2

Detailed programme information: Public demand for accountability and SDG
CategoryPublic demand for accountabi ity
and SDG
Climate Governance
Integrity
Women, Land and
Corruption IV
Land and Corruption in
AfricaLegend - Land in Africa
Integrity Pacts - Civil Control
Mechanism for Safeguarding EU
Funds (Phase 2)
UNODC CRIMJUST Corrupt Money FlowsMonitoring Global
Commitments
all amounts are stated in Euros
Government agencies
Bundesministerium für Umwelt, Naturschutz, Bau und Reaktorsicherheit (BMUB) 252,791
Bundesministerium für wirtschaftliche Zusammenarbeit und Entwicklung (BMZ) 478,310
Department for International Development (DfID) 128,597
Department of Foreign Affairs, Trade and Development (DFATD), Canada
Gesellschaft für internationale Zusammenarbeit (GIZ)
SPF Affaires étrangères, Commerce extérieur et Coopération au Développement
Multialteral institutions
European Commission 1,277,269
United Nations Office on Drugs and Crime (UNODC) 50,344
Foundations and trusts
Foundation to Promote Open Society
Open Society Institute, Development Foundation
The Tides Center
WFP 51,924
William and Flora Hewlett Foundation 165,276
Other (research institutes, other NGOs, other)
International Association of Women Judges
Other income 149 201 887
Financial results 105 (72) 66 (28) (90) 3
A - Restricted and other income, total 0 252,791 52,028 478,387 128,864 1,277,241 50,253 166,166
Staff costs 4,079 43,199 12,938 137,499 22,354 205,397 20,426 78,995 45,999
Partner support 200,022 244,591 81,246 1,036,291 24,826 61,207
Other 2,430 10,820 39,090 96,298 25,258 32,274 10,367 25,964 18,439
B - Project costs, total 6,509 254,041 52,029 478,388 128,858 1,273,962 55,619 166,166 64,438
B-A - Utilisation of unrestricted funds by project 6,509 1,250 0 0 (7) (3,279) 5,366 0 64,438
Annex 2 - page 3

Detailed programme information: Public demand for accountability and SDG
Category
Integrity, Mobilisation,
Participation, Anti-
Corruption and
Transparency
National Integrity Systems -
Western Balkans
Vietnam Open Governance
Partnership
Access to Information
Venezuela
Impact for Open
Governance
Impact for Open
Governance (2019/20)
Africa's Anti-Corruption
Commitment
Corruption’s Impact on
Women IITOTAL
all amounts are stated in Euros
Government agencies
Bundesministerium für Umwelt, Naturschutz, Bau und Reaktorsicherheit (BMUB) 252,791
Bundesministerium für wirtschaftliche Zusammenarbeit und Entwicklung (BMZ) 478,310
Department for International Development (Df D) 128,597
Department of Foreign Affairs, Trade and Development (DFATD), Canada 2,443,900 2,443,900
Gesellschaft für internationale Zusammenarbeit (GIZ) (24,156) (24,156)
SPF Affaires étrangères, Commerce extérieur et Coopération au Développement 42,542 42,542
Multialteral institutions
European Commission 5,397 1,282,666
United Nations Office on Drugs and Crime (UNODC) 50,344
Foundations and trusts
Foundation to Promote Open Society 113,863 16,656 130,519
Open Society Institute, Development Foundation 67,524 67,524
The Tides Center 7,374 7,374
WFP 51,924
William and Flora Hewlett Foundation 165,276
Other (research institutes, other NGOs, other)
International Association of Women Judges 90,692 90,692
Other income 1,679 7,093 1,564 645 12,218
Financial results (2,774) 80 335 7 (2,368)
A - Restricted and other income, total 2,442,805 5,397 42,621.85 74,952 122,801 16,656 (24,148) 91,337 5,178,153
Staff costs 495,143 4,326 4,206 5,896 66,374 16,571 9,596 38,992 1,211,991
Partner support 1,486,964 (128) 39,885 48,677 39,879 55,881 3,319,340
Other 436,943 503 127 14 20,700 85 68 3,214 722,594
B - Project costs, total 2,419,049 4,701 44,219 54,587 126,952 16,656 9,664 98,087 5,253,925
B-A - Utilisation of unrestricted funds by project (23,756) (696) 1,597 (20,365) 4,152 - 33,813 6,750 75,773
Annex 2 - page 4
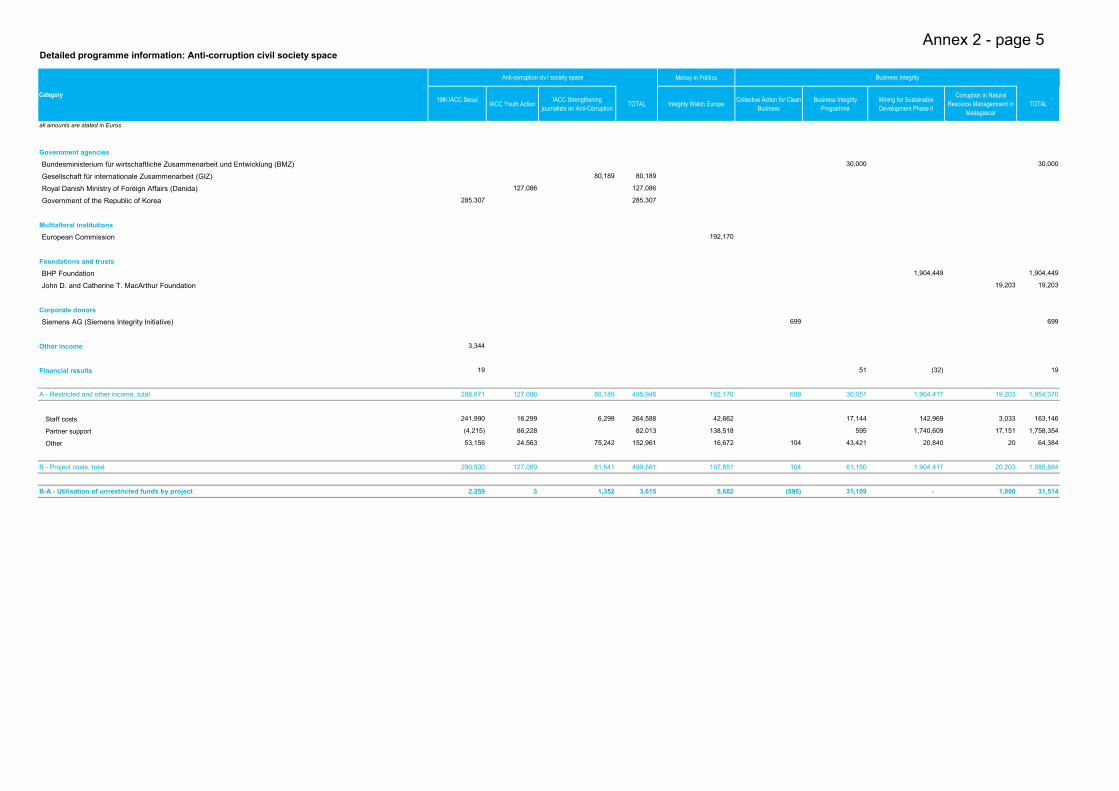
Detailed programme information: Anti-corruption civil society space
Money in Politics
19th IACC SeoulIACC Youth Action
IACC Strengthening
journalists on Anti-Corruption TOTAL Integrity Watch Europe
Collective Action for Clean
Business
Business Integrity
Programme
Mining for Sustainable
Development Phase II
Corruption in Natural
Resource Managemnent in
Madagascar
TOTAL
all amounts are stated in Euros
Government agencies
Bundesministerium für wirtschaftliche Zusammenarbeit und Entwicklung (BMZ) 30,000 30,000
Gesellschaft für internationale Zusammenarbeit (GIZ) 80,189 80,189
Royal Danish Ministry of Foreign Affairs (Danida) 127,086 127,086
Government of the Republic of Korea 285,307 285,307
Multialteral institutions
European Commission 192,170
Foundations and trusts
BHP Foundation 1,904,449 1,904,449
John D. and Catherine T. MacArthur Foundation 19,203 19,203
Corporate donors
Siemens AG (Siemens Integrity Initiative) 699 699
Other income 3,344
Financial results 19 51 (32) 19
A - Restricted and other income, total 288,671 127,086 80,189 495,946 192,170 699 30,051 1,904,417 19,203 1,954,370
Staff costs 241,990 16,299 6,299 264,588 42,662 17,144 142,969 3,033 163,146
Partner support (4,215) 86,228 82,013 138,518 595 1,740,609 17,151 1,758,354
Other 53,156 24,563 75,242 152,961 16,672 104 43,421 20,840 20 64,384
B - Project costs, total 290,930 127,089 81,541 499,561 197,851 104 61,160 1,904,417 20,203 1,985,884
B-A - Utilisation of unrestricted funds by project 2,259 3 1,352 3,615 5,682 (595) 31,109 - 1,000 31,514
Category
Business IntegrityAnti-corruption civ l society space
Annex 2 - page 5
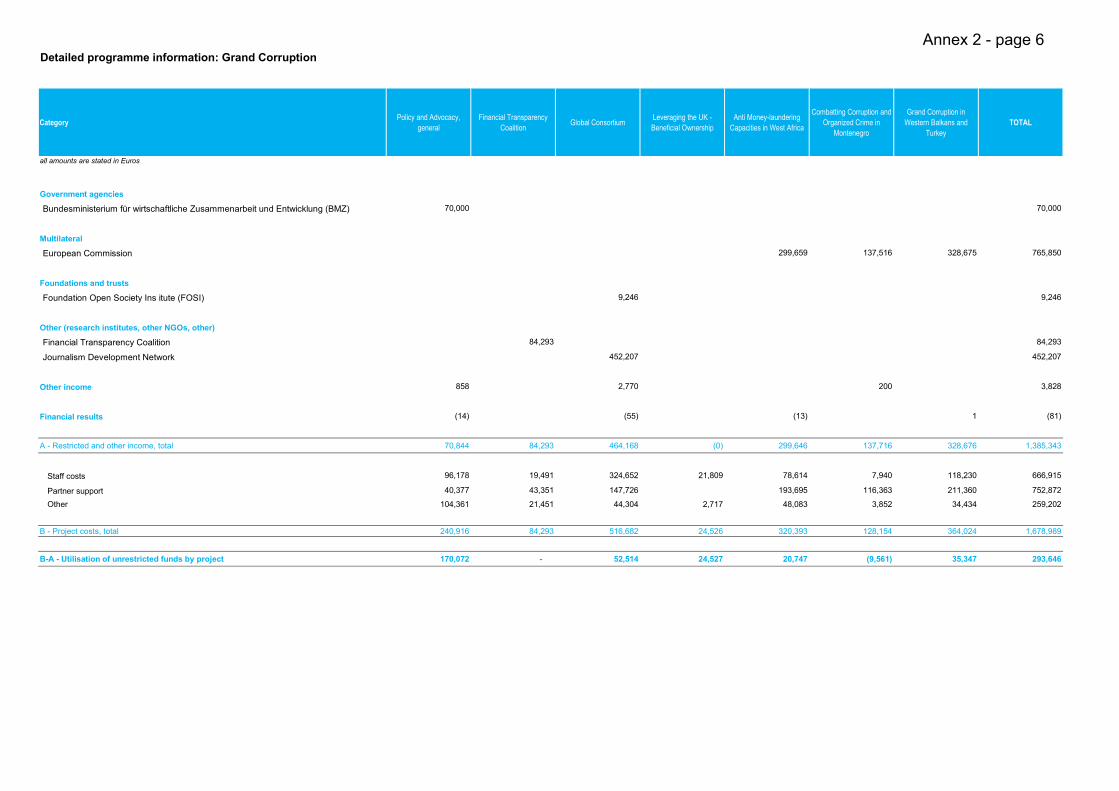
Detailed programme information: Grand Corruption
CategoryPolicy and Advocacy,
general
Financial Transparency
CoalitionGlobal Consortium
Leveraging the UK -
Beneficial Ownership
Anti Money-laundering
Capacities in West Africa
Combatting Corruption and
Organized Crime in
Montenegro
Grand Corruption in
Western Balkans and
Turkey
TOTAL
all amounts are stated in Euros
Government agencies
Bundesministerium für wirtschaftliche Zusammenarbeit und Entwicklung (BMZ) 70,000 70,000
Multilateral
European Commission 299,659 137,516 328,675 765,850
Foundations and trusts
Foundation Open Society Ins itute (FOSI) 9,246 9,246
Other (research institutes, other NGOs, other)
Financial Transparency Coalition 84,293 84,293
Journalism Development Network 452,207 452,207
Other income 858 2,770 200 3,828
Financial results (14) (55) (13) 1 (81)
A - Restricted and other income, total 70,844 84,293 464,168 (0) 299,646 137,716 328,676 1,385,343
Staff costs 96,178 19,491 324,652 21,809 78,614 7,940 118,230 666,915
Partner support 40,377 43,351 147,726 193,695 116,363 211,360 752,872
Other 104,361 21,451 44,304 2,717 48,083 3,852 34,434 259,202
B - Project costs, total 240,916 84,293 516,682 24,526 320,393 128,154 364,024 1,678,989
B-A - Utilisation of unrestricted funds by project 170,072 - 52,514 24,527 20,747 (9,561) 35,347 293,646
Annex 2 - page 6
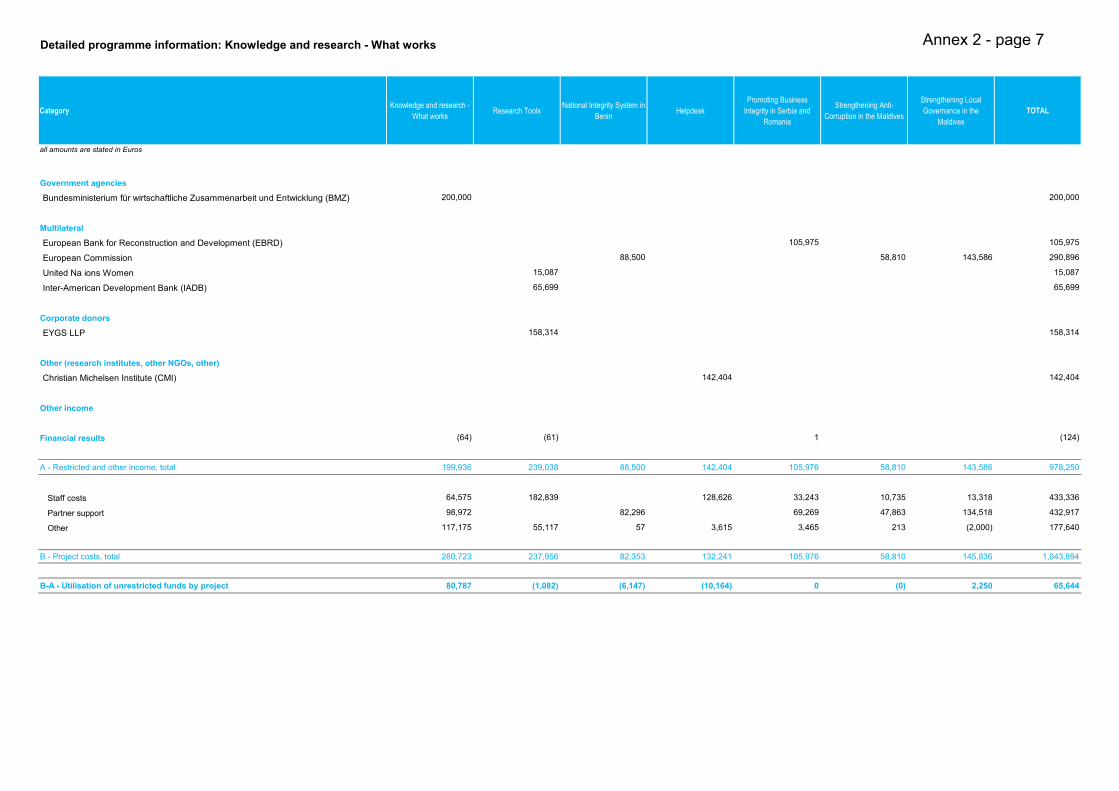
Detailed programme information: Knowledge and research - What works
CategoryKnowledge and research -
What worksResearch Tools
National Integrity System in
BeninHelpdesk
Promoting Business
Integrity in Serbia and
Romania
Strengthening Anti-
Corruption in the Maldives
Strengthening Local
Governance in the
Maldives
TOTAL
all amounts are stated in Euros
Government agencies
Bundesministerium für wirtschaftliche Zusammenarbeit und Entwicklung (BMZ) 200,000 200,000
Multilateral
European Bank for Reconstruction and Development (EBRD) 105,975 105,975
European Commission 88,500 58,810 143,586 290,896
United Na ions Women 15,087 15,087
Inter-American Development Bank (IADB) 65,699 65,699
Corporate donors
EYGS LLP 158,314 158,314
Other (research institutes, other NGOs, other)
Christian Michelsen Institute (CMI) 142,404 142,404
Other income
Financial results (64) (61) 1 (124)
A - Restricted and other income, total 199,936 239,038 88,500 142,404 105,976 58,810 143,586 978,250
Staff costs 64,575 182,839 128,626 33,243 10,735 13,318 433,336
Partner support 98,972 82,296 69,269 47,863 134,518 432,917
Other 117,175 55,117 57 3,615 3,465 213 (2,000) 177,640
B - Project costs, total 280,723 237,956 82,353 132,241 105,976 58,810 145,836 1,043,894
B-A - Utilisation of unrestricted funds by project 80,787 (1,082) (6,147) (10,164) 0 (0) 2,250 65,644
Annex 2 - page 7
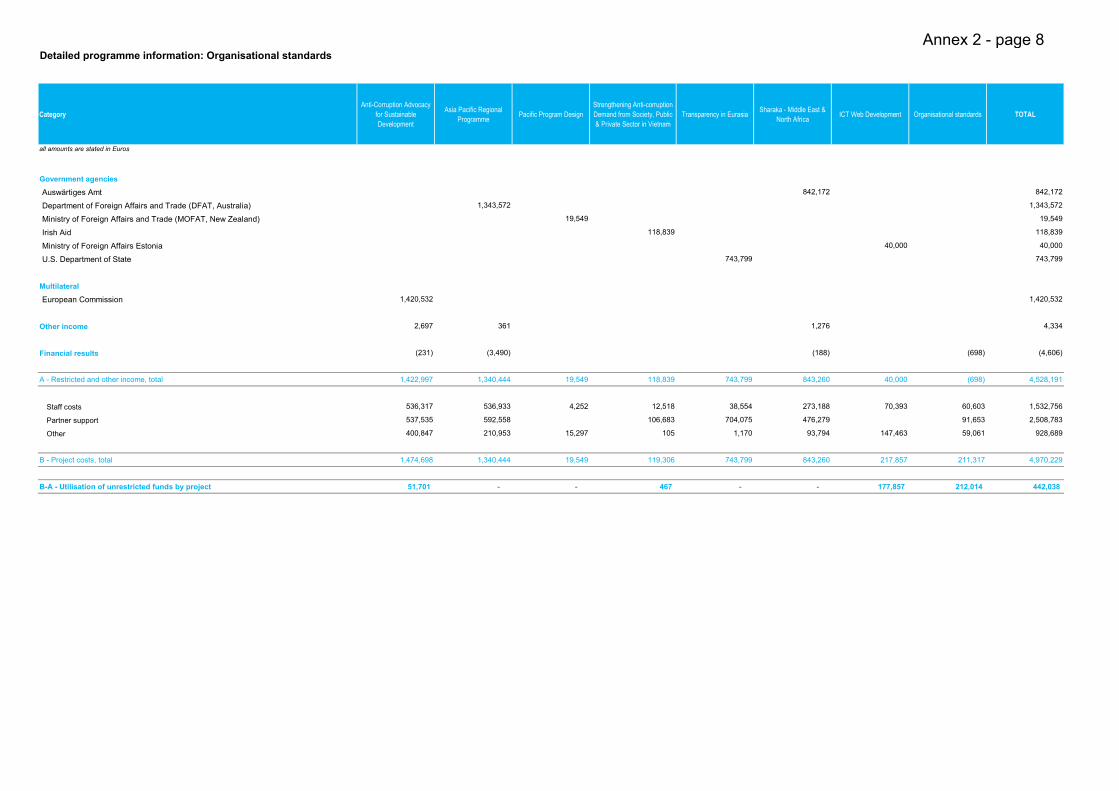
Detailed programme information: Organisational standards
Category
Anti-Corruption Advocacy
for Sustainable
Development
Asia Pacific Regional
ProgrammePacific Program Design
Strengthening Anti-corruption
Demand from Society, Public
& Private Sector in Vietnam
Transparency in EurasiaSharaka - Middle East &
North AfricaICT Web Development Organisational standards TOTAL
all amounts are stated in Euros
Government agencies
Auswärtiges Amt 842,172 842,172
Department of Foreign Affairs and Trade (DFAT, Australia) 1,343,572 1,343,572
Ministry of Foreign Affairs and Trade (MOFAT, New Zealand) 19,549 19,549
Irish Aid 118,839 118,839
Ministry of Foreign Affairs Estonia 40,000 40,000
U.S. Department of State 743,799 743,799
Multilateral
European Commission 1,420,532 1,420,532
Other income 2,697 361 1,276 4,334
Financial results (231) (3,490) (188) (698) (4,606)
A - Restricted and other income, total 1,422,997 1,340,444 19,549 118,839 743,799 843,260 40,000 (698) 4,528,191
Staff costs 536,317 536,933 4,252 12,518 38,554 273,188 70,393 60,603 1,532,756
Partner support 537,535 592,558 106,683 704,075 476,279 91,653 2,508,783
Other 400,847 210,953 15,297 105 1,170 93,794 147,463 59,061 928,689
B - Project costs, total 1,474,698 1,340,444 19,549 119,306 743,799 843,260 217,857 211,317 4,970,229
B-A - Utilisation of unrestricted funds by project 51,701 - - 467 - - 177,857 212,014 442,038
Annex 2 - page 8

Detailed programme information: Strong presence
CategoryTackling Inequalities in
West Africa
Strengthening Presence in
Sub-Saharan Africa
Strategic presence (US and
EU)TOTAL
FAST: Open Contracting
for Health SectorI-ACT: Defense and Security
I-ACT: Tracking Summit
Commitments
TI-UK Coopertaion on
SummitsTOTAL
all amounts are stated in Euros
Government agencies
Department for International Development (Df D) 1,040,651 1,434,354 632,305 3,107,309
Ministère des Affaires étrangères et du Développement international 98,210 98,210
Foundations and trusts
Open Society Institute, Development Foundation 101,247 101,247
Ford Foundation 153,956 153,956
Coalition partners
Transparency International UK 73,376 73,376
Other income 420 420
Financial results 768 (69) 699 (9,351) 2,421 (6,930)
A - Restricted and other income, total 154,724 98,630 101,178 354,532 1,031,300 1,434,354 632,305 75,796 3,173,755
Staff costs 15,483 3,752 81,417 100,652 0 0 0 62,937 62,937
Partner support 133,757 83,437 110,675 327,869 1,031,102 1,434,168 632,160 3,129 3,100,560
Other 7,480 11,353 55,346 74,179 198 185 145 9,730 10,258
B - Project costs, total 156,721 98,541 247,438 502,700 1,031,300 1,434,354 632,305 75,796 3,173,755
B-A - Utilisation of unrestricted funds by project 1,997 (89) 146,260 148,168 0 0 0 0 0
Strong presence Movement Partnerships
Annex 2 - page 9

Detailed programme information: Essential functions
I-ACT Global Standards Fundraising CommunicationsManagement and
special initiativesIntegrity office
all amounts are stated in Euros
Government agencies
Bundesministerium für wirtschaftliche Zusammenarbeit und Entwicklung (BMZ) 80,000 120,000 150,000 150,000 500,000
Department for International Development (DfID) 1,142,077 1,142,077
Coalition partners
Proetica - Capitulo Peruano de Transparency International 6,323 6,323
Other income 3,341 5 17,709 661 (1,248) 43,757 64,226
Financial results (343) (80) 80 (89) (20) (452)
A - Restricted and other income, total 1,145,075 79,925 137,709 150,742 (1,337) 0 200,060 1,712,174
Staff costs 1,010,960 399,252 328,997 684,376 339,502 84,479 325,586 3,173,151
Partner support 743 430 77,917 6,991 59,943 146,024
Other 295,841 100,226 51,873 415,499 184,455 196,345 143,093 1,387,331
B - Project costs, total 1,307,543 499,908 380,870 1,177,791 530,948 280,823 528,623 4,706,506
B-A - Utilisation of unrestricted funds by project 162,468 419,982 243,161 1,027,050 532,285 280,823 328,562 2,994,331
Management
Movement Support TOTALCategory
External Stakeholder Engagement
Governance, Accountability
and Learning
Annex 2 - page 10
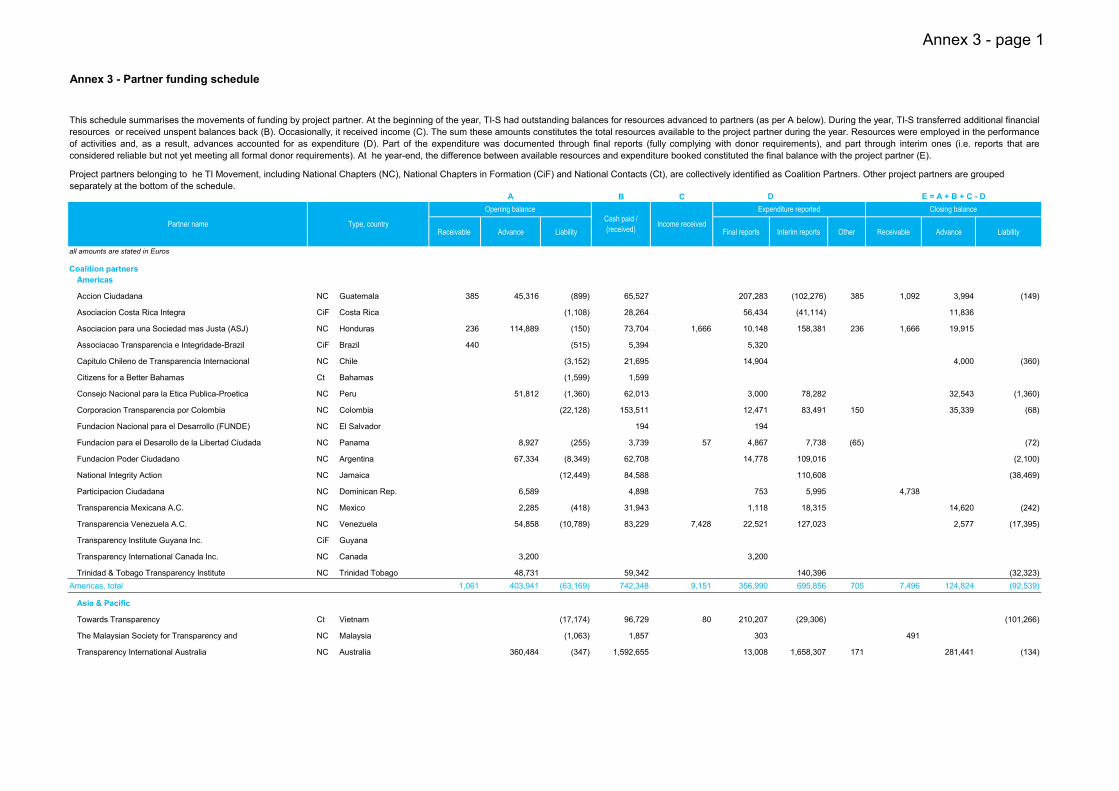
Annex 3 - Partner funding schedule
B C
Receivable Advance Liability Final reports Interim reports Other Receivable Advance Liability
all amounts are stated in Euros
Coalition partners
Americas
Accion Ciudadana NC Guatemala 385 45,316 (899) 65,527 207,283 (102,276) 385 1,092 3,994 (149)
Asociacion Costa Rica Integra CiF Costa Rica (1,108) 28,264 56,434 (41,114) 11,836
Asociacion para una Sociedad mas Justa (ASJ) NC Honduras 236 114,889 (150) 73,704 1,666 10,148 158,381 236 1,666 19,915
Associacao Transparencia e Integridade-Brazil CiF Brazil 440 (515) 5,394 5,320
Capitulo Chileno de Transparencia Internacional NC Chile (3,152) 21,695 14,904 4,000 (360)
Citizens for a Better Bahamas Ct Bahamas (1,599) 1,599
Consejo Nacional para la Etica Publica-Proetica NC Peru 51,812 (1,360) 62,013 3,000 78,282 32,543 (1,360)
Corporacion Transparencia por Colombia NC Colombia (22,128) 153,511 12,471 83,491 150 35,339 (68)
Fundacion Nacional para el Desarrollo (FUNDE) NC El Salvador 194 194
Fundacion para el Desarollo de la Libertad Ciudada NC Panama 8,927 (255) 3,739 57 4,867 7,738 (65) (72)
Fundacion Poder Ciudadano NC Argentina 67,334 (8,349) 62,708 14,778 109,016 (2,100)
National Integrity Action NC Jamaica (12,449) 84,588 110,608 (38,469)
Participacion Ciudadana NC Dominican Rep. 6,589 4,898 753 5,995 4,738
Transparencia Mexicana A.C. NC Mexico 2,285 (418) 31,943 1,118 18,315 14,620 (242)
Transparencia Venezuela A.C. NC Venezuela 54,858 (10,789) 83,229 7,428 22,521 127,023 2,577 (17,395)
Transparency Institute Guyana Inc. CiF Guyana
Transparency International Canada Inc. NC Canada 3,200 3,200
Trinidad & Tobago Transparency Institute NC Trinidad Tobago 48,731 59,342 140,396 (32,323)
Americas, total 1,061 403,941 (63,169) 742,348 9,151 356,990 695,856 705 7,496 124,824 (92,539)
Asia & Pacific
Towards Transparency Ct Vietnam (17,174) 96,729 80 210,207 (29,306) (101,266)
The Malaysian Society for Transparency and NC Malaysia (1,063) 1,857 303 491
Transparency International Australia NC Australia 360,484 (347) 1,592,655 13,008 1,658,307 171 281,441 (134)
Partner name Type, country
Opening balanceCash paid /
(received)Income received
This schedule summarises the movements of funding by project partner. At the beginning of the year, TI-S had outstanding balances for resources advanced to partners (as per A below). During the year, TI-S transferred additional financial
resources or received unspent balances back (B). Occasionally, it received income (C). The sum these amounts constitutes the total resources available to the project partner during the year. Resources were employed in the performance
of activities and, as a result, advances accounted for as expenditure (D). Part of the expenditure was documented through final reports (fully complying with donor requirements), and part through interim ones (i.e. reports that are
considered reliable but not yet meeting all formal donor requirements). At he year-end, the difference between available resources and expenditure booked constituted the final balance with the project partner (E).
Project partners belonging to he TI Movement, including National Chapters (NC), National Chapters in Formation (CiF) and National Contacts (Ct), are collectively identified as Coalition Partners. Other project partners are grouped
separately at the bottom of the schedule.A D E = A + B + C - D
Expenditure reported Closing balance
Annex 3 - page 1
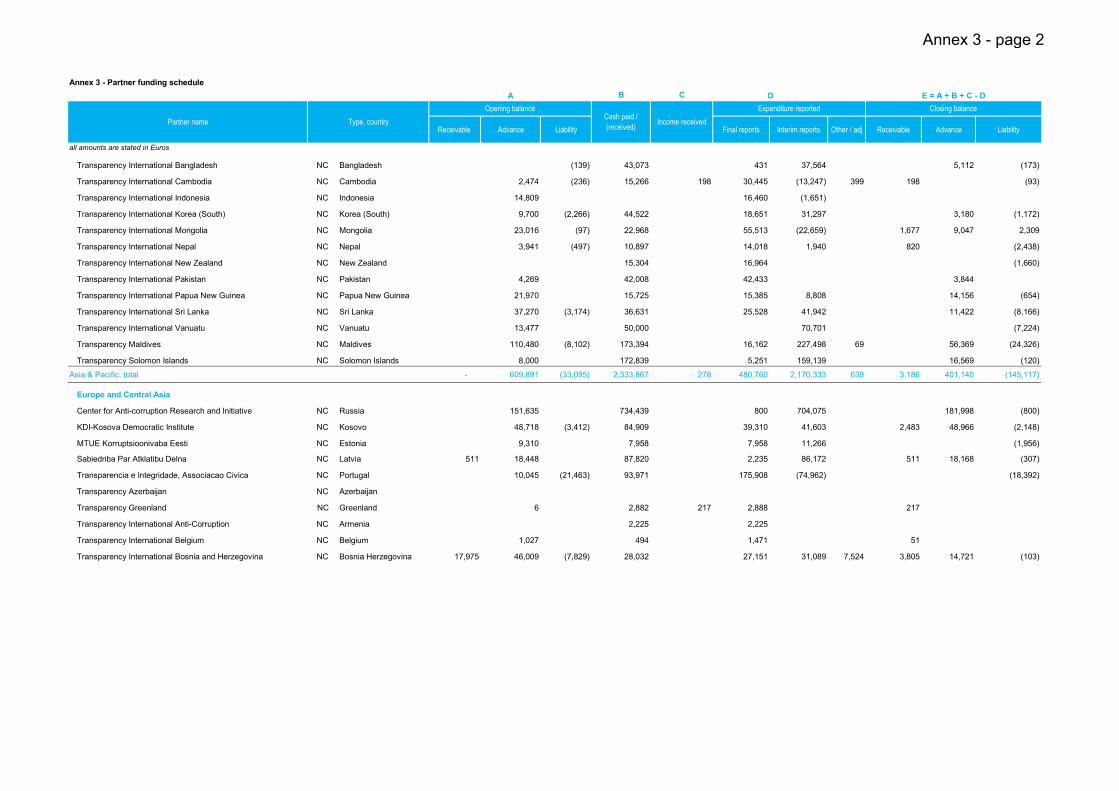
Annex 3 - Partner funding schedule
B C
Receivable Advance Liability Final reports Interim reports Other / adj Receivable Advance Liability
all amounts are stated in Euros
Transparency International Bangladesh NC Bangladesh (139) 43,073 431 37,564 5,112 (173)
Transparency International Cambodia NC Cambodia 2,474 (236) 15,266 198 30,445 (13,247) 399 198 (93)
Transparency International Indonesia NC Indonesia 14,809 16,460 (1,651)
Transparency International Korea (South) NC Korea (South) 9,700 (2,266) 44,522 18,651 31,297 3,180 (1,172)
Transparency International Mongolia NC Mongolia 23,016 (97) 22,968 55,513 (22,659) 1,677 9,047 2,309
Transparency International Nepal NC Nepal 3,941 (497) 10,897 14,018 1,940 820 (2,438)
Transparency International New Zealand NC New Zealand 15,304 16,964 (1,660)
Transparency International Pakistan NC Pakistan 4,269 42,008 42,433 3,844
Transparency International Papua New Guinea NC Papua New Guinea 21,970 15,725 15,385 8,808 14,156 (654)
Transparency International Sri Lanka NC Sri Lanka 37,270 (3,174) 36,631 25,528 41,942 11,422 (8,166)
Transparency International Vanuatu NC Vanuatu 13,477 50,000 70,701 (7,224)
Transparency Maldives NC Maldives 110,480 (8,102) 173,394 16,162 227,498 69 56,369 (24,326)
Transparency Solomon Islands NC Solomon Islands 8,000 172,839 5,251 159,139 16,569 (120)
Asia & Pacific, total - 609,891 (33,095) 2,333,867 278 480,760 2,170,333 639 3,186 401,140 (145,117)
Europe and Central Asia
Center for Anti-corruption Research and Initiative NC Russia 151,635 734,439 800 704,075 181,998 (800)
KDI-Kosova Democratic Institute NC Kosovo 48,718 (3,412) 84,909 39,310 41,603 2,483 48,966 (2,148)
MTUE Korruptsioonivaba Eesti NC Estonia 9,310 7,958 7,958 11,266 (1,956)
Sabiedriba Par Atklatibu Delna NC Latvia 511 18,448 87,820 2,235 86,172 511 18,168 (307)
Transparencia e Integridade, Associacao Civica NC Portugal 10,045 (21,463) 93,971 175,908 (74,962) (18,392)
Transparency Azerbaijan NC Azerbaijan
Transparency Greenland NC Greenland 6 2,882 217 2,888 217
Transparency International Anti-Corruption NC Armenia 2,225 2,225
Transparency International Belgium NC Belgium 1,027 494 1,471 51
Transparency International Bosnia and Herzegovina NC Bosnia Herzegovina 17,975 46,009 (7,829) 28,032 27,151 31,089 7,524 3,805 14,721 (103)
Partner name Type, country
Opening balanceCash paid /
(received)Income received
A D E = A + B + C - D
Expenditure reported Closing balance
Annex 3 - page 2
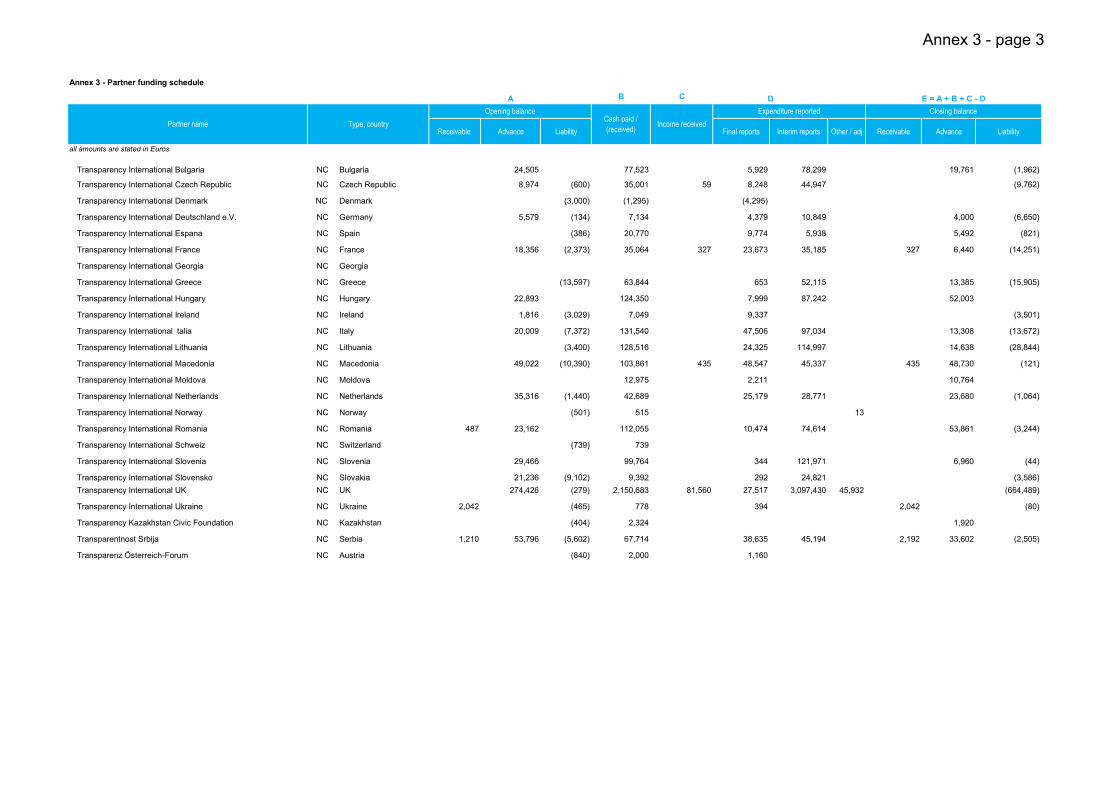
Annex 3 - Partner funding schedule
B C
Receivable Advance Liability Final reports Interim reports Other / adj Receivable Advance Liability
all amounts are stated in Euros
Transparency International Bulgaria NC Bulgaria 24,505 77,523 5,929 78,299 19,761 (1,962)
Transparency International Czech Republic NC Czech Republic 8,974 (600) 35,001 59 8,248 44,947 (9,762)
Transparency International Denmark NC Denmark (3,000) (1,295) (4,295)
Transparency International Deutschland e.V. NC Germany 5,579 (134) 7,134 4,379 10,849 4,000 (6,650)
Transparency International Espana NC Spain (386) 20,770 9,774 5,938 5,492 (821)
Transparency International France NC France 18,356 (2,373) 35,064 327 23,673 35,185 327 6,440 (14,251)
Transparency International Georgia NC Georgia
Transparency International Greece NC Greece (13,597) 63,844 653 52,115 13,385 (15,905)
Transparency International Hungary NC Hungary 22,893 124,350 7,999 87,242 52,003
Transparency International Ireland NC Ireland 1,816 (3,029) 7,049 9,337 (3,501)
Transparency International talia NC Italy 20,009 (7,372) 131,540 47,506 97,034 13,308 (13,672)
Transparency International Lithuania NC Lithuania (3,400) 128,516 24,325 114,997 14,638 (28,844)
Transparency International Macedonia NC Macedonia 49,022 (10,390) 103,861 435 48,547 45,337 435 48,730 (121)
Transparency International Moldova NC Moldova 12,975 2,211 10,764
Transparency International Netherlands NC Netherlands 35,316 (1,440) 42,689 25,179 28,771 23,680 (1,064)
Transparency International Norway NC Norway (501) 515 13
Transparency International Romania NC Romania 487 23,162 112,055 10,474 74,614 53,861 (3,244)
Transparency International Schweiz NC Switzerland (739) 739
Transparency International Slovenia NC Slovenia 29,466 99,764 344 121,971 6,960 (44)
Transparency International Slovensko NC Slovakia 21,236 (9,102) 9,392 292 24,821 (3,586)
Transparency International UK NC UK 274,426 (279) 2,150,683 81,560 27,517 3,097,430 45,932 (664,489)
Transparency International Ukraine NC Ukraine 2,042 (465) 778 394 2,042 (80)
Transparency Kazakhstan Civic Foundation NC Kazakhstan (404) 2,324 1,920
Transparentnost Srbija NC Serbia 1,210 53,796 (5,602) 67,714 38,635 45,194 2,192 33,602 (2,505)
Transparenz Österreich-Forum NC Austria (840) 2,000 1,160
Partner name Type, country
Opening balanceCash paid /
(received)Income received
A D E = A + B + C - D
Expenditure reported Closing balance
Annex 3 - page 3
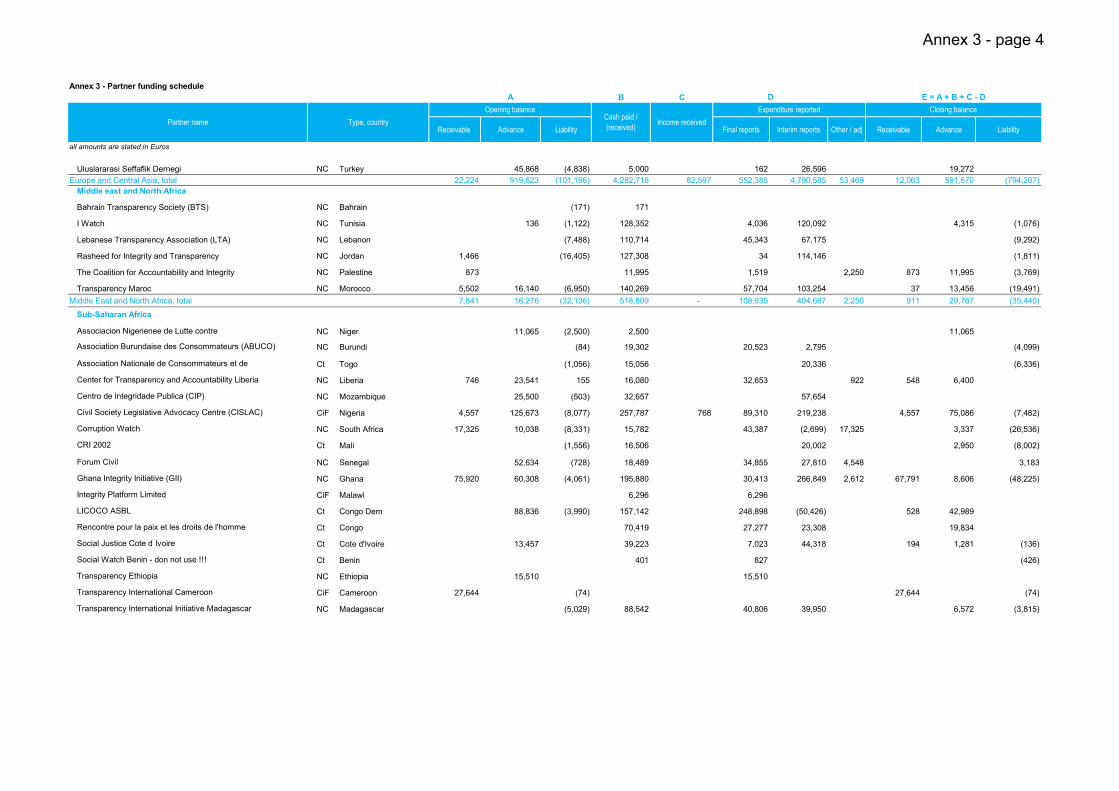
Annex 3 - Partner funding schedule
B C
Receivable Advance Liability Final reports Interim reports Other / adj Receivable Advance Liability
all amounts are stated in Euros
Uluslararasi Seffaflik Dernegi NC Turkey 45,868 (4,838) 5,000 162 26,596 19,272
Europe and Central Asia, total 22,224 919,623 (101,196) 4,282,716 82,597 552,385 4,790,585 53,469 12,063 591,670 (794,207)
Middle east and North Africa
Bahrain Transparency Society (BTS) NC Bahrain (171) 171
I Watch NC Tunisia 136 (1,122) 128,352 4,036 120,092 4,315 (1,076)
Lebanese Transparency Association (LTA) NC Lebanon (7,488) 110,714 45,343 67,175 (9,292)
Rasheed for Integrity and Transparency NC Jordan 1,466 (16,405) 127,308 34 114,146 (1,811)
The Coalition for Accountability and Integrity NC Palestine 873 11,995 1,519 2,250 873 11,995 (3,769)
Transparency Maroc NC Morocco 5,502 16,140 (6,950) 140,269 57,704 103,254 37 13,456 (19,491)
Middle East and North Africa, total 7,841 16,276 (32,136) 518,809 - 108,635 404,667 2,250 911 29,767 (35,440)
Sub-Saharan Africa
Associacion Nigerienee de Lutte contre NC Niger 11,065 (2,500) 2,500 11,065
Association Burundaise des Consommateurs (ABUCO) NC Burundi (84) 19,302 20,523 2,795 (4,099)
Association Nationale de Consommateurs et de Ct Togo (1,056) 15,056 20,336 (6,336)
Center for Transparency and Accountability Liberia NC Liberia 746 23,541 155 16,080 32,653 922 548 6,400
Centro de Integridade Publica (CIP) NC Mozambique 25,500 (503) 32,657 57,654
Civil Society Legislative Advocacy Centre (CISLAC) CiF Nigeria 4,557 125,673 (8,077) 257,787 768 89,310 219,238 4,557 75,086 (7,482)
Corruption Watch NC South Africa 17,325 10,038 (8,331) 15,782 43,387 (2,699) 17,325 3,337 (26,536)
CRI 2002 Ct Mali (1,556) 16,506 20,002 2,950 (8,002)
Forum Civil NC Senegal 52,634 (728) 18,489 34,855 27,810 4,548 3,183
Ghana Integrity Initiative (GII) NC Ghana 75,920 60,308 (4,061) 195,880 30,413 266,849 2,612 67,791 8,606 (48,225)
Integrity Platform Limited CiF Malawi 6,296 6,296
LICOCO ASBL Ct Congo Dem 88,836 (3,990) 157,142 248,898 (50,426) 528 42,989
Rencontre pour la paix et les droits de l'homme Ct Congo 70,419 27,277 23,308 19,834
Social Justice Cote d Ivoire Ct Cote d'Ivoire 13,457 39,223 7,023 44,318 194 1,281 (136)
Social Watch Benin - don not use !!! Ct Benin 401 827 (426)
Transparency Ethiopia NC Ethiopia 15,510 15,510
Transparency International Cameroon CiF Cameroon 27,644 (74) 27,644 (74)
Transparency International Initiative Madagascar NC Madagascar (5,029) 88,542 40,806 39,950 6,572 (3,815)
Partner name Type, country
Opening balanceCash paid /
(received)Income received
A D E = A + B + C - D
Expenditure reported Closing balance
Annex 3 - page 4

Annex 3 - Partner funding schedule
B C
Receivable Advance Liability Final reports Interim reports Other / adj Receivable Advance Liability
all amounts are stated in Euros
Transparency International Kenya NC Kenya 3,369 1,437 (17,324) 148,466 231,611 (74,692) 13,814 (34,786)
Transparency International Rwanda NC Rwanda 9,000 (12,009) 57,362 1,415 16,352 21,649 19,824 (2,056)
Transparency International Sierra Leone NC Sierra Leone 27,925 (1,181) 24,927 29,561 24,911 343 3,000 (6,144)
Transparency International Zambia NC Zambia 6,042 23,648 (2,500) 23,298 44 39,352 7,527 6,060 (2,407)
Transparency International Zimbabwe NC Zimbabwe 12,062 30,000 (2,109) 63,429 23,280 55,878 11,513 14,241 (1,530)
Transparency Mauritius NC Mauritius (254) 254
Transparency Uganda NC Uganda 1,657 71,997 69,064 4,422 241 (73)
Sub-Saharan Africa, total 149,323 518,572 (71,211) 1,341,798 2,226 1,006,996 701,302 25,407 120,887 235,059 (148,943)
Coalition partners, total 180,448 2,468,301 (300,807) 9,219,539 94,253 2,505,766 8,762,743 82,470 144,542 1,382,460 (1,216,246)
Others
ActionAid International Italia Onlus (4,000) 65,473 100,333 (38,860)
Fundacja im. Stefana Batorego 20,987 29,160 21,637 47,640 (19,129)
Ghana Center for Democratic Development 96,399 428 96,393 428 6
Montenegro 44,067 (7,918) 100,743 119,363 23,977 18,167 (24,615)
SNI Benin 71,184 66,000 72,319 62,437 3,563 (1,135)
Others (expenditure lower than €50,000) 1,334 19,758 (21,935) 1,064,799 164 624,036 385,136 2,310 65,142 (12,504)
Others, total 1,334 252,396 (33,853) 1,326,175 592 837,355 715,916 428 2,310 86,878 (96,242)
Grand total 181,782 2,720,698 (334,660) 10,545,714 94,845 82,898 146,852 1,469,338 (1,312,488)
reference to financial statements note 4 6 d 10 d a b 21 c 4 6 10
a) balance forms part of the entity s cash flows
b) the balance forms part of the entity s operating income
c) the balance forms part of other direct support and other expenditure
d) The status of some partners may have changed during the year causing differences between the totals for regions and others in advances brought forward
Partner name Type, country
Opening balanceCash paid /
(received)Income received
12,821,779
A D E = A + B + C - D
Expenditure reported Closing balance
Annex 3 - page 5

Transparency International
International Secretariat
Alt-Moabit 96
10559 Berlin
Germany
Phone: +49 - 30 - 34 38 200
Fax: +49 - 30 - 34 70 39 12
www.transparency.org
blog.transparency.org
facebook.com/transparencyinternational
twitter.com/anticorruption


