TRANSPORT AND ENTRAPMENT OF PARTICLES IN CONTINUOUS CASTING OF STEEL Quan Yuan and Brian G. Thomas University of Illinois at Urbana-Champaign, Department of Mechanical and Industrial Engineering, 1206 West Green Street, Urbana, IL USA, 61801 Keywords: inclusions, steel, modeling, turbulent flow, transport, particle capture Abstract The entrapment of inclusions, bubbles, slag, and other particles into solidified steel products is a critically-important quality concern. These particles require expensive inspection, surface grinding and rejection of steel. If undetected, large particles lower the fatigue life, while captured bubbles and inclusion clusters cause slivers, blisters, and other surface defects in rolled products. During continuous casting, particles may enter the mold with the steel flowing through the submerged nozzle. In addition, mold slag may be entrained from the top surface. A computational model has been developed to simulate the transport and entrapment of particles from both of these sources. The model first computes transient turbulent flow in the mold region using Large Eddy Simulation (LES), with the k sub-grid-scale (SGS) model. Next, the transport and capture of over 30,000 particles are simulated using a Lagrangian approach to track the trajectories. A new criterion was developed to model particle pushing and capture by a dendritic interface and was incorporated into the particle transport model. Particles smaller than the primary dendrite arm spacing are entrapped if they enter the boundary layer region and touch the solidifying steel shell. Larger particles are entrapped only if they remain stable while the shell grows around them. The new criterion models this by considering a balance of ten different forces which act on a particle in the boundary layer region, including the bulk hydrodynamic forces (lift, pressure gradient, stress gradient, Basset, and added mass forces), transverse drag force, (caused by fluid flow across the dendrite interface), gravity (buoyancy) force, and the forces acting at the interface (Van der Waals interfacial force, lubrication drag force, and surface energy gradient force). The criterion was validated by reproducing experimental results in different systems. It was then applied to predict the entrapment of slag particles into the solidification front in molten steel. Finally, the model was incorporated into the 3-D LES model and used to predict the entrapment distributions, removal rates, and fractions of different sized particles in a straight-walled thin slab caster. Although more large particles are removed than small ones, the entrapment rate as defects is still very high. 745 Modeling of Casting, Welding and Advanced Solidification Processes - XI Edited by Charles-André Gandin and Michel Bellet TMS (The Minerals, Metals & Materials Society), 2006
Transcript
TRANSPORT AND ENTRAPMENT OF PARTICLES IN CONTINUOUS CASTING OF STEEL
Quan Yuan and Brian G. Thomas
University of Illinois at Urbana-Champaign, Department of Mechanical and Industrial Engineering,
The entrapment of inclusions, bubbles, slag, and other particles into solidified steel products is a critically-important quality concern. These particles require expensive inspection, surface grinding and rejection of steel. If undetected, large particles lower the fatigue life, while captured bubbles and inclusion clusters cause slivers, blisters, and other surface defects in rolled products. During continuous casting, particles may enter the mold with the steel flowing through the submerged nozzle. In addition, mold slag may be entrained from the top surface. A computational model has been developed to simulate the transport and entrapment of particles from both of these sources. The model first computes transient turbulent flow in the mold region using Large Eddy Simulation (LES), with the k sub-grid-scale (SGS) model. Next, the transport and capture of over 30,000 particles are simulated using a Lagrangian approach to track the trajectories. A new criterion was developed to model particle pushing and capture by a dendritic interface and was incorporated into the particle transport model. Particles smaller than the primary dendrite arm spacing are entrapped if they enter the boundary layer region and touch the solidifying steel shell. Larger particles are entrapped only if they remain stable while the shell grows around them. The new criterion models this by considering a balance of ten different forces which act on a particle in the boundary layer region, including the bulk hydrodynamic forces (lift, pressure gradient, stress gradient, Basset, and added mass forces), transverse drag force, (caused by fluid flow across the dendrite interface), gravity (buoyancy) force, and the forces acting at the interface (Van der Waals interfacial force, lubrication drag force, and surface energy gradient force). The criterion was validated by reproducing experimental results in different systems. It was then applied to predict the entrapment of slag particles into the solidification front in molten steel. Finally, the model was incorporated into the 3-D LES model and used to predict the entrapment distributions, removal rates, and fractions of different sized particles in a straight-walled thin slab caster. Although more large particles are removed than small ones, the entrapment rate as defects is still very high.
745
Modeling of Casting, Welding and Advanced Solidification Processes - XIEdited by Charles-André Gandin and Michel Bellet
TMS (The Minerals, Metals & Materials Society), 2006
Introduction
The entrapment of inclusions, bubbles, slag, and other particles during solidification of steel products is a critically-important quality concern. These particles require the finished product to undergo expensive inspection, surface grinding and even rejection. Furthermore, if undetected, large particles lower the fatigue life, while captured bubbles and inclusion clusters cause slivers, blisters, and other surface defects in rolled products. During continuous casting, particles may enter the mold with the steel flowing through the submerged nozzle. In addition, mold slag may be entrained from the top surface. The fraction of these particles which ultimately end up entrapped in the solidified shell has not previously been quantified.
A schematic of the steel continuous casting process is depicted in Fig. 1 [1], with a close-up of the simulated regions of the nozzle and liquid-pool of the continuous casting mold and upper strand given in Fig. 2. Steel flows from the ladle, through the tundish and into the mold through a submerged entry nozzle. Jets of molten steel exit the nozzle ports and traverse across the mold cavity to impinge on the solidifying steel shell near the narrow faces. These jets carry bubbles and inclusion particles into the mold cavity. In addition, high speed flow across the top surface may shear droplets of liquid mold slag into the flow, where they may become entrained in the liquid steel [2]. If the flow pattern brings the particles to the top surface, they are harmlessly removed into the liquid slag layer, so long as the slag is not saturated and the surface tension forces can be overcome. When the flow pattern is detrimental, however, particles become entrapped in the solidifying steel shell, where they cause serious quality problems and costly rejects. Particle trajectories and removal depend on particle size, which is complicated by collisions and attachment to bubbles. Particles trapped near the meniscus generate surface delamination defects, and may initiate surface cracks. This problem is aggravated by 1) rapid fluctuations in the top surface level and 2) partial freezing of the meniscus to form “hooks”, which entrap particles before they can enter the liquid slag.
Figure 1: Schematic of Steel Processing including ladle, tundish, and continuous casting
2400
mm
934mm
zyx
80mm
132mm984mm
Domain Bottom
Portion of tundish
Stopper rod
SEN
Narrow face
Wide face
Liquid pool
Turbulent jets
Figure 2: Schematic of the computational domain of the thin-slab steel caster, including tundish nozzle.
746
Particles which become trapped in the solidifying front deep inside the product,[3, 4] lead to internal cracks, slivers in the final rolled product, and blisters. These intermittent defects are particularly costly because they are often not detected until after many subsequent finishing steps. There is clearly a great incentive to understand how to control the mold flow pattern in order to minimize particle entrapment and the associated quality problems. As a first step, this work presents a new computational model to simulate particle transport and entrapment in a continuous slab caster, in order to quantify these phenomena.
Model Description
A computational model has been developed to simulate the transport and entrapment of particles entering the molten steel pool both from the nozzle and from the bottom of the mold slag layer. The model first computes transient turbulent flow in the mold region using Large Eddy Simulation (LES), with a sub-grid-scale (SGS) k model. Next, the transport and capture of over 30,000 particles are simulated using a Lagrangian approach to track the trajectories. The entrapment of particles which touch the boundaries representing the solidifying shell is determined by evaluating a force balance on each particle that resides in the fluid boundary layer at the dendritic interface.
Fluid Flow Model and Validation
A Large Eddy Simulation (LES) computer model has been developed to accurately simulate the details of transient turbulent flow and particle motion in the molten steel pool of the continuous casting nozzle and strand in three-dimensions.[5] It features a sub-grid turbulent kinetic energy model to model the the unresolved small eddies and special velocity boundary conditions [5] at the solidifying front in the steel caster to account for the effect of the solid shell on the flow. A complete description of this model and its validation using grid refinement studies, comparison with water model measurements, and with plant measurements can be found elsewhere [6, 7].
Particle Transport Model
The transport of large groups of particles through the transient flow fields was simulated during the LES computation using a Lagrangian aproach [5]. Past work on this project demonstrated validation of models of both the fluid flow and the transport of small particles using measurements in both water models and analysis of actual steel samples. The results of transport and capture of small inclusions (< 40μm) in a thin-slab steel caster are described in detail elsewhere [8]. This work showed that most of the small particles entering the mold are captured in the final product. The present work investigates the more difficult issue of the transport and entrapment of large particles, which are a greater concern for product quality.
The transport of spherical inclusion particles through the turbulent flow field was modeled by integrating the following transport equations for each particle:
pp
d
dt
xv and HAstressPressLGD
p FFFFFFFv
dtd
mp (1)
where the terms on the right hand side (RHS) in Eq. (1) are the steady-state drag force and the gravitational force (the two most significant forces), the lift force, the pressure gradient force, the stress gradient force, the added mass force, and the Basset history force. Because the particles of interest are relatively small ( 400 m), extra terms arising from the non-uniformity of the flow can be neglected. Further details on each of the six hydrodynamic forces are given
747
elsewhere [6]. Inclusions were introduced into the computational domain above the submerged entry nozzle at the local fluid velocity. Inclusions touching the top surface were assumed to be removed.
Particle Entrapment Model
Particles whose trajectories through the turbulent flowing liquid carry them to the top surface can be safely removed into the slag layer. Particles which reach the solidification front may either be trapped by the growing dendrites or repulsed back into the molten steel flow. The outcome between capture and pushing depends on five additional forces which become important in the boundary-layer region, in addition to the six hydrodynamic forces included in the flow model discussed in the previous section. The forces which act only on a particle positioned in the boundary layer in front of the solidifying interface are shown in Fig. 3, which also illustrates the solidifying columnar dendrites, (taken from a phase field model[9]).
Figure. 3: Forces acting on a particle at a solidifying dendritic interface and considered in capture model
These 5 forces include:
1) the lubrication force (FLub), created by the flow into the thin gap (h0) between the particle and the moving dendrite tip, which must be overcome for the particle to escape capture.
2
0
2
, 6pd
dpsolnLub Rr
rh
RVF (2)
2) the Van der Waals interfacial force (FI), which acts at the dendrite tips to attract the particle,
20
20)(2
ha
RrRr
Fpd
pdplslspI (3)
where a0 is atom diameter, and s, p, l and ddenote solid, particle, liquid and dendrite.
3) the surface energy gradient forces (FGrad), which are governed by gradients ahead of the solidification front of interfacially-active elements such as sulfur,
2 2
2 2
2ln ln
Grad
p pp pp p
pp p
R RR Rm R RF
RR R (4)
where = 1+n CS; = n rd (C*-CS); = Rp+rd+h0 . The steel surface energy lv (J/m2) varies with dissolved sulfur concentration (wt%) by lv = 1.97 – 0.17 ln(1+844CS) to fit measurements [10] :
The elevated sulfur content at the dendrite tip interface, C*, can be estimated from:
Vsol rd (1-k) C* = 2D(C*-CS) (5)
The increased sulfur content lowers the local surface tension at the dendrite tip, so the larger surface tension acting on the outside of the particle tends to encourage particle capture.
4) the reaction force (FN) whose angle depends on the primary dendrite arm spacing, and
5) the friction force (Ff), which is likely small and was ignored. The flow velocities across the dendritic interface cause a drag force, which is estimated from the LES model during the simulation.
PrimarydendriteArm spacing
Phase field by Dantzig et al
748
A simple criterion to predict particle pushing or capture has been developed in this work, based on computing a balance on all of these forces each time a particle touches the interface. Particles smaller than the primary dendrite arm spacing can easily flow in between the dendrite arms, to become surrounded and entrapped, even when the dendrite growth speed is much lower than the critical value for particle pushing [11]. Thus, small particles which “touch” a domain boundary are simply assumed to be captured. Larger particles cannot do this.
Particles larger than the local PDAS cannot fit between the dendrite arms. Figure 3 shows a typical dendritic front shape [9] where a spherical particle of alumina or slag transported to the solidification front contacts the solidifying dendrites through a thin film of liquid steel at the critical distance. If all of the forces acting on the particle are in stable equilibrium, then it will eventually be captured by the solidifying shell as the dendrites grow to surround it. The particle will avoid being captured if the net forces acting in the solidification direction push it away from the interface, or if the net forces acting through the particle centroid do not balance, allowing it to rotate around the dendrite tip, to be transported back into the flow. This particle capture model was tested by applying it to simulate several different experiments where particle capture was measured [6]. Further details on this new capture criterion are given elsewhere [6].
Application to Inclusion Entrapment in a Slab Caster
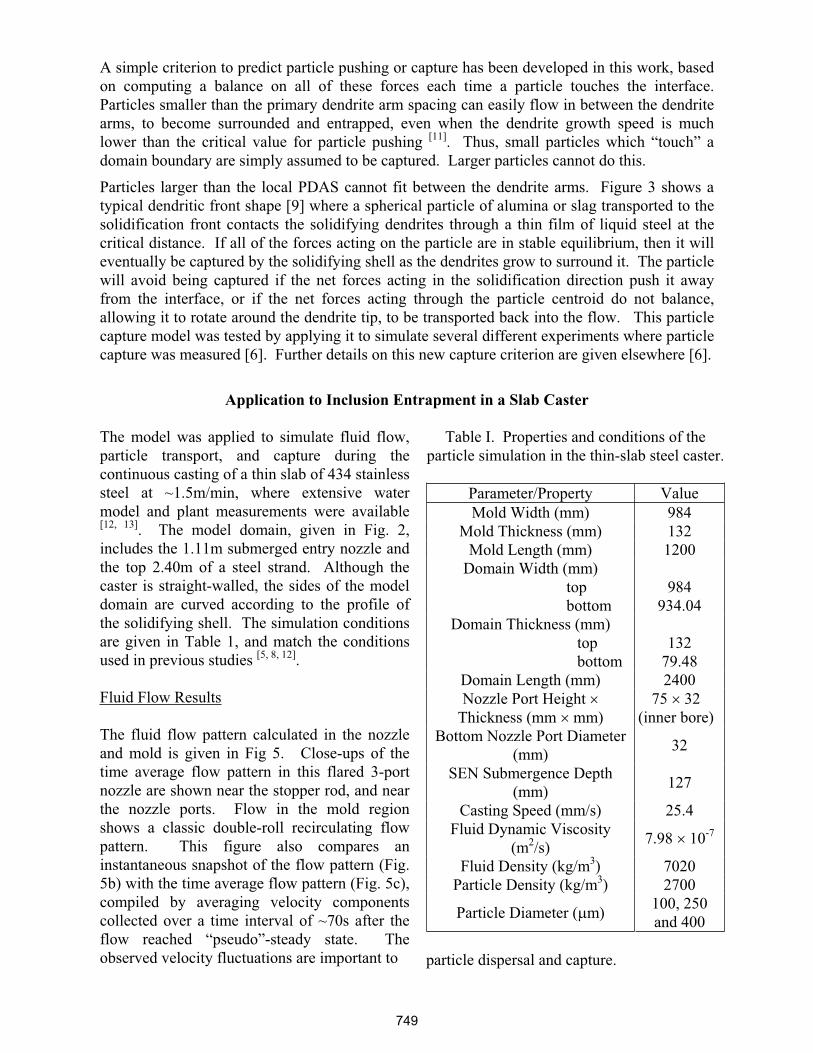
The model was applied to simulate fluid flow, particle transport, and capture during the continuous casting of a thin slab of 434 stainless steel at ~1.5m/min, where extensive water model and plant measurements were available [12, 13]. The model domain, given in Fig. 2, includes the 1.11m submerged entry nozzle and the top 2.40m of a steel strand. Although the caster is straight-walled, the sides of the model domain are curved according to the profile of the solidifying shell. The simulation conditions are given in Table 1, and match the conditions used in previous studies [5, 8, 12].
Fluid Flow Results
The fluid flow pattern calculated in the nozzle and mold is given in Fig 5. Close-ups of the time average flow pattern in this flared 3-port nozzle are shown near the stopper rod, and near the nozzle ports. Flow in the mold region shows a classic double-roll recirculating flow pattern. This figure also compares an instantaneous snapshot of the flow pattern (Fig. 5b) with the time average flow pattern (Fig. 5c), compiled by averaging velocity components collected over a time interval of ~70s after the flow reached “pseudo”-steady state. The observed velocity fluctuations are important to
Table I. Properties and conditions of the particle simulation in the thin-slab steel caster.
Parameter/Property Value Mold Width (mm) 984
Mold Thickness (mm) 132 Mold Length (mm) 1200
Domain Width (mm) top bottom
984934.04
Domain Thickness (mm) top bottom
13279.48
Domain Length (mm) 2400 Nozzle Port Height
Thickness (mm mm) 75 32
(inner bore) Bottom Nozzle Port Diameter
(mm) 32
SEN Submergence Depth (mm) 127
Casting Speed (mm/s) 25.4 Fluid Dynamic Viscosity
(m2/s) 7.98 10-7
Fluid Density (kg/m3) 7020 Particle Density (kg/m3) 2700
Particle Diameter ( m) 100, 250 and 400
particle dispersal and capture.
749
x (m)
z(m
)
-0.1 -0.05 0 0.05 0.1
-0.85
-0.8
-0.75
(Scale: 1.0m/s)
a)
Figure 4: Computed flow pattern in the centerline between wide faces: a) nozzle (time average)
-0.4 -0.2 00
0.1
0.2
0.3
0.4
0.5
0.6
0.7
0.8
0.9
1
1.1
1.2
1.0m/s:
(m)
0.1 0.2 0.3 0.4 (m)
b) flow in the mold c) flow in the mold (instantaneous) (time average)
Particle Transport and Entrapment Results
Simulations of particle trajectories were performed, based on the time-dependent velocity fields just discussed. An example of the capture criterion results is given in Fig. 5. When the cross-flow velocity balances the rising (terminal) velocity from buoyancy, particles are suspended beside the dendrite front and are captured. Smaller particles may still be captured if these two velocities are similar. Particles that fit between the primary dendrite arms are always captured, regardless of cross-flow velocity.Snapshots of the instantaneous positions of 30,000 particles injected through the nozzle are given in Fig. 6 at two times. An asymmetry can be observed, which is due to turbulent chaotic flow.
Particle diameter, dp ( m)
Crit
ical
dow
nwar
dcr
oss-
flow
velo
city
(m/s
)
0 100 200 300 400 500 600 700 800-0.12
-0.1
-0.08
-0.06
-0.04
-0.02
0
0.02
0.04
0.06
0.08
0.1
0.12
PDAS = 75 mPDAS = 100 mPDAS = 150 mPDAS = 200 m
Particle drifts downward
Particle drifts upward
Particle is captured
Rrd=3.3 m, vsli = 200mm/s
Figure 5. Critical downward cross-flow velocities for slag droplets in molten steel.
Dendrite tip radius: 3.3 m; Solidification speed: 200mm/s.
750
t = 3.60sdp = 400 m
t = 18.0sdp = 400 m
Figure 6. Computed distribution of 400 mparticles at instants times after injection through nozzle
Time after first particle entered mold (s)0 20 40 60 80 100 120 140
0
10
20
30
40
50
60
70
80
90
100
100 m250 m400 m
9s duration of particle injection
Time after first particle entered mold (s)
Fra
ctio
nof
part
icle
sre
mov
edby
the
top
surf
ace
(%)
0 20 40 60 80 100 120 1400
10
20
30
40
50
60
70
80
90
100
Figure 7. Particle removal histories
Safe removal to the top surface slag layer, plotted in Fig. 7, increases with time, saturating at 13, 42, and 70% for 100, 250, and 400 m particles respectively. The higher removal for larger particles is due mainly to their smaller chance of capture (Fig. 5), in addition to their larger buoyancy.
Table 2. Summary of inclusion location results
InclusionSize
SENWalls
Mold slag (top
surface)
40 μm 7% 8% Simulation
250 μm 6% 43%
Measurement (tundish to slab)
All 22%
The nozzle walls also entrap inclusions (which causes clogging). Considering the different removal rates for different inclusion sizes, and the greater fraction of small inclusions, overall removal rates are on the low side of 15-49%. This agrees with experiments [14]
that measured inclusion removal using the slimes method (Table 2).
For the casting conditions simulated here, the results reveal that:
- Increasing the number of particles improves the accuracy of removal predictions, especially for later times (e.g. 10-100s). At least 2500 particles are required to obtain accuracy within
3%. Particle removal at short times (e.g. 10s) is governed by chaotic fluctuations of the flow, which generate variations of 5%.
- After a 9s sudden burst of particles enters the steel caster, about 4 minutes are needed for all of them to be captured or removed. The captured particles concentrate mainly within a 2-m long section of slab.
- Most of the inclusions trapped in the steel slab are concentrated within 10-20mm beneath the slab surface, especially at the corner, and towards the narrow faces.
- The safe removal of inclusion particles to the top surface decreases greatly with decreasing particle size. Although the removal fraction of 400 m particles is 70%, only ~8% of small particles (10 m and 40 m) are removed. Clearly, inclusion removal in the mold is difficult.
751
- The removal of slag particles entrained from the top surface depends greatly on the particle size. Most (>92%) of the 250 m - 400 m droplets simply return to the slag layer. However, more than half of the 100 m particles are eventually entrapped into the solidifying steel shell, leading to sliver defects in the rolled product.
Based on these results, the design of nozzle geometry and casting conditions should focus on optimizing the flow pattern at the top surface of the mold to avoid slag entrainment, excessive level fluctuations, meniscus freezing, and related problems. Inclusions should be removed during upstream processing.
Conclusions
Lagrangian computations of particle transport during continuous casting of steel slabs were performed, based on time-dependent fluid velocity fields obtained from Large Eddy Simulations of the three-dimensional fluid flow. A new capture criterion based on a balance of the important forces acting on a particle near a solidification front has been developed, validated with test problems and applied to simulate particle capture in the solidification front. This criterion depends on many factors including the particle size and density, transverse fluid velocity, sulfur concentration gradient, solidification front velocity, and primary dendrite arm spacing. The results reveal that most of the inclusions entering the mold are captured, especially for small particles. The model makes several other practical findings and is a useful tool for understanding and improving mold flow to avoid particle entrapment.
Acknowledgements
The authors thank the steel industry members of the Continuous Casting Consortium and the National Science Foundation (DMI 01-15486) for support of this project and the National Center for Supercomputing Applications at UIUC for computing time.
3. Sussman, R.C., M. Burns, X. Huang, B.G. Thomas. Inclusion Particle Behavior in a Continuous Slab Casting Mold. 10th Process Technology Conference Proc., vol. 10. Toronto, Canada, April 5-8, 1992: Iron and Steel Society, Warrendale, PA, p.291-304.
4. Thomas, B.G., A. Denissov, H. Bai. Behavior of Argon Bubbles during Continuous Casting of Steel. Steelmaking Conf. Proc., vol. 80. Chicago, IL: ISS, 1997. p.375-384.
5. Yuan, Q., B.G. Thomas, S.P. Vanka. Metal. & Material Trans. B. 2004;35B:685-702. 6. Yuan, Q. PhD Thesis, M&I Eng. Univ. of Illinois, Urbana, IL, 2004. pp.196. 7. Yuan, Q., B. Zhao, S.P. Vanka, B.G. Thomas. Steel Research International 2005;76:33-43. 8. Yuan, Q., B.G. Thomas, S.P. Vanka. Metal. & Material Trans. B. 2004;35B:703-714. 9. J-H.Jeong, N. Goldenfeld, J.A. Dantzig. Physical Review E 2001;64:1-14. 10. Mukai, K., W. Lin. Behavior of Non-metallic Inclusions and Bubbles in Front of
Solidifying Interface of Liquid Iron. Tetsu-to-Hagane 1994;80:533-538. 11. Wilde, G., J.H. Perepezko. Materials Science & Engineering A 2000;283:25-37. 12. Yuan, Q., B.G. Thomas, S.P. Vanka. Turbulent Flow and Particle Motion in Continuous
Slab-Casting Molds. ISSTech 2003 Process Technology Proceedings, vol. 86. Indianapolis, IN, Apr 27-30, 2003: ISS, Warrendale, PA, 2003. p.913-927.
13. Thomas, B.G., R. O'Malley, T. Shi, Y. Meng, D. Creech, D. Stone. Validation of Fluid Flow and Solidification Simulation of a Continuous Thin Slab Caster. MCWASP, vol. IX. Aachen, Germany, August 20-25, 2000: Aachen, Germany, p.769-776.
14. Zhang, L., B.G. Thomas, Kaike Cai, Jian Cui, L. Zhu. Inclusion Investigation during Clean Steel Production at Baosteel. ISSTech 2003 Steelmaking Conf. Proc., vol. 86. Indianapolis, IN, Apr. 27-30, 2003: ISS, Warrendale, PA, 2003. p.141-156.