Membrane separation of mixtures is currently a subjof great interest.1 Molecular-level understanding of the inteactions between complex adsorbate molecules and surfplays a critical role in membrane separation. Such intertions are governed by a number of parameters, such as flfluid interactions~e.g., relative contribution from dispersioand hydrogen bonding!, solid–fluid interactions~e.g., hydro-philic or hydrophobic nature of the surface!, pore geometries~e.g., shape and size!, and operating conditions~e.g., tem-perature and pressure!. For designing an appropriate membrane for a separation process, it is important to determand control the surface properties of the membrane. Sevexamples show the effect of surface properties on membseparation. They include chemical transport selectivitythe separation of organic mixtures or aqueous solution2–4
a!Current address: Department of Chemical Engineering, University of NDame, IN 46556.
b!Current address: Jet Propulsion Laboratory, California Institute of Techogy, Pasadena, CA 91109.
c!Author to whom correspondence should be addressed.
8080021-9606/2002/117(2)/808/11/$19.00
Downloaded 11 Jul 2002 to 128.95.145.32. Redistribution subject to AI
t
esc-d–
eralner
and charge-based transport selectivity for the separatioradioactive and hazardous metal cations.5 Of the two catego-ries of diffusion, transport diffusion is more important thaself-diffusion from both practical and theoretical pointsview.6
With the development of the dual-control-volume gracanonical molecular dynamics~DCV-GCMD! simulationtechnique,7–9 transport diffusion has been simulated extesively in connection with membrane separation.6–12 Manynew processes emerge in the recent years for liquid seption. However, all DCV-GCMD simulations almost exclusively deal with simple gases or gaseous mixtures. For mbrane separation, the entrance effect of fluids into pores pan important role in mass transfer and separation procHowever, controlled volumes in DCV-GCMD simulationare very often placed inside confined regions so that thetrance effect of fluids is neglected. Furthermore, final coposition is unknown in membrane separation. However, ficomposition in the sink~CV2 in Fig. 1! has to be specified incurrent DCV-GCMD simulations.
In this work, we performed DCV-GCMD simulations othe transport diffusion of liquid water and methanol
P license or copyright, see http://ojps.aip.org/jcpo/jcpcr.jsp
809J. Chem. Phys., Vol. 117, No. 2, 8 July 2002 Transport of water and methanol through membranes
FIG. 1. Schematic of a DCV-GCMD simulation cell.
s
ugrenotiotra
asif-ub
alm
ol
-
feerli
on
.n,peuulehpin
tee-ndf
il-
Itids
enta-uidem-of a
nd
erac-
vacuum under a chemical potential gradient through apore consisting of Au~111! surfaces covered by2CH3 or2OH terminated self-assembled monolayers~SAMs!. Thesimulation resembles a pervaporation~PV! separation pro-cess, in which components of a liquid feed permeate throa membrane and evaporate into the downstream at differates. Pervaporation separation has emerged as an ecocal and simple alternative to many organic/organic separaapplications. This process is especially attractive in azeopic and close boiling point separation applications, suchbenzene/cyclohexane,13 or water/ethanol.14 Unlike distilla-tion processes, the separation mechanism in PV is not bon the relative volatility of the components, but on the dference in sorption and diffusion properties of the feed sstances in the membrane.13,14
A few molecular dynamics~MD! simulations were at-tempted to investigate the diffusion and solubility of smmolecules through pervaporation membranes, such as aphous polymers. Tamaiet al.16 reported MD simulations ofthe diffusion process of methane, water, and ethanol in p~dimethyl siloxane! ~PDMS! and polyethylene.Molle-Plathe15 investigated the diffusion of water in mixtures of water and poly~vinyl alcohol! ~0–97%! using MDsimulations. Fritz and co-workers14 studied the transport owater-ethanol mixtures in polydimethylsiloxane membranAll these studies dealt with the diffusion of liquids eithinside membranes or cross the interfaces between bulkuids and membranes. However, none of their simulatiwas performed under a fixed chemical potential~or concen-tration! gradient encountered in pervaporation processes
In our DCV-GCMD simulations, adsorption/desorptiodiffusion, and pore entrance effects encountered in avaporation separation process are all taken into accoMethanol and water are selected as model fluid molecbecause water represents a strongly polar molecule wmethanol is intermediate between nonpolar and stronglylar molecules. Surface hydrophobicity is adjusted by varythe terminal group of2CH3 ~hydrophobic! or 2OH ~hydro-
TABLE I. Geometries for water and methanol.
Water ~SPC model!a Methanol~OPLS model!b
r ~H–O! 0.10 nm r ~H–O! 0.0945 nmue(/H–O–H) 109.47° r (O–CH3) 0.1430 nm
ue(/H–O–CH3) 108.50°
aReference 21.bReference 22.
Downloaded 11 Jul 2002 to 128.95.145.32. Redistribution subject to AI
lit
hntmi-n
o-s
ed
-
lor-
y-
s.
q-s
r-nt.s
ileo-g
philic! of SAMs. Previous grand canonical ensemble MonCarlo ~GCMC! simulations showed different adsorption bhaviors of hydrogen bonding mixtures on hydrophobic ahydrophilic surfaces.18 As shown before, the adsorption owater–methanol mixtures in slit activated carbon~hydro-philic! pores occurs by continuous filling, while sharp caplary condensation is observed in graphite~hydrophobic!pores.18 All of these results were from equilibrium studies.is desirable to investigate the transport behaviors of fluthrough membranes under a chemical potential gradient.
In this paper, we report results for pure liquids and wwill report simulation results for fluid mixtures in subsequepapers. The ultimate goal of this work is to provide a fundmental understanding of how the interactions between flmolecules and surfaces affect transport diffusion and mbrane separation so as to tailor the surface chemistrypore for a specific separation task.
TABLE II. VDW parameters and charges for water, methanol, SAMs, agold.
Water and methanol are selected as fluid moleculeswater molecule is described by the simple point cha~SPC! potential model that contains three charge sitesone Lennard-Jones~LJ! site. A methanol molecule is described by the optimized potentials for liquid simulatio~OPLS! model. In these models, the fluid–fluid potential eergy is described by site–site interactions:
Ef f5EQ1EVDW , ~1!
EQ5(i 51
ma
(j 51
mb qiqj
r i j
, ~2!
EVDW5H (i 51
na
(j 51
nb
4e i j F S s i j
r i jD 12
2S s i j
r i jD 6G r<r c
0 r .r c.
~3!
The long-range electrostatic interactions between chasites i and j of moleculesa andb are described by Eq.~2!,wherem is the number of charge sites per molecule,r i j is theinteratomic distance between a pair of interacting sitesi andj, andq is the charge on a charge site.
Lack of symmetry in quasi-two-dimensional~2D! con-fined systems makes it difficult to use the Ewald summatmethod to account for long-range interactions. We have tto minimize this problem by using a large number of mecules and a half-box cutoff for long-range Coulombic intactions. Our previous study on the adsorption of the watmethanol mixture in graphite pores showed that differencpotential energy was only 0.5–0.7% between the 2D Ewsum and the half-box length cutoff techniques with comrable density profiles obtained using both these methoHowever, the 2D Ewald sum method17 is two orders of mag-nitude slower than the half-box length cutoff method.18
Recently, we implemented the cell multiple method19
~CMM! in MD simulations of 3D systems and extended
TABLE IV. Parameters for the chain–surface interactions.a
CH3 CH2 S O H
s i 2Au ~nm! 0.3495 0.3495 0.2565 0.2855 0.e i 2Au ~K! 71.948 51.988 2030.791 212.853 0.
aFrom Ref. 27.
ul 2002 to 128.95.145.32. Redistribution subject to AI
Aed
-
e
nd
-–inld-s.
MD simulations of quasi-2D systems and Monte Carlo simlations in both 3D and quasi-2D systems.20 For large sys-tems, computation time scales approximately withN ~num-ber of particles! in CMM ~Ref. 19! while with N2 in theconventional method. Equation~3! represents the short-rangvan der Waals~VDW! interaction between sitesi andj, andnis the number of LJ sites per molecule. The potential paraeterss and e were taken from Berendsenet al.21 and Jor-gensenet al.22 We truncate the LJ potential at a cutoff ditance r c51.4 nm. The SPC potential results in ninelectrostatic interactions and one pair of LJ interactiontween two oxygen sites for the water–water interaction. TOPLS potential model for the methanol–methanol intertion has four LJ and nine electrostatic interactions. Geoetries, VDW parameters, and charges for various molecare given in Tables I and II. The flux was calculatedmeasuring the net movement of each component crossigiven plane.
Ji5Ni
LR2NiRL
nstepsDtAyz
, ~4!
whereNiLR andNi
RL are the number of the fluid molecules ocomponenti moving from the left to the right and vice versarespectively,nstepsis the number of MD steps,Ayz is the areaof the yz plane, andDt is the MD time step. We choosetime stepDt52.5 fs.
B. Surface potentials
The membrane is a slit pore consisting of two Au~111!surfaces covered byn-alkanethiol SAMs. The Au~111! sur-faces are represented by discrete atoms. The surface prties of the pore are adjusted by varying the terminal group2CH3 ~hydrophobic! or 2OH ~hydrophilic! of SAMs. Thechains of the SAMs@S~CH2!8CH3 or S~CH2!7OH] are de-scribed by the united-atom model of Hautman and Klein, aco-workers.23,24 The total potential energy of a chain moecule contains valence (Eval) and nonbonded (Enb) contribu-tions
TABLE V. Configurational chemical potentials~kJ/mol! in control volumes.
m in CV1 m in CV2
Pure water 276.93 2`Pure methanol 270.86 2`
P license or copyright, see http://ojps.aip.org/jcpo/jcpcr.jsp
ghict
811J. Chem. Phys., Vol. 117, No. 2, 8 July 2002 Transport of water and methanol through membranes
FIG. 2. Snapshots of water molecules diffusing throua slit pore of size 2.113 nm covered by hydrophobSAMs/Au~111! under a chemical potential gradient a298 K from t50 to 550 ps.
tc
a
a
e
rken
oloff
r
dst
cut-nd
V:
thefacem
d
Echain5Eval1Enb, ~5!
where the bonded interactions consist of bond stre(Ebond), bond-angle bend (Eangle), and dihedral angle torsion(Etorsion) terms,
Eval5Ebond1Eangle1Etorsion, ~6!
while the nonbonded interactions consist of van der Wa(EVDW) and electrostatic (EQ) terms:
Enb5EVDW1EQ . ~7!
Since bond vibration is very fast, bond lengths betweenjacent pseudoatoms are constrained using theRATTLE
algorithm25 with fixed bond lengths given in Table III. Thuse of a dot product constraint26 could be more efficient thana bond constraint for fixing internal angles used in this woEangle is described by a simple harmonic angle potentialergy expression
Eangle512 Ku~u2ue!
2, ~8!
with the equilibrium angleue and the force constantKu
given in Table III. Torsional potentialEtorsion is described bya series expansion in the cosine of the dihedral anglew:
Etorsion5(i 50
n
Cicosi~w!. ~9!
Downloaded 11 Jul 2002 to 128.95.145.32. Redistribution subject to AI
h
ls
d-
.-
The VDW potential in one chain or between two thichains is described by the LJ 12-6 potential with a cutdistance of 1.4 nm as described in Eq.~3!. Electrostatic po-tentials described by Eq.~2! are taken into account only fothe interactions between active sites located on CH2, O, andH in different chains for the hydrophilic thiol. Nonbondeinteractions~VDW and Q! are not used between neareneighbors~1-2 interactions! and next nearest neighbors~1-3interactions!.
The chain–surface interaction is treated as the 12-3off potential to describe strong binding between thiolates aAu~111! surfaces27 and the parameters are given in Table I
Echain2surface52.117eF S s
r D 12
2S s
r D 3G . ~10!
The parameters are fit to give interaction energy withsurface and the distance of the head group from the surcomparable to those given by the continuuapproximation.23
C. Fluid–surface potentials
The interactions between fluids~water and methanol!and surfaces~SAMs/gold! were modeled with the cut-shifteLJ 12-6 potential as described in Eq.~3!, where cutoff dis-
P license or copyright, see http://ojps.aip.org/jcpo/jcpcr.jsp
ghict
812 J. Chem. Phys., Vol. 117, No. 2, 8 July 2002 Zhang et al.
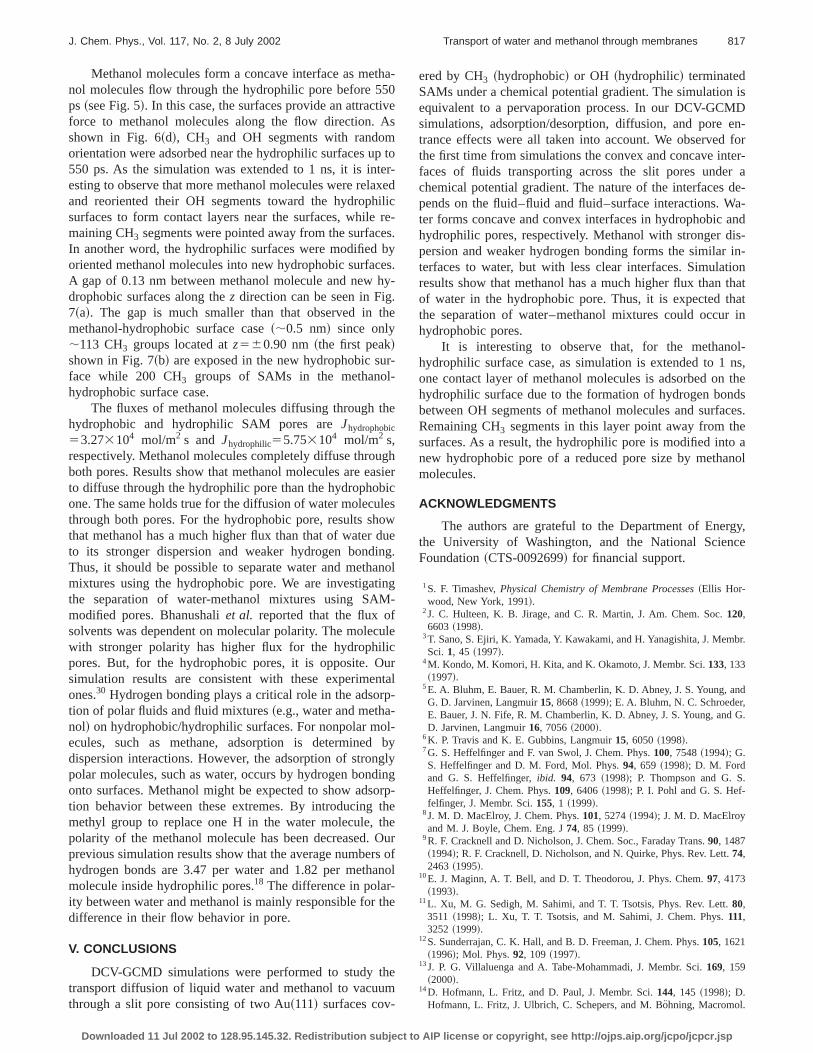
FIG. 3. Snapshots of water molecules diffusing throua slit pore of size 2.113 nm covered by hydrophilSAMs/Au~111! under a chemical potential gradient a298 K from t50 to 550 ps.
io-sth
-caslenua
diet
po-
ow4inedll
elyh
yersbe-pi-ol-s
-ned
cesetell
n-
f
tance was taken to be 1.4 nm. For the hydrophilic thelectrostatic potentialsEQ are taken into account for the interactions between fluid molecules and the last three atomthe chain. All LJ cross parameters were calculated usinggeometry combining rules i j 5As is j ande i j 5Ae ie j .
23
III. SIMULATION METHODOLOGY
The DCV-GCMD method7 is designed to simulate transport diffusion and flow in the presence of a fixed chemipotential gradient. The chemical potential of each speciea control volume is fixed by inserting and deleting partic~GCMC phase!, while the dynamic motion of molecules ithe whole system is described by solving Newtonian eqtions of motion~MD phase!. In this work, the DCV-GCMDtechnique is employed to study chemical-gradient-drivenfusion from liquid phase to vacuum. The simulation rsembles a pervaporation process. The use of vacuum insink eliminates the need to specify the final product comsition of a mixture. This is particularly important for simulating membrane separation. The simulation system is shin Fig. 1. The dimensions of the simulation cell are 10.934.32635.60 nm. The membrane, i.e., a slit pore consistof two Au~111! surfaces covered by mixed SAMs, is plac3.0 to 7.995 nm away. The length and width of the gold waare chosen to be an integral multiple~e.g., 5 and 5! of the
Downloaded 11 Jul 2002 to 128.95.145.32. Redistribution subject to AI
l,
ine
lins
-
f--he-
n5g
s
corresponding dimensions of a SAM/gold cell~0.99930.8652 nm!. Thus, surface dimensions are approximat4.99534.326 nm with 100n-alkanethiols adsorbed on eacsurface. Gold atoms in each wall are arranged in three lawith 300 gold atoms for each gold layer. The pore sizetween terminal groups of SAMs is about 2.113 nm. Tycally, a simulation system contains about 3200 fluid mecules~or 9600 adsorbate atoms! and 3800 adsorbent atom~including SAMs and gold!. The flow direction is along thexdirection from the left~liquid reservoir, CV1, placed from0.5 to 1.5 nm! to the right~vacuum sink, CV2, placed from9.495 to 10.495 nm! control volumes. In each control volume, the chemical potential of each component is maintaiconstant by GCMC simulations~see Table V!. The bufferboxes of B1 and B2 allow one to investigate the entraneffects while the buffer boxes of B3 and B4 are used tothe control volumes in bulk environment. The simulation cis confined in thex direction by two hard walls, which arelocated at the two ends of the cell alongx direction. Theperiodic boundary conditions and minimum image convetions are applied toy andz dimensions for fluid molecules inthe bulk, and only in they direction for fluid molecules in theconfined region and SAMs.
For the GCMC29 phase, we follow the prescription o
P license or copyright, see http://ojps.aip.org/jcpo/jcpcr.jsp
go--
813J. Chem. Phys., Vol. 117, No. 2, 8 July 2002 Transport of water and methanol through membranes
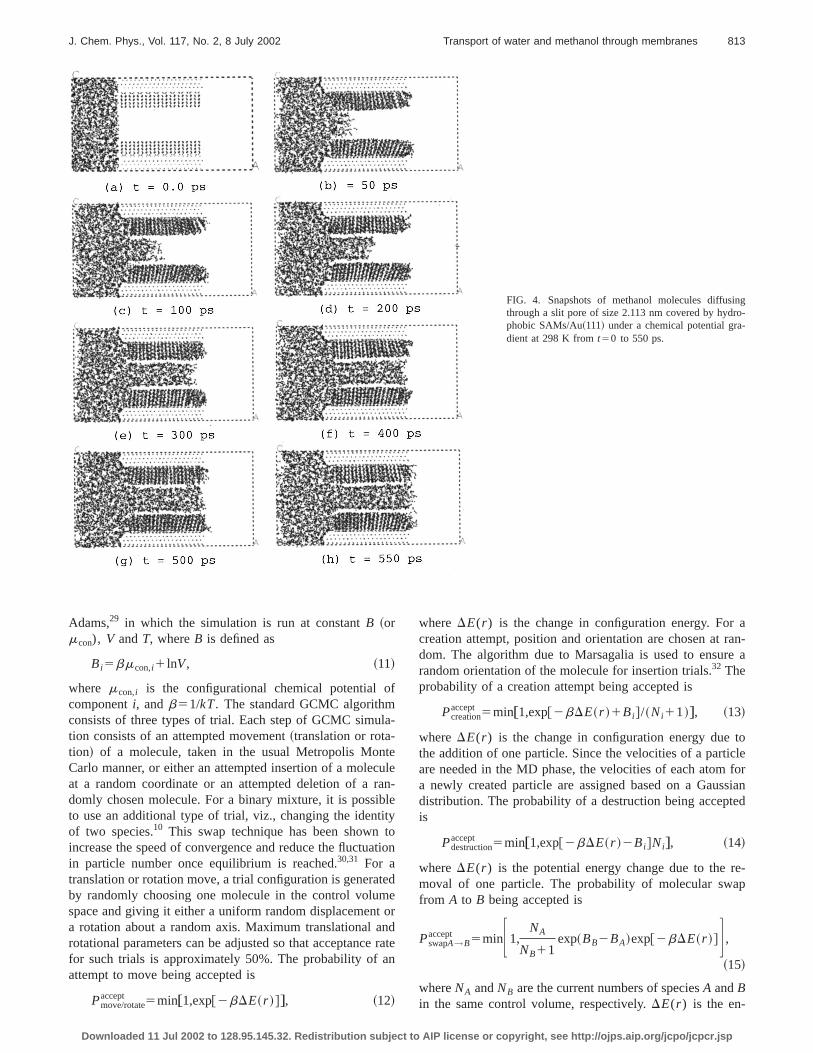
FIG. 4. Snapshots of methanol molecules diffusinthrough a slit pore of size 2.113 nm covered by hydrphobic SAMs/Au~111! under a chemical potential gradient at 298 K fromt50 to 550 ps.
f
la
teu
rablitytoat
tee
t on
n
aran-e a
toclefor
ssianed
re-p
Adams,29 in which the simulation is run at constantB ~ormcon), V andT, whereB is defined as
Bi5bmcon,i1 lnV, ~11!
where mcon,i is the configurational chemical potential ocomponenti, andb51/kT. The standard GCMC algorithmconsists of three types of trial. Each step of GCMC simution consists of an attempted movement~translation or rota-tion! of a molecule, taken in the usual Metropolis MonCarlo manner, or either an attempted insertion of a molecat a random coordinate or an attempted deletion of adomly chosen molecule. For a binary mixture, it is possito use an additional type of trial, viz., changing the identof two species.10 This swap technique has been shownincrease the speed of convergence and reduce the fluctuin particle number once equilibrium is reached.30,31 For atranslation or rotation move, a trial configuration is generaby randomly choosing one molecule in the control volumspace and giving it either a uniform random displacemena rotation about a random axis. Maximum translational arotational parameters can be adjusted so that acceptancefor such trials is approximately 50%. The probability of aattempt to move being accepted is
Pmove/rotateaccept 5min†1,exp@2bDE~r !#‡, ~12!
Downloaded 11 Jul 2002 to 128.95.145.32. Redistribution subject to AI
-
len-e
ion
d
rdrate
where DE(r ) is the change in configuration energy. Forcreation attempt, position and orientation are chosen atdom. The algorithm due to Marsagalia is used to ensurrandom orientation of the molecule for insertion trials.32 Theprobability of a creation attempt being accepted is
whereDE(r ) is the change in configuration energy duethe addition of one particle. Since the velocities of a partiare needed in the MD phase, the velocities of each atoma newly created particle are assigned based on a Gaudistribution. The probability of a destruction being acceptis
whereDE(r ) is the potential energy change due to themoval of one particle. The probability of molecular swafrom A to B being accepted is
PswapA→Baccept 5minF1,
NA
NB11exp~BB2BA!exp@2bDE~r !#G ,
~15!
whereNA andNB are the current numbers of speciesA andBin the same control volume, respectively.DE(r ) is the en-
P license or copyright, see http://ojps.aip.org/jcpo/jcpcr.jsp
go--
814 J. Chem. Phys., Vol. 117, No. 2, 8 July 2002 Zhang et al.
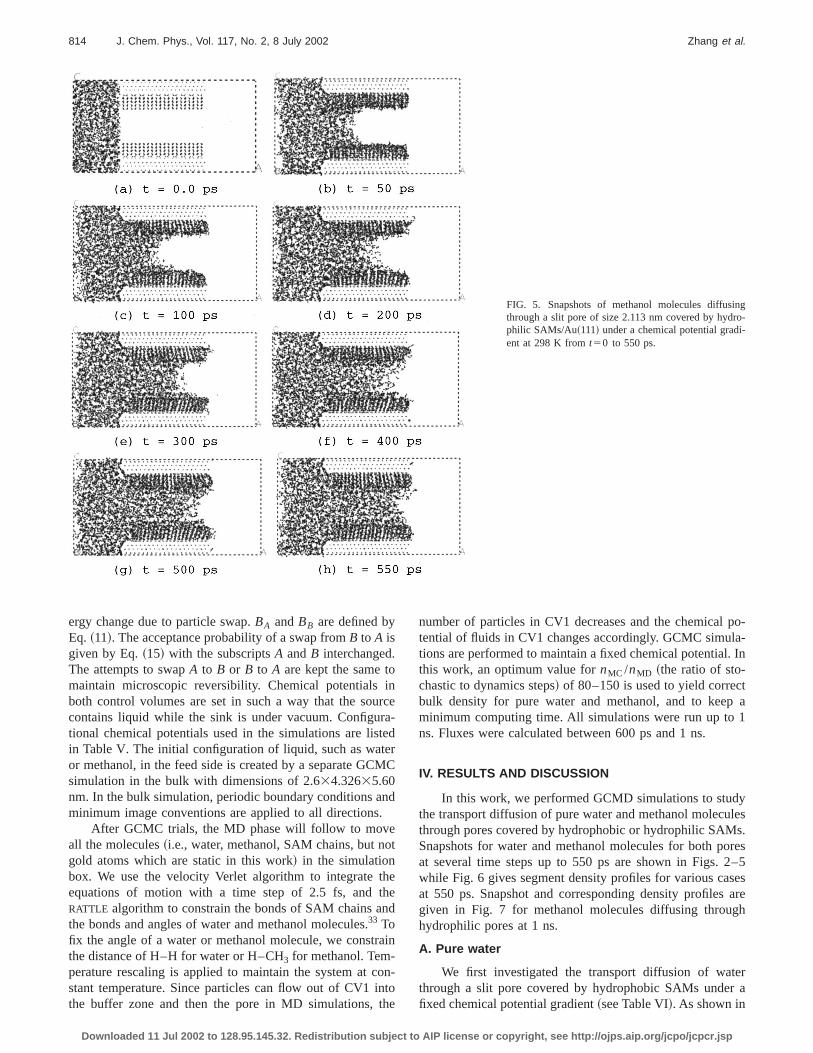
FIG. 5. Snapshots of methanol molecules diffusinthrough a slit pore of size 2.113 nm covered by hydrphilic SAMs/Au~111! under a chemical potential gradient at 298 K fromt50 to 550 ps.
inrc
rateerM
nd.
ot
hehend
ai
ontth
po-a-. In
ta
1
yless.res
2–5sesareh
err a
ergy change due to particle swap.BA andBB are defined byEq. ~11!. The acceptance probability of a swap fromB to A isgiven by Eq.~15! with the subscriptsA andB interchanged.The attempts to swapA to B or B to A are kept the same tomaintain microscopic reversibility. Chemical potentialsboth control volumes are set in such a way that the soucontains liquid while the sink is under vacuum. Configutional chemical potentials used in the simulations are lisin Table V. The initial configuration of liquid, such as wator methanol, in the feed side is created by a separate GCsimulation in the bulk with dimensions of 2.634.32635.60nm. In the bulk simulation, periodic boundary conditions aminimum image conventions are applied to all directions
After GCMC trials, the MD phase will follow to moveall the molecules~i.e., water, methanol, SAM chains, but ngold atoms which are static in this work! in the simulationbox. We use the velocity Verlet algorithm to integrate tequations of motion with a time step of 2.5 fs, and tRATTLE algorithm to constrain the bonds of SAM chains athe bonds and angles of water and methanol molecules.33 Tofix the angle of a water or methanol molecule, we constrthe distance of H–H for water or H–CH3 for methanol. Tem-perature rescaling is applied to maintain the system at cstant temperature. Since particles can flow out of CV1 ithe buffer zone and then the pore in MD simulations,
Downloaded 11 Jul 2002 to 128.95.145.32. Redistribution subject to AI
e-d
C
n
n-oe
number of particles in CV1 decreases and the chemicaltential of fluids in CV1 changes accordingly. GCMC simultions are performed to maintain a fixed chemical potentialthis work, an optimum value fornMC /nMD ~the ratio of sto-chastic to dynamics steps! of 80–150 is used to yield correcbulk density for pure water and methanol, and to keepminimum computing time. All simulations were run up tons. Fluxes were calculated between 600 ps and 1 ns.
IV. RESULTS AND DISCUSSION
In this work, we performed GCMD simulations to studthe transport diffusion of pure water and methanol molecuthrough pores covered by hydrophobic or hydrophilic SAMSnapshots for water and methanol molecules for both poat several time steps up to 550 ps are shown in Figs.while Fig. 6 gives segment density profiles for various caat 550 ps. Snapshot and corresponding density profilesgiven in Fig. 7 for methanol molecules diffusing throughydrophilic pores at 1 ns.
A. Pure water
We first investigated the transport diffusion of watthrough a slit pore covered by hydrophobic SAMs undefixed chemical potential gradient~see Table VI!. As shown in
P license or copyright, see http://ojps.aip.org/jcpo/jcpcr.jsp
815J. Chem. Phys., Vol. 117, No. 2, 8 July 2002 Transport of water and methanol through membranes
FIG. 6. Segment density profiles along thez direction for ~a! water-hydrophobic,~b! water-hydrophobic,~c! methanol-hydrophobic, and~d! methanol-hydrophobic surfaces. The dashed lines indicate the locations of SAM terminal groups.
ro. Iiecti
thcidanwa
Se
g.
n-e
re
ye
stho
nmt
Fig. 2, at the initial stage (t50 ps!, there is a 0.4 nm gapbetween the bulk water and the slit pore. As simulation pceeds, water molecules diffuse from the bulk to the porethe bulk phase, liquid water molecules are able to reorinto energetically favorable configurations and produH-bonded networks. Since no polar groups are present onhydrophobic surfaces and water–surface intermolecularteractions are on average considerably less attractivewater-water ones, the adsorption of water on the surfawill lead to a loss of some H bonds present in the bulk liquThus, water molecules prefer to stay in the bulk phasecannot wet the hydrophobic surfaces. This results in thatter molecules retract from the walls inside the pore. As cbe seen in Fig. 2, there exists a gap~;0.3 nm! between watermolecules inside the pore and the hydrophobic surfaces.ment density profiles~O, H, CH3, and OH! for liquid waterand methanol molecules along thez direction inside a slitpore of H52.113 nm are shown in Fig. 6. It is shown in Fi6~a! that O and H atoms cannot be observed beyondz560.75 nm. Hummeret al. reported that water molecules etering a hydrophobic nanotube from the bulk lose hydrogbonds, but a fraction of lost energy could be recovethrough VDW interactions with the nanotube.34 This findingis consistent with our simulation results except for SAM hdrophobic slit pores used in this work instead of nanotubSince the LJ energy parameter for the CH3 group of SAMs(eCH3
50.175 kcal mol21! is larger than that for the O atomof water (eO50.155 kcal mol21!, the hydrophobic surfaceprovide stronger repulsive force on water molecules nearsurfaces than that provided by their surrounding water m
Downloaded 11 Jul 2002 to 128.95.145.32. Redistribution subject to AI
-nntehen-anes.d
a-n
g-
nd
-s.
el-
FIG. 7. Methanol molecules diffusing through a slit pore of size 2.113covered by hydrophobic SAMs/Au~111! under a chemical potential gradienat 298 K at t51 ns. ~a! Snapshot, and~b! distributions of the segments( – CH3 and2OH! along thez direction.
P license or copyright, see http://ojps.aip.org/jcpo/jcpcr.jsp
acom
twoulrer-larsur thceie
ed
et
sbi
anw
llect
sute
r ah
tnMth
can
ne
thehowtheear
ithet
Fig.sarlyH
incemicces
ol-dragilic
desThend
-ilese
the
eso-areas
ter-andol-
p ofs
en inowmestheas
noler-tingcon-umhe-res.s
dro-
ork
816 J. Chem. Phys., Vol. 117, No. 2, 8 July 2002 Zhang et al.
ecules. As distance from the walls increases, VDW intertions between fluid water molecules and surfaces becweaker and approach the weakest at the center betweensurfaces. Thus, liquid water forms a convex interface aster molecules flow through the pore. After 500 ps and up tns, water molecules remain in the same location as simtion proceeds. The transport behavior of fluids through pois determined by competing fluid–fluid and fluid–solid inteactions. As shown in Fig. 2, at the beginning of the simution, water molecules in the control volume are pushed fiinto the mouth of the pore and then into the pore due to bwater pressure. However, as more water molecules entepore, resistance from surface forces increased. Thus, wresistant force from the hydrophobic surface has balanforce exerted by water molecules due to pressure gradwater molecules are stuck inside the slit pore~e.g., after 500ps!.
The orientation of molecules near a surface is of intersince interactions between fluid molecules and surfacestermine relative molecular orientations. The order paramS was used to define orientation,
S53^cos2u&21
2, ~16!
where ^¯& indicates ensemble average andu is the anglebetween the molecular dipole of water~or the vector pointingfrom carbon to oxygen in case of methanol! and thez axisperpendicular to the wall.18 By definition, S520.5 if themolecules lie parallel to the surface,S50 if the moleculesare randomly oriented, andS51 corresponds to moleculeorienting perpendicular to the surface. In the hydrophopore, water molecules have the preferred orientationS520.3 to the surfaces while water molecules remain rdomly oriented in the rest of the pore space. Previously,reported18 that water and methanol molecules lied paranear graphite surfaces when rigid and flat graphite surfawere used in simulations. In our current simulations, duedynamic SAMs used, pore surfaces are rough. Roughfaces affect the orientation of water molecules. Thus, wamolecules have preferred orientations, but are no longeparallel to the surfaces as in the case of hydrophobic grapsurfaces observed before.18 During simulations, it was ob-served that the size of the slit pore fluctuated slightly duethe motion of SAMs. SAMs tilt towards the flow directiodue to the pressure of liquid water and the chains of SAare not as ordered as when flow is absent. However,(A33A3)R30° structure of sulfur/gold remains.
By contrast, water molecules form a concave interfawhen they diffuse through a hydrophilic slit pore underfixed chemical potential gradient. The formation of the cocave interface is due to the strongest attractive forces
TABLE VI. Flux (104 mol/m2 s! for the transport diffusion of water andmethanol through pores covered by hydrophobic or hydrophilic SAMs.
Hydrophobic surfaces Hydrophilic surfaces
Water 0.0 30.77Methanol 3.27 5.75
Downloaded 11 Jul 2002 to 128.95.145.32. Redistribution subject to AI
-e
woa-1a-s
-t
lkheend
nt,
ste-er
c
-elesor-rll
ite
o
se
e
-ar
the walls between water molecules and surfaces. Unlikewater-hydrophobic surface case, snapshots in Fig. 3 sthat water molecules have completely diffused throughhydrophilic slit pore at 500 ps. Since water molecules nthe surfaces have a tendency to form hydrogen bonding wthe OH terminal groups of the SAMs, water molecules wthe surfaces as shown in Fig. 3. As can be seen from6~b!, O ~;15! and H ~;45! atoms are in the contact layernear the hydrophilic surfaces. The contact layers are cledistinguished from the interlayer. The numbers of O andatoms in the middle are about 60 and 120, respectively. Swater molecules wet the hydrophilic surfaces and dynaSAMs are used, no preferred orientation toward the surfais observed. As fluid molecules fill the pore, Figs. 3~g! and3~h! show that the interface between the heading water mecules and the vacuum becomes flat since there is noforce acting on those water molecules from the hydrophsurfaces.
Flux is monitored at oneyz plane in the middle of thepore (x55.498 nm! and calculated by the flux plane metho@Eq. ~4!# between 600 ps and 1 ns. Invariance of the fluxwith time indicates that the system reaches steady state.fluxes of water in the pores covered by hydrophobic ahydrophilic SAMs are Jhydrophobic50 mol/m2 s andJhydrophilic530.773104 mol/m2 s, respectively. Water molecules are stuck in the middle of the hydrophobic pore whwater molecules diffuse through the hydrophilic pore. Theresults indicate that surface property significantly affectsdiffusion behavior of water molecules.
B. Pure methanol
Similar to water, the behavior of methanol moleculdiffusing through slit pores with hydrophobic and hydrphilic surfaces under a given chemical potential gradientshown in Figs. 4 and 5, respectively. For similar reasonsdiscussed previously for water, the methanol–methanol inaction is stronger than that between methanol moleculessurfaces for the hydrophobic pore. Hence, methanol mecules in the pore are kept away from the surfaces. A gaabout 0.5 nm atz560.75 nm between methanol moleculeand surfaces as in the water-hydrophobic case can be seFigs. 4 and 6~c!. The surfaces provide a resistance to the flof methanol molecules. Since the resistant force becoweaker as it is away from the surfaces to the center ofpore, methanol forms a convex interface in the poremethanol molecules flow through the pore. In fact, methaforms a similar interface to water, but with a less clear intface since methanol molecules are less polar. It is interesto observe that methanol molecules can escape from thevex interface and transport through the pore into the vacuregion at the early stage of simulations. However, such pnomenon was not observed for water-hydrophobic poThe peaks of CH3 and OH in the segment density profileshown in Fig. 6~c! occur atz560.618 nm, indicating thatmethanol molecules have preferred orientations at the hyphobic surfaces. The corresponding^S& is about 20.25.These results are consistent with those of our previous won water confined between two graphite surfaces.18
P license or copyright, see http://ojps.aip.org/jcpo/jcpcr.jsp
th50ivAs
ptexilir
ebehy.th
r--
he
gasbileo
duinaninM
uicu
ntp-ol
gdiorththO
rsan
th
em
isD
en-forer-r ade-a-
andis-in-ionthathat
in
l-ns,thedsces.ea
nol
gy,ce
br.
nd
G.
.
817J. Chem. Phys., Vol. 117, No. 2, 8 July 2002 Transport of water and methanol through membranes
Methanol molecules form a concave interface as menol molecules flow through the hydrophilic pore before 5ps ~see Fig. 5!. In this case, the surfaces provide an attractforce to methanol molecules along the flow direction.shown in Fig. 6~d!, CH3 and OH segments with randomorientation were adsorbed near the hydrophilic surfaces u550 ps. As the simulation was extended to 1 ns, it is inesting to observe that more methanol molecules were relaand reoriented their OH segments toward the hydrophsurfaces to form contact layers near the surfaces, whilemaining CH3 segments were pointed away from the surfacIn another word, the hydrophilic surfaces were modifiedoriented methanol molecules into new hydrophobic surfacA gap of 0.13 nm between methanol molecule and newdrophobic surfaces along thez direction can be seen in Fig7~a!. The gap is much smaller than that observed inmethanol-hydrophobic surface case~;0.5 nm! since only;113 CH3 groups located atz560.90 nm~the first peak!shown in Fig. 7~b! are exposed in the new hydrophobic suface while 200 CH3 groups of SAMs in the methanolhydrophobic surface case.
The fluxes of methanol molecules diffusing through thydrophobic and hydrophilic SAM pores areJhydrophobic
53.273104 mol/m2 s and Jhydrophilic55.753104 mol/m2 s,respectively. Methanol molecules completely diffuse throuboth pores. Results show that methanol molecules are eto diffuse through the hydrophilic pore than the hydrophoone. The same holds true for the diffusion of water molecuthrough both pores. For the hydrophobic pore, results shthat methanol has a much higher flux than that of waterto its stronger dispersion and weaker hydrogen bondThus, it should be possible to separate water and methmixtures using the hydrophobic pore. We are investigatthe separation of water-methanol mixtures using SAmodified pores. Bhanushaliet al. reported that the flux ofsolvents was dependent on molecular polarity. The molecwith stronger polarity has higher flux for the hydrophilpores. But, for the hydrophobic pores, it is opposite. Osimulation results are consistent with these experimeones.30 Hydrogen bonding plays a critical role in the adsortion of polar fluids and fluid mixtures~e.g., water and methanol! on hydrophobic/hydrophilic surfaces. For nonpolar mecules, such as methane, adsorption is determineddispersion interactions. However, the adsorption of stronpolar molecules, such as water, occurs by hydrogen bononto surfaces. Methanol might be expected to show adstion behavior between these extremes. By introducingmethyl group to replace one H in the water molecule,polarity of the methanol molecule has been decreased.previous simulation results show that the average numbehydrogen bonds are 3.47 per water and 1.82 per methmolecule inside hydrophilic pores.18 The difference in polar-ity between water and methanol is mainly responsible fordifference in their flow behavior in pore.
V. CONCLUSIONS
DCV-GCMD simulations were performed to study thtransport diffusion of liquid water and methanol to vacuuthrough a slit pore consisting of two Au~111! surfaces cov-
Downloaded 11 Jul 2002 to 128.95.145.32. Redistribution subject to AI
a-
e
tor-edce-s.ys.-
e
hier
cswe
g.ol
g-
le
ral-
-bylyngp-eeurofol
e
ered by CH3 ~hydrophobic! or OH ~hydrophilic! terminatedSAMs under a chemical potential gradient. The simulationequivalent to a pervaporation process. In our DCV-GCMsimulations, adsorption/desorption, diffusion, and poretrance effects were all taken into account. We observedthe first time from simulations the convex and concave intfaces of fluids transporting across the slit pores undechemical potential gradient. The nature of the interfacespends on the fluid–fluid and fluid–surface interactions. Wter forms concave and convex interfaces in hydrophobichydrophilic pores, respectively. Methanol with stronger dpersion and weaker hydrogen bonding forms the similarterfaces to water, but with less clear interfaces. Simulatresults show that methanol has a much higher flux thanof water in the hydrophobic pore. Thus, it is expected tthe separation of water–methanol mixtures could occurhydrophobic pores.
It is interesting to observe that, for the methanohydrophilic surface case, as simulation is extended to 1one contact layer of methanol molecules is adsorbed onhydrophilic surface due to the formation of hydrogen bonbetween OH segments of methanol molecules and surfaRemaining CH3 segments in this layer point away from thsurfaces. As a result, the hydrophilic pore is modified intonew hydrophobic pore of a reduced pore size by methamolecules.
ACKNOWLEDGMENTS
The authors are grateful to the Department of Enerthe University of Washington, and the National ScienFoundation~CTS-0092699! for financial support.
1S. F. Timashev,Physical Chemistry of Membrane Processes~Ellis Hor-wood, New York, 1991!.
2J. C. Hulteen, K. B. Jirage, and C. R. Martin, J. Am. Chem. Soc.120,6603 ~1998!.
3T. Sano, S. Ejiri, K. Yamada, Y. Kawakami, and H. Yanagishita, J. MemSci. 1, 45 ~1997!.
4M. Kondo, M. Komori, H. Kita, and K. Okamoto, J. Membr. Sci.133, 133~1997!.
5E. A. Bluhm, E. Bauer, R. M. Chamberlin, K. D. Abney, J. S. Young, aG. D. Jarvinen, Langmuir15, 8668~1999!; E. A. Bluhm, N. C. Schroeder,E. Bauer, J. N. Fife, R. M. Chamberlin, K. D. Abney, J. S. Young, andD. Jarvinen, Langmuir16, 7056~2000!.
6K. P. Travis and K. E. Gubbins, Langmuir15, 6050~1998!.7G. S. Heffelfinger and F. van Swol, J. Chem. Phys.100, 7548~1994!; G.S. Heffelfinger and D. M. Ford, Mol. Phys.94, 659 ~1998!; D. M. Fordand G. S. Heffelfinger,ibid. 94, 673 ~1998!; P. Thompson and G. SHeffelfinger, J. Chem. Phys.109, 6406~1998!; P. I. Pohl and G. S. Hef-felfinger, J. Membr. Sci.155, 1 ~1999!.
8J. M. D. MacElroy, J. Chem. Phys.101, 5274~1994!; J. M. D. MacElroyand M. J. Boyle, Chem. Eng. J74, 85 ~1999!.
9R. F. Cracknell and D. Nicholson, J. Chem. Soc., Faraday Trans.90, 1487~1994!; R. F. Cracknell, D. Nicholson, and N. Quirke, Phys. Rev. Lett.74,2463 ~1995!.
10E. J. Maginn, A. T. Bell, and D. T. Theodorou, J. Phys. Chem.97, 4173~1993!.
11L. Xu, M. G. Sedigh, M. Sahimi, and T. T. Tsotsis, Phys. Rev. Lett.80,3511 ~1998!; L. Xu, T. T. Tsotsis, and M. Sahimi, J. Chem. Phys.111,3252 ~1999!.
12S. Sunderrajan, C. K. Hall, and B. D. Freeman, J. Chem. Phys.105, 1621~1996!; Mol. Phys.92, 109 ~1997!.
13J. P. G. Villaluenga and A. Tabe-Mohammadi, J. Membr. Sci.169, 159~2000!.
14D. Hofmann, L. Fritz, and D. Paul, J. Membr. Sci.144, 145 ~1998!; D.Hofmann, L. Fritz, J. Ulbrich, C. Schepers, and M. Bo¨hning, Macromol.
P license or copyright, see http://ojps.aip.org/jcpo/jcpcr.jsp
a
m
ci.
818 J. Chem. Phys., Vol. 117, No. 2, 8 July 2002 Zhang et al.
Theory Simul.9, 293~2000!; L. Fritz and D. Hofmann, Polymer38, 1035~1996!.
15F. Mulle-Plathe, J. Membr. Sci.141, 147 ~1998!.16Y. Tamai, H. Tanaka, and K. Nakanishi, Macromolecules28, 2544~1995!.17I. C. Yeh and M. L. Berkowitz, J. Chem. Phys.111, 3155~1999!.18A. V. Shevade, S. Jiang, and K. E. Gubbins, J. Chem. Phys.113, 6933
~2000!.19K. T. Lim et al., J. Comput. Chem.18, 501 ~1997!.20J. Zheng, Ramkumar Balasundaram, and S. Jiang~unpublished!.21H. J. C. Berendsen, J. P. M. Postma, W. F. von Gunsteren, and J. Herm
in Intermolecular Forces, edited by B. Pullman~Reidel, Dordrecht, Hol-land, 1981!.
22W. L. Jorgensen, J. M. Briggs, and M. L. Conteras, J. Phys. Chem.94,1683 ~1990!.
23J. Hautman and M. L. Klein, J. Chem. Phys.91, 4994 ~1989!; 93, 7483~1990!; J. Hautman, J. P. Bareman, W. Mar, and M. L. Klein, J. CheSoc., Faraday Trans.87, 2031~1991!.
Downloaded 11 Jul 2002 to 128.95.145.32. Redistribution subject to AI
ns,
.
24M. Sprik, E. Delamarche, and M. L. Klein, Langmuir10, 4116~1994!.25H. C. Andersen, J. Comput. Phys.52, 24 ~1983!.26 Hammonds and Ryckaert, Comput. Phys. Commun.62, 336 ~1991!.27K. J. Tupper and D. W. Brenner, Langmuir10, 2335~1994!.28G. E. Norman and V. S. Filinov, High Temp.7, 216 ~1969!.29D. J. Adams, Mol. Phys.29, 307 ~1975!.30D. Bhanushali, S. Kloos, C. Kurth, and D. Bhattacharyya, J. Membr. S
189, 1 ~2001!.31M. P. Allen and D. J. Tildesley,Computer Simulations of Liquids~Claren-
don Press, Oxford, 1987!; D. Frenkel and B. Smit,Understanding Mo-lecular Simulation~Academic, San Diego, 1996!.
32V. Derjaguin, N. V. Churaev, and V. M. Muller, Surface Forces~USSR,New York, 1987!.
33J. Israelachvilli, Intermolecular and Surface Forces~Academic, NewYork, 1991!.
34G. Hummer, J. C. Rasaiah, and J. P. Noworyta, Nature~London! 414, 188~2001!.
P license or copyright, see http://ojps.aip.org/jcpo/jcpcr.jsp