Bus Terminal Study for BEST “A Methodology to Incorporate Infrastructure into Public Transport Planning in Constrained Urban Areas” Under Supervision of Priyanka Vasudevan Senior Associate - Urban Transport EMBARQ India Presented by Naresh Kuruba Research Intern – Urban Transport EMBARQ India
Transcript
Bus Terminal Study for BEST
“A Methodology to Incorporate Infrastructure into Public
Transport Planning in Constrained Urban Areas”
Under Supervision of
Priyanka Vasudevan
Senior Associate - Urban Transport
EMBARQ India
Presented by
Naresh Kuruba
Research Intern – Urban Transport
EMBARQ India
Background
Study area delineation
Data collection
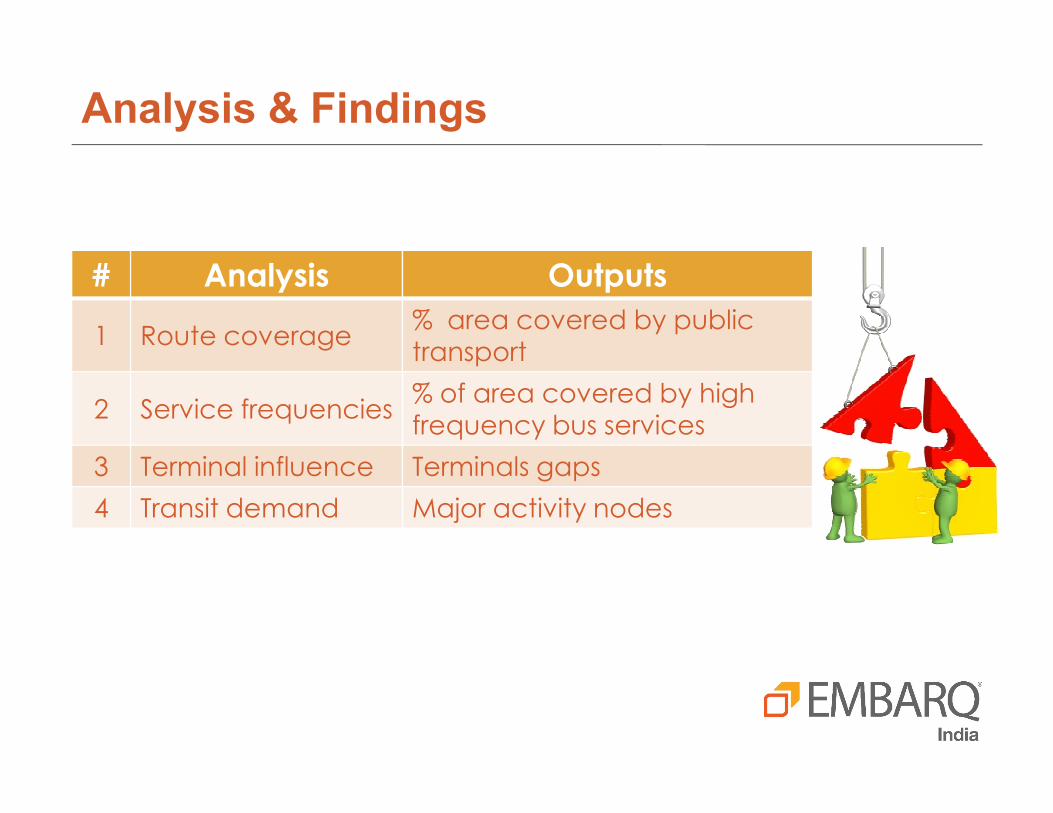
Analysis and findings
Structure of presentation
Analysis and findings
Plan and design of terminal
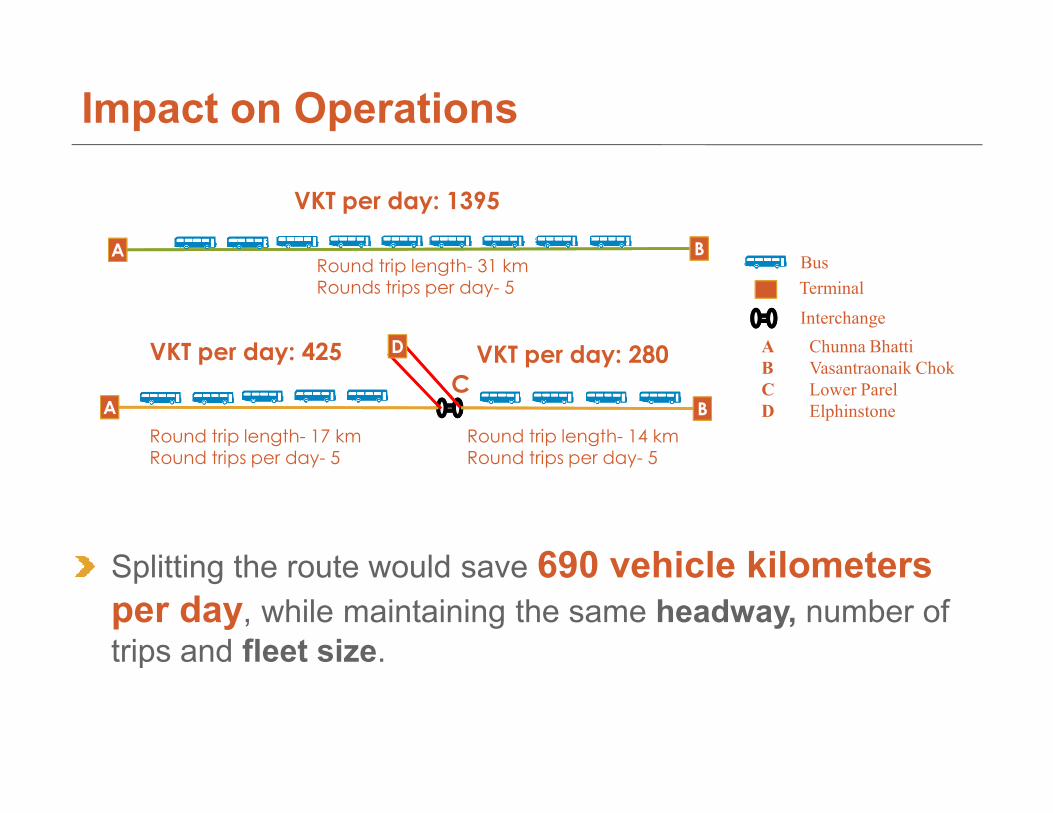
Impact on operations and passengers
Conclusions and recommendations
The success of public transport is largely depend on it’s
supportive infrastructure such as terminals, depots, etc.
To understand the effects of infrastructure on bus operations
and services, this study focus on terminal infrastructure
Introduction
and services, this study focus on terminal infrastructure
Terminal is a place where routes begin or end or both
There are logically located at point where many routes
converge and/or diverge
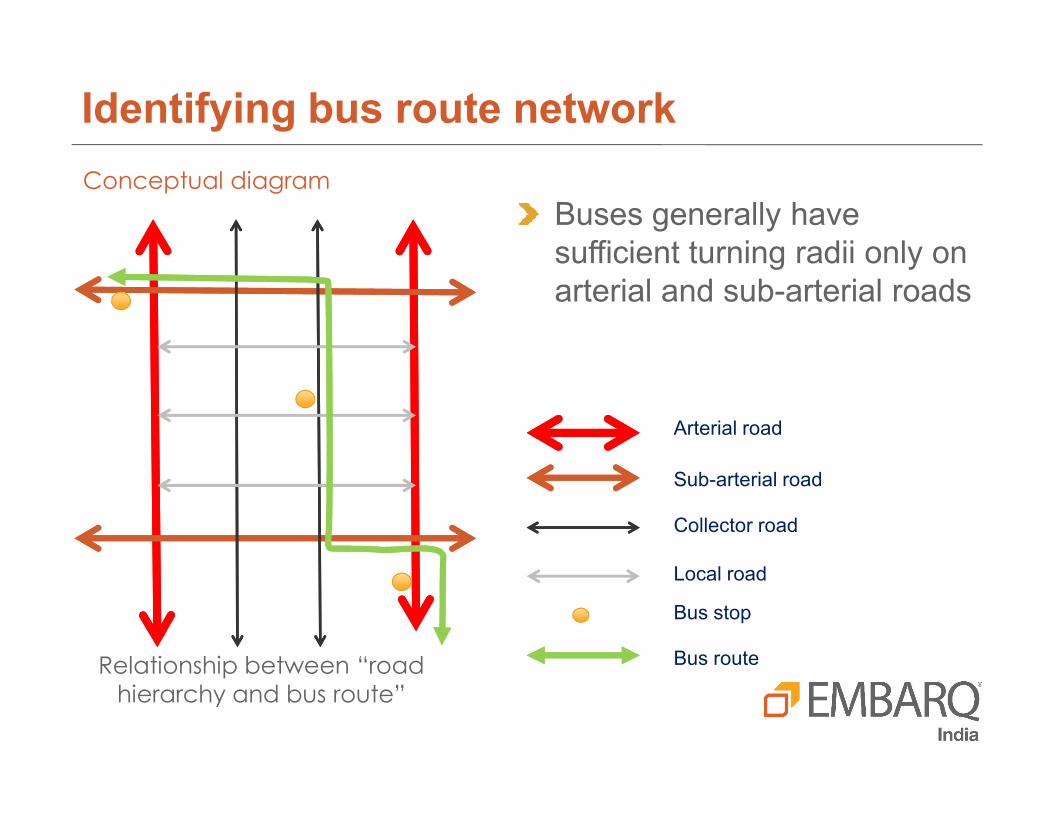
To identify the existing bus route network in the study
area
To determine the infrastructure gaps in the network
using planning tool such as GIS
Objectives
using planning tool such as GIS
To estimates the impact of a proposed terminal on bus
operations.
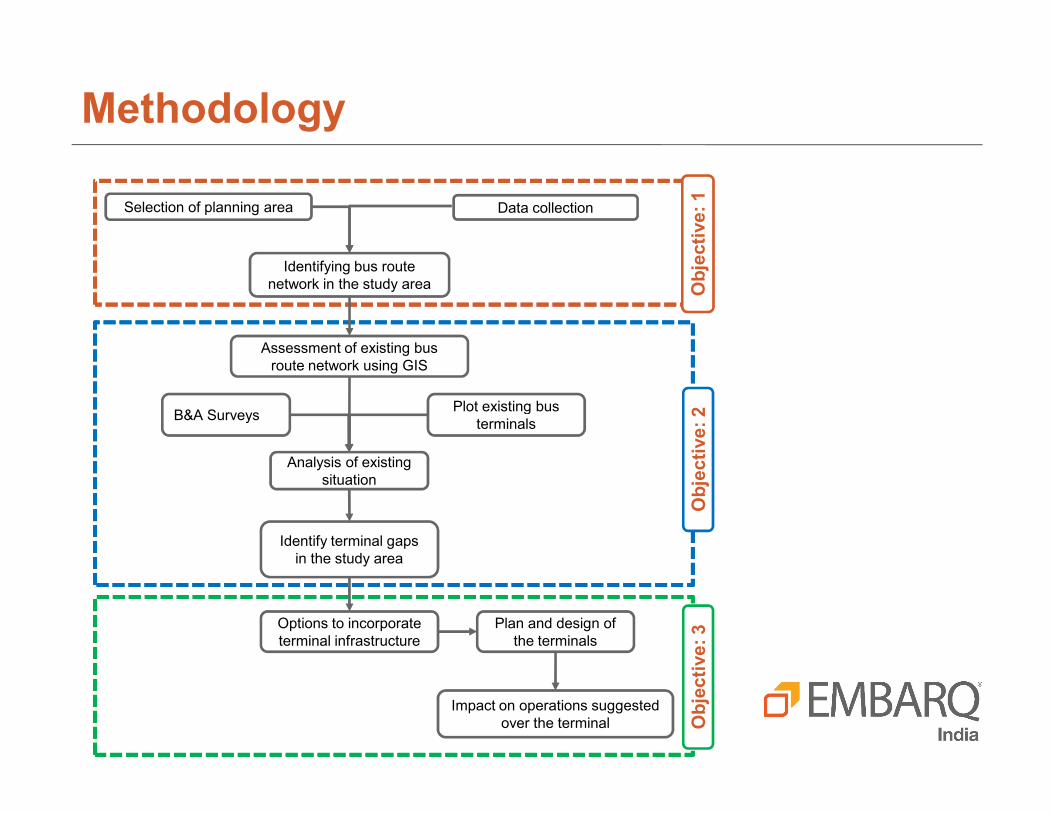
Methodology
Selection of planning area Data collection
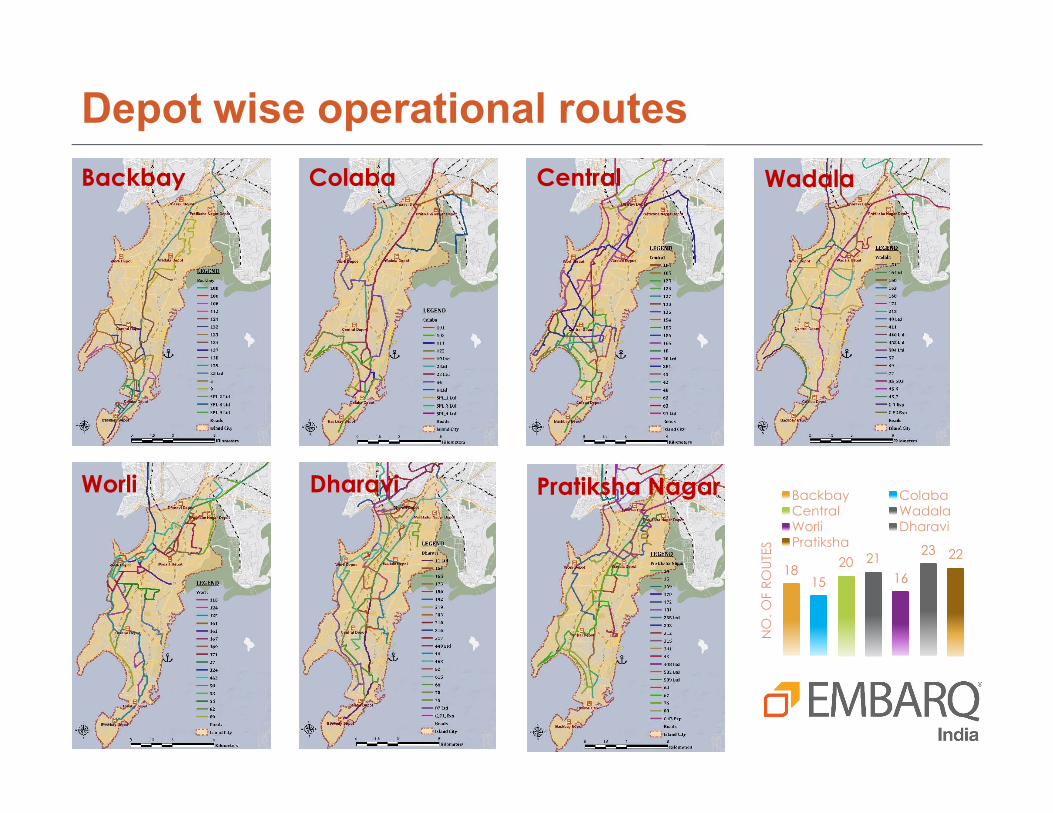
Identifying bus route
network in the study area
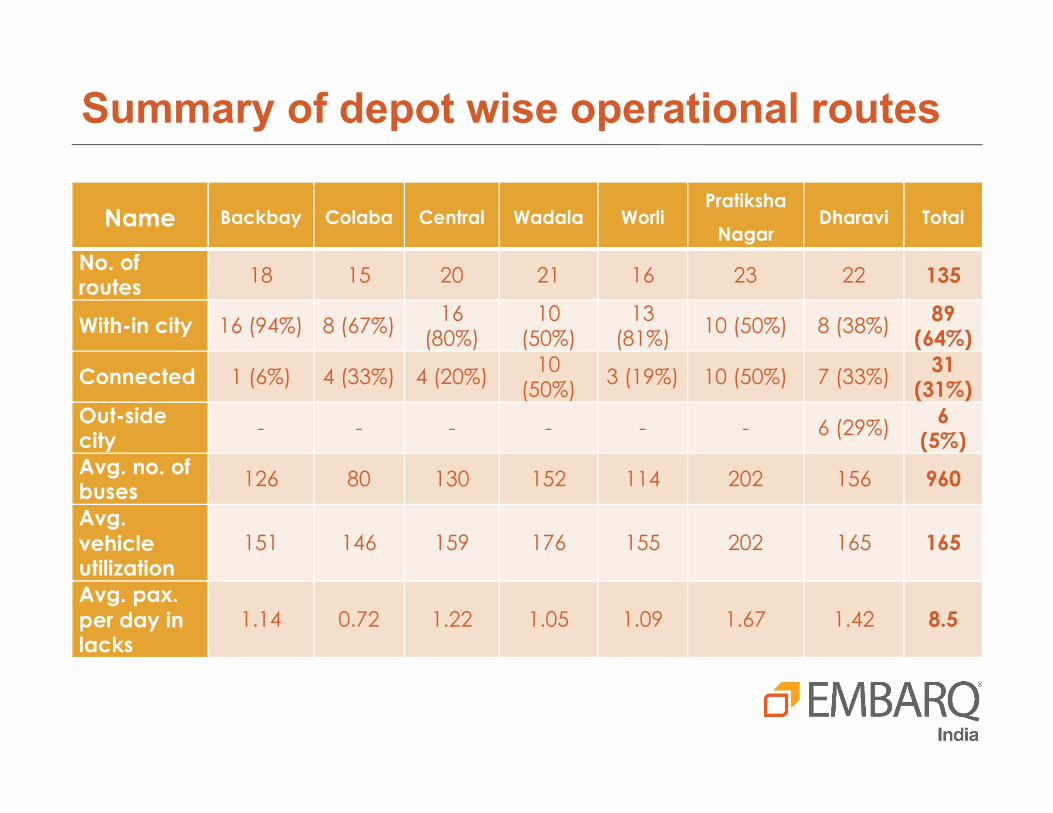
Assessment of existing bus
route network using GIS
B&A SurveysPlot existing bus
Objective: 2
Objective: 1
B&A SurveysPlot existing bus
terminals
Analysis of existing
situation
Identify terminal gaps
in the study area
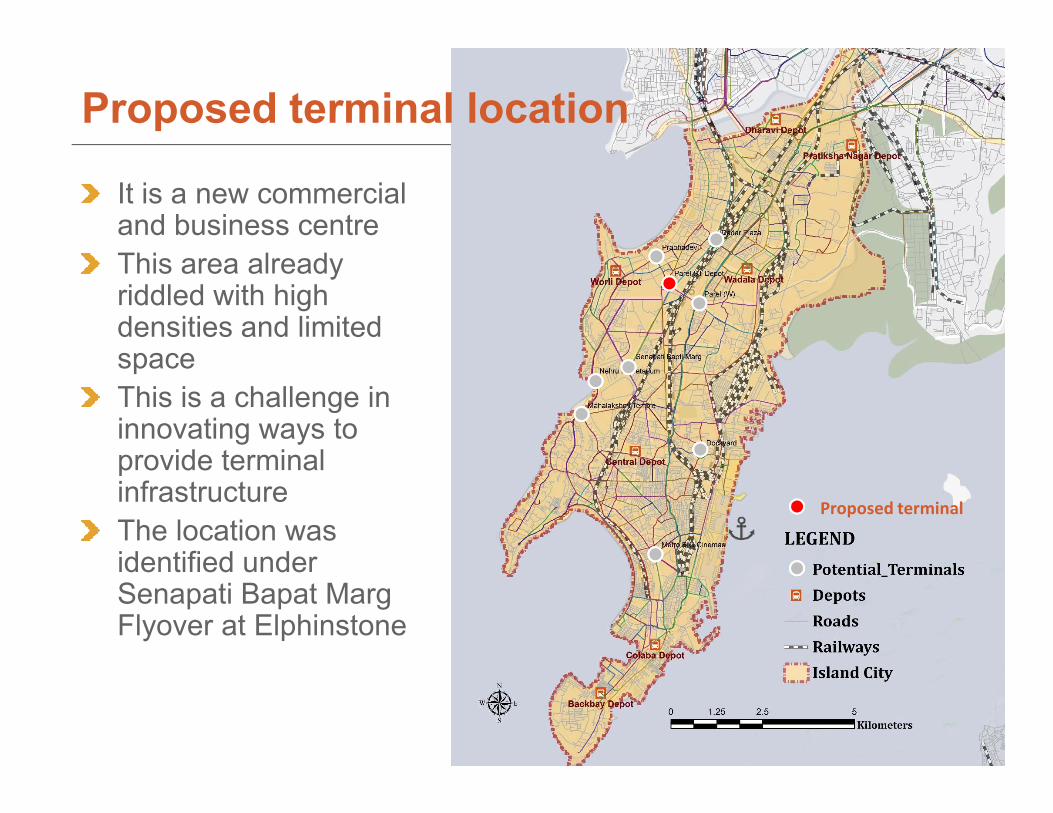
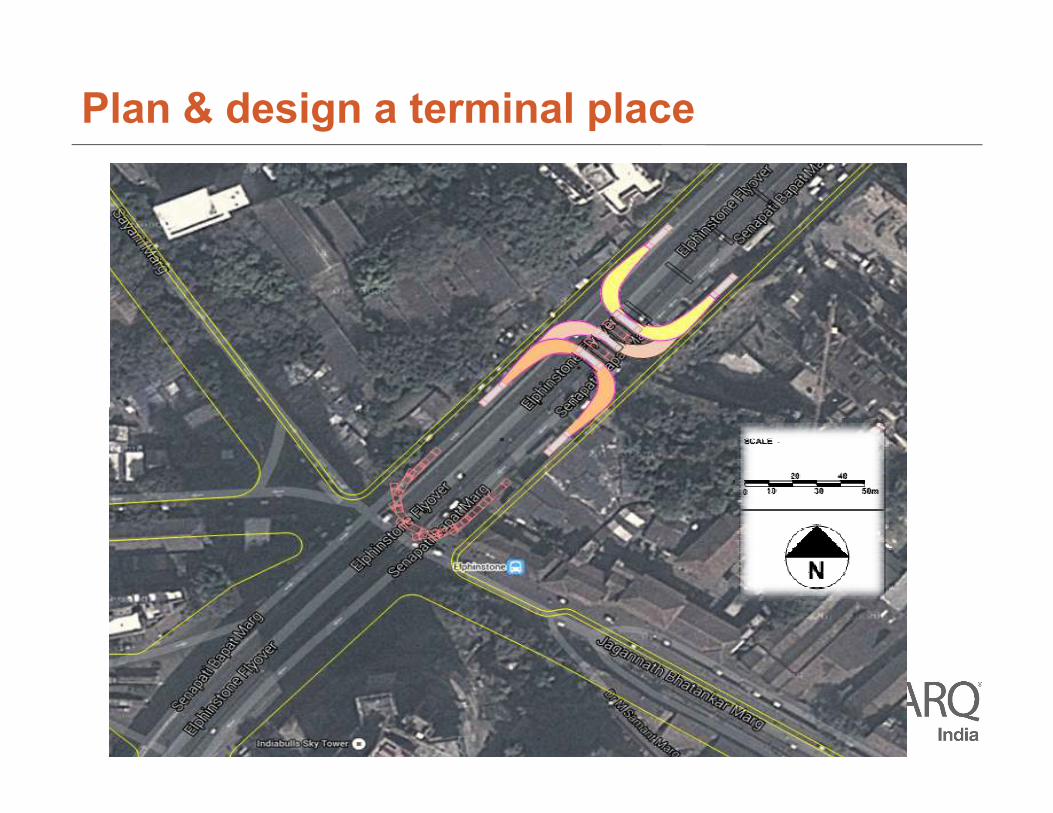
Plan and design of
the terminals
Impact on operations suggested
over the terminal
Options to incorporate
terminal infrastructure
Objective: 2
Objective: 3
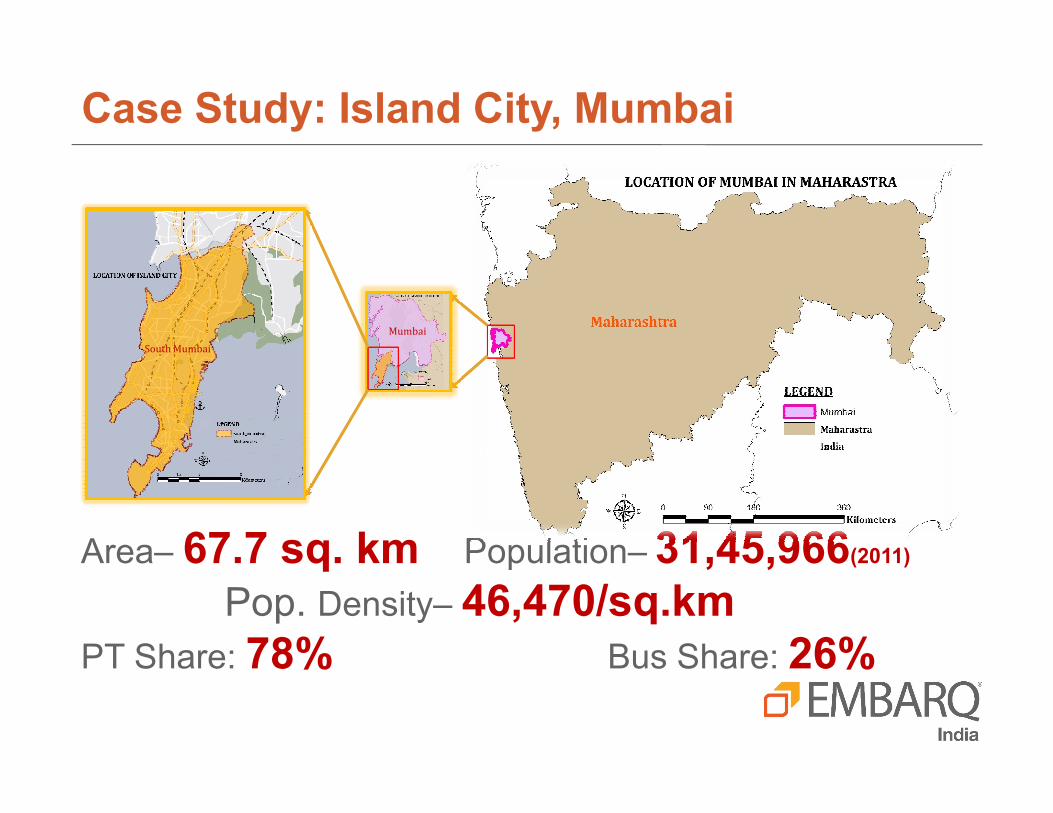
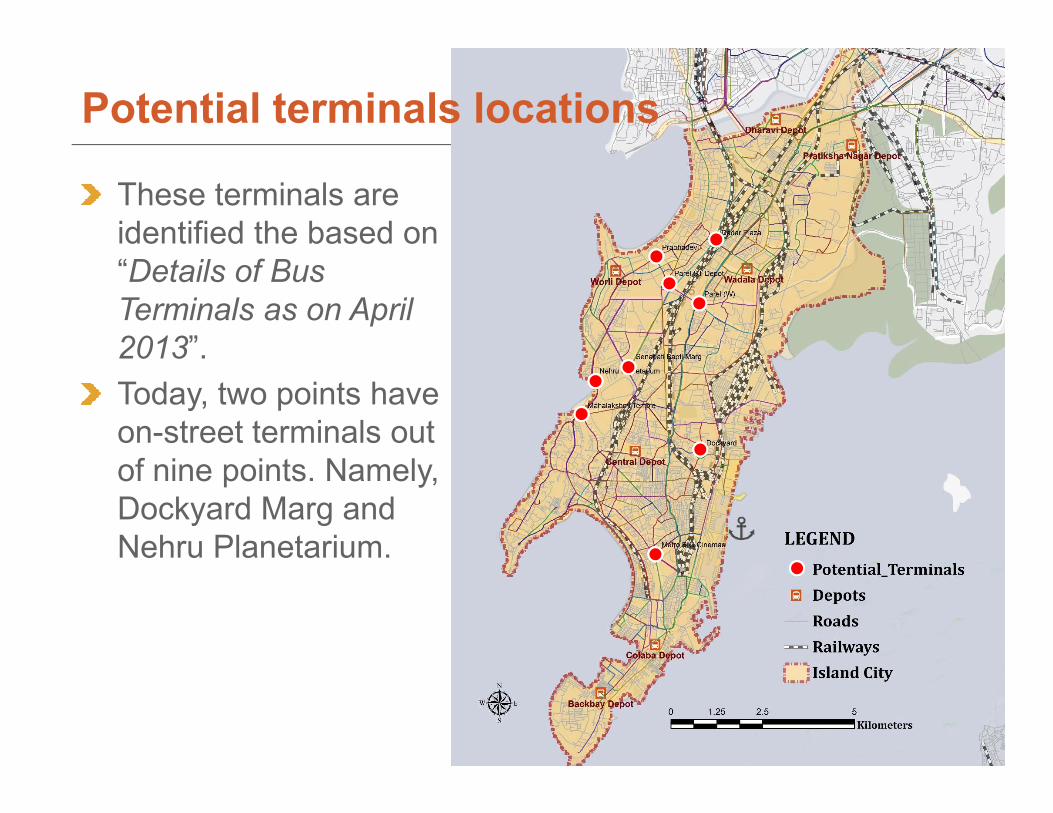
Case Study: Island City, Mumbai
Mumbai
South Mumbai
Area– 67.7 sq. km Population– 31,45,966(2011)
Pop. Density– 46,470/sq.km
PT Share: 78% Bus Share: 26%
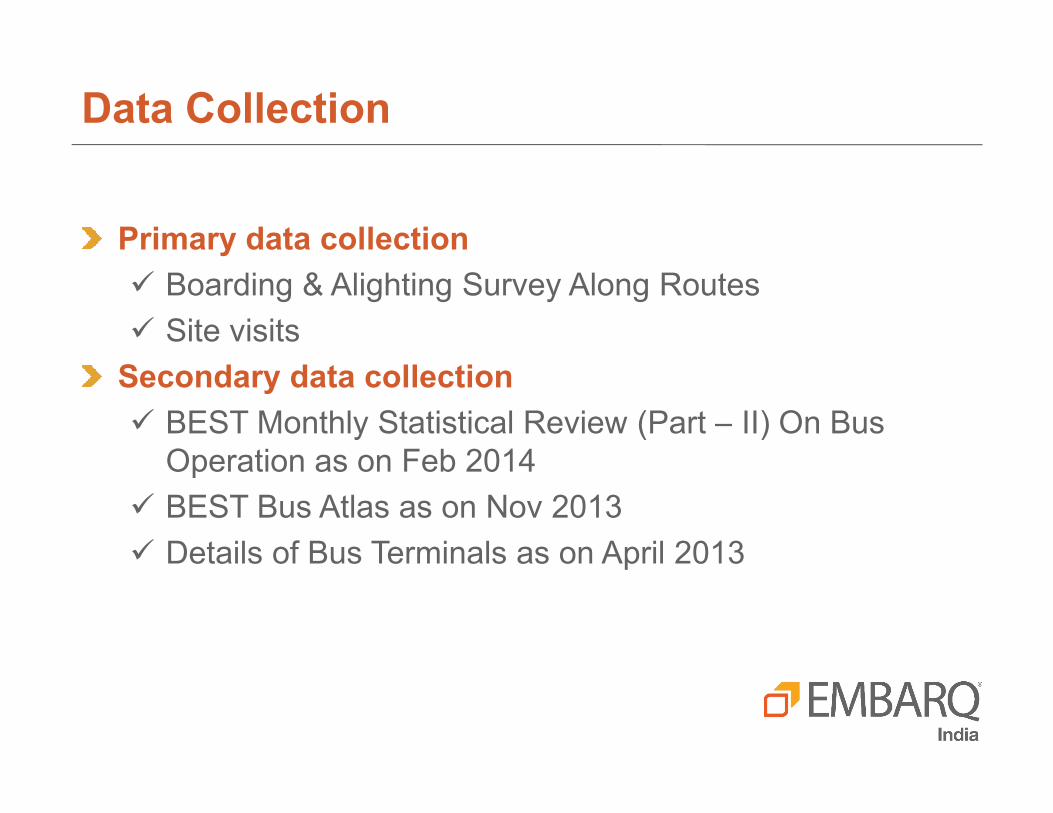
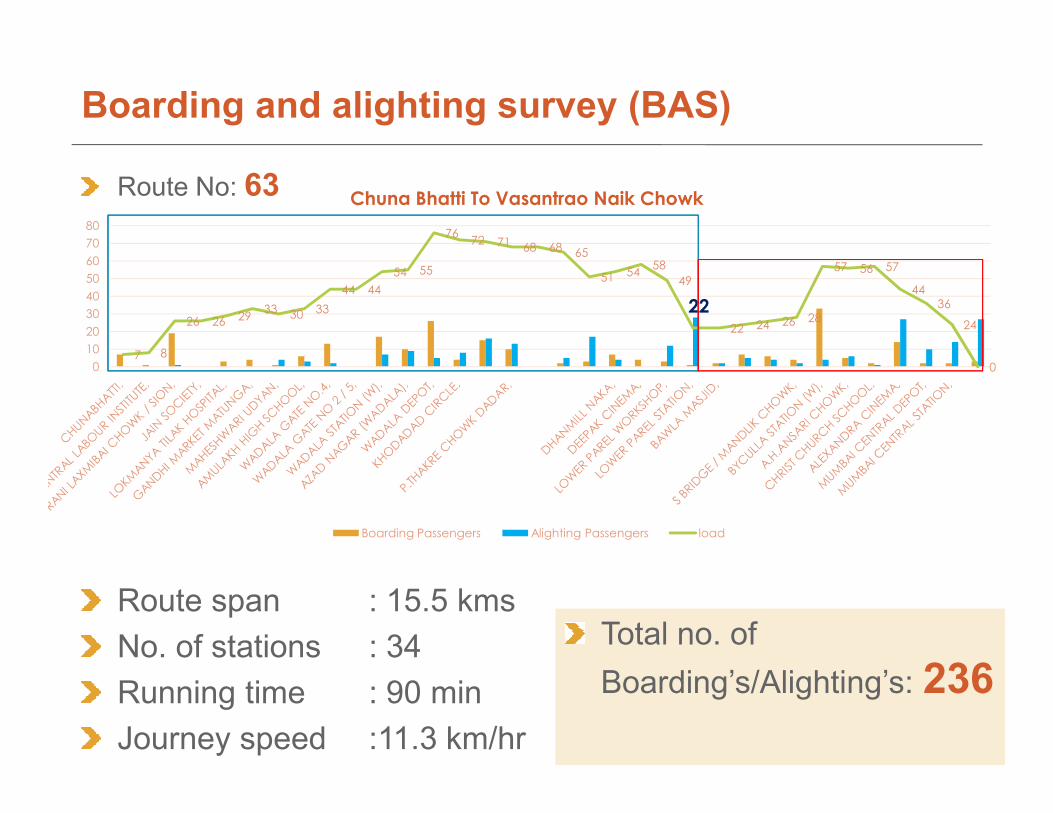
Primary data collection
� Boarding & Alighting Survey Along Routes
� Site visits
Secondary data collection
� BEST Monthly Statistical Review (Part – II) On Bus
Data Collection
� BEST Monthly Statistical Review (Part – II) On Bus