1
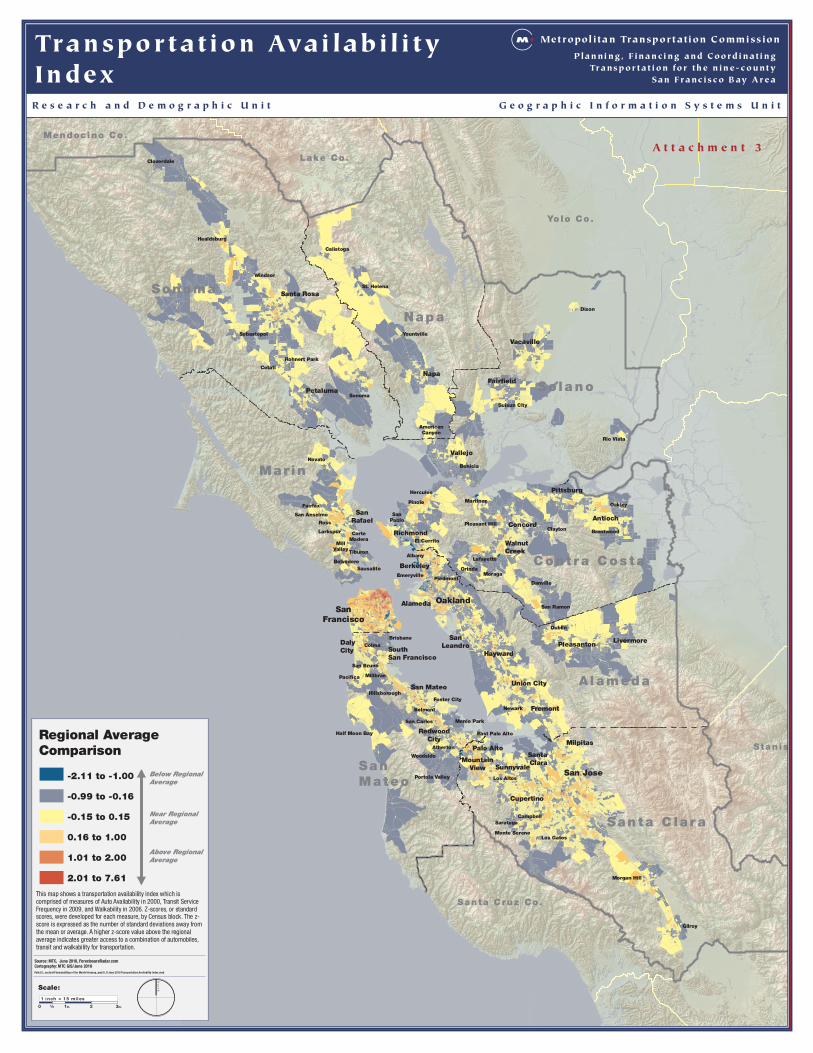
San Mateo Contra Costa Marin Sonoma Alameda Napa Solano Santa Clara Monterey Co. Santa Cruz Co. Mendocino Co. Lake Co. Yolo Co. Stanis San Jose San Francisco Oakland Yountville Woodside Windsor Tiburon Suisun City Sonoma Sebastopol Sausalito Saratoga San Ramon San Pablo San Carlos San Bruno San Anselmo St. Helena Ross Rohnert Park Rio Vista Portola Valley Pleasant Hill Pinole Piedmont Pacifica Orinda Oakley Novato Newark Morgan Hill Moraga Monte Sereno Mill Valley Millbrae Menlo Park Martinez Los Gatos Los Altos Larkspur Lafayette Hillsborough Hercules Healdsburg Half Moon Bay Gilroy Foster City Fairfax Emeryville El Cerrito East Palo Alto Dublin Dixon Danville Cotati Corte Madera Colma Cloverdale Clayton Campbell Calistoga Brisbane Brentwood Benicia Belvedere Belmont Atherton American Canyon Albany Walnut Creek Vallejo Vacaville Union City Sunnyvale South San Francisco Santa Rosa Santa Clara San Rafael San Mateo San Leandro Richmond Redwood City Pleasanton Pittsburg Petaluma Palo Alto Napa Mountain View Milpitas Livermore Hayward Fremont Fairfield Daly City Cupertino Concord Berkeley Antioch Alameda Planning, Financing and Coordinating Transportation for the nine-county San Francisco Bay Area Metropolitan Transportation Commission Transportation Availability Index Research and Demographic Unit Geographic Information Systems Unit Source: MTC, June 2010, ForeclosureRadar.com Cartography: MTC GIS/June 2010 Path:G:\_section\Planning\Map of the Month\Arcmap_proj\9_3\June 2010 Transportation Availability Index.mxd Scale: ½ 1 0 2 3in. in. 1 inch = 15 miles Regional Average Comparison This map shows a transportation availability index which is comprised of measures of Auto Availability in 2000, Transit Service Frequency in 2009, and Walkability in 2006. Z-scores, or standard scores, were developed for each measure, by Census block. The z- score is expressed as the number of standard deviations away from the mean or average. A higher z-score value above the regional average indicates greater access to a combination of automobiles, transit and walkability for transportation. Attachment 3 -2.11 to -1.00 -0.99 to -0.16 -0.15 to 0.15 0.16 to 1.00 1.01 to 2.00 2.01 to 7.61 Below Regional Average Near Regional Average Above Regional Average


![static.nypl.orgstatic.nypl.org/MOTM/Erminie/Erminie.docx · Web viewErminie. Comic opera in three acts [originally two acts, three scenes] Book and Lyrics by Claxson Bellamy and](https://static.documents.pub/doc/80x56/5a93b2d07f8b9a18628bff7e/viewerminie-comic-opera-in-three-acts-originally-two-acts-three-scenes-book.jpg)


