Seattle, WA May 18, 2007 2007 Benefit-Cost Analysis Conference Transportation Benefit-Cost Analysis: It's All About Inputs! Session 1: Case Studies in Benefit-Cost Analysis Chris Williges System Metrics Group, Inc.
Transcript
Seattle, WAMay 18, 2007
2007 Benefit-Cost Analysis Conference
Transportation Benefit-CostAnalysis: It's All About Inputs!
Session 1: Case Studiesin Benefit-Cost Analysis
Chris Williges
System Metrics Group, Inc.
1 System Metrics Group, Inc.
On two occasions, I have been asked [by members of Parliament], "Pray,Mr. Babbage, if you put into the machine wrong figures, will the rightanswers come out?" I am not able rightly to apprehend the kind ofconfusion of ideas that could provoke such a question.
- Charles Babbage (1791-1871), mathematician and inventor of theDifference Engine
2 System Metrics Group, Inc.
Topics Covered
Transportation Benefit-Cost Analysis
Cal-B/C Model
A Recent Application of the Model
Lessons
3 System Metrics Group, Inc.
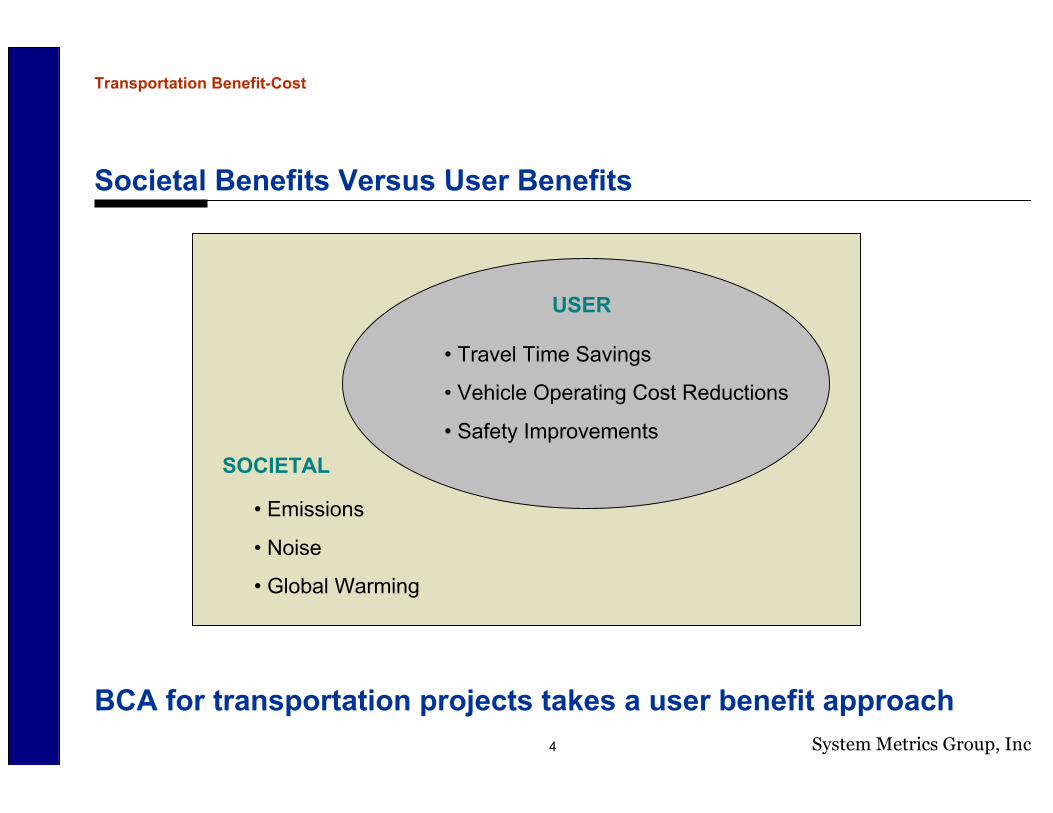
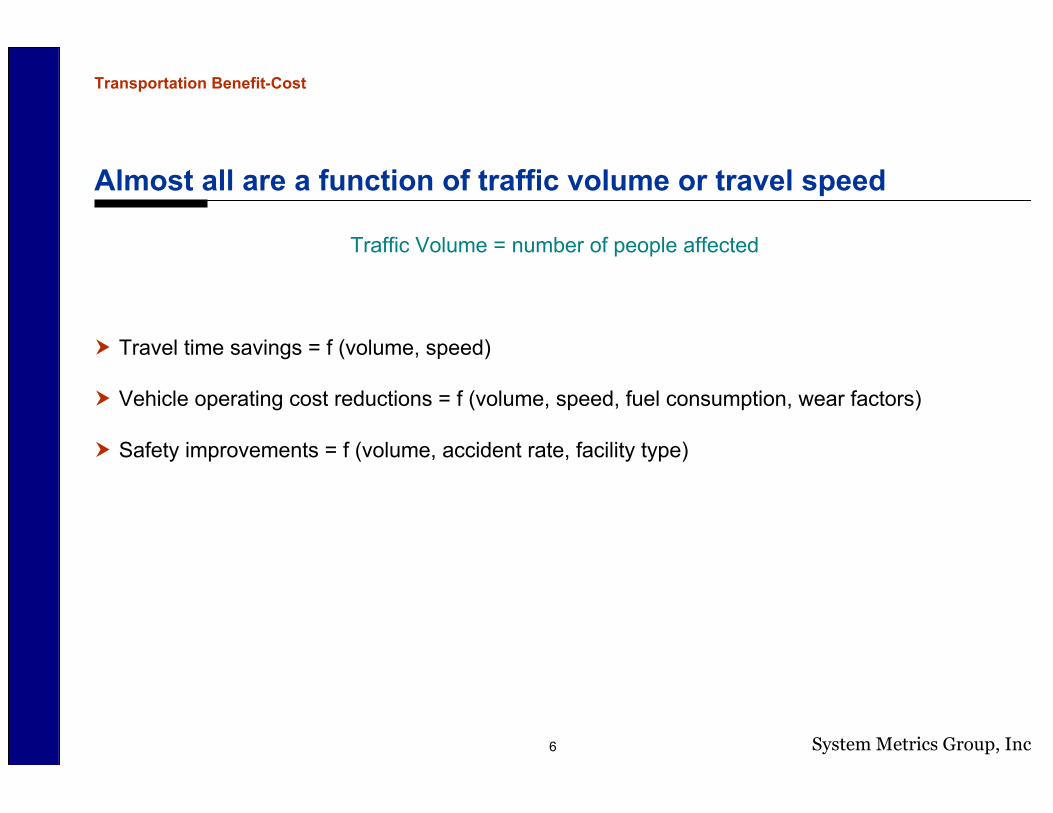
Most transportation benefit-cost assessments include three typesof user benefits
Travel time savings - difference in the time users spend traveling before and after constructionof projects
Safety improvements = f (volume, accident rate, facility type)
Transportation Benefit-Cost
7 System Metrics Group, Inc.
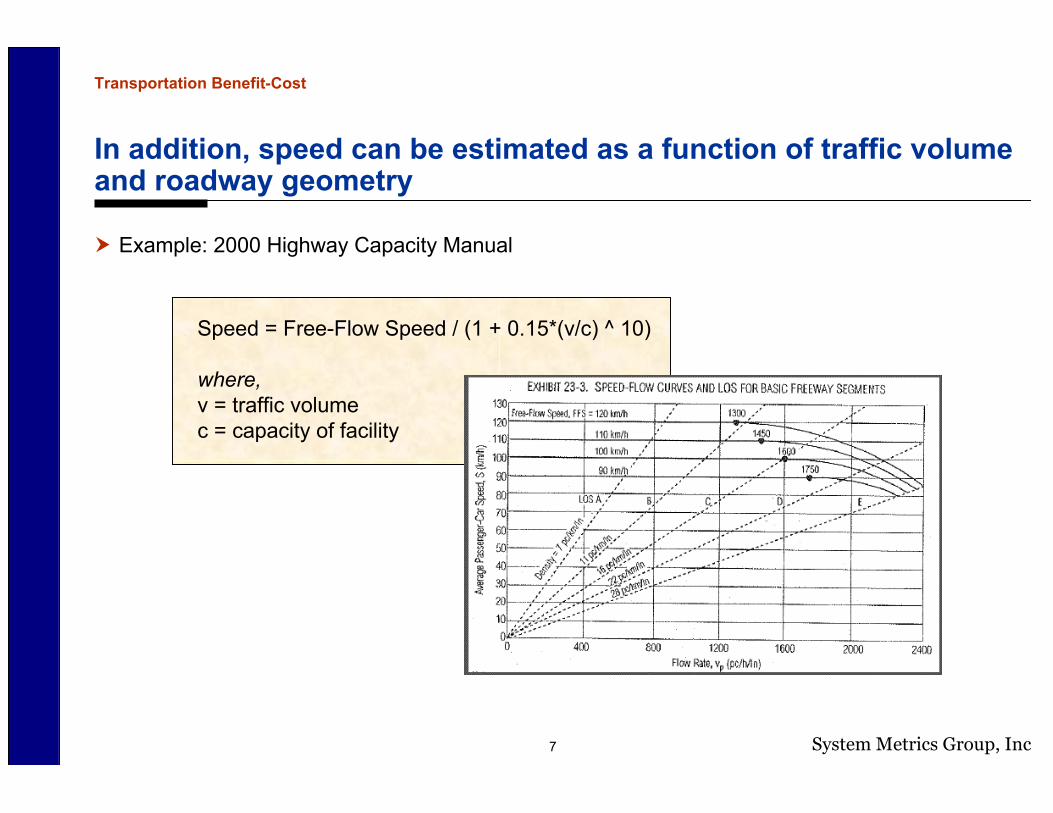
In addition, speed can be estimated as a function of traffic volumeand roadway geometry
Example: 2000 Highway Capacity Manual
Speed = Free-Flow Speed / (1 + 0.15*(v/c) ^ 10)
where,v = traffic volumec = capacity of facility
Transportation Benefit-Cost
8 System Metrics Group, Inc.
Sources of Traffic Volume and Travel Speed Data
Traffic counts– Estimate number of vehicles using facility– States, cities, and counties collect their own data– Ad hoc (e.g. specific study) or regular (e.g., annual) basis
Regional travel demand models– Forecast travel on regional transportation networks– Incorporate traffic counts, travel and housing projections, and probability models– Regional planning agencies required to use
Micro-simulation models– Model operational performance– Use a variety of techniques– Favored by traffic engineers
Transportation Benefit-Cost
9 System Metrics Group, Inc.
Tradeoff in Transportation Benefit-Cost Models
Transportation Benefit-Cost
Simplicity (easy-to-use) Accuracy (flexibility to addressmultiple project types and their
network effects)
10 System Metrics Group, Inc.
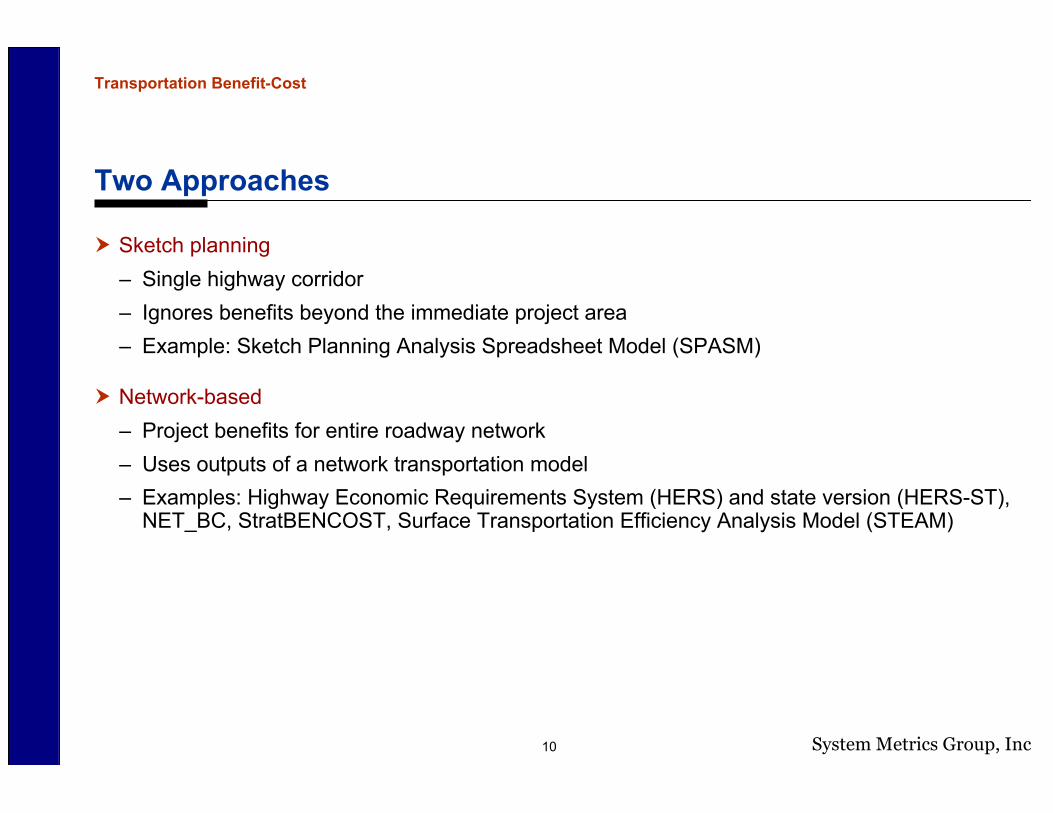
Two Approaches
Sketch planning– Single highway corridor– Ignores benefits beyond the immediate project area– Example: Sketch Planning Analysis Spreadsheet Model (SPASM)
Network-based– Project benefits for entire roadway network– Uses outputs of a network transportation model– Examples: Highway Economic Requirements System (HERS) and state version (HERS-ST),
NET_BC, StratBENCOST, Surface Transportation Efficiency Analysis Model (STEAM)
Transportation Benefit-Cost
11 System Metrics Group, Inc.
Cal-B/C is intended to be a simple benefit-cost model
Excel worksheet (i.e., not a black box)
Developed in mid-1990s to conduct investment analysis of State Transportation ImprovementProgram (STIP)
Handles both highway and transit projects
Estimates four user benefits (including emissions) in a corridor analysis
Can accept regional planning model inputs
Uses a 20-year life-cycle
Estimates speeds from volumes (v/c ratios)
Cal-B/C Model
12 System Metrics Group, Inc.
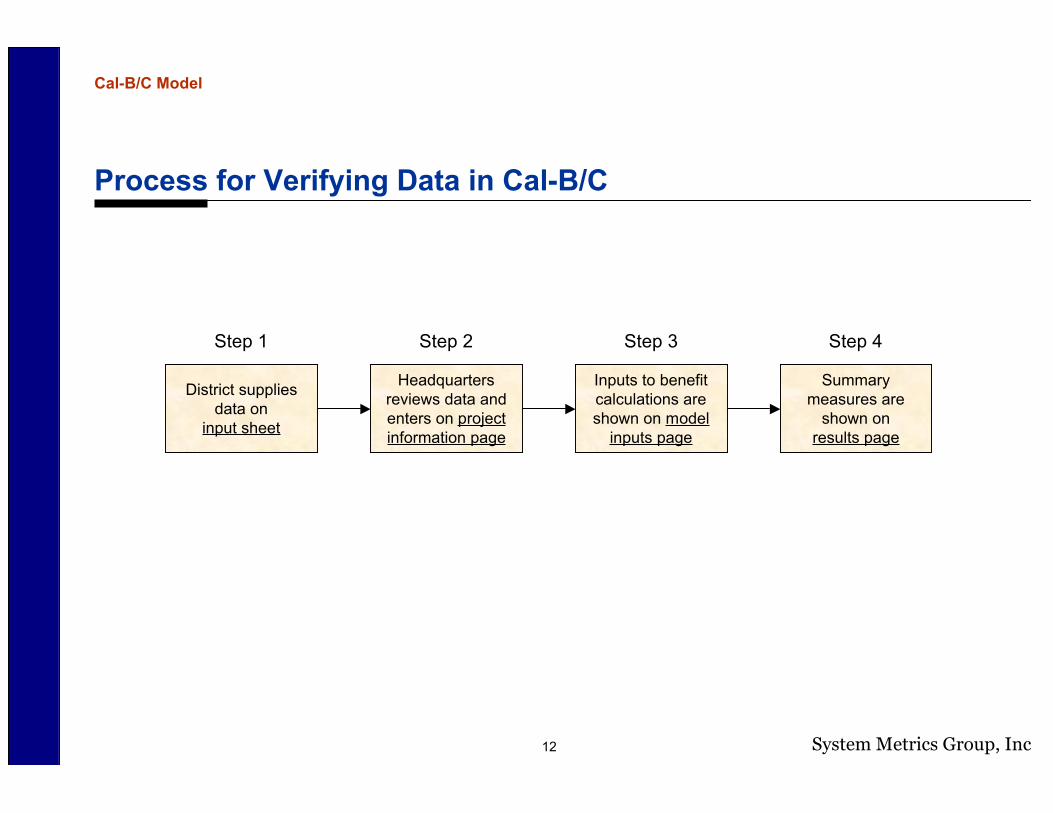
Process for Verifying Data in Cal-B/C
Cal-B/C Model
District suppliesdata on
input sheet
Step 1
Headquartersreviews data andenters on projectinformation page
Step 2
Inputs to benefitcalculations areshown on model
inputs page
Step 3
Summarymeasures are
shown onresults page
Step 4
13 System Metrics Group, Inc.
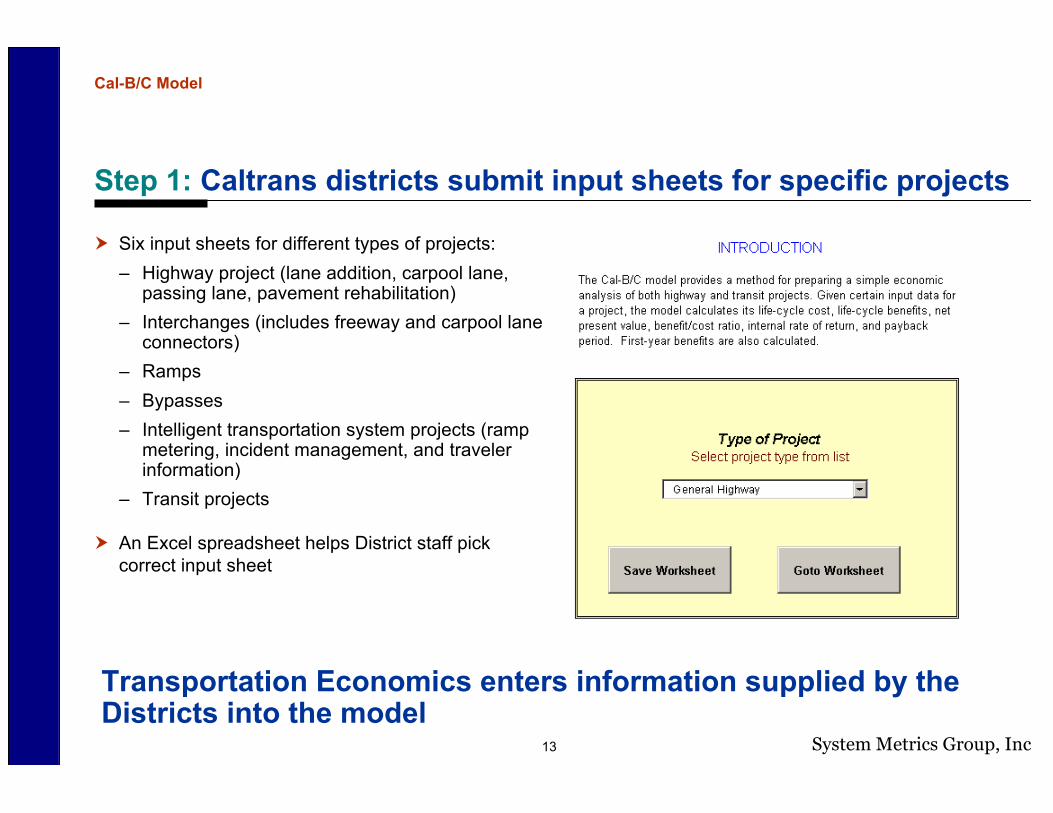
Step 1: Caltrans districts submit input sheets for specific projects
Six input sheets for different types of projects:– Highway project (lane addition, carpool lane,
passing lane, pavement rehabilitation)– Interchanges (includes freeway and carpool lane
connectors)– Ramps– Bypasses– Intelligent transportation system projects (ramp
metering, incident management, and travelerinformation)
– Transit projects
An Excel spreadsheet helps District staff pickcorrect input sheet
Transportation Economics enters information supplied by theDistricts into the model
Cal-B/C Model
14 System Metrics Group, Inc.
Step 2: Information about a project is entered using data suppliedby Caltrans districts
Cal-B/C Model
15 System Metrics Group, Inc.
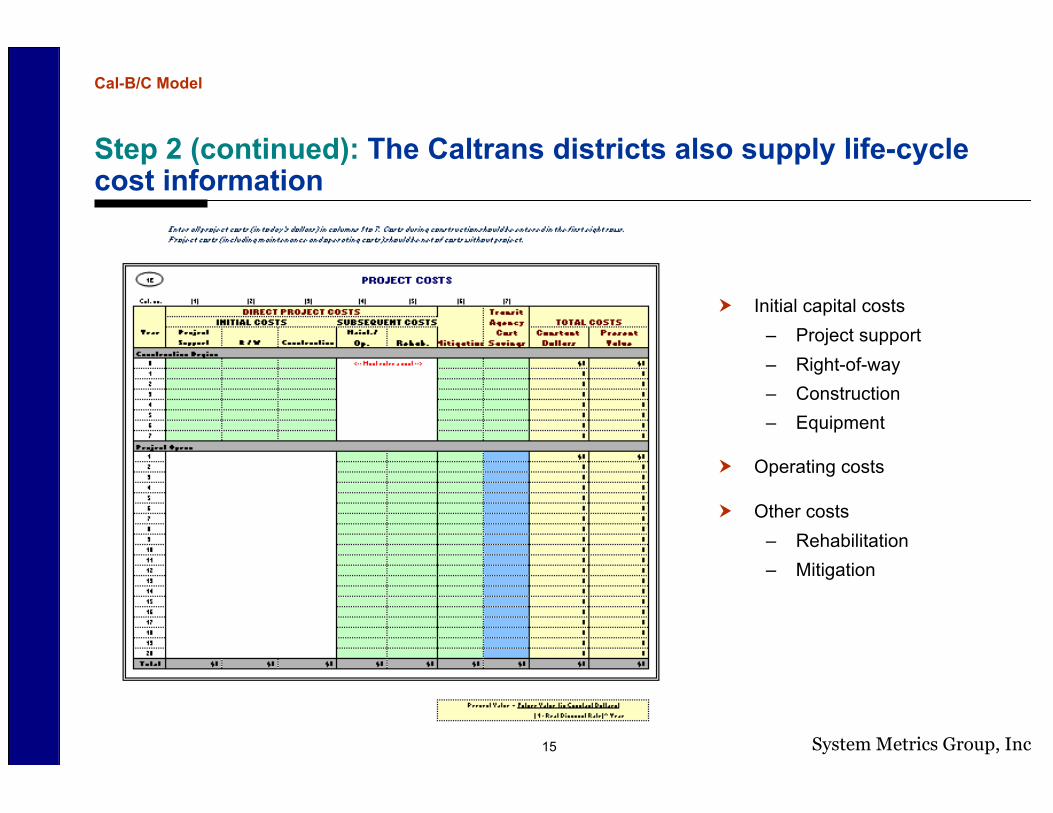
Step 2 (continued): The Caltrans districts also supply life-cyclecost information
Initial capital costs– Project support– Right-of-way– Construction– Equipment
Operating costs
Other costs– Rehabilitation– Mitigation
Cal-B/C Model
16 System Metrics Group, Inc.
Step 3: Data can be adjusted if detailed information is availablefrom regional planning or micro-simulation models
Cal-B/C Model
17 System Metrics Group, Inc.
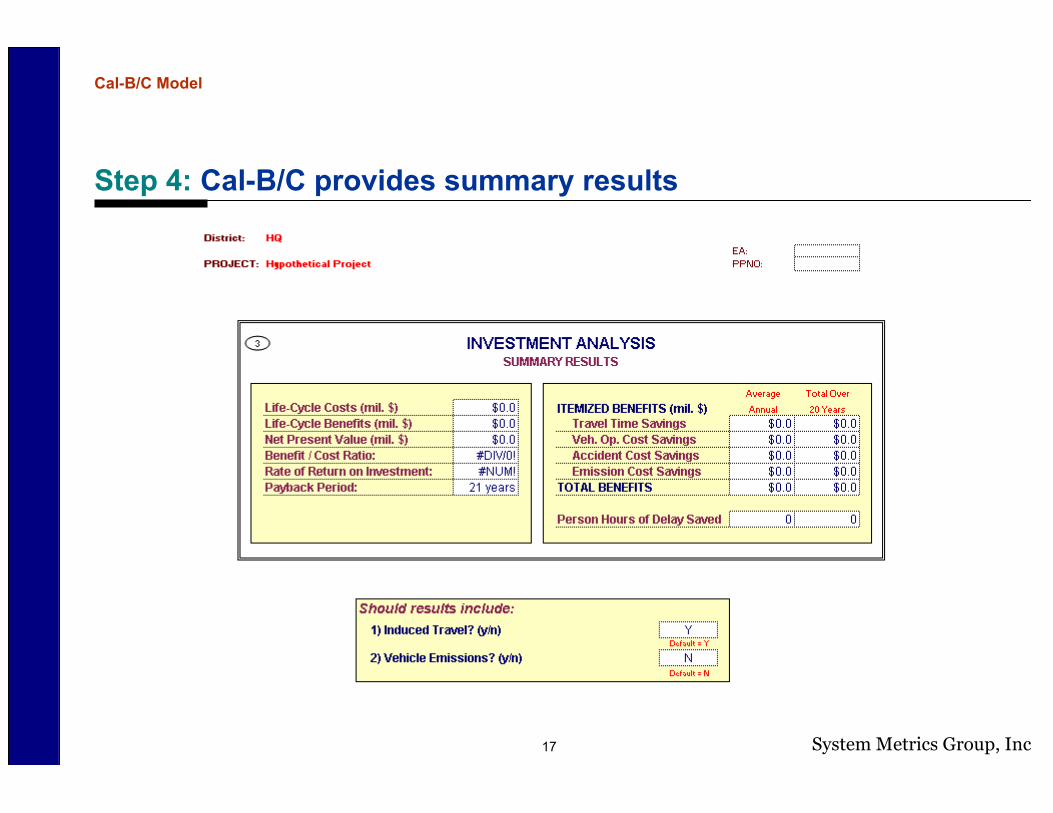
Step 4: Cal-B/C provides summary results
Cal-B/C Model
18 System Metrics Group, Inc.
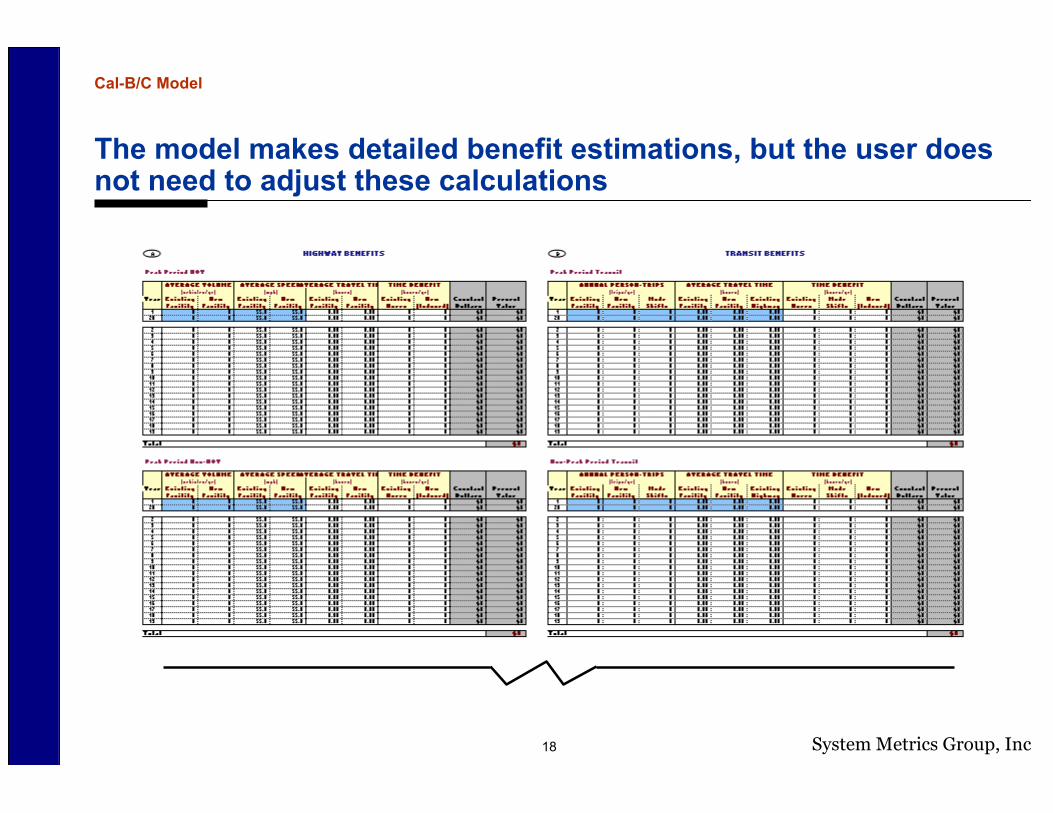
The model makes detailed benefit estimations, but the user doesnot need to adjust these calculations
Cal-B/C Model
19 System Metrics Group, Inc.
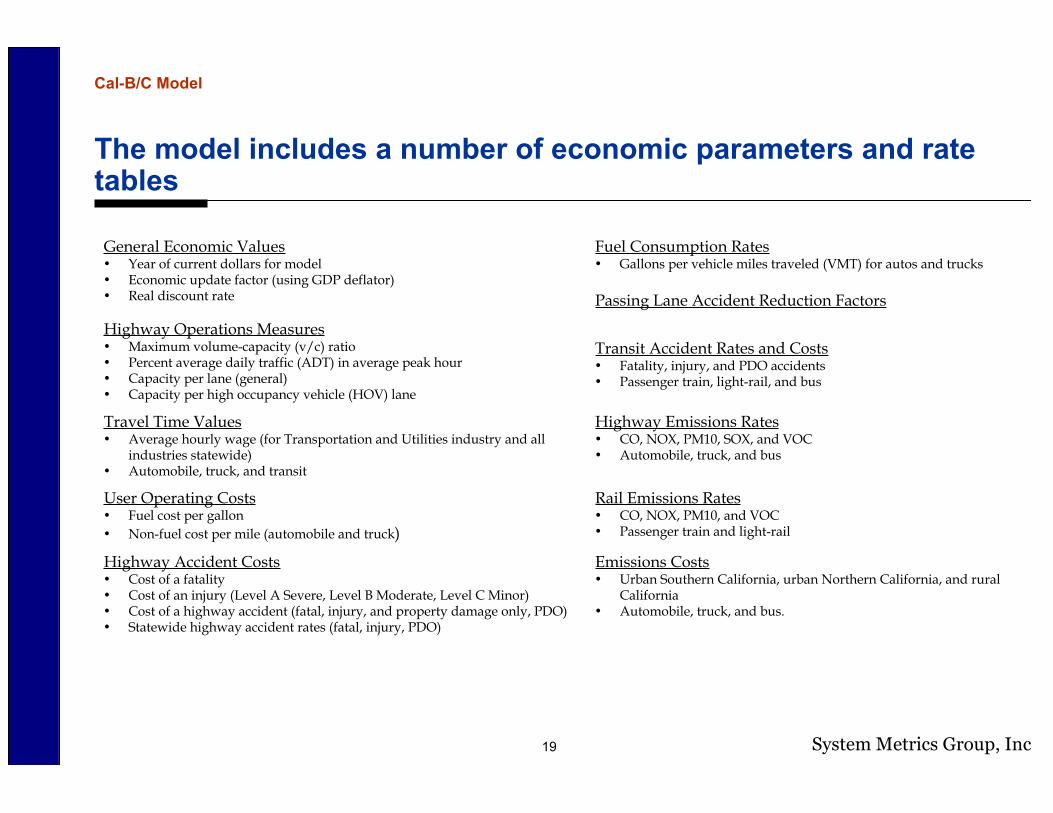
The model includes a number of economic parameters and ratetables
Emissions Costs• Urban Southern California, urban Northern California, and rural
California• Automobile, truck, and bus.
Highway Accident Costs• Cost of a fatality• Cost of an injury (Level A Severe, Level B Moderate, Level C Minor)• Cost of a highway accident (fatal, injury, and property damage only, PDO)• Statewide highway accident rates (fatal, injury, PDO)
Rail Emissions Rates• CO, NOX, PM10, and VOC• Passenger train and light-rail
User Operating Costs• Fuel cost per gallon• Non-fuel cost per mile (automobile and truck)
Highway Emissions Rates• CO, NOX, PM10, SOX, and VOC• Automobile, truck, and bus
Travel Time Values• Average hourly wage (for Transportation and Utilities industry and all
industries statewide)• Automobile, truck, and transit
Transit Accident Rates and Costs• Fatality, injury, and PDO accidents• Passenger train, light-rail, and bus
Highway Operations Measures• Maximum volume-capacity (v/c) ratio• Percent average daily traffic (ADT) in average peak hour• Capacity per lane (general)• Capacity per high occupancy vehicle (HOV) lane
Fuel Consumption Rates• Gallons per vehicle miles traveled (VMT) for autos and trucks
Passing Lane Accident Reduction Factors
General Economic Values• Year of current dollars for model• Economic update factor (using GDP deflator)• Real discount rate
Cal-B/C Model
20 System Metrics Group, Inc.
Highway Safety, Traffic Reduction, Air Quality, and Port SecurityBond Act (Proposition 1B)
Approved in November 7, 2006 election
Infrastructure Bond Package - $19.9 billion
Some important components:– Corridor Mobility Improvement Account (CMIA) - $4.5 billion– STIP Augmentation - $2.0 billion– SHOPP Augmentation - $500 million
Recent Application
21 System Metrics Group, Inc.
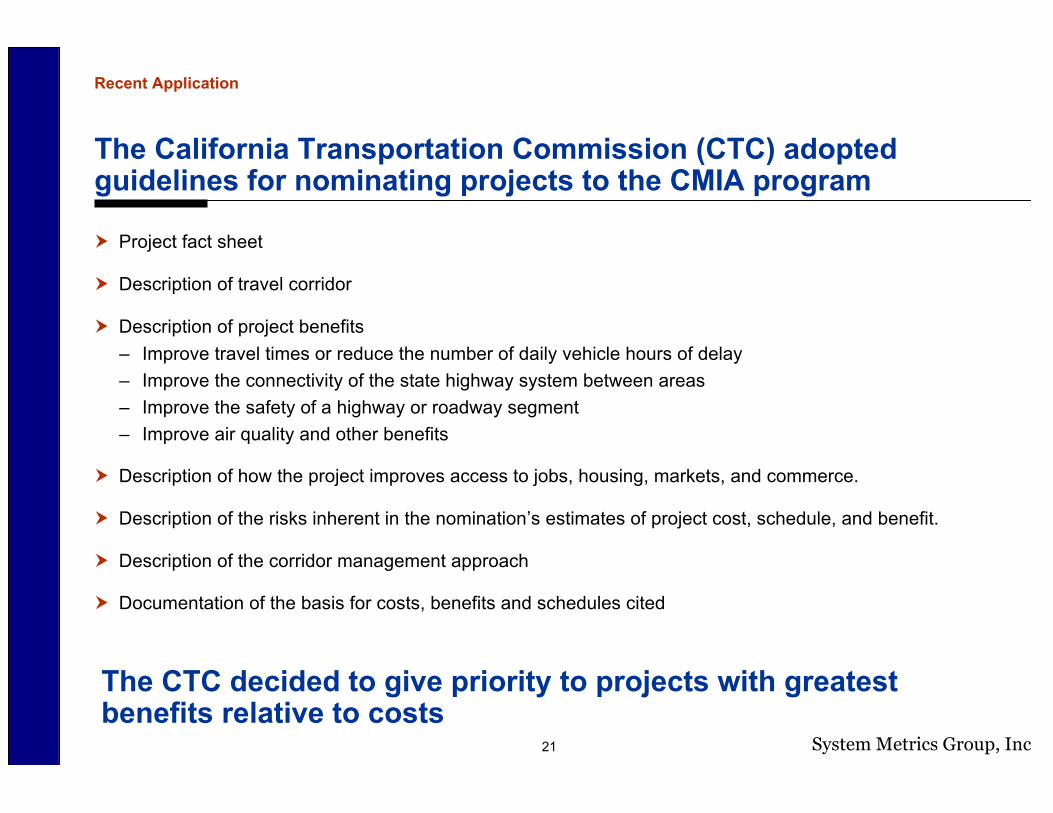
The California Transportation Commission (CTC) adoptedguidelines for nominating projects to the CMIA program
Project fact sheet
Description of travel corridor
Description of project benefits– Improve travel times or reduce the number of daily vehicle hours of delay– Improve the connectivity of the state highway system between areas– Improve the safety of a highway or roadway segment– Improve air quality and other benefits
Description of how the project improves access to jobs, housing, markets, and commerce.
Description of the risks inherent in the nomination’s estimates of project cost, schedule, and benefit.
Description of the corridor management approach
Documentation of the basis for costs, benefits and schedules cited
The CTC decided to give priority to projects with greatestbenefits relative to costs
Recent Application
22 System Metrics Group, Inc.
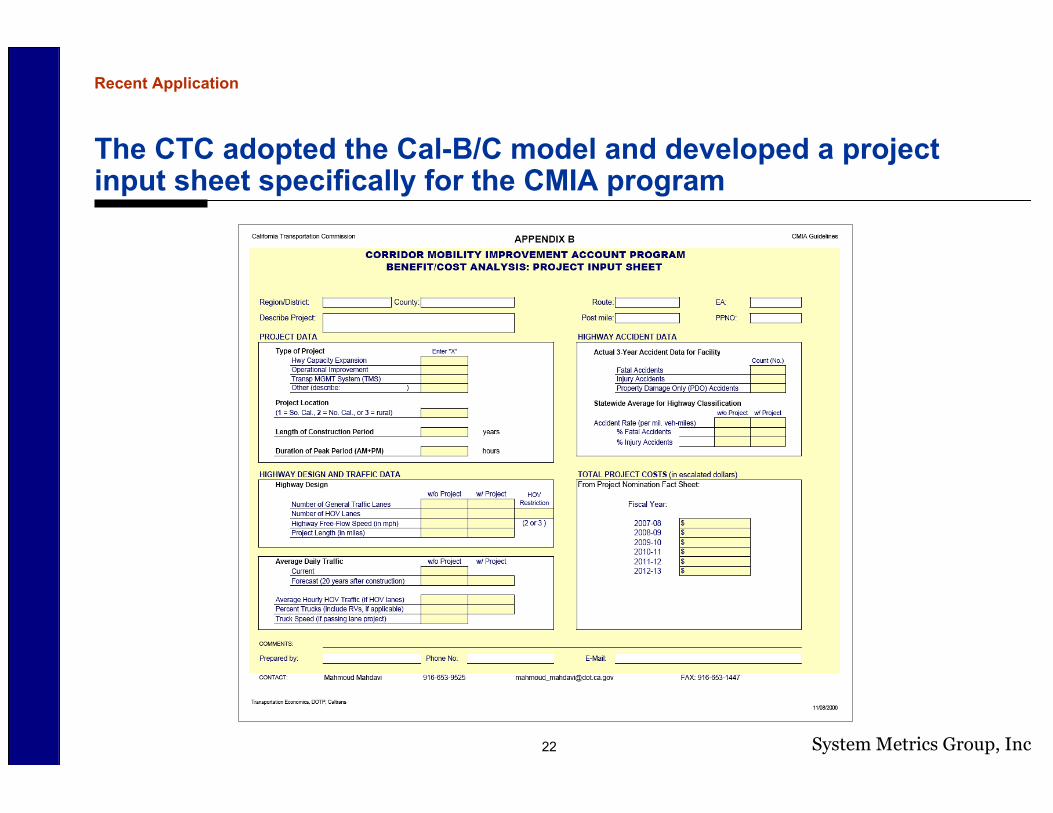
The CTC adopted the Cal-B/C model and developed a projectinput sheet specifically for the CMIA program
Recent Application
23 System Metrics Group, Inc.
Over 100 projects were to be assessed in a few weeks
Project nominations were due January 15, 2007
CMIA program was adopted February 28, 2007
Caltrans conducted a Cal-B/C training session
Staff identified preferred project information sources and method for validating data
Recent Application
24 System Metrics Group, Inc.
The CTC received 149 nominations for $11.3 billion in proposedprojects
Caltrans received multiple project input sheets for some projects– Over 200 project information sheets– Multiple submitting agencies– Reflected different data
Other problems included:– Missing data or unknown values– Corridor level data for projects that have network impacts– Differences in definitions of “capacity”– Attempts at “gaming” that result in lower rather than higher benefits– Projects thought to be beneficial, but with no quantified benefits
Recent Application
25 System Metrics Group, Inc.
Judgment was needed to identify best input data, but benefit-costanalysis provided a relatively unbiased way of making comparisons
Fifty-five (55) projects qualified for the CMIA program
Average benefit-cost ratio of about 2.4
Selected projects ranged from under 1.0 to over 8.0
The CTC used multiple selection criteria– Unquantifiable benefits– Need for judgment
Data difficulties attributed to steep learning curve and short analysis timeframe
Some agencies did not like the use of benefit-cost evaluation– Favored projects not selected– The model was an easy culprit
Recent Application
26 System Metrics Group, Inc.
Future of BCA in California Transportation Planning
The CTC is continuing to use benefit-cost analysis for other Proposition 1B programs
Caltrans is convening a committee to guide further benefit-cost analysis– Develop guidance on how to use benefit-cost modeling in corridor analysis– Test sensitivity of Cal-B/C to data inputs
The lack of consistent input data drives a fundamental decision in the model’s evolution…
Should Cal-B/C remain an economic tool that can helps quantify and summarize user benefits,or become planning/engineering judgment tool that replaces traditional analysis?
Recent Application
27 System Metrics Group, Inc.
Lessons for “Real-World” Analysis
Practitioners need to scrutinize the input data– Economists as transportation planners and engineers– Multiple sets of information - which data are best?
Non-practitioners need training in benefit-cost analysis– Transportation planners and engineers are the experts– With greater knowledge can lead to “gaming the system”
Practitioners need to be cognizant of the inputs that drive results– Every user benefit is a function of travel speed or traffic volume– Estimation of these values typically occurs outside benefit-cost models– Greater impact on benefit-cost results than any of the assumptions inside transportation benefit-cost
models (the value of time, the value of life, fuel and non-fuel vehicle operating costs, emissions tables)
Academic research needs to provide guidance on important economic values– About 60 to 80 percent of the user benefits are due to travel time savings– Further research needed on value of time (differs with length of time, the time of day, goods moved, etc.)
Guidelines on the appropriate input data are important
Lessons
28 System Metrics Group, Inc.
On two occasions, I have been asked [by members of Parliament], "Pray,Mr. Babbage, if you put into the machine wrong figures, will the rightanswers come out?" I am not able rightly to apprehend the kind ofconfusion of ideas that could provoke such a question.
- Charles Babbage (1791-1871), mathematician and inventor of theDifference Engine