66
Transportation Carbon Intensity Targets for the European Union – Road and Aviation Sectors Author: ADAM CHRISTENSEN [email protected]

Transportation Carbon Intensity Targets for theEuropean Union – Road and Aviation Sectors
Author:
ADAM CHRISTENSEN

Copyright © 2021
Final Release, August 9, 2021

ii
Contents
1 Executive Summary 1
2 Introduction and Policy Context 6
3 Model Description 83.1 Consumer agents . . . . . . . . . . . . . . . . . . . . . . . . . . . . . . . . . . . . . . . . 93.2 Blender agent . . . . . . . . . . . . . . . . . . . . . . . . . . . . . . . . . . . . . . . . . . 10
3.2.1 Policy constraints . . . . . . . . . . . . . . . . . . . . . . . . . . . . . . . . . . . . 12Food-based biofuels eligibility . . . . . . . . . . . . . . . . . . . . . . . . . . . . . 12Annex IX, Part B fuels eligibility . . . . . . . . . . . . . . . . . . . . . . . . . . . . 12Intermediate crop-based fuels eligibility . . . . . . . . . . . . . . . . . . . . . . . . 13Palm oil fuels eligibility . . . . . . . . . . . . . . . . . . . . . . . . . . . . . . . . 13Renewable fuels mandate . . . . . . . . . . . . . . . . . . . . . . . . . . . . . . . . 14Advanced biofuels mandate . . . . . . . . . . . . . . . . . . . . . . . . . . . . . . 15Alternative aviation fuels mandate . . . . . . . . . . . . . . . . . . . . . . . . . . . 16Aviation e-Fuels mandate . . . . . . . . . . . . . . . . . . . . . . . . . . . . . . . 16Renewable fuel of non-biological origin mandate . . . . . . . . . . . . . . . . . . . 17Carbon intensity standard (GHG target) . . . . . . . . . . . . . . . . . . . . . . . . 17
3.3 Supply agents . . . . . . . . . . . . . . . . . . . . . . . . . . . . . . . . . . . . . . . . . . 183.4 Additional modeling details . . . . . . . . . . . . . . . . . . . . . . . . . . . . . . . . . . . 19
3.4.1 Carbon intensities . . . . . . . . . . . . . . . . . . . . . . . . . . . . . . . . . . . 193.4.2 Supply elasticities . . . . . . . . . . . . . . . . . . . . . . . . . . . . . . . . . . . 19
3.5 Sensitivity tests . . . . . . . . . . . . . . . . . . . . . . . . . . . . . . . . . . . . . . . . . 19
4 Policy Scenario Matrix 21
5 Fuel Consumption Impacts 23
6 Vehicle Kilometers Traveled (VKT) 256.1 LDV consumer VKT . . . . . . . . . . . . . . . . . . . . . . . . . . . . . . . . . . . . . . 25
7 GHG Credit Prices 277.1 Scenario #1: REDII revision proposal . . . . . . . . . . . . . . . . . . . . . . . . . . . . . 287.2 Scenario #2: Lower GHG target . . . . . . . . . . . . . . . . . . . . . . . . . . . . . . . . 297.3 Scenario #3: No food-based biofuels . . . . . . . . . . . . . . . . . . . . . . . . . . . . . . 307.4 Scenario #4: No food-based or intermediate crops . . . . . . . . . . . . . . . . . . . . . . . 31

iii
7.5 Scenario #5: No intermediate crops . . . . . . . . . . . . . . . . . . . . . . . . . . . . . . 327.6 Scenario #6: Higher subtargets . . . . . . . . . . . . . . . . . . . . . . . . . . . . . . . . . 337.7 Scenario #7: Low EV growth . . . . . . . . . . . . . . . . . . . . . . . . . . . . . . . . . . 34
8 Overall Program Cost 35
9 Discussion 369.1 Intermediate crops . . . . . . . . . . . . . . . . . . . . . . . . . . . . . . . . . . . . . . . 369.2 Food-and-feed based biofuels . . . . . . . . . . . . . . . . . . . . . . . . . . . . . . . . . . 379.3 GHG target level . . . . . . . . . . . . . . . . . . . . . . . . . . . . . . . . . . . . . . . . 379.4 Aviation fuels . . . . . . . . . . . . . . . . . . . . . . . . . . . . . . . . . . . . . . . . . . 389.5 Electric vehicles . . . . . . . . . . . . . . . . . . . . . . . . . . . . . . . . . . . . . . . . . 389.6 Regarding carbon abatement costs . . . . . . . . . . . . . . . . . . . . . . . . . . . . . . . 38
A Fuel Categories 40
B Credit Multipliers 41
C Elasticities 43
D Baseline Data 45
E Detailed Fuel Quantity Results 47

iv
List of Figures
1.1 Energy consumption by fuel category by policy scenario. Values shown here are meanvalues from the sensitivity experiments. . . . . . . . . . . . . . . . . . . . . . . . . . . . . 3
5.1 Energy consumption by fuel category by policy scenario. Values shown here are meanvalues from the sensitivity experiments. . . . . . . . . . . . . . . . . . . . . . . . . . . . . 23
6.1 LDV kilometers traveled by policy scenario. Values shown here are mean values from thesensitivity experiments. . . . . . . . . . . . . . . . . . . . . . . . . . . . . . . . . . . . . . 25
6.2 EV only kilometers traveled by policy scenario. Values shown here are mean values fromthe sensitivity experiments. . . . . . . . . . . . . . . . . . . . . . . . . . . . . . . . . . . . 26
7.1 Mean GHG credit price by policy scenario. . . . . . . . . . . . . . . . . . . . . . . . . . . 277.2 Distribution of GHG credit prices for scenario #1. . . . . . . . . . . . . . . . . . . . . . . . 287.3 Distribution of GHG credit prices for scenario #2. . . . . . . . . . . . . . . . . . . . . . . . 297.4 Distribution of GHG credit prices for scenario #3. . . . . . . . . . . . . . . . . . . . . . . . 307.5 Distribution of GHG credit prices for scenario #4. . . . . . . . . . . . . . . . . . . . . . . . 317.6 Distribution of GHG credit prices for scenario #5. . . . . . . . . . . . . . . . . . . . . . . . 327.7 Distribution of GHG credit prices for scenario #6. . . . . . . . . . . . . . . . . . . . . . . . 337.8 Distribution of GHG credit prices for scenario #7. . . . . . . . . . . . . . . . . . . . . . . . 34

v
List of Tables
1.1 Policy scenario matrix. . . . . . . . . . . . . . . . . . . . . . . . . . . . . . . . . . . . . . 21.2 Environmental summary statistics. . . . . . . . . . . . . . . . . . . . . . . . . . . . . . . . 4
3.1 Fuels included in the food-based biofuel constraint. . . . . . . . . . . . . . . . . . . . . . . 123.2 Fuels included in the Annex IX, Part B fuels constraint. . . . . . . . . . . . . . . . . . . . . 133.3 Fuels included in the intermediate crop-based biofuel constraint. . . . . . . . . . . . . . . . 133.4 Fuels included in the palm oil-based biofuel constraint. . . . . . . . . . . . . . . . . . . . . 143.5 Fuels included in the alternative fuel mandate. . . . . . . . . . . . . . . . . . . . . . . . . . 153.6 Fuels included in the advanced biofuel mandate. . . . . . . . . . . . . . . . . . . . . . . . . 163.7 Fuels included in the advanced biofuel mandate. . . . . . . . . . . . . . . . . . . . . . . . . 163.8 Fuels included in the aviation e-fuel mandate. . . . . . . . . . . . . . . . . . . . . . . . . . 173.9 Fuels included in the renewable fuels of non-biological origin (RFNBO) mandate. . . . . . . 173.10 Solve success rate by scenario. . . . . . . . . . . . . . . . . . . . . . . . . . . . . . . . . . 20
5.1 Aggregation schema used to generate Figure 1.1. . . . . . . . . . . . . . . . . . . . . . . . 24
8.1 Consumer cost impact analysis (presented as a difference from baseline costs). Parentheticalvalues show the % difference from the 2030 baseline . . . . . . . . . . . . . . . . . . . . . 35
9.1 Effective cost of reducing carbon emissions across all scenarios. . . . . . . . . . . . . . . . 39
A.1 All modeled fuels. . . . . . . . . . . . . . . . . . . . . . . . . . . . . . . . . . . . . . . . . 40
B.1 Credit multiplier (mbs) 1.2x SAF and Maritime only. . . . . . . . . . . . . . . . . . . . . . 41B.2 Credit multiplier (mbs) REDII multipliers . . . . . . . . . . . . . . . . . . . . . . . . . . . 42
C.1 Supply elasticities, ηbs . . . . . . . . . . . . . . . . . . . . . . . . . . . . . . . . . . . . . 43C.2 Demand elasticity, ε . . . . . . . . . . . . . . . . . . . . . . . . . . . . . . . . . . . . . . . 44C.3 Elasticity of substitution, σ . . . . . . . . . . . . . . . . . . . . . . . . . . . . . . . . . . . 44
D.1 Baseline data. . . . . . . . . . . . . . . . . . . . . . . . . . . . . . . . . . . . . . . . . . . 46D.2 Fuel annual growth rates used to project the baseline data into future years. . . . . . . . . . 46
E.1 Detailed fuel quantity results (all units are in billion MJ). . . . . . . . . . . . . . . . . . . . 55

vi
Acknowledgements
The author would like to recognize Steven Dirkse, Michael Ferris, and Thomas Rutherford for insightfulconversations, code discussions, and general encouragement. The author would also like to recognize theInternational Council on Clean Transportation who funded this work; in particular, the author would liketo recognize Stephanie Searle, Nikita Pavlenko, and Chelsea Baldino, for their data assistance and overallresearch expertise.

1
Chapter 1
Executive Summary
Decarbonizing the transport sector is a critical element of the European Union’s (EU) net-zero climateambitions. In July, 2021, the European Commission released a suite of proposals aimed to achieve 55%greenhouse gas (GHG) reductions by 2030 compared to 1990 levels. One key piece is a revision to theRenewable Energy Directive (REDII revision), which ramps up the ambition level for increasing the use ofrenewables across the European economy. The REDII revision proposal introduces a 13% GHG reductiontarget for fuels used across the entire transport sector in 2030. This is a significant change from the pre-vious 14% energy mandate in the REDII and not only increases the ambition level of the policy but alsofundamentally changes how it will work. The Commission’s proposal includes other elements to promoteadvanced, sustainable fuel pathways within the GHG target: a 2.2% energy mandate for advanced biofuelsand a 2.6% energy mandate for renewable fuels of non-biological origin (RFNBOs, including renewablehydrogen and e-fuels) in 2030. At the same time, the Commission has proposed a 5% sustainable aviationfuel mandate and a 0.7% sub-mandate for RFNBOs in aviation in 2030 as part of its proposed ReFuel EUregulation.
This study aims to model the behavior of how obligated parties might comply with targets in the Com-mission’s proposal, as well as in 9 other scenarios representing similar policy options. We create a partialequilibrium model using the GAMS modeling language to represent decisions made by fuel blenders, sup-pliers, and consumers in order to comply with the GHG target and other mandates and caps in the policy. Itsimulates a market in which obligated parties may trade GHG reduction credits generated from the use of re-newable fuel and use those GHG reduction credits to achieve compliance with the policy targets. Our modelcovers the aviation and road sectors, including both light-duty and heavy-duty vehicles. While the REDIIrevision covers maritime fuels, and the Commission has also proposed separate measures for maritime fuels,the maritime sector is outside the scope of our model.
Table 1.1 presents the scenarios included in our study. Scenario 1 represents the Commission’s REDIIrevision proposal. Scenarios 2-6 vary the GHG target, mandate, and food-based biofuel cap levels. Scenario7 represents a scenario with pessimistic penetration of electric vehicles (EVs), and thus, direct renewableelectricity use in transport. Scenarios 8-10 model renewable energy mandates, replacing the GHG target, forsimilar ambition levels as scenarios 1-7. Another factor we investigate is intermediate crops (crops grownduring the winter or off-season). Intermediate crops are currently exempt from the food-based biofuel cap,even if they are produced from food and feed crops, and in scenarios 4, 5, and 10 we investigate removingthat exemption.

Chapter 1. Executive Summary 2
#D
escr
iptio
nG
HG
Red
uctio
nTa
rget
Ren
ewab
leE
nerg
yM
anda
te
Food
-and
-Fee
dB
ased
Bio
fuel
Cap
Adv
ance
dB
iofu
elE
nerg
yM
anda
te
RFN
BO
Ene
rgy
Man
date
SAF
Man
date
Avia
tion
e-Fu
elM
anda
teM
ultip
liers
EV
Ann
ual
Gro
wth
Inte
rmed
iate
Cro
psE
xem
ptfr
omFo
odC
ap
#1R
ED
IIre
visi
onpr
opos
al13
%0%
7%2.
2%2.
6%5%
0.7%
1.2x
SAF
and
Mar
itim
eon
lyC
entr
alY
es
#2L
ower
GH
Gta
rget
11%
0%7%
2.2%
2.6%
5%0.
7%1.
2xSA
Fan
dM
ariti
me
only
Cen
tral
Yes
#3N
ofo
od-b
ased
biof
uels
9%0%
0%2.
2%2.
6%5%
0.7%
1.2x
SAF
and
Mar
itim
eon
lyC
entr
alY
es
#4N
ofo
od-b
ased
orin
term
edia
tecr
ops
8%0%
0%2.
2%2.
6%5%
0.7%
1.2x
SAF
and
Mar
itim
eon
lyC
entr
alN
o
#5N
oin
term
edia
tecr
ops
13%
0%7%
2.2%
2.6%
5%0.
7%1.
2xSA
Fan
dM
ariti
me
only
Cen
tral
No
#6H
ighe
rsub
targ
ets
13%
0%7%
2.75
%2.
6%5%
2.5%
1.2x
SAF
and
Mar
itim
eon
lyC
entr
alY
es
#7L
owE
Vgr
owth
13%
0%7%
2.2%
2.6%
5%0.
7%1.
2xSA
Fan
dM
ariti
me
only
Low
Yes
#8R
enew
able
ener
gyta
rget
0%26
%7%
4.4%
2.6%
5%0.
7%R
ED
IIm
ultip
liers
Cen
tral
Yes
#9H
igh
rene
wab
leen
ergy
targ
et0%
29.5
%7%
4.4%
2.6%
5%0.
7%R
ED
IIm
ultip
liers
Cen
tral
Yes
#10
Ene
rgy
targ
et,n
ofo
od-b
ased
orin
term
edia
te0%
19%
0%4.
4%2.
6%5%
0.7%
RE
DII
mul
tiplie
rsC
entr
alN
o
TAB
LE
1.1:
Polic
ysc
enar
iom
atri
x.

Chapter 1. Executive Summary 3
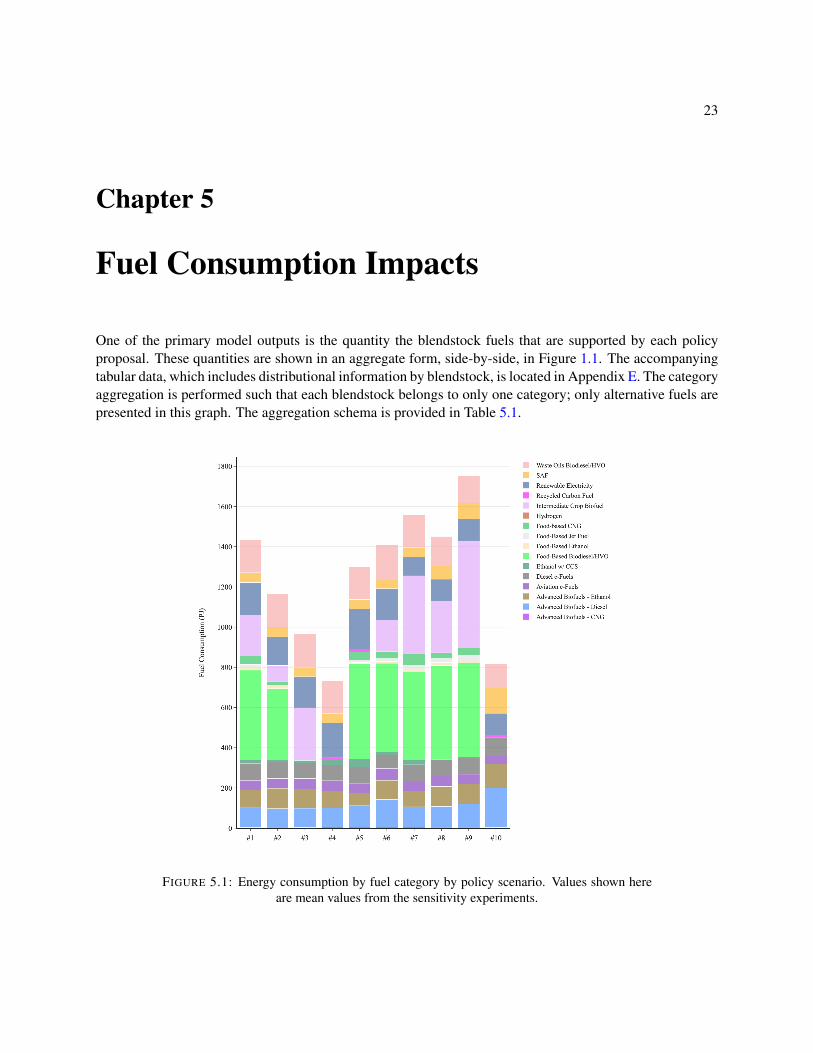
Figure 1.1 summarizes the types of fuels used to meet the policy requirements for each scenario. Someof the differences between the scenarios are as expected, for example a lower total amount of renewableenergy when the GHG target is reduced (Scenario 2) and no food-based biofuels when the food-based capis set to 0% (Scenarios 3, 4, and 10). One striking result is the large amount of intermediate crop biofuelin most scenarios in which it is exempt from the food-based biofuel cap. When the policy becomes moreambitious, for example increasing the energy mandate level from Scenario 8 to 9, we see that intermediatecrop biofuel fills in most of the total increased renewable fuel demand. In particular, we find a large increasein soy hydrotreated vegetable oil (HVO). Simply reducing the target level, for example from Scenario 1 to2, sharply reduces the amount of intermediate crop biofuel used. The REDII/III requires intermediate cropbiofuel not to “trigger demand for additional land” in order to be considered exempt from the food-basedbiofuel cap, but the European Commission has not released guidance on how voluntary schemes shouldinterpret that condition. In the absence of meaningful restrictions, we find that intermediate crops are thecheapest compliance option to meet a GHG target or a renewable energy mandate, once the sub-mandatesand caps have been complied with.
FIGURE 1.1: Energy consumption by fuel category by policy scenario. Values shown hereare mean values from the sensitivity experiments.

Chapter 1. Executive Summary 4
The majority of intermediate crops globally are major commodity crops and their use in biofuel can beexpected to cause indirect land use change (ILUC), just as with food-based biofuels. When we considerILUC emissions, the very high total GHG emissions from intermediate crop soy biofuel significantly detractfrom the GHG savings of the policy as a whole. We can see this in Table 1.2, which shows the total GHGsavings for each scenario, as well as the average cost of carbon abatement, the GHG credit price, and thetotal share of renewable energy in the road and aviation sectors. We calculate total GHG savings and thecarbon abatement cost including ILUC emissions but assume the policy and the GHG credit prices areimplemented without them. Accounting for ILUC, we find the highest GHG savings in scenarios 4, 5, and10, where intermediate crops are not exempt from the food-based biofuel cap. Excluding all food-basedbiofuels also significantly increases GHG savings (Scenario 3 compared to Scenario 1, and Scenario 10compared to Scenario 8).
Scn GHG Credit Price(e/tCO2e)
RenewableShare (%)
GHG Reduction(million tCO2e)
Cost ofCarbon Abatement
(e/tCO2e)#1 - REDII revision proposal 364 15.6% 29.2 1281#2 - Lower GHG target 255 12.6% 37.4 855#3 - No food-based biofuels 323 10.5% 38.2 823#4 - No food-based or intermediate crops 480 8% 66.4 460#5 - No intermediate crops 588 14.2% 58 682#6 - Higher subtargets 338 15.3% 35.4 1033#7 - Low EV growth 433 17% -2.3 NA#8 - Renewable energy target - 15.6% 9.5 3871#9 - High renewable energy target - 18.9% -13.1 NA#10 - Energy target, no food-based orintermediate - 8.8% 60.3 590
TABLE 1.2: Environmental summary statistics.
One important finding of this study is that a GHG target results in much greater GHG savings thana renewable energy mandate. Scenario 8, representing a 26% renewable energy mandate (including allthe current REDII multipliers) leads to a similar total amount of renewable fuel as Scenario 1 (the REDIIrevision proposal), but delivers only around one-third the overall GHG savings. Consequently, the carbonabatement cost of Scenario 8 is around three times as high as that of Scenario 1. This study shows that aGHG target is also a much more cost effective means to achieve climate mitigation than a renewable energymandate.
The analysis presented here demonstrates that setting targets too high leads to unintended consequences.In all cases shown here, higher targets lead to greater amounts of intermediate crop biofuel, leading to netincreases in GHG emissions. This is because much of the increase in intermediate crop biofuel is soy HVO,which is not subject to blending constraints and has higher lifecycle GHG emissions than fossil fuels. Anambitious renewable energy mandate, shown in Scenario 9, has the perverse impact of increasing GHGemissions compared to having no renewable energy policy; the increase in renewable energy is met almostentirely with an increased amount of intermediate crop biofuel. The same effect is seen in Scenario 7, whereEV penetration falls short of expectations, resulting in a more ambitious target for all other types of eligiblefuels, including intermediate crop biofuel. Simply reducing the GHG target level from 13%, as in the REDIIrevision proposal, to 11% has the unexpected effect of increasing total GHG savings from the policy becausethe lower target creates less of an incentive for intermediate crop biofuel.

Chapter 1. Executive Summary 5
Renewable fuel policy is complex, and the impacts of policy changes are not always intuitive. Quantita-tive modeling, such as the study presented here, can be a useful tool in objectively analyzing a broad set ofeffects from policy changes.

6
Chapter 2
Introduction and Policy Context
The EU has ambitious climate goals, including goals for a 55% reduction in greenhouse gas (GHG) emis-sions by 2030 compared to 1990 levels and a net-zero GHG economy in 2050, as introduced in the GreenDeal [1]. In July 2021, the European Commission released a number of policy proposals aimed at achievingthe 55% GHG reduction goal by 2030, known as the Fit for 55 package [2]. The purpose of this study is toanalyze how major elements of the Fit for 55 package will impact renewable transport fuels.
There are three policy proposals concerning renewable transport fuels in the Fit for 55 package: therevised Renewable Energy Directive (REDII revision), ReFuel EU, and FuelEU Maritime [3, 4, 5]. All ofthese pieces are European Commission proposals; they may be amended by the European Parliament andthe Council before they are finalized.
The REDII revision proposal introduces 2030 renewable energy targets for the EU economy as a wholeand for several sectors individually, including transport. For transport, it replaces the previous 14% renew-able energy target in the REDII with a 13% GHG target for 2030 [6]. This target is significantly moreambitious than the 14% renewable energy target for three reasons: 1) most renewable fuels deliver less than100% GHG savings, so more than 1% renewable energy is needed to deliver 1% GHG savings, 2) the REDIIincluded several multipliers for various types of fuel, most of which are deleted in the REDII revision, and 3)the REDII revision expands the energy pool for which the 13% GHG target applies to aviation and maritimefuels, whereas the REDII targets only applied to road and rail transport fuels. The REDII revision changesthe advanced biofuel energy target to 2.2% in 2030, with no multipliers. Only biofuels produced from feed-stocks listed in Annex IX, list A of the REDII are eligible for the advanced biofuel target. It introduces anew target for Renewable Fuels of Non-Biological Origin (RFNBOs) of 2.6% in 2030. The REDII revisionmaintains the 7% cap on food- and feed-based biofuels from the REDII, and intermediate crops are exemptfrom the cap.
The ReFuel EU proposal is for a regulation. It introduces a 5% target for Sustainable Aviation Fuels(SAF) in 2030, with a smaller target in 2025 and other interim targets increasing to 63% in 2050. Thisapplies to the share of fuel supplied to EU airports. SAF includes biofuels produced from feedstocks listedin Annex IX (both parts A and B) as well as RFNBOs. ReFuel EU also includes a 0.7% sub-target forRFNBOs used in aviation in 2030, increasing to 28% in 2050.
FuelEU Maritime is also a proposal for a regulation, introducing a 6% GHG target for energy usedonboard vessels. It applies to energy used on ships within the EU as well as half that used in internationaltravel to and from the EU. There are no eligibility constraints for fuel pathways for this target, but the GHGintensity of food- and feed-based biofuels is set to the same as the highest-GHG fossil fuel that can be usedin shipping, and so effectively cannot contribute to the target.
Chapter 2. Introduction and Policy Context 7
In this study, we analyze the impact the REDII revision and ReFuel EU will have on renewable fuel usein the EU in 2030. Our model is limited to the road and aviation sectors and so does not include maritimeor rail; we thus do not analyze the 6% GHG target for the maritime sector proposed in FuelEU Maritime.We develop a partial equilibrium model to assess the behavior of blenders and consumers in response tothe targets described above in the REDII revision and ReFuel EU. We also assess a number of scenariosrepresenting potential policy changes to the Fit for 55 proposals. We present the quantities of various typesof renewable fuel projected to be used for compliance with the targets in each scenario, the GHG targetcredit price, and the overall costs and GHG impacts of the policies. We also present a sensitivity analysis oncredit price and fuel price impacts. This study is aimed to help inform the ongoing policy debate over theFit for 55 package.
8
Chapter 3
Model Description
A model of the European Union’s transportation fuel market was developed in the GAMS modeling lan-guage. The model is a partial equilibrium model and as such it was calibrated to a baseline set of data. Wedeveloped our baseline data in close collaboration with the International Council on Clean Transportation(ICCT), and of note, the baseline penetration of electric vehicles has been harmonized to align with theEuropean Commission’s Climate Impact Plan (See Appendix D for baseline data and emission factors) [7].Calibration was verified and counterfactual policy scenarios were developed to gauge the market response.The transportation market has several different agents that have specific roles to play. These agents makerational economic decisions based on information that they can access. The model contains representativeconsumers, a blender agent, and supply agents for different blendstock fuels. Details of each of these agentproblems are provided in the following sections.
Formulation of equilibrium problems is conceptually simple but can be tedious in practice. GAMS usedExtended Mathematical Programming (EMP) in order to reformulate the collection of agent optimizationproblems (or their first order or KKT conditions) into a single complementarity model. Using EMP toreformulate the suite of agent models eliminates the errors in a critical and problematic step. The model isultimately solved with the PATH algorithm.
It is important to be clear what this model is and what it is not. This model is able to gauge how themarket might shift away from a market equilibrium if new policy were implemented. Starting at a point withan assumed equilibrium means that the law of one price (on an energy basis) applies to all blended feedstocks(i.e., no arbitrage opportunities). This implies that there might exist some exogenous implied subsidy forfuels that might have high production cost, and yet, appear in the market with a non-zero quantity. Theseimplied subsidies can manifest themselves from overlapping policies or simply from some other internalbusiness strategy. Either way, these implied subsidies have the effect of shifting the entire supply curvedownward.
Models of this type are able to resolve incentives, cost impacts, etc., but partial equilibrium modelsare not explicitly a business forecasting tool because it is unclear if the implied subsidy that exists at thecalibration point would be available for all future business entities (we do not place upper bounds on anyblendstock quantities). Said another way, this is a model that can resolve incentives and preferences of thepolicy but does not explicitly resolve firm-level decisions. Any entity evaluating a new policy would needto ensure that their internal cash flow models result in a profit considering some market support. In sum,models of this type are able to help answer the question How much support might a fuel pathway expectfrom the new policy? but not What is the future production capacity of a fuel pathway?. The subsectionsthat follow describe each agents’ optimization problem.

Chapter 3. Model Description 9
3.1 Consumer agents
There are three classes of consumer in this model; 1) a light-duty vehicle (LDV) consumer, 2) a heavy-dutyvehicle (HDV) consumer, and 3) an aviation consumer. All consumer agents are modeled as cost minimizersthat purchase vehicle kilometers (VKTs) that are produced by several different vehicles. The LDV consumercan purchase gasoline LDVs, diesel LDVs, or electric vehicles. The HDV consumer can purchase dieselHDVs, compressed natural gas (CNG) HDVs, or hydrogen fueled HDVs. There are no vehicle choices forthe aviation consumer, instead one representative aircraft engine is used to generate vehicle-kilometers.
The production of VKT by these vehicle classes is modeled by a constant elasticity of substitution (CES)style production function. The CES style production function allows for vehicle preferences to changebetween categories and is used to capture the aggregate preferences for all consumers, economy-wide; weutilize the calibrated share form of the CES function as described by Rutherford [8]. The consumer agentproblem can be described mathematically as the following optimization problem (Equation 3.1).
minV KTv
∑v,f
(Pf − PGHGf
)γv
+ Zopexv + Zcapitalv
V KTvs.t.
∑v
[θv
(V KTv
V KT v
)ρ] 1ρ
=D
d
(3.1)
Where
• v ∈ V represents different vehicle technologies
• f ∈ F represents blended fuels that are used in each vehicle
• Pf represents final price for the underlying blended fuel, the consumer is assumed to be a price takerfrom the blender agent (e/MJ)
• PGHGf represents final value (cost or benefit) of the GHG credits associated with a finished (blended)fuel, the consumer is assumed to be a price taker from the blender agent (e/MJ)
• V KTv are decision variables that represent the number of kilometers driven per year (billion km/year)
• γv is the fuel economy of the vehicle (km/MJ)
• ρ is the substitution parameter (which is related to the elasticity of substitution, ρ = (σ − 1)/σ)
• θv is the market value share for vehicle v
• Zopexv is data that represent non-fuel vehicle operating costs (e/km)
• Zcapitalv is data that represent vehicle capital costs (e/km)
• D is the aggregate vehicle market value for an agent (billion e)

Chapter 3. Model Description 10
The final demand is described by an isoelastic function shown in Equation 3.2 and is a function of theaggregate price index (PD) which is exactly the dual variable of the CES production constraint in Equation3.1. The aggregate price index is equal to 1 at the benchmark when using the calibrated share form of theCES production function.
D = d̄
[PD
1
]−ε(3.2)
Where
• d̄ is the baseline aggregate vehicle market value (billion e)
• PD is the aggregate price index
• ε is the demand elasticity
3.2 Blender agent
The business structure of the blender agent(s) should mimic that seen in the real market. However, thedetails of these business structures are difficult to know and varied. The framework used in this studyincludes one blender agent that is responsible for all fuel blending. All the agents in this model have price-taking behavior, and as such, the single blender formulation is equivalent to a more nuanced multi-blendermodel. The single blender is therefore responsible for providing fuel to the consumer agents that meet allthe necessary policy requirements. The blender agent will blend fuel to minimize costs. The blender agentis assumed to purchase quantities of energy from blendstock suppliers. The blender agent problem can bedescribed mathematically as the following base optimization problem (Equation 3.3); policy constraints willbe discussed individually.

Chapter 3. Model Description 11
The single blender model implies that the price of the GHG credit is equivalent to the marginal price onthe credit market clearing condition in Equation 3.14 (i.e., zero net credits).
minQblendbs,f
∑bs∈BSF (bs,f)
[Qblendbs,f Pbs
]
s.t. Pf =∑bs,f
Qblendbs,f
QfPbs
Qf =∑v,a
V KTv,aγv
Qf =∑bs
Qblendbs,f
Ef =
∑bs,f Q
blendbs,f∑
bs′,f
Qblendbs′,fρvbs′∑
bs,bst,f
Qblendbs,f
ρvbsQfEf
≤ BLENDUPbst,f
∑bs,bst,f
Qblendbs,f
ρvbsQfEf
≥ BLENDLObst,f
∑bs,bst,f
Qblendbs,f
ρvbsQfEf
= BLENDFXbst,f
(3.3)
Where
• bs ∈ BS represents different fuel blendstocks
• f ∈ F represents blended fuels that are used in each vehicle
• BSF (bs, f) represents the two dimensional set that maps fuel blendstock to a finished blended fuel
• bst ∈ BST represents common categories of blendstock types (i.e., all ethanols, all FAME, etc.)
• ρvbs is the energy density of a blendstock (MJ/physical unit)
• Pf is the final price for the blended fuel (e/MJ)
• Qblendbs,f are (primary) decision variables that represent the portion of energy from a blendstock used ina finished fuel (billion MJ)
• Qf are decision variables that represent the total energy of a blended fuel (billionMJ)
• Ef are decision variables that represent the energy density of a blended fuel (MJ/physical unit)

Chapter 3. Model Description 12
• BLENDUP,LO,FXbst,f are technology based limits on blending fuels (i.e., E10 blends, B7 blends, etc.)
3.2.1 Policy constraints
The optimization problems described in Equation 3.3 include all the technology-based logic to describehow blending fuels should be performed. Blenders will also be subject to a number of shared policy relatedconstraints that will impact blending behaviors. We describe each of these formulations separately. If thepolicy is active in the policy scenario it is simply added to the list of technology-based constraints listed inEquation 3.3.
Food-based biofuels eligibility
The fraction of road-based transport energy that can come from food-based biofuels is controlled by Equa-tion 3.4. The parameter λfood will change depending on different policy scenarios.∑
bs,f∈BSF (bs,f)bs∈FOOD
Qblendbs,f ≤ λfood∑f
Qf(3.4)
All fuels that are part of the set FOOD in the summation on the left-hand side of Equation 3.4 arepresented in Table 3.1. Fuels that are derived from cover crops are exempt from the food-based fuel limit.Note: All instances of the abbreviation “CCS” in Table 3.1 (and elsewhere in this report) refer to CarbonCapture and Sequestration technolgies.
Impacted FuelsCNG (silage maize)FAME (palm), FAME (rapeseed), FAME (soy)HVO (palm), HVO (rapeseed), HVO (soy)Ethanol (corn), Ethanol (corn w/CCS), Ethanol (sugar)Ethanol (sugarbeet), Ethanol (sugarbeet w/CCS)Ethanol (wheat), Ethanol (wheat w/CCS)SAF Alcohol-to-Jet (corn)SAF HEFA (palm), SAF HEFA (rapeseed), SAF HEFA (soy)SAF Alcohol-to-Jet
TABLE 3.1: Fuels included in the food-based biofuel constraint.
Annex IX, Part B fuels eligibility
The fraction of road-based transport energy that can come from Annex IX, Part B fuels is controlled byEquation 3.5. The parameter λwaste will change depending on different policy scenarios.∑
bs,f∈BSF (bs,f)bs∈WASTE
Qblendbs,f ≤ λwaste∑f
Qf(3.5)
Chapter 3. Model Description 13
All fuels that are part of the set WASTE in the summation on the left-hand side of Equation 3.5 arepresented in Table 3.2.
Impacted FuelsFAME (tallow), FAME (used cooking oil)HVO (tallow), HVO (used cooking oil)SAF (tallow), SAF (used cooking oil)
TABLE 3.2: Fuels included in the Annex IX, Part B fuels constraint.
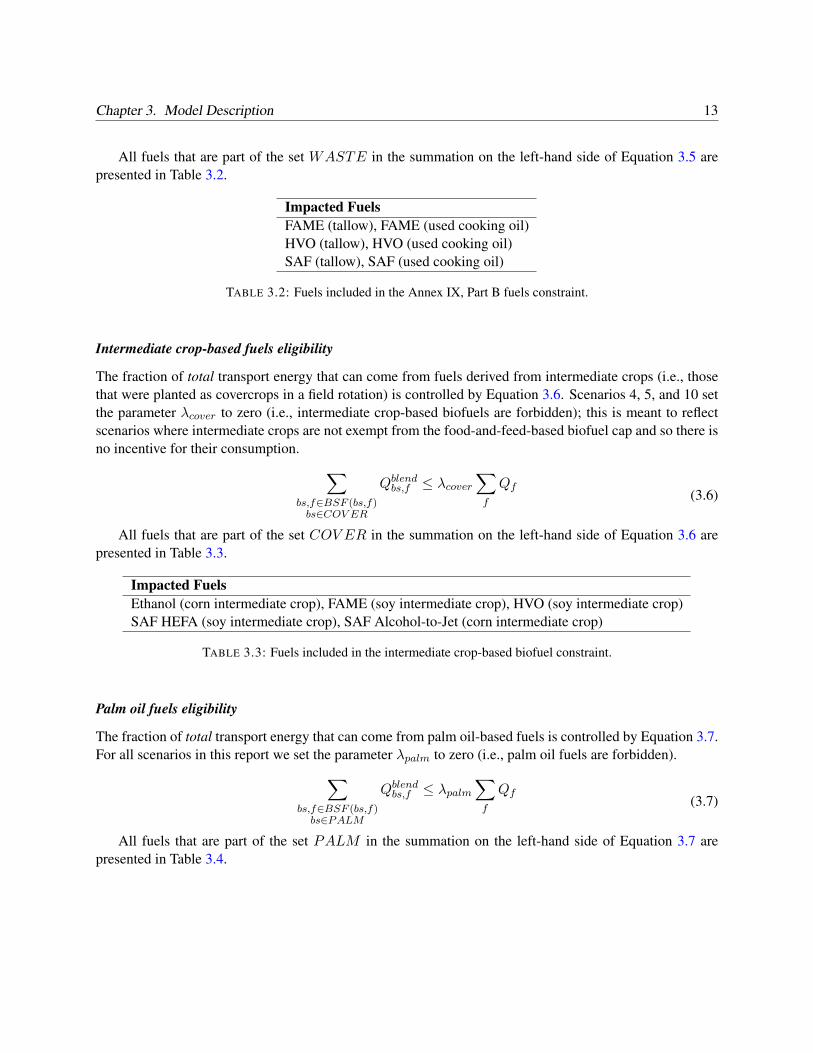
Intermediate crop-based fuels eligibility
The fraction of total transport energy that can come from fuels derived from intermediate crops (i.e., thosethat were planted as covercrops in a field rotation) is controlled by Equation 3.6. Scenarios 4, 5, and 10 setthe parameter λcover to zero (i.e., intermediate crop-based biofuels are forbidden); this is meant to reflectscenarios where intermediate crops are not exempt from the food-and-feed-based biofuel cap and so there isno incentive for their consumption. ∑
bs,f∈BSF (bs,f)bs∈COV ER
Qblendbs,f ≤ λcover∑f
Qf(3.6)
All fuels that are part of the set COV ER in the summation on the left-hand side of Equation 3.6 arepresented in Table 3.3.
Impacted FuelsEthanol (corn intermediate crop), FAME (soy intermediate crop), HVO (soy intermediate crop)SAF HEFA (soy intermediate crop), SAF Alcohol-to-Jet (corn intermediate crop)
TABLE 3.3: Fuels included in the intermediate crop-based biofuel constraint.
Palm oil fuels eligibility
The fraction of total transport energy that can come from palm oil-based fuels is controlled by Equation 3.7.For all scenarios in this report we set the parameter λpalm to zero (i.e., palm oil fuels are forbidden).∑
bs,f∈BSF (bs,f)bs∈PALM
Qblendbs,f ≤ λpalm∑f
Qf(3.7)
All fuels that are part of the set PALM in the summation on the left-hand side of Equation 3.7 arepresented in Table 3.4.

Chapter 3. Model Description 14
Impacted FuelsFAME (palm), HVO (palm), SAF HEFA (palm)
TABLE 3.4: Fuels included in the palm oil-based biofuel constraint.
Renewable fuels mandate
The fraction of road-based transport energy that must come from all alternative fuels is controlled by Equa-tion 3.8. The parameter λalt will change depending on different policy scenarios. This mandate also consid-ers a multiplier policy parameter, specified as mbs. This multiplier is designed to give preference to certainblendstock fuels. ∑
bs,f∈BSF (bs,f)bs∈ALTFUEL
mbsQblendbs,f ≥ λalt
∑f∈ROAD
Qf(3.8)
All fuels that are part of the set ALTFUEL in the summation on the left-hand side of Equation 3.8 arepresented in Table 3.5.
Chapter 3. Model Description 15
Impacted FuelsCNG (biowaste), CNG (manure), CNG (silage maize)FAME (rapeseed), FAME (soy), FAME (soy intermediate crop)FAME (tallow), FAME (used cooking oil)HVO (crude tall oil), HVO (rapeseed)HVO (soy), HVO (soy intermediate crop)HVO (tallow), HVO (used cooking oil)Cellulosic Diesel (agricultural residues), Cellulosic Diesel (energy crops)Cellulosic Diesel (municipal solid waste)Diesel e-FuelsRenewable ElectricityEthanol (corn), Ethanol (corn intermediate crop), Ethanol (corn w/CCS)Ethanol (sugar), Ethanol (sugarbeet), Ethanol (sugarbeet w/CCS)Ethanol (wheat), Ethanol (wheat w/CCS), Ethanol (flue gas)Cellulosic Ethanol (agricultural residues), Cellulosic Ethanol (agricultural residues w/CCS)Cellulosic Ethanol (energy crops), Cellulosic Ethanol (energy crops w/CCS)Green HydrogenSAF Alcohol-to-Jet (agricultural residues), SAF Fischer-Tropsch (agricultural residues)SAF Alcohol-to-Jet (corn), SAF Alcohol-to-Jet (corn intermediate crop)SAF Alcohol-to-Jet (energy crops), SAF Fischer-Tropsch (energy crops)SAF Alcohol-to-Jet (flue gas), SAF Fischer-Tropsch (municipal solid waste)SAF e-FuelsSAF HEFA (rapeseed), SAF HEFA (soy), SAF HEFA (soy intermediate crop)SAF Alcohol-to-Jet, SAF (tallow), SAF (used cooking oil)
TABLE 3.5: Fuels included in the alternative fuel mandate.
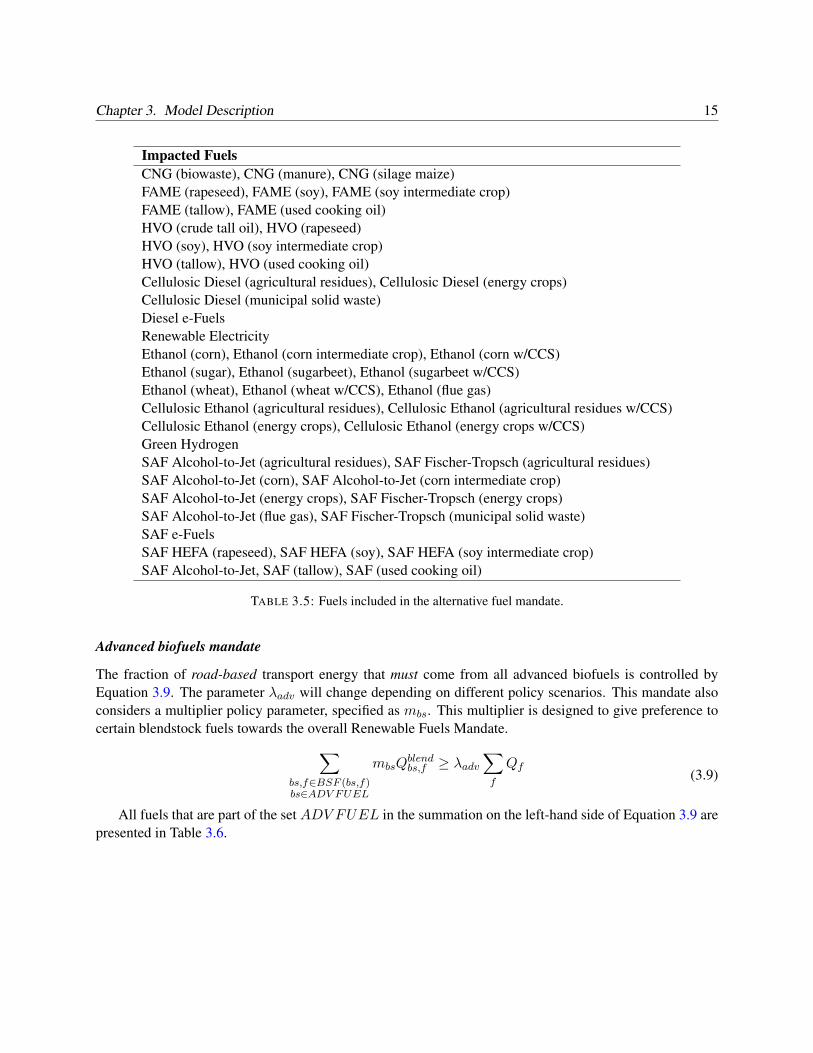
Advanced biofuels mandate
The fraction of road-based transport energy that must come from all advanced biofuels is controlled byEquation 3.9. The parameter λadv will change depending on different policy scenarios. This mandate alsoconsiders a multiplier policy parameter, specified as mbs. This multiplier is designed to give preference tocertain blendstock fuels towards the overall Renewable Fuels Mandate.∑
bs,f∈BSF (bs,f)bs∈ADV FUEL
mbsQblendbs,f ≥ λadv
∑f
Qf(3.9)
All fuels that are part of the set ADV FUEL in the summation on the left-hand side of Equation 3.9 arepresented in Table 3.6.

Chapter 3. Model Description 16
Impacted FuelsCNG (biowaste), CNG (manure)HVO (crude tall oil)Cellulosic Diesel (agricultural residues)Cellulosic Diesel (energy crops)Cellulosic Diesel (municipal solid waste)Cellulosic Ethanol (agricultural residues), Cellulosic Ethanol (agricultural residues w/CCS)Cellulosic Ethanol (energy crops), Cellulosic Ethanol (energy crops w/CCS)SAF Alcohol-to-Jet (agricultural residues), SAF Fischer-Tropsch (agricultural residues)SAF Alcohol-to-Jet (energy crops), SAF Fischer-Tropsch (energy crops)SAF Fischer-Tropsch (municipal solid waste)
TABLE 3.6: Fuels included in the advanced biofuel mandate.
Alternative aviation fuels mandate
The fraction of aviation transport energy that must come from alternative aviation fuels (or sustainableaviation fuels or "SAF") is controlled by Equation 3.10. The parameter λjet will change depending ondifferent policy scenarios. This mandate also considers a multiplier policy parameter, specified as mbs. Thismultiplier is designed to give preference to certain blendstock fuels towards the overall Renewable FuelsMandate. ∑
bs,f∈BSF (bs,f)bs∈ALTJET
mbsQblendbs,f ≥ λjet
∑f∈AV IATION
Qf(3.10)
All fuels that are part of the set ALTJET in the summation on the left-hand side of Equation 3.10are presented in Table 3.7. Only biofuels in Annex IX parts A and B and RFNBOs will qualify under themandate.
Impacted FuelsSAF Alcohol-to-Jet (agricultural residues), SAF Fischer-Tropsch (agricultural residues)SAF Alcohol-to-Jet (energy crops), SAF Fischer-Tropsch (energy crops)SAF Alcohol-to-Jet (flue gas), SAF Fischer-Tropsch (municipal solid waste)SAF e-Fuels, SAF (tallow), SAF (used cooking oil)
TABLE 3.7: Fuels included in the advanced biofuel mandate.
Aviation e-Fuels mandate
The fraction of aviation transport energy that must come from aviation e-Fuels is controlled by Equation3.11. The parameter λefuel will change depending on different policy scenarios. This mandate also considers

Chapter 3. Model Description 17
a multiplier policy parameter, specified as mbs. This multiplier is designed to give preference to certainblendstock fuels towards the overall Renewable Fuels Mandate.∑
bs,f∈BSF (bs,f)bs∈JETEFUEL
mbsQblendbs,f ≥ λefuel
∑f∈AV IATION
Qf(3.11)
All fuels that are part of the set JETEFUEL in the summation on the left-hand side of Equation 3.10are presented in Table 3.8.
Impacted FuelsSAF e-Fuels
TABLE 3.8: Fuels included in the aviation e-fuel mandate.
Renewable fuel of non-biological origin mandate
The fraction of road-based transport energy that must come from renewable fuels of non-biological originis controlled by Equation 3.12. The parameter λrfnbo will change depending on different policy scenarios.This mandate also considers a multiplier policy parameter, specificed as mbs. This multiplier is designed togive preference to certain blendstock fuels towards the Renewable Fuels Mandate.∑
bs,f∈BSF (bs,f)bs∈RFNBO
mbsQblendbs,f ≥ λrfnbo
∑f
Qf(3.12)
All fuels that are part of the set RFNBO in the summation on the left-hand side of Equation 3.10 arepresented in Table 3.9.
Impacted FuelsDiesel e-FuelsGreen HydrogenSAF e-Fuels
TABLE 3.9: Fuels included in the renewable fuels of non-biological origin (RFNBO) man-date.
Carbon intensity standard (GHG target)
A fuel carbon intensity (CI) standard can be included in this model as a policy mechanism for incentivizingalternative fuels/vehicles. A fuel will generate credits for fuels that are cleaner than this standard and willgenerate deficits if the fuel has a higher carbon intensity than the standard. Equation Block 3.13 dictates how

Chapter 3. Model Description 18
these credits (positive values of QGHG) and deficits (negative values of QGHG) are generated; also includedis an equation that describes the embedded value of the GHG credits for each finished (i.e., blended) fuel.
PGHGf =∑
bs,f∈BSF (bs,f)
Qblendbs,f
QfλGHG
[CIstd − CIbs
]QGHGbs,f =
∑std,bs∈STD(std,bs)
[CIstd − CIbs
]Qblendbs,f
(3.13)
Where
• std ∈ STD represents the different carbon intensity standards
• STD(std, bs) represents a two dimensional set that maps the applicible carbon intensity standard tothe blendstock fuel
• λGHG represents GHG credit price final value (cost or benefit) of the GHG credits associated with afinished (blended) fuel (e/tCO2e)
• PGHGf represents final value (cost or benefit) of the GHG credits associated with a finished (blended)fuel (e/MJ)
The price of the GHG credit (λGHG) is the price at which the supply of credit exactly clears the de-mand for credits (i.e., the dual variable of the market clearing condition). This market clearing condition isdescribed in Equation 3.14. ∑
bs,f∈BSF (bs,f)
QGHGbs,f = 0 (3.14)
3.3 Supply agents
The agents that are responsible for supplying blendstocks to the blender are not modeled as individualoptimizers. Instead, the supply of blendstocks is assumed to fit an isoelastic supply curve. This curve isrepresented by Equation 3.15.
Pbsp̄bs
=
[Qbsq̄bs
]1/ηbs
(3.15)
Where
• Pbs is the price at which a quantity of blendstock fuel can be supplied (e/MJ)
• Qbs is the quantity of blendstock that is demanded under a policy shock (billion MJ)
• p̄bs is the baseline price at which the baseline quantity of blendstock fuel is supplied (e/MJ)
• q̄bs is the baseline quantity of blendstock fuel (e/MJ)
• ηbs is the supply elasticity for a particular blendstock fuel

Chapter 3. Model Description 19
3.4 Additional modeling details
3.4.1 Carbon intensities
GHG intensities of all fuel pathways are provided in Table D.1 in Appendix D. Unless otherwise noted, theGHG intensities are taken as the typical values for each pathway from REDII, or the threshold GHG savingsrequired for eligible biofuels (i.e. 65% compared to the liquid fossil fuel comparator of 94 gCO2e/MJ),whichever is lower. We follow the REDII revision proposal in assigning a GHG intensity of 94 gCO2e/MJfor all liquid and gaseous fossil fuels in model execution, as well as the GHG intensity of 183 gCO2e/MJidentified for the fossil electricity comparator. For post-hoc analysis of the GHG impacts of the scenarios,we add ILUC emissions following Valin et al. [9], except where otherwise noted; these ILUC emissionestimates are not included in the GHG intensities for the purposes of model execution.
3.4.2 Supply elasticities
The price curves in this study were calculated according to Equation 3.15. To be clear, p̄bs represents thebaseline price at which a renewable fuel could be sold assuming no policy support; for all blendstocks thebaseline price takes on that of the EU wholesale price of diesel, gasoline, kerosene, or CNG (depending onwhich fossil fuel the renewable fuel pathway would be substituting); these prices are a direct consequenceof the no-arbitrage assumption. q̄bs represents the quantity of each fuel pathway that would be demandedat p̄bs and can be thought of as the quantity of each fuel pathway we would expect to be demanded in theabsence of any alternative fuel policy support; these values were estimated since this baseline represents acounterfactual from current market conditions (i.e., there are various ways that alternative fuels are currentlyincentivized in the EU).
We estimated the long-run elasticity (i.e., an elasticity that represents a supply system that does notencounter resource constraints), ηbs, using current consumed quantities (Qbs) and prices (Pbs) in the EU,where this data is available, as well as the values for p̄bs and the estimated values for q̄bs. It was assumedthat the available fuel price data better represents the current average market price rather than the marginalproduction price at the volumes currently supplied. An iterative solution method was used in order to solveEquation 3.16 for ηbs. ∫ Qbs
q̄bs
PbsdQbs = p̄bsq̄bs
[ηbs
ηbs + 1
] [Q
1ηbs
+1
bs − 1
](3.16)
3.5 Sensitivity tests
There are many hard-to-know modeling parameters that appear in economic models such as this one. Thusit is imperative that any analysis also include an appropriate number of sensitivity experiments. In this workwe generate samples for elasticities (supply, demand, and substitution) using a latin hypercube samplingtechnique to ensure that we sample across the entire space [10]. We generated 10,000 samples and solve themodel for each of these tests, recording each successful solve. Solve success rates (i.e., the faction of the10,000 samples where a new equilibrium point was successfully found by the PATH solver) are presented inTable 3.10. The solve success rate was used as a high level metric to inform how well the solution finding

Chapter 3. Model Description 20
processes worked for all scenarios. Numerical problems can arise when a policy scenario results in largedeviations from the initial equilibrium starting point and in many cases we needed to implement a solutionfinding routine that included many sub-solves. These sub-solves took many incremental steps toward thetrue solution, only the final solution, if it was found, was recorded as a solution. Practically speaking, ifthe solve success rate was not high enough we tuned how many sub-solves the routine performed. Our goalwas to reach 50% solve success rate for all scenarios, however even after experimenting with several solversettings, there were some scenarios that proved to be more difficult.
Scn Solve Success Rate (%)#1 - REDII revision proposal 70.14#2 - Lower GHG target 63.36#3 - No food-based biofuels 44.52#4 - No food-based or intermediate crops 41.94#5 - No intermediate crops 53.58#6 - Higher subtargets 58.91#7 - Low EV growth 71.82#8 - Renewable energy target 39.48#9 - High renewable energy target 45.58#10 - Energy target, no food-based or intermediate 44.75
TABLE 3.10: Solve success rate by scenario.

21
Chapter 4
Policy Scenario Matrix
GAMS developed 10 policy scenarios in close concert with researchers at the International Council onClean Transportation in order to illustrate important factors about how the model responds to various dataand structural changes. Table 1.1 details the nature of those 10 policy scenarios. Further details about themodel assumption set are provided:
• Gasoline can contain at most 10% ethanol (by volume)
• Diesel can contain at most 7% FAME (biodiesel) (by volume)
• 0% of total transport energy can come from palm oil based fuels
• At most 1.7% of total transport energy can come from Annex IX, Part B fuels
• At least 5% of aviation transport energy must come from sustainable aviation alternatives (SAF),assuming that half of the 2.6% RFNBO target is met using green hydrogen in petroleum refining
• At least 1.3% of total transport energy must come from renewable fuels of non-biological origin(RFNBO)
• The resource potential of HVO (crude tall oil) must be less than 44.5 billion MJ [11]
• The resource potential of CNG (manure) must be less than 361 billion MJ [12]
• The resource potential of CNG (biowaste) must be less than 95 billion MJ [12]
• The resource potential of fuels from flue gas processes, assuming the same resource potential aspreviously estimated for the U.S., must be less than 36.3 billion MJ [13]
We assume 5% to be the average cap on food-based biofuels in the EU in practice. The REDII capsthe contribution of food based fuels in 2030 at either 7% of the final energy consumption in the road andrail sectors in each Member State or at one percentage point higher than the share of such fuels in the year2020. Because several Member States are expected to consume less than 7% food-based biofuels in 2020and some Member States may choose to set a cap lower, we assume the average contribution of food-basedbiofuels to be 5%. For example, Germany has proposed setting its national food based cap at 4.4% in 2030[14]. Our assumption of 5% food based fuels in 2030 is also roughly consistent with the shares reportedfor the modeling scenarios in the Commission’s Climate Target Plan [15]. So while we present 7% as the

Chapter 4. Policy Scenario Matrix 22
food-based biofuel cap in applicable scenarios, this is actually reflected as a 5% maximum blending of food-based biofuels in the modeling. Similarly, we reduce the 2.6% RFNBO target to 1.3% in the modeling. Inaddition to direct use of RFNBOs in transport, green hydrogen used in petroleum refining is eligible to counttowards the 2.6% RFNBO target. This pathway is not included in our model. It is unclear how much of theRFNBO target may be met with green hydrogen used in petroleum refining; we assume half.
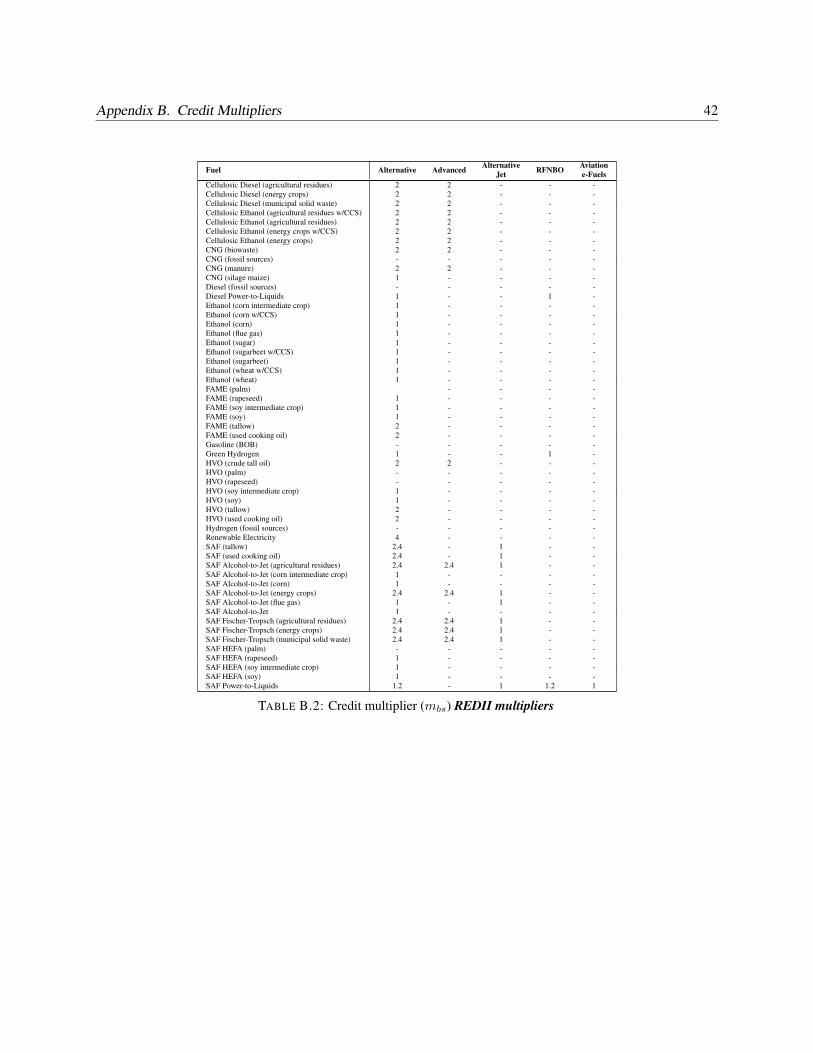
The credit multipliers here are described as 1.2x SAF and Maritime only and REDII multipliers, allcredit multipliers (mbs) are included in Appendix B. 1.2x SAF and Maritime only reflects the REDII revisionproposal, including only the 1.2x multiplier of advanced biofuels (Annex IX, Part A) and RFNBOs used inthe aviation and maritime sectors towards the REDII revision targets. REDII multipliers reflects the full setof multipliers in current policy in the REDII, including the same 1.2x multiplier for aviation and maritime,as well as the 2x multiplier for advanced biofuels and Annex IX, Part B fuels and the 4x multiplier forrenewable electricity used in vehicles.
23
Chapter 5
Fuel Consumption Impacts
One of the primary model outputs is the quantity the blendstock fuels that are supported by each policyproposal. These quantities are shown in an aggregate form, side-by-side, in Figure 1.1. The accompanyingtabular data, which includes distributional information by blendstock, is located in Appendix E. The categoryaggregation is performed such that each blendstock belongs to only one category; only alternative fuels arepresented in this graph. The aggregation schema is provided in Table 5.1.
FIGURE 5.1: Energy consumption by fuel category by policy scenario. Values shown hereare mean values from the sensitivity experiments.

Chapter 5. Fuel Consumption Impacts 24
Blendstock Aggregation CategoryCNG (manure) Advanced Biofuels - CNGCNG (biowaste) Advanced Biofuels - CNGHVO (crude tall oil) Advanced Biofuels - DieselCellulosic Diesel (agricultural residues) Advanced Biofuels - DieselCellulosic Diesel (energy crops) Advanced Biofuels - DieselCellulosic Diesel (municipal solid waste) Advanced Biofuels - DieselCellulosic Ethanol (agricultural residues) Advanced Biofuels - EthanolCellulosic Ethanol (energy crops) Advanced Biofuels - EthanolSAF e-Fuels Aviation e-FuelsDiesel e-Fuels Diesel e-FuelsCellulosic Ethanol (agricultural residues w/CCS) Ethanol w/ CCSCellulosic Ethanol (energy crops w/CCS) Ethanol w/ CCSEthanol (corn w/CCS) Ethanol w/ CCSEthanol (wheat w/CCS) Ethanol w/ CCSEthanol (sugarbeet w/CCS) Ethanol w/ CCSFAME (soy) Food-Based Biodiesel/HVOFAME (rapeseed) Food-Based Biodiesel/HVOFAME (palm) Food-Based Biodiesel/HVOHVO (soy) Food-Based Biodiesel/HVOHVO (rapeseed) Food-Based Biodiesel/HVOHVO (palm) Food-Based Biodiesel/HVOCNG (silage maize) Food-based CNGEthanol (corn) Food-Based EthanolEthanol (wheat) Food-Based EthanolEthanol (sugar) Food-Based EthanolEthanol (sugarbeet) Food-Based EthanolSAF Alcohol-to-Jet (corn) Food-Based Jet FuelSAF Alcohol-to-Jet Food-Based Jet FuelSAF HEFA (rapeseed) Food-Based Jet FuelSAF HEFA (soy) Food-Based Jet FuelSAF HEFA (palm) Food-Based Jet FuelHydrogen (fossil sources) HydrogenGreen Hydrogen HydrogenEthanol (corn intermediate crop) Intermediate Crop BiofuelSAF Alcohol-to-Jet (corn intermediate crop) Intermediate Crop BiofuelFAME (soy intermediate crop) Intermediate Crop BiofuelHVO (soy intermediate crop) Intermediate Crop BiofuelSAF HEFA (soy intermediate crop) Intermediate Crop BiofuelEthanol (flue gas) Recycled Carbon FuelSAF Alcohol-to-Jet (flue gas) Recycled Carbon FuelRenewable Electricity Renewable ElectricitySAF Alcohol-to-Jet (agricultural residues) SAFSAF Alcohol-to-Jet (energy crops) SAFSAF Fischer-Tropsch (agricultural residues) SAFSAF Fischer-Tropsch (energy crops) SAFSAF Fischer-Tropsch (municipal solid waste) SAFSAF (used cooking oil) SAFSAF (tallow) SAFFAME (used cooking oil) Waste Oils Biodiesel/HVOFAME (tallow) Waste Oils Biodiesel/HVOHVO (used cooking oil) Waste Oils Biodiesel/HVOHVO (tallow) Waste Oils Biodiesel/HVO
TABLE 5.1: Aggregation schema used to generate Figure 1.1.

25
Chapter 6
Vehicle Kilometers Traveled (VKT)
Another primary model output is the vehicle kilometers travel by each consumer. As a brief reminder, eachconsumer will respond to price signals, and as such, the desire to travel will float up or down dependingon the fuel incentives created by the individual policy scenarios. The following sections break out the totalkilometers traveled by vehicle type for each consumer in the model.
6.1 LDV consumer VKT
FIGURE 6.1: LDV kilometers traveled by policy scenario. Values shown here are meanvalues from the sensitivity experiments.
Chapter 6. Vehicle Kilometers Traveled (VKT) 26
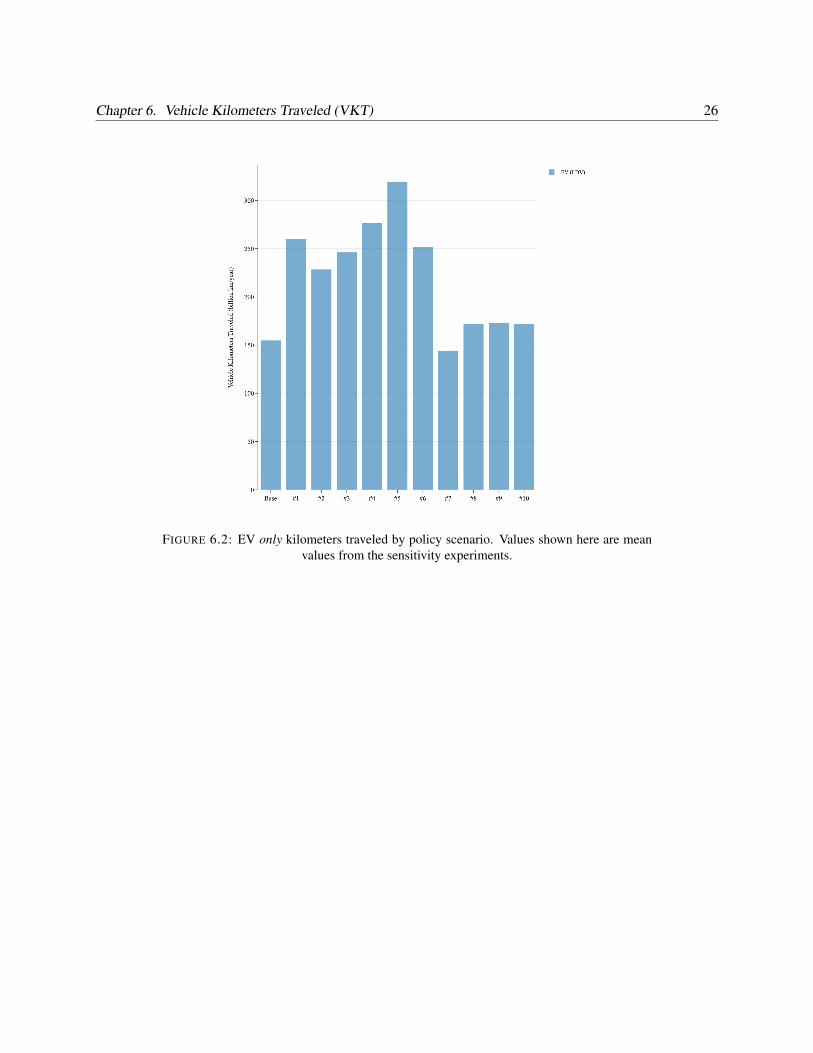
FIGURE 6.2: EV only kilometers traveled by policy scenario. Values shown here are meanvalues from the sensitivity experiments.

27
Chapter 7
GHG Credit Prices
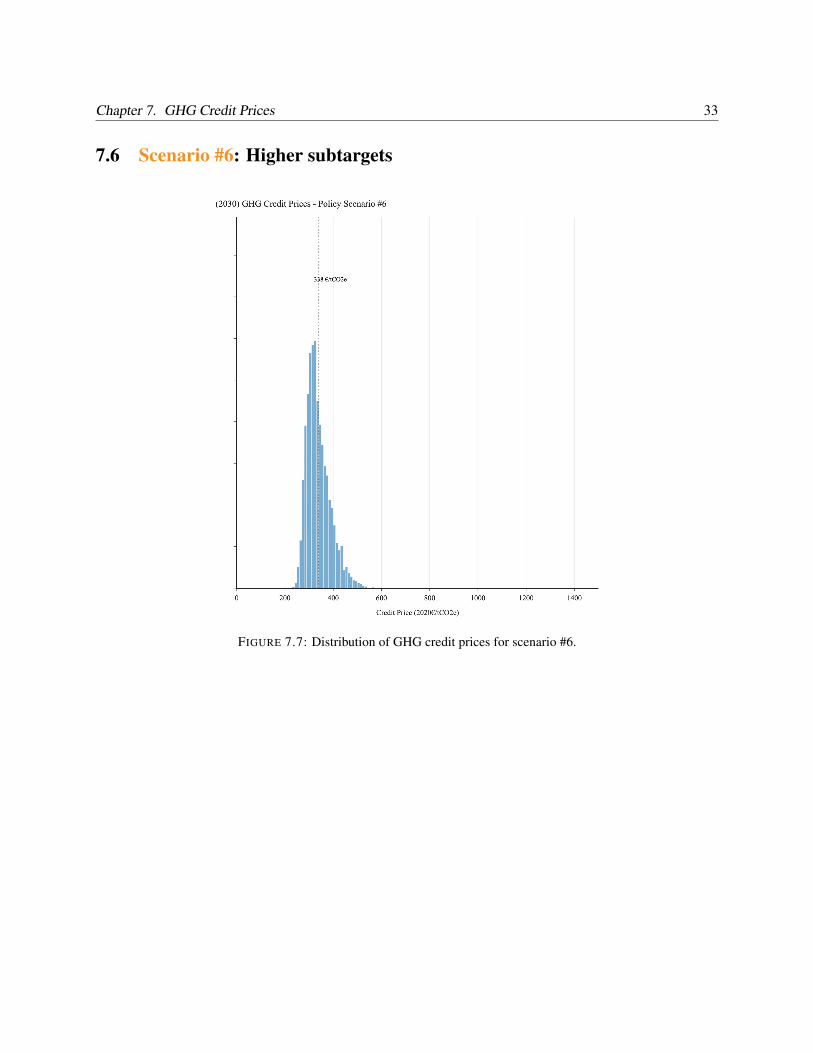
As a reminder, policy scenarios #8-10 do not have an active GHG reduction standard, thus they will not havea GHG credit price. A summary of the mean GHG credit price by policy scenario is shown in Figure 7.1. Thefollowing sections show distribution of credit prices for each of the policy scenarios. Again, the distributionof prices results from the sensitivity tests described in Section 3.5. It is important to understand the impactthat uncertainty has on aggregate policy parameters; these parameters represent the main market signal thatinfluence how compliance is achieved. The following figures show that these aggregate parameters havewell defined peaks (with varying degrees of spread) even when considering uncertain market conditions.
FIGURE 7.1: Mean GHG credit price by policy scenario.

Chapter 7. GHG Credit Prices 28
7.1 Scenario #1: REDII revision proposal
FIGURE 7.2: Distribution of GHG credit prices for scenario #1.

Chapter 7. GHG Credit Prices 29
7.2 Scenario #2: Lower GHG target
FIGURE 7.3: Distribution of GHG credit prices for scenario #2.

Chapter 7. GHG Credit Prices 30
7.3 Scenario #3: No food-based biofuels
FIGURE 7.4: Distribution of GHG credit prices for scenario #3.

Chapter 7. GHG Credit Prices 31
7.4 Scenario #4: No food-based or intermediate crops
FIGURE 7.5: Distribution of GHG credit prices for scenario #4.

Chapter 7. GHG Credit Prices 32
7.5 Scenario #5: No intermediate crops
FIGURE 7.6: Distribution of GHG credit prices for scenario #5.
Chapter 7. GHG Credit Prices 33
7.6 Scenario #6: Higher subtargets
FIGURE 7.7: Distribution of GHG credit prices for scenario #6.

Chapter 7. GHG Credit Prices 34
7.7 Scenario #7: Low EV growth
FIGURE 7.8: Distribution of GHG credit prices for scenario #7.

35
Chapter 8
Overall Program Cost
Overall program costs are captured by the objective function; we report objective function values for theLDV consumer, HDV consumer Aviation Consumer. The cost impacts are presented in Table 8.1.
Scn LDV Consumer(billion e)
HDV Consumer(billion e)
Aviation Consumer(billion e)
#1 - REDII revision proposal 10.7 (+1.3%) 26.6 (+13.4%) 0.1 (+0.1%)#2 - Lower GHG target 9.7 (+1.2%) 22.2 (+11.2%) 0 (+0%)#3 - No food-based biofuels 8.6 (+1.1%) 22.7 (+11.5%) 0.1 (+0.1%)#4 - No food-based or intermediate crops 5.9 (+0.7%) 24.5 (+12.4%) 0.1 (+0.1%)#5 - No intermediate crops 9.1 (+1.1%) 30.3 (+15.3%) 0.1 (+0.2%)#6 - Higher subtargets 10.9 (+1.3%) 25.5 (+12.9%) 0.2 (+0.2%)#7 - Low EV growth 13.9 (+1.8%) 27.2 (+13.8%) 0.1 (+0.1%)#8 - Renewable energy target 12.4 (+1.5%) 24.2 (+12.2%) 0 (+0%)#9 - High renewable energy target 14 (+1.7%) 29.4 (+14.9%) 0.2 (+0.2%)#10 - Energy target, no food-based or intermediate 12.9 (+1.6%) 22.5 (+11.4%) 0.2 (+0.2%)
TABLE 8.1: Consumer cost impact analysis (presented as a difference from baseline costs).Parenthetical values show the % difference from the 2030 baseline

36
Chapter 9
Discussion
This study assesses the expected compliance with major transport fuels elements of the Fit for 55 package,including the REDII revision and ReFuelEU proposals, as well as nine other policy scenarios that representchanges that could potentially be made to transport fuel policies in this package. From assessing the Euro-pean Commission’s policy proposals as well as the other scenarios, there are a number of key observationswe can make that could help inform future policy decisions.
9.1 Intermediate crops
In this study, we find that intermediate crop biofuel largely fills in the gap between the overall target (whetherthis is GHG target or an energy mandate) and the sum of sub-mandates and caps. Comparing Scenarios 1 and2, we see that reducing the GHG target results largely in a reduction in intermediate crop biofuel. Conversely,comparing Scenarios 8 and 9, increasing the renewable energy mandate results largely in an increase inintermediate crop biofuel. The reason this occurs is because we expect intermediate crop biofuel to be arelatively inexpensive compliance option for fuel blenders, but its contribution to the REDII and REDIIrevision targets is not capped. Article 2, paragraph 40 of the REDII defines food- and feed-based biofuels as“starch-rich crops, sugar crops or oil crops produced on agricultural land as a main crop excluding residues,waste or ligno-cellulosic material and intermediate crops, such as catch crops and cover crops, provided thatthe use of such intermediate crops does not trigger demand for additional land.”
While intermediate crops in the EU are generally grown for environmental protection purposes, outsidethe EU, they are generally grown as business-as-usual cash crops for purely economic reasons; these cropsare generally used for food and feed [16, 17]. For example, in Brazil, two-thirds of all maize produced isgrown as a winter crop; in 2020, winter corn reached 77 million tons [18]. The FAO projects that one-thirdof the increase in soybean harvested area over the coming decade will be from winter cropping [19]. Whileintermediate crops are only grown on 2% of cropland in the United States, 80% of this is wheat and rye,staple food crops [20]. The use of these crops for EU biofuels would displace them from their existinguses in food and feed, increasing overall demand for food and feed crops, raising food and feed prices, andcausing ILUC, exactly the same as for food and feed crops grown as main crops. We thus apply the sameILUC factors to intermediate crop biofuels as we do for the corresponding food-based biofuel pathways.While the REDII states that to be exempt from the food- and feed-based biofuel cap, intermediate cropsshould “not trigger demand for additional land,” the European Commission has not issued guidance on howvoluntary schemes should interpret this clause. In the absence of any guidance, we assume that voluntaryschemes would only verify that intermediate crops were indeed grown during the winter or off-season and

Chapter 9. Discussion 37
would not apply the same level of rigor as, for example, the Commission’s proposed rules for certifyinglow-ILUC biofuel feedstocks in the draft delegated act on voluntary schemes [21].
In particular, in scenarios with higher targets we see an increase in intermediate crop soy HVO, presum-ably because this fuel is not subject to blend walls, as ethanol and biodiesel (FAME) are. In Scenario 1, 97%of all intermediate crop fuel is from soy (the remainder is from maize). This effect corresponds to lowerGHG savings and higher costs of carbon abatement for the policy scenarios overall. This is because soy bio-fuel has very high ILUC emissions, according to the estimates we take from the 2015 study commissionedby the European Commission Valin et al. [9], with total GHG emissions for soy biofuel far exceeding thatof petroleum fuels. For example, when the GHG target in the REDII revision proposal is reduced from 13%in Scenario 1 to 11% in Scenario 2, the total GHG savings from the policy increases from 29 to 37 milliontons CO2e in 2030 and the average cost of carbon abatement declines from around 1300 to 850 e/MTCO2e.Much of this is due to a decline in intermediate crop soy biofuel from 5.6 to 2.3 billion liters in Scenarios 1and 2, respectively. In the scenarios modeling a renewable energy target, increasing that target from 26% to29.5% (Scenarios 8 and 9, respectively) eliminates all GHG savings from the policy and actually leads to aGHG increase because of the large increase in intermediate crop soy biofuel, from 6.9 to 14.2 billion liters.The three scenarios with by far the highest GHG savings and the lowest cost of carbon abatement are allthose in which intermediate crops are included in the food-based biofuel cap (and without an incentive forintermediate crop biofuel, we see zero volumes): Scenarios 4, 5, and 10. In scenarios 4 and 5, the GHG sav-ings from the Commission’s current proposal are roughly doubled, even though the target levels are lower(9% and 8%, respectively), because of the sharp reduction in soy biofuel.
9.2 Food-and-feed based biofuels
Similar to our findings on intermediate crop biofuels, we find that reducing the cap on food- and feed-basedbiofuels increases GHG savings, reduces costs, and reduces the average cost of carbon abatement. We cansee this in Scenario 3, which is the same as the Commission’s REDII revision proposal but excluding food-based biofuels and reducing the GHG target accordingly; this increases GHG savings from 29 to 38 milliontons CO2e. Excluding food-based biofuels reduces the average cost of carbon abatement by around 35%.
9.3 GHG target level
We find that the GHG savings are substantially higher and the average cost of carbon abatement lower inscenarios with a GHG target compared to a renewable energy mandate. Scenarios 1 and 8 achieve similarquantities of renewable energy and use the same set of submandates and caps – but Scenario 1, representingthe GHG target, achieves around three times the GHG savings of the renewable energy mandate (Scenario8). The average cost of carbon abatement for the GHG target is around one-third that of the renewable energymandate. These differences are muted if food-based biofuels and intermediate crop biofuels are excluded:Scenarios 4 and 10 achieve similar levels of renewable energy without these categories, but Scenario 4,representing the GHG target, achieves around 10% greater GHG savings and around a 20% lower cost ofcarbon abatement, compared to the renewable energy mandate in Scenario 10. In scenarios with a GHGtarget, we see greater amounts of very low carbon fuels – for example, as shown in Figure 5, all the GHGtarget scenarios (Scenarios 1-7) have significant amounts of ethanol with carbon capture and storage (CCS),

Chapter 9. Discussion 38
a technology that can be used to substantially reduce CO2 emissions from both conventional and cellulosicethanol production, while we see no significant volumes for these pathways in the renewable energy mandatescenarios (Scenarios 8-10).
9.4 Aviation fuels
We find that SAF and aviation e-fuel volumes exceed the targets in every scenario. The share of SAF in totaljet fuel is over 6% in 2030 in all of our scenarios, compared to the target of 5% for 2030 in the proposedReFuel EU regulation. Over-compliance with the aviation e-fuel mandate is even more dramatic; in all ofour scenarios, the share of e-fuels in total jet fuel is over 2.7%, compared to the target of 0.7% in 2030. Thissuggests that the transport-wide targets are generally more ambitious than the ReFuel EU targets.
9.5 Electric vehicles
We find a significant response of electric vehicle penetration in response to the GHG target scenarios in ourstudy, but not the renewable energy mandate scenarios, as shown in Figure 6.2. The REDII revision proposalincludes an amendment to require EU Member States to “establish a mechanism allowing fuel suppliers intheir territory to exchange credits for supplying renewable energy to the transport sector” (amendment toArticle 25). Public charging stations are identified as the parties that should receive credits. This requirementcreates an incentive for charging station companies to expand their networks and reduce their rates, whichshould contribute to further electric vehicle sales and use. While renewable electricity used in vehiclescounts towards the renewable energy in transport mandate in the REDII, there is no required mechanism toincentivize further penetration of electric vehicles. In our model, the renewable energy mandate in Scenarios8-10 only incentivizes electric vehicles very slightly compared to a baseline scenario by increasing electricityprices to a lesser extent than gasoline and diesel prices. Our results show that a GHG target is a much moreeffective way to increase electric vehicle penetration through low carbon fuels policy than a renewableenergy mandate. Electric vehicle kilometers driven more than doubles in the scenario with the highest creditprice (Scenario 5) compared to the baseline scenario.
9.6 Regarding carbon abatement costs
Aggregate metrics, such as the average carbon abatement costs, can be used to compare results across manydifferently structured models. In the policy scenarios that we designed we vary the levels of both the GHGtargets and the energy mandates. We calculate the average cost of carbon abatement as the difference inconsumer costs when compared to the baseline divided by the total reduction in GHG emissions. Theaverage cost of carbon abatement is shown in Table 9.1.
Overall, the GHG credit prices, shown in Table 1.2, mirror the trends in consumer costs and the averagecost of carbon abatement, shown in Table 9.1. However, in all cases the GHG credit prices are lower thanthe average cost of carbon abatement. The difference between these two values is that the GHG credit pricerepresents only the marginal cost of compliance with the GHG target, while the average cost of carbonabatement represents the overall average cost (including all policy constraints). Constraints such as the

Chapter 9. Discussion 39
advanced biofuel and RFNBO mandates, in particular, are expensive to meet. Additionally, the GHG creditprices are calculated without considering ILUC, while we calculate the average cost of carbon abatementwith ILUC included in the GHG calculation. Thus, for the average cost of carbon abatement, we are dividingcosts over a smaller quantity of GHG savings. This term better reflects the true cost of climate mitigationcompared to the GHG credit price.
Scn Consumer Cost Increase(billion e)
GHG Reduction(million tCO2e)
Average Cost ofCarbon Abatement
(e/tCO2e)#1 - REDII revision proposal 37.4 +(3.4%) 29.2 1281#2 - Lower GHG target 32 +(2.9%) 37.4 855#3 - No food-based biofuels 31.4 +(2.9%) 38.2 823#4 - No food-based or intermediate crops 30.5 +(2.8%) 66.4 460#5 - No intermediate crops 39.6 +(3.6%) 58 682#6 - Higher subtargets 36.6 +(3.3%) 35.4 1033#7 - Low EV growth 41.1 +(3.8%) -2.3 NA#8 - Renewable energy target 36.6 +(3.3%) 9.5 3871#9 - High renewable energy target 43.6 +(4%) -13.1 NA#10 - Energy target, no food-based or intermediate 35.6 +(3.2%) 60.3 590
TABLE 9.1: Effective cost of reducing carbon emissions across all scenarios.

40
Appendix A
Fuel Categories
The following category labels were used in this work.
Fuel Category Member
All Finished Fuels Finished Diesel Fuel, Finished CNG, ElectricityFinished Gasoline, Finished Hydrogen, Finished Jet Fuel
All LDV Fuels Renewable ElectricityGasoline (BOB)Ethanol (corn), Ethanol (corn intermediate crop), Ethanol (corn w/CCS)Ethanol (sugar), Ethanol (sugarbeet)Ethanol (sugarbeet w/CCS)Ethanol (wheat), Ethanol (wheat w/CCS)Cellulosic Ethanol (agricultural residues)Cellulosic Ethanol (agricultural residues w/CCS)Cellulosic Ethanol (energy crops), Cellulosic Ethanol (energy crops w/CCS), Ethanol (flue gas)
All HDV Fuels CNG (fossil sources)CNG (biowaste), CNG (manure), CNG (silage maize)Diesel (fossil sources)FAME (palm), FAME (rapeseed)FAME (soy), FAME (soy intermediate crop)FAME (tallow), FAME (used cooking oil), HVO (crude tall oil)HVO (palm), HVO (rapeseed)HVO (soy), HVO (soy intermediate crop)HVO (tallow), HVO (used cooking oil)Cellulosic Diesel (agricultural residues), Cellulosic Diesel (energy crops), Cellulosic Diesel(municipal solid waste)Diesel e-FuelsHydrogen (fossil sources), Green Hydrogen
All Jet Fuels Kerosene (fossil sources)SAF Alcohol-to-Jet (agricultural residues)SAF Fischer-Tropsch (agricultural residues)SAF Alcohol-to-Jet (corn)SAF Alcohol-to-Jet (corn intermediate crop)SAF Alcohol-to-Jet (energy crops)SAF Fischer-Tropsch (agricultural residues)SAF Alcohol-to-Jet (flue gas)SAF Fischer-Tropsch (municipal solid waste)SAF HEFA (palm), SAF e-FuelsSAF HEFA (rapeseed), SAF HEFA (soy), SAF HEFA (soy intermediate crop)SAF Alcohol-to-JetSAF (tallow), SAF (used cooking oil)
TABLE A.1: All modeled fuels.

41
Appendix B
Credit Multipliers
Values for the parameter mbs in Equations 3.8, 3.9, 3.10, 3.11, and 3.12 are listed in the following tables.
Fuel Alternative Advanced AlternativeJet RFNBO Aviation
e-FuelsCellulosic Diesel (agricultural residues) 1 1 - - -Cellulosic Diesel (energy crops) 1 1 - - -Cellulosic Diesel (municipal solid waste) 1 1 - - -Cellulosic Ethanol (agricultural residues w/CCS) 1 1 - - -Cellulosic Ethanol (agricultural residues) 1 1 - - -Cellulosic Ethanol (energy crops w/CCS) 1 1 - - -Cellulosic Ethanol (energy crops) 1 1 - - -CNG (biowaste) 1 1 - - -CNG (fossil sources) - - - - -CNG (manure) 1 1 - - -CNG (silage maize) 1 - - - -Diesel (fossil sources) - - - - -Diesel Power-to-Liquids 1 - - 1 -Ethanol (corn intermediate crop) 1 - - - -Ethanol (corn w/CCS) 1 - - - -Ethanol (corn) 1 - - - -Ethanol (flue gas) 1 - - - -Ethanol (sugar) 1 - - - -Ethanol (sugarbeet w/CCS) 1 - - - -Ethanol (sugarbeet) 1 - - - -Ethanol (wheat w/CCS) 1 - - - -Ethanol (wheat) 1 - - - -FAME (palm) - - - -FAME (rapeseed) 1 - - - -FAME (soy intermediate crop) 1 - - - -FAME (soy) 1 - - - -FAME (tallow) 1 - - - -FAME (used cooking oil) 1 - - - -Gasoline (BOB) - - - - -Green Hydrogen 1 - - 1 -HVO (crude tall oil) 1 1 - - -HVO (palm) - - - - -HVO (rapeseed) - - - - -HVO (soy intermediate crop) 1 - - - -HVO (soy) 1 - - - -HVO (tallow) 1 - - - -HVO (used cooking oil) 1 - - - -Hydrogen (fossil sources) - - - - -Renewable Electricity 1 - - - -SAF (tallow) 1 - 1 - -SAF (used cooking oil) 1 - 1 - -SAF Alcohol-to-Jet (agricultural residues) 1 1 1.2 - -SAF Alcohol-to-Jet (corn intermediate crop) 1 - - - -SAF Alcohol-to-Jet (corn) 1 - - - -SAF Alcohol-to-Jet (energy crops) 1 1 1.2 - -SAF Alcohol-to-Jet (flue gas) 1 - 1 - -SAF Alcohol-to-Jet 1 - - - -SAF Fischer-Tropsch (agricultural residues) 1 1 1.2 - -SAF Fischer-Tropsch (energy crops) 1 1 1.2 - -SAF Fischer-Tropsch (municipal solid waste) 1 1 1.2 - -SAF HEFA (palm) - - - - -SAF HEFA (rapeseed) 1 - - - -SAF HEFA (soy intermediate crop) 1 - - - -SAF HEFA (soy) 1 - - - -SAF Power-to-Liquids 1 - 1 1.2 1
TABLE B.1: Credit multiplier (mbs) 1.2x SAF and Maritime only.
Appendix B. Credit Multipliers 42
Fuel Alternative Advanced AlternativeJet RFNBO Aviation
e-FuelsCellulosic Diesel (agricultural residues) 2 2 - - -Cellulosic Diesel (energy crops) 2 2 - - -Cellulosic Diesel (municipal solid waste) 2 2 - - -Cellulosic Ethanol (agricultural residues w/CCS) 2 2 - - -Cellulosic Ethanol (agricultural residues) 2 2 - - -Cellulosic Ethanol (energy crops w/CCS) 2 2 - - -Cellulosic Ethanol (energy crops) 2 2 - - -CNG (biowaste) 2 2 - - -CNG (fossil sources) - - - - -CNG (manure) 2 2 - - -CNG (silage maize) 1 - - - -Diesel (fossil sources) - - - - -Diesel Power-to-Liquids 1 - - 1 -Ethanol (corn intermediate crop) 1 - - - -Ethanol (corn w/CCS) 1 - - - -Ethanol (corn) 1 - - - -Ethanol (flue gas) 1 - - - -Ethanol (sugar) 1 - - - -Ethanol (sugarbeet w/CCS) 1 - - - -Ethanol (sugarbeet) 1 - - - -Ethanol (wheat w/CCS) 1 - - - -Ethanol (wheat) 1 - - - -FAME (palm) - - - -FAME (rapeseed) 1 - - - -FAME (soy intermediate crop) 1 - - - -FAME (soy) 1 - - - -FAME (tallow) 2 - - - -FAME (used cooking oil) 2 - - - -Gasoline (BOB) - - - - -Green Hydrogen 1 - - 1 -HVO (crude tall oil) 2 2 - - -HVO (palm) - - - - -HVO (rapeseed) - - - - -HVO (soy intermediate crop) 1 - - - -HVO (soy) 1 - - - -HVO (tallow) 2 - - - -HVO (used cooking oil) 2 - - - -Hydrogen (fossil sources) - - - - -Renewable Electricity 4 - - - -SAF (tallow) 2.4 - 1 - -SAF (used cooking oil) 2.4 - 1 - -SAF Alcohol-to-Jet (agricultural residues) 2.4 2.4 1 - -SAF Alcohol-to-Jet (corn intermediate crop) 1 - - - -SAF Alcohol-to-Jet (corn) 1 - - - -SAF Alcohol-to-Jet (energy crops) 2.4 2.4 1 - -SAF Alcohol-to-Jet (flue gas) 1 - 1 - -SAF Alcohol-to-Jet 1 - - - -SAF Fischer-Tropsch (agricultural residues) 2.4 2.4 1 - -SAF Fischer-Tropsch (energy crops) 2.4 2.4 1 - -SAF Fischer-Tropsch (municipal solid waste) 2.4 2.4 1 - -SAF HEFA (palm) - - - - -SAF HEFA (rapeseed) 1 - - - -SAF HEFA (soy intermediate crop) 1 - - - -SAF HEFA (soy) 1 - - - -SAF Power-to-Liquids 1.2 - 1 1.2 1
TABLE B.2: Credit multiplier (mbs) REDII multipliers

43
Appendix C
Elasticities
Fuel Lower Bound Upper BoundGasoline (BOB) 6 10Diesel (fossil sources) 6 10Kerosene (fossil sources) 6 10CNG (fossil sources) 6 10FAME (soy) 5.64 10.48FAME (rapeseed) 5.64 10.48FAME (palm) 5.64 10.48FAME (used cooking oil) 10.73 19.93FAME (tallow) 10.73 19.93FAME (soy intermediate crop) 5.64 10.48HVO (soy intermediate crop) 7.56 14.03HVO (soy) 7.56 14.03HVO (rapeseed) 7.56 14.03HVO (palm) 8.51 15.81HVO (used cooking oil) 7.86 14.59HVO (tallow) 7.58 14.08HVO (crude tall oil) 7.33 13.61Cellulosic Diesel (agricultural residues) 3.97 7.38Cellulosic Diesel (energy crops) 3.82 7.1Cellulosic Diesel (municipal solid waste) 5.13 9.52Diesel Power-to-Liquids 3.62 6.72Hydrogen (fossil sources) 27.58 51.22Green Hydrogen 6.86 12.73Renewable Electricity 1.68 3.12CNG (manure) 2.29 4.26CNG (silage maize) 5.09 9.46CNG (biowaste) 2.29 4.26Cellulosic Ethanol (agricultural residues) 6.63 12.32Cellulosic Ethanol (energy crops) 6.63 12.32Cellulosic Ethanol (agricultural residues w/CCS) 3.95 7.34Cellulosic Ethanol (energy crops w/CCS) 3.99 7.4Ethanol (corn) 7.07 13.12Ethanol (wheat) 7.07 13.12Ethanol (sugar) 7.07 13.12Ethanol (sugarbeet) 7.07 13.12Ethanol (corn w/CCS) 8.1 15.04Ethanol (wheat w/CCS) 8.14 15.11Ethanol (sugarbeet w/CCS) 7.86 14.6Ethanol (flue gas) 9.92 18.42Ethanol (corn intermediate crop) 7.07 13.12SAF Alcohol-to-Jet (corn) 5.93 11.01SAF Alcohol-to-Jet 6.04 11.21SAF Alcohol-to-Jet (agricultural residues) 2.88 5.35SAF Alcohol-to-Jet (energy crops) 2.82 5.24SAF Fischer-Tropsch (agricultural residues) 3.03 5.63SAF Fischer-Tropsch (energy crops) 2.93 5.45SAF Fischer-Tropsch (municipal solid waste) 3.74 6.94SAF (used cooking oil) 7.44 13.81SAF (tallow) 5.37 9.98SAF HEFA (rapeseed) 4.82 8.95SAF HEFA (soy) 4.82 8.95SAF HEFA (palm) 5.28 9.8SAF Power-to-Liquids 2.87 5.34SAF Alcohol-to-Jet (flue gas) 4.29 7.96SAF Alcohol-to-Jet (corn intermediate crop) 5.25 9.75SAF HEFA (soy intermediate crop) 4.82 8.95
TABLE C.1: Supply elasticities, ηbs

Appendix C. Elasticities 44
Consumer Lower Bound Upper Bound SourceHDV Consumer -0.08 -0.02 Assumed similar to [22]-LDV Consumer -0.08 -0.02 [22]Aviation Consumer -1.2 -0.8 [23]
TABLE C.2: Demand elasticity, ε
Consumer Lower Bound Upper BoundHDV Consumer 1.1 3LDV Consumer 1.1 8
TABLE C.3: Elasticity of substitution, σ

45
Appendix D
Baseline Data
Fuel Quantity(billion MJ)
PolicyEmission Factor
(gCO2e/MJ)
Emission Factorw/ILUC
(gCO2e/MJ)Source
Gasoline (BOB) 3144.5 94 94 [24]Diesel (fossil sources) 7874.97 94 94 [24]Kerosene (fossil sources) 1844.03 94 94 [25]CNG (fossil sources) 72 94 94 [26]FAME (soy) 0.4844 32.9 182.9 [27, 28]FAME (rapeseed) 0.9055 32.9 97.9 [27, 28]FAME (palm) 0.6857 32.9 263.9 [27, 28]FAME (used cooking oil) 0.005 11.2 11.2 [27, 28]FAME (tallow) 0.005 15.3 15.3 [27, 28]FAME (soy intermediate crop) 0.2422 32.9 182.9 [27]HVO (soy intermediate crop) 0.0025 32.9 182.9 [29]HVO (soy) 0.005 32.9 182.9 [29]HVO (rapeseed) 0.005 32.9 97.9 [29]HVO (palm) 0.005 32.9 263.9 [29]HVO (used cooking oil) 0.0905 11.9 11.9 [29]HVO (tallow) 0.0283 16 16 [29]HVO (crude tall oil) 0.0283 12 12 [29]Cellulosic Diesel (agricultural residues) 0.0001 7.7 23.7 [29, 30]Cellulosic Diesel (energy crops) 0.0001 10.4 -1.6 [29, 30]Cellulosic Diesel (municipal solid waste) 0.0001 15 15 [29, 31]Diesel e-Fuels 0.0001 1 1 [32, 33]Hydrogen (fossil sources) 0.0001 13.2 13.2 [34, 35]Green Hydrogen 0.0001 1.8 1.8 [35, 36, 37]Renewable Electricity 1.6271 -89 -89 [32]CNG (manure) 0.0001 -84 -84 [12, 38]CNG (silage maize) 0.001 28 49 [12, 38]CNG (biowaste) 0.0001 13 13 [12, 38]Cellulosic Ethanol (agricultural residues) 0.0001 13.7 29.7 [39]Cellulosic Ethanol (energy crops) 0.0001 14 2 [39]Cellulosic Ethanol (agricultural residues w/CCS) 0.0001 -93.7 -77.7 [39, 40, 41, 42]Cellulosic Ethanol (energy crops w/CCS) 0.0001 -85.2 -97.2 [39, 40, 41, 42]Ethanol (corn) 0.2218 32.9 46.9 [43]Ethanol (wheat) 0.2368 32.9 66.9 [43]Ethanol (sugar) 0.0823 28.1 45.1 [43]Ethanol (sugarbeet) 0.0606 30.7 45.7 [43]Ethanol (flue gas) 0.0001 19.6 19.6 [31, 39]Ethanol (corn intermediate crop) 0.1109 32.9 46.9 [43]Ethanol (corn w/CCS) 0.0111 28.4 42.4 [40, 41, 42]Ethanol (wheat w/CCS) 0.0118 30 64 [40, 41, 42]Ethanol (sugarbeet w/CCS) 0.0041 16.4 31.4 [40, 41, 42]SAF Alcohol-to-Jet (corn) 0.0001 32.9 46.9 [29, 30]

Appendix D. Baseline Data 46
SAF Alcohol-to-Jet 0.0001 24 41 [29, 30]SAF Alcohol-to-Jet (agricultural residues) 0.0001 29.3 45.3 [29, 30]SAF Alcohol-to-Jet (energy crops) 0.0001 32.9 20.9 [29, 30]SAF Fischer-Tropsch (agricultural residues) 0.0001 7.7 23.7 [29, 30]SAF Fischer-Tropsch (energy crops) 0.0001 10.4 -1.6 [29, 30]SAF Fischer-Tropsch (municipal solid waste) 0.0001 5.2 5.2 [29, 30]SAF (used cooking oil) 0.0001 13.9 13.9 [29, 30]SAF (tallow) 0.0001 22.5 22.5 [29, 30]SAF HEFA (rapeseed) 0.005 32.9 97.9 [29, 30]SAF HEFA (soy) 0.005 32.9 182.9 [29, 30]SAF HEFA (palm) 0.005 32.9 263.9 [29, 30]SAF e-Fuels 0.0001 1 1 [32, 33]SAF Alcohol-to-Jet (flue gas) 0.0001 19.6 19.6 [31, 39]SAF Alcohol-to-Jet (corn intermediate crop) 0.0001 32.9 46.9 [43]SAF HEFA (soy intermediate crop) 0.0025 32.9 182.9 [29]
TABLE D.1: Baseline data.
Scn Gasoline(%/yr)
Diesel(%/yr)
CNG(%/yr)
JET(%/yr)
EV(%/yr)
Hydrogen(%/yr)
#1 - REDII revision proposal -5.15 -0.85 6.9 0.81 51 10#2 - Lower GHG target -5.15 -0.85 6.9 0.81 51 10#3 - No food-based biofuels -5.15 -0.85 6.9 0.81 51 10#4 - No food-based or intermediate crops -5.15 -0.85 6.9 0.81 51 10#5 - No intermediate crops -5.15 -0.85 6.9 0.81 51 10#6 - Higher subtargets -5.15 -0.85 6.9 0.81 51 10#7 - Low EV growth -5.15 -0.85 6.9 0.81 41 10#8 - Renewable energy target -5.15 -0.85 6.9 0.81 51 10#9 - High renewable energy target -5.15 -0.85 6.9 0.81 51 10#10 - Energy target, no food-based or intermediate -5.15 -0.85 6.9 0.81 51 10
TABLE D.2: Fuel annual growth rates used to project the baseline data into future years.

47
Appendix E
Detailed Fuel Quantity Results
Fuel Scn Mean 10% 25% 50% 75% 95%Cellulosic Diesel (agricultural residues) #1 - REDII revision proposal 6.5199 0.149 0.4025 1.7469 7.4034 30.3504Cellulosic Diesel (agricultural residues) #2 - Lower GHG target 5.9906 0.1345 0.3628 1.5634 6.5037 29.4068Cellulosic Diesel (agricultural residues) #3 - No food-based biofuels 6.1267 0.1352 0.3638 1.6405 6.8241 29.1182Cellulosic Diesel (agricultural residues) #4 - No food-based or intermediate crops 6.329 0.1473 0.3867 1.6954 6.7339 30.5114Cellulosic Diesel (agricultural residues) #5 - No intermediate crops 7.5959 0.1775 0.4775 2.0548 8.4936 36.1614Cellulosic Diesel (agricultural residues) #6 - Higher subtargets 12.0734 0.2119 0.5931 2.8111 13.0793 60.5245Cellulosic Diesel (agricultural residues) #7 - Low EV growth 6.9178 0.1572 0.4089 1.8428 7.9502 32.1287Cellulosic Diesel (agricultural residues) #8 - Renewable energy target 6.0338 0.1302 0.3375 1.5015 6.5175 29.1477Cellulosic Diesel (agricultural residues) #9 - High renewable energy target 6.8397 0.1525 0.4009 1.8617 7.7568 31.5026Cellulosic Diesel (agricultural residues) #10 - Energy target, no food-based or intermediate 18.726 0.2457 0.7237 3.5118 17.6953 100.7752Cellulosic Diesel (energy crops) #1 - REDII revision proposal 4.2536 0.1084 0.2707 1.0966 4.3988 20.8192Cellulosic Diesel (energy crops) #2 - Lower GHG target 3.9228 0.0975 0.2479 0.9576 3.8375 19.706Cellulosic Diesel (energy crops) #3 - No food-based biofuels 4.0391 0.0975 0.2489 0.9785 3.911 20.4411Cellulosic Diesel (energy crops) #4 - No food-based or intermediate crops 4.1857 0.103 0.2602 1.0273 4.2578 20.9648Cellulosic Diesel (energy crops) #5 - No intermediate crops 4.8961 0.1164 0.3024 1.2449 5.2525 23.5198Cellulosic Diesel (energy crops) #6 - Higher subtargets 7.947 0.1475 0.3961 1.6626 7.3036 43.0481Cellulosic Diesel (energy crops) #7 - Low EV growth 4.3672 0.1118 0.2796 1.134 4.5948 20.9259Cellulosic Diesel (energy crops) #8 - Renewable energy target 4.2473 0.0999 0.2385 0.9991 4.1122 21.4728Cellulosic Diesel (energy crops) #9 - High renewable energy target 4.6297 0.1164 0.287 1.2222 4.8303 22.5246Cellulosic Diesel (energy crops) #10 - Energy target, no food-based or intermediate 12.4737 0.1733 0.4711 2.1285 10.769 68.22Cellulosic Diesel (municipal solid waste) #1 - REDII revision proposal 45.4448 2.4646 8.279 33.6712 68.9046 136.1391Cellulosic Diesel (municipal solid waste) #2 - Lower GHG target 40.972 2.2443 7.4635 30.5602 61.4436 125.9464Cellulosic Diesel (municipal solid waste) #3 - No food-based biofuels 40.3908 2.2427 7.7812 31.1038 61.1103 120.4588Cellulosic Diesel (municipal solid waste) #4 - No food-based or intermediate crops 41.233 2.3484 8.5469 35.1087 63.553 109.6136Cellulosic Diesel (municipal solid waste) #5 - No intermediate crops 48.5105 2.5127 8.7296 36.1312 74.7945 141.9107Cellulosic Diesel (municipal solid waste) #6 - Higher subtargets 73.4252 4.8187 18.3117 69.881 113.0542 182.5373Cellulosic Diesel (municipal solid waste) #7 - Low EV growth 46.0138 2.4232 7.9655 32.742 71.7224 138.2388Cellulosic Diesel (municipal solid waste) #8 - Renewable energy target 51.8729 2.728 9.2816 37.6748 79.4098 154.4433Cellulosic Diesel (municipal solid waste) #9 - High renewable energy target 63.992 2.8353 9.9471 39.5158 100.6916 194.4852Cellulosic Diesel (municipal solid waste) #10 - Energy target, no food-based or intermediate 122.2733 8.8444 36.9897 134.0173 193.6215 237.0057Cellulosic Ethanol (agricultural residues w/CCS) #1 - REDII revision proposal 7.1063 0.1553 0.4077 1.9037 8.6864 31.6968Cellulosic Ethanol (agricultural residues w/CCS) #2 - Lower GHG target 3.8063 0.0947 0.2367 1.0297 4.2626 16.0602Cellulosic Ethanol (agricultural residues w/CCS) #3 - No food-based biofuels 6.416 0.1357 0.3669 1.6938 7.4861 28.8177Cellulosic Ethanol (agricultural residues w/CCS) #4 - No food-based or intermediate crops 12.2217 0.2622 0.7645 3.6014 16.1443 54.2747Cellulosic Ethanol (agricultural residues w/CCS) #5 - No intermediate crops 18.5352 0.3856 1.1456 6.1049 26.6374 77.587Cellulosic Ethanol (agricultural residues w/CCS) #6 - Higher subtargets 6.5382 0.142 0.3579 1.6794 7.597 28.9298Cellulosic Ethanol (agricultural residues w/CCS) #7 - Low EV growth 9.9666 0.2035 0.5332 2.6878 12.657 44.5658Cellulosic Ethanol (agricultural residues w/CCS) #8 - Renewable energy target 0.492 0.0167 0.0371 0.126 0.3848 1.9927Cellulosic Ethanol (agricultural residues w/CCS) #9 - High renewable energy target 0.4753 0.0167 0.0374 0.1157 0.3664 1.8379Cellulosic Ethanol (agricultural residues w/CCS) #10 - Energy target, no food-based or intermediate 0.736 0.0183 0.0413 0.136 0.448 3.2829Cellulosic Ethanol (agricultural residues) #1 - REDII revision proposal 43.3939 1.3032 5.2266 29.3668 80.4546 115.0745Cellulosic Ethanol (agricultural residues) #2 - Lower GHG target 50.3682 1.6179 6.6747 38.2533 94.6115 120.4955Cellulosic Ethanol (agricultural residues) #3 - No food-based biofuels 47.4707 1.5772 6.3688 35.0809 89.3477 118.6614Cellulosic Ethanol (agricultural residues) #4 - No food-based or intermediate crops 41.8501 1.4129 5.9198 30.2318 74.017 111.9634Cellulosic Ethanol (agricultural residues) #5 - No intermediate crops 31.7554 0.7429 3.1584 17.7074 55.5303 100.6217Cellulosic Ethanol (agricultural residues) #6 - Higher subtargets 47.3241 1.5485 6.0657 34.0953 89.311 118.112Cellulosic Ethanol (agricultural residues) #7 - Low EV growth 39.3678 1.0355 4.0265 23.76 71.1814 113.6199Cellulosic Ethanol (agricultural residues) #8 - Renewable energy target 49.6445 1.3513 5.8372 33.3513 94.0232 126.7188Cellulosic Ethanol (agricultural residues) #9 - High renewable energy target 49.7988 1.3527 5.4077 32.1065 95.5704 127.9321Cellulosic Ethanol (agricultural residues) #10 - Energy target, no food-based or intermediate 59.3418 1.9371 9.1985 51.9433 111.1868 128.0854Cellulosic Ethanol (energy crops w/CCS) #1 - REDII revision proposal 6.6845 0.1459 0.3726 1.7743 7.6714 29.2684Cellulosic Ethanol (energy crops w/CCS) #2 - Lower GHG target 3.7163 0.0914 0.2347 0.9876 3.9792 16.1189Cellulosic Ethanol (energy crops w/CCS) #3 - No food-based biofuels 5.8064 0.1294 0.3252 1.4829 6.3907 25.8286Cellulosic Ethanol (energy crops w/CCS) #4 - No food-based or intermediate crops 12.0794 0.2473 0.7029 3.4924 15.7816 53.4316Cellulosic Ethanol (energy crops w/CCS) #5 - No intermediate crops 17.2247 0.3318 0.9578 5.1006 23.9245 74.3633Cellulosic Ethanol (energy crops w/CCS) #6 - Higher subtargets 6.1306 0.1324 0.338 1.5786 7.0674 27.2986Cellulosic Ethanol (energy crops w/CCS) #7 - Low EV growth 9.1058 0.1916 0.4906 2.3561 10.8687 40.7948

Appendix E. Detailed Fuel Quantity Results 48
Cellulosic Ethanol (energy crops w/CCS) #8 - Renewable energy target 0.5433 0.0192 0.0401 0.125 0.3909 2.0475Cellulosic Ethanol (energy crops w/CCS) #9 - High renewable energy target 0.4744 0.018 0.0388 0.123 0.3793 1.7641Cellulosic Ethanol (energy crops w/CCS) #10 - Energy target, no food-based or intermediate 0.8045 0.0196 0.0446 0.1472 0.4781 3.4561Cellulosic Ethanol (energy crops) #1 - REDII revision proposal 42.6171 1.2534 4.907 27.6846 78.8966 114.7596Cellulosic Ethanol (energy crops) #2 - Lower GHG target 49.3158 1.5923 6.5028 36.8914 93.1049 120.3748Cellulosic Ethanol (energy crops) #3 - No food-based biofuels 48.3166 1.6546 6.5764 37.9831 89.4415 118.103Cellulosic Ethanol (energy crops) #4 - No food-based or intermediate crops 41.8583 1.3829 5.8741 30.8699 75.5261 110.6503Cellulosic Ethanol (energy crops) #5 - No intermediate crops 30.8323 0.709 2.8999 16.3223 54.411 97.4509Cellulosic Ethanol (energy crops) #6 - Higher subtargets 47.4803 1.565 6.0353 35.1367 89.9017 117.6169Cellulosic Ethanol (energy crops) #7 - Low EV growth 39.5213 1.0501 4.0476 23.4185 71.8754 113.7036Cellulosic Ethanol (energy crops) #8 - Renewable energy target 49.952 1.343 5.9472 35.1768 94.9399 126.8636Cellulosic Ethanol (energy crops) #9 - High renewable energy target 48.9671 1.2582 5.103 32.0193 93.3755 127.6663Cellulosic Ethanol (energy crops) #10 - Energy target, no food-based or intermediate 58.274 1.8432 8.9361 50.2257 109.9931 128.0055CNG (biowaste) #1 - REDII revision proposal 0.706 0.0482 0.0937 0.282 0.8383 2.8262CNG (biowaste) #2 - Lower GHG target 0.686 0.0463 0.09 0.2746 0.79 2.7564CNG (biowaste) #3 - No food-based biofuels 0.692 0.0471 0.0931 0.2888 0.8284 2.7379CNG (biowaste) #4 - No food-based or intermediate crops 0.6942 0.0465 0.0941 0.2921 0.7975 2.7275CNG (biowaste) #5 - No intermediate crops 0.7663 0.0511 0.101 0.3157 0.9076 2.9589CNG (biowaste) #6 - Higher subtargets 1.0819 0.0595 0.1228 0.3859 1.1747 4.6199CNG (biowaste) #7 - Low EV growth 0.7264 0.0492 0.0988 0.2995 0.8654 2.8888CNG (biowaste) #8 - Renewable energy target 0.7325 0.0482 0.0967 0.3039 0.8517 2.9851CNG (biowaste) #9 - High renewable energy target 0.7765 0.0529 0.1085 0.3374 0.9709 2.996CNG (biowaste) #10 - Energy target, no food-based or intermediate 1.3861 0.0695 0.1419 0.4698 1.5327 6.1512CNG (fossil sources) #1 - REDII revision proposal 111.0269 49.8092 88.8595 122.0902 138.6659 159.984CNG (fossil sources) #2 - Lower GHG target 135.6742 101.6382 123.9195 139.4305 150.0749 173.0864CNG (fossil sources) #3 - No food-based biofuels 147.4836 130.2311 139.8354 147.0637 155.8358 178.1036CNG (fossil sources) #4 - No food-based or intermediate crops 143.749 124.0682 136.5476 143.973 152.592 172.8015CNG (fossil sources) #5 - No intermediate crops 121.7669 86.5524 109.649 126.7134 137.4392 158.364CNG (fossil sources) #6 - Higher subtargets 109.0374 48.098 86.6971 120.4136 138.0874 155.7133CNG (fossil sources) #7 - Low EV growth 99.8012 28.0698 71.4707 111.9781 133.2629 153.8808CNG (fossil sources) #8 - Renewable energy target 117.3384 21.0466 81.9688 135.3152 156.9795 184.8021CNG (fossil sources) #9 - High renewable energy target 112.7118 4.3363 63.0222 133.6847 161.096 191.2244CNG (fossil sources) #10 - Energy target, no food-based or intermediate 158.7571 133.1624 149.5151 160.5957 173.1329 197.8794CNG (manure) #1 - REDII revision proposal 2.7484 0.1348 0.2864 1.0494 3.6936 10.8387CNG (manure) #2 - Lower GHG target 1.86 0.1013 0.2095 0.7204 2.437 7.3353CNG (manure) #3 - No food-based biofuels 2.4022 0.1189 0.2526 0.8878 3.0731 9.8975CNG (manure) #4 - No food-based or intermediate crops 3.8678 0.1642 0.3606 1.3611 4.8901 15.7144CNG (manure) #5 - No intermediate crops 5.6036 0.2111 0.4618 1.872 7.3236 22.5889CNG (manure) #6 - Higher subtargets 3.3516 0.1484 0.3188 1.2006 4.3881 14.0235CNG (manure) #7 - Low EV growth 3.4656 0.1549 0.3355 1.2655 4.6021 14.1073CNG (manure) #8 - Renewable energy target 0.7274 0.0489 0.0966 0.3067 0.8617 2.8746CNG (manure) #9 - High renewable energy target 0.7748 0.0541 0.108 0.3246 0.9335 3.0206CNG (manure) #10 - Energy target, no food-based or intermediate 1.3589 0.07 0.1419 0.4745 1.5169 5.9246CNG (silage maize) #1 - REDII revision proposal 40.619 2.5095 5.808 21.6089 62.6481 135.7987CNG (silage maize) #2 - Lower GHG target 15.002 0.979 2.0947 6.7757 20.759 56.9027CNG (silage maize) #3 - No food-based biofuels 0 0 0 0 0 0CNG (silage maize) #4 - No food-based or intermediate crops 0 0 0 0 0 0CNG (silage maize) #5 - No intermediate crops 38.9436 2.3857 5.609 19.8699 56.8256 137.5975CNG (silage maize) #6 - Higher subtargets 34.2646 2.0635 4.7895 17.6222 52.7521 116.3108CNG (silage maize) #7 - Low EV growth 57.2242 3.2531 8.1265 31.562 92.2904 180.4327CNG (silage maize) #8 - Renewable energy target 28.4067 2.0218 4.6345 16.528 46.8443 84.8413CNG (silage maize) #9 - High renewable energy target 34.3238 2.466 6.1403 21.4209 60.4049 93.7522CNG (silage maize) #10 - Energy target, no food-based or intermediate 0 0 0 0 0 0Diesel (fossil sources) #1 - REDII revision proposal 6139.6869 6012.0244 6066.5444 6136.3384 6206.9718 6315.1442Diesel (fossil sources) #2 - Lower GHG target 6371.3752 6268.2848 6312.4622 6362.9305 6426.9315 6523.215Diesel (fossil sources) #3 - No food-based biofuels 6555.1684 6444.3306 6489.3259 6546.352 6617.2481 6718.925Diesel (fossil sources) #4 - No food-based or intermediate crops 6777.917 6684.6695 6731.2694 6770.8682 6831.0366 6909.291Diesel (fossil sources) #5 - No intermediate crops 6251.0284 6151.8783 6197.5436 6243.9847 6306.0406 6395.3345Diesel (fossil sources) #6 - Higher subtargets 6174.7659 6052.3304 6102.539 6166.5083 6238.7089 6353.9728Diesel (fossil sources) #7 - Low EV growth 6001.9664 5860.0014 5918.603 5995.7413 6078.1835 6198.6645Diesel (fossil sources) #8 - Renewable energy target 6134.1864 6004.6524 6054.9318 6122.0695 6206.1431 6334.3929Diesel (fossil sources) #9 - High renewable energy target 5857.0653 5687.6239 5745.4567 5838.4199 5945.6153 6132.7447Diesel (fossil sources) #10 - Energy target, no food-based or intermediate 6752.0926 6596.6437 6647.0747 6730.8612 6841.2719 7026.0841Diesel e-Fuels #1 - REDII revision proposal 82.7626 6.3694 37.2809 102.1885 127.1915 128.0671Diesel e-Fuels #2 - Lower GHG target 82.308 6.4397 37.4454 99.0454 127.8001 128.5342Diesel e-Fuels #3 - No food-based biofuels 77.8298 5.2495 29.3361 90.8508 127.3634 128.3827Diesel e-Fuels #4 - No food-based or intermediate crops 78.8534 5.8844 31.0323 93.3028 127.2604 128.0165Diesel e-Fuels #5 - No intermediate crops 81.6613 6.5009 34.9519 99.9602 126.4343 127.2141Diesel e-Fuels #6 - Higher subtargets 66.6904 5.7532 33.2518 90.8654 94.2771 97.7864Diesel e-Fuels #7 - Low EV growth 82.1277 6.3296 34.5199 101.5195 126.849 127.6151Diesel e-Fuels #8 - Renewable energy target 80.5653 4.6964 34.8278 94.5901 128.6393 129.3152Diesel e-Fuels #9 - High renewable energy target 84.3879 5.7296 35.8298 106.1358 128.6413 129.2203Diesel e-Fuels #10 - Energy target, no food-based or intermediate 93.9065 15.8285 66.6729 115.7698 128.3713 129.1368Electricity #1 - REDII revision proposal 161.6905 129.267 142.9011 162.4126 179.8828 198.4107Electricity #2 - Lower GHG target 142.0044 120.3816 129.2606 141.8132 154.0969 167.9396Electricity #3 - No food-based biofuels 152.9878 124.9115 135.3771 151.8708 168.7059 190.5014Electricity #4 - No food-based or intermediate crops 171.7501 147.4895 161.288 175.3207 184.6355 191.867

Appendix E. Detailed Fuel Quantity Results 49
Electricity #5 - No intermediate crops 198.5555 163.5031 183.0925 203.5785 216.5153 227.4726Electricity #6 - Higher subtargets 156.3454 127.3734 139.8272 156.9995 172.863 188.5061Electricity #7 - Low EV growth 89.695 66.7183 75.1285 88.1547 102.2662 121.6563Electricity #8 - Renewable energy target 106.7182 103.5664 104.6451 106.3753 108.3187 111.4462Electricity #9 - High renewable energy target 107.5738 103.9979 105.3052 107.3281 109.4816 112.5152Electricity #10 - Energy target, no food-based or intermediate 106.9832 103.704 104.7904 106.6662 108.7639 111.7844Ethanol (corn intermediate crop) #1 - REDII revision proposal 6.2582 0 0.0007 0.8727 6.4509 32.6477Ethanol (corn intermediate crop) #2 - Lower GHG target 2.1665 0 0 0.092 2.1035 11.2479Ethanol (corn intermediate crop) #3 - No food-based biofuels 12.4201 0 0.0001 0.7524 14.631 64.2174Ethanol (corn intermediate crop) #4 - No food-based or intermediate crops 0 0 0 0 0 0Ethanol (corn intermediate crop) #5 - No intermediate crops 0 0 0 0 0 0Ethanol (corn intermediate crop) #6 - Higher subtargets 3.2981 0 0 0.0045 2.1745 18.8839Ethanol (corn intermediate crop) #7 - Low EV growth 11.0999 0 0.0158 2.5173 13.6384 54.1658Ethanol (corn intermediate crop) #8 - Renewable energy target 11.5756 0 0.0114 2.2818 13.2764 56.694Ethanol (corn intermediate crop) #9 - High renewable energy target 18.3366 0 0.0936 4.419 23.7482 88.5534Ethanol (corn intermediate crop) #10 - Energy target, no food-based or intermediate 0 0 0 0 0 0Ethanol (corn w/CCS) #1 - REDII revision proposal 0.8661 0 0 0.0701 0.6857 4.6992Ethanol (corn w/CCS) #2 - Lower GHG target 0.8542 0 0 0.0209 0.5513 4.6807Ethanol (corn w/CCS) #3 - No food-based biofuels 0 0 0 0 0 0Ethanol (corn w/CCS) #4 - No food-based or intermediate crops 0 0 0 0 0 0Ethanol (corn w/CCS) #5 - No intermediate crops 0.4948 0 0 0.0015 0.2397 2.7686Ethanol (corn w/CCS) #6 - Higher subtargets 0.6577 0 0 0.0002 0.3249 3.8293Ethanol (corn w/CCS) #7 - Low EV growth 0.655 0 0 0.0454 0.4877 3.4083Ethanol (corn w/CCS) #8 - Renewable energy target 0.7105 0 0 0.0567 0.5157 3.5557Ethanol (corn w/CCS) #9 - High renewable energy target 0.4932 0 0 0.0132 0.2825 2.7149Ethanol (corn w/CCS) #10 - Energy target, no food-based or intermediate 0 0 0 0 0 0Ethanol (corn) #1 - REDII revision proposal 3.7066 0 0 0.4565 4.1359 18.7723Ethanol (corn) #2 - Lower GHG target 4.1871 0 0 0.1831 4.1246 23.0023Ethanol (corn) #3 - No food-based biofuels 0 0 0 0 0 0Ethanol (corn) #4 - No food-based or intermediate crops 0 0 0 0 0 0Ethanol (corn) #5 - No intermediate crops 1.5568 0 0 0.0047 0.9746 9.1458Ethanol (corn) #6 - Higher subtargets 2.8584 0 0 0.002 2.1374 17.5387Ethanol (corn) #7 - Low EV growth 2.6007 0 0.0001 0.2428 2.6211 12.9569Ethanol (corn) #8 - Renewable energy target 5.7331 0 0.0007 0.8533 6.2504 29.0331Ethanol (corn) #9 - High renewable energy target 4.0227 0 0.0002 0.2502 3.6519 21.3892Ethanol (corn) #10 - Energy target, no food-based or intermediate 0 0 0 0 0 0Ethanol (flue gas) #1 - REDII revision proposal 1.3011 0 0 0.0312 0.4315 7.1264Ethanol (flue gas) #2 - Lower GHG target 0.135 0 0 0.0014 0.046 0.7246Ethanol (flue gas) #3 - No food-based biofuels 2.5444 0 0 0.0211 0.7063 17.9098Ethanol (flue gas) #4 - No food-based or intermediate crops 11.039 0 0.0063 2.1031 22.9697 36.2322Ethanol (flue gas) #5 - No intermediate crops 12.3659 0 0.0693 4.4068 27.1125 36.1466Ethanol (flue gas) #6 - Higher subtargets 0.5793 0 0 0.0001 0.0741 2.5371Ethanol (flue gas) #7 - Low EV growth 3.2192 0 0.0008 0.1408 1.6595 22.7751Ethanol (flue gas) #8 - Renewable energy target 0.3791 0 0 0.0088 0.0853 1.394Ethanol (flue gas) #9 - High renewable energy target 0.8771 0 0.0001 0.0171 0.187 3.9204Ethanol (flue gas) #10 - Energy target, no food-based or intermediate 6.3438 0 0 0.0145 2.963 36.2223Ethanol (sugar) #1 - REDII revision proposal 2.9936 0 0.0001 0.3956 3.0649 15.2348Ethanol (sugar) #2 - Lower GHG target 2.6687 0 0 0.1361 2.542 14.8539Ethanol (sugar) #3 - No food-based biofuels 0 0 0 0 0 0Ethanol (sugar) #4 - No food-based or intermediate crops 0 0 0 0 0 0Ethanol (sugar) #5 - No intermediate crops 1.7042 0 0 0.0149 1.1892 9.5726Ethanol (sugar) #6 - Higher subtargets 2.1986 0 0 0.0031 1.4811 13.1161Ethanol (sugar) #7 - Low EV growth 2.3761 0 0.0004 0.2768 2.228 12.1582Ethanol (sugar) #8 - Renewable energy target 2.2828 0 0.0003 0.3259 2.2259 11.5704Ethanol (sugar) #9 - High renewable energy target 1.7028 0 0.0001 0.0932 1.3216 9.3592Ethanol (sugar) #10 - Energy target, no food-based or intermediate 0 0 0 0 0 0Ethanol (sugarbeet w/CCS) #1 - REDII revision proposal 1.8793 0 0.0003 0.1928 1.4748 10.1223Ethanol (sugarbeet w/CCS) #2 - Lower GHG target 1.0361 0 0 0.0411 0.6984 5.615Ethanol (sugarbeet w/CCS) #3 - No food-based biofuels 0 0 0 0 0 0Ethanol (sugarbeet w/CCS) #4 - No food-based or intermediate crops 0 0 0 0 0 0Ethanol (sugarbeet w/CCS) #5 - No intermediate crops 2.4097 0 0 0.0448 1.1667 14.1783Ethanol (sugarbeet w/CCS) #6 - Higher subtargets 1.2384 0 0 0.0023 0.5538 7.515Ethanol (sugarbeet w/CCS) #7 - Low EV growth 2.0203 0 0.0014 0.2075 1.4853 10.9089Ethanol (sugarbeet w/CCS) #8 - Renewable energy target 0.2154 0 0 0.0201 0.1784 1.1126Ethanol (sugarbeet w/CCS) #9 - High renewable energy target 0.1572 0 0 0.0049 0.0952 0.8475Ethanol (sugarbeet w/CCS) #10 - Energy target, no food-based or intermediate 0 0 0 0 0 0Ethanol (sugarbeet) #1 - REDII revision proposal 1.5567 0 0 0.194 1.5145 7.7043Ethanol (sugarbeet) #2 - Lower GHG target 1.5763 0 0 0.0704 1.4152 8.3649Ethanol (sugarbeet) #3 - No food-based biofuels 0 0 0 0 0 0Ethanol (sugarbeet) #4 - No food-based or intermediate crops 0 0 0 0 0 0Ethanol (sugarbeet) #5 - No intermediate crops 0.7721 0 0 0.0036 0.4594 4.3311Ethanol (sugarbeet) #6 - Higher subtargets 1.1801 0 0 0.001 0.7542 6.6674Ethanol (sugarbeet) #7 - Low EV growth 1.1532 0 0.0001 0.1172 1.0034 5.8524Ethanol (sugarbeet) #8 - Renewable energy target 1.7703 0 0.0002 0.2321 1.7505 8.5855Ethanol (sugarbeet) #9 - High renewable energy target 1.2213 0 0 0.0681 0.9414 6.0093Ethanol (sugarbeet) #10 - Energy target, no food-based or intermediate 0 0 0 0 0 0Ethanol (wheat w/CCS) #1 - REDII revision proposal 0.7438 0 0 0.0554 0.5842 3.7596

Appendix E. Detailed Fuel Quantity Results 50
Ethanol (wheat w/CCS) #2 - Lower GHG target 0.7688 0 0 0.0176 0.5267 4.3612Ethanol (wheat w/CCS) #3 - No food-based biofuels 0 0 0 0 0 0Ethanol (wheat w/CCS) #4 - No food-based or intermediate crops 0 0 0 0 0 0Ethanol (wheat w/CCS) #5 - No intermediate crops 0.3863 0 0 0.0008 0.1642 2.0312Ethanol (wheat w/CCS) #6 - Higher subtargets 0.5692 0 0 0.0002 0.2688 3.2672Ethanol (wheat w/CCS) #7 - Low EV growth 0.5404 0 0 0.0329 0.3938 2.7145Ethanol (wheat w/CCS) #8 - Renewable energy target 0.8006 0 0 0.0633 0.6182 3.9433Ethanol (wheat w/CCS) #9 - High renewable energy target 0.5292 0 0 0.0145 0.3155 2.6215Ethanol (wheat w/CCS) #10 - Energy target, no food-based or intermediate 0 0 0 0 0 0Ethanol (wheat) #1 - REDII revision proposal 3.9882 0 0.0001 0.4865 4.3042 19.9962Ethanol (wheat) #2 - Lower GHG target 4.4477 0 0 0.1981 4.4291 23.961Ethanol (wheat) #3 - No food-based biofuels 0 0 0 0 0 0Ethanol (wheat) #4 - No food-based or intermediate crops 0 0 0 0 0 0Ethanol (wheat) #5 - No intermediate crops 1.7356 0 0 0.005 1.027 9.9556Ethanol (wheat) #6 - Higher subtargets 3.0868 0 0 0.0021 2.1459 18.2218Ethanol (wheat) #7 - Low EV growth 2.7679 0 0.0001 0.2571 2.7025 14.3561Ethanol (wheat) #8 - Renewable energy target 5.9873 0 0.0008 0.977 6.7592 29.36Ethanol (wheat) #9 - High renewable energy target 4.3296 0 0.0002 0.2614 3.7817 23.7276Ethanol (wheat) #10 - Energy target, no food-based or intermediate 0 0 0 0 0 0FAME (palm) #1 - REDII revision proposal 0 0 0 0 0 0FAME (palm) #2 - Lower GHG target 0 0 0 0 0 0FAME (palm) #3 - No food-based biofuels 0 0 0 0 0 0FAME (palm) #4 - No food-based or intermediate crops 0 0 0 0 0 0FAME (palm) #5 - No intermediate crops 0 0 0 0 0 0FAME (palm) #6 - Higher subtargets 0 0 0 0 0 0FAME (palm) #7 - Low EV growth 0 0 0 0 0 0FAME (palm) #8 - Renewable energy target 0 0 0 0 0 0FAME (palm) #9 - High renewable energy target 0 0 0 0 0 0FAME (palm) #10 - Energy target, no food-based or intermediate 0 0 0 0 0 0FAME (rapeseed) #1 - REDII revision proposal 200.0936 68.944 113.627 196.8335 278.5885 368.0959FAME (rapeseed) #2 - Lower GHG target 195.3554 63.3436 103.137 189.2894 277.9872 364.272FAME (rapeseed) #3 - No food-based biofuels 0 0 0 0 0 0FAME (rapeseed) #4 - No food-based or intermediate crops 0 0 0 0 0 0FAME (rapeseed) #5 - No intermediate crops 245.7224 84.564 144.7975 253.5526 342.6647 418.9545FAME (rapeseed) #6 - Higher subtargets 207.1873 69.5727 116.4476 206.1804 290.5439 375.1526FAME (rapeseed) #7 - Low EV growth 162.0906 52.2484 84.3872 144.2927 227.869 340.4345FAME (rapeseed) #8 - Renewable energy target 195.9102 66.278 112.9097 192.5206 270.9869 365.0134FAME (rapeseed) #9 - High renewable energy target 147.5566 33.3044 63.1373 124.6384 219.6333 343.8952FAME (rapeseed) #10 - Energy target, no food-based or intermediate 0 0 0 0 0 0FAME (soy intermediate crop) #1 - REDII revision proposal 117.3278 32.5994 57.7715 104.4759 163.6241 256.401FAME (soy intermediate crop) #2 - Lower GHG target 66.2724 12.7821 21.8478 46.0026 93.3631 192.9669FAME (soy intermediate crop) #3 - No food-based biofuels 194.8028 67.232 118.1469 196.9349 267.8791 339.6939FAME (soy intermediate crop) #4 - No food-based or intermediate crops 0 0 0 0 0 0FAME (soy intermediate crop) #5 - No intermediate crops 0 0 0 0 0 0FAME (soy intermediate crop) #6 - Higher subtargets 98.3917 25.1013 44.0423 82.1004 136.9058 233.2036FAME (soy intermediate crop) #7 - Low EV growth 190.2836 55.9673 104.8941 187.8212 269.7027 356.9846FAME (soy intermediate crop) #8 - Renewable energy target 139.1732 41.2866 76.5213 137.253 192.2136 268.9885FAME (soy intermediate crop) #9 - High renewable energy target 222.9909 60.5928 116.4617 213.7118 328.3391 433.8087FAME (soy intermediate crop) #10 - Energy target, no food-based or intermediate 0 0 0 0 0 0FAME (soy) #1 - REDII revision proposal 123.0282 28.5822 49.7722 101.1811 178.618 295.3628FAME (soy) #2 - Lower GHG target 119.0024 28.0909 47.4801 97.9361 173.9739 285.2927FAME (soy) #3 - No food-based biofuels 0 0 0 0 0 0FAME (soy) #4 - No food-based or intermediate crops 0 0 0 0 0 0FAME (soy) #5 - No intermediate crops 153.7935 34.3635 62.9493 131.3622 229.891 355.2115FAME (soy) #6 - Higher subtargets 128.0734 28.9722 51.307 106.8978 188.7211 306.2545FAME (soy) #7 - Low EV growth 101.6023 22.1714 39.0674 79.0793 144.1509 263.1524FAME (soy) #8 - Renewable energy target 118.6005 27.3363 47.3536 96.5139 171.2452 285.5095FAME (soy) #9 - High renewable energy target 91.2785 15.4158 30.2774 64.4347 130.0019 261.3282FAME (soy) #10 - Energy target, no food-based or intermediate 0 0 0 0 0 0FAME (tallow) #1 - REDII revision proposal 9.4035 0.07 0.4232 2.0722 8.9808 46.6275FAME (tallow) #2 - Lower GHG target 25.4599 1.678 4.0055 13.0376 36.3922 91.4953FAME (tallow) #3 - No food-based biofuels 31.2445 2.0827 4.6671 16.0783 46.3015 110.1717FAME (tallow) #4 - No food-based or intermediate crops 26.3179 1.4659 3.5303 12.213 37.3303 100.8845FAME (tallow) #5 - No intermediate crops 12.9169 0.3717 1.0972 4.0435 14.5025 59.2516FAME (tallow) #6 - Higher subtargets 12.1901 0.1657 0.7782 3.3604 13.4527 58.2246FAME (tallow) #7 - Low EV growth 5.3854 0.0057 0.0642 0.5803 3.557 28.4258FAME (tallow) #8 - Renewable energy target 9.7184 0.0363 0.2771 1.7663 9.2167 49.4168FAME (tallow) #9 - High renewable energy target 5.1049 0.0005 0.0163 0.2903 2.7327 28.7649FAME (tallow) #10 - Energy target, no food-based or intermediate 30.6354 1.2645 3.8489 14.3763 47.0608 108.7594FAME (used cooking oil) #1 - REDII revision proposal 18.3231 0.2394 1.176 5.9999 24.2272 79.7834FAME (used cooking oil) #2 - Lower GHG target 39.6232 3.2541 8.4348 26.9063 62.8743 116.7651FAME (used cooking oil) #3 - No food-based biofuels 53.9191 4.7938 12.5353 42.1444 88.6971 140.0689FAME (used cooking oil) #4 - No food-based or intermediate crops 57.787 5.2947 14.2395 46.7 93.2109 147.5069FAME (used cooking oil) #5 - No intermediate crops 37.1333 1.8478 6.4059 22.7909 57.9898 118.6787FAME (used cooking oil) #6 - Higher subtargets 22.8482 0.4671 2.0304 8.9265 31.8401 93.7193FAME (used cooking oil) #7 - Low EV growth 12.057 0.032 0.2624 2.0867 12.0219 62.844FAME (used cooking oil) #8 - Renewable energy target 9.094 0.0333 0.2651 1.7515 8.6282 46.8114

Appendix E. Detailed Fuel Quantity Results 51
FAME (used cooking oil) #9 - High renewable energy target 5.187 0.0005 0.016 0.2865 2.9698 30.6834FAME (used cooking oil) #10 - Energy target, no food-based or intermediate 30.5092 1.177 3.5766 14.2608 46.228 109.8295Finished CNG #1 - REDII revision proposal 155.1004 137.0721 143.7237 151.8515 163.6336 192.0693Finished CNG #2 - Lower GHG target 153.2223 138.093 143.9464 151.1022 160.4501 183.6323Finished CNG #3 - No food-based biofuels 150.5778 136.631 142.246 148.8161 157.599 179.7048Finished CNG #4 - No food-based or intermediate crops 148.311 134.9764 140.5523 146.6037 154.8 175.0798Finished CNG #5 - No intermediate crops 167.0804 135.1254 143.0456 154.9643 177.5803 246.0031Finished CNG #6 - Higher subtargets 147.7356 129.1676 141.1672 148.8485 157.7905 179.2002Finished CNG #7 - Low EV growth 161.2175 136.5407 143.5664 154.222 172.1456 217.484Finished CNG #8 - Renewable energy target 147.205 102.0322 130.6232 151.9239 165.0995 192.5921Finished CNG #9 - High renewable energy target 148.587 97.6238 125.5391 153.8528 170.6842 198.7597Finished CNG #10 - Energy target, no food-based or intermediate 161.5021 139.3273 151.8643 162.2312 174.1915 199.1095Finished Diesel Fuel #1 - REDII revision proposal 7121.7473 7045.0397 7092.0909 7131.24 7164.1385 7199.2318Finished Diesel Fuel #2 - Lower GHG target 7145.9274 7071.2782 7118.2431 7156.481 7186.9356 7218.4357Finished Diesel Fuel #3 - No food-based biofuels 7137.199 7065.0485 7108.8547 7146.7502 7177.5163 7210.6969Finished Diesel Fuel #4 - No food-based or intermediate crops 7116.6236 7049.7721 7093.7141 7124.4752 7150.147 7186.4922Finished Diesel Fuel #5 - No intermediate crops 7075.1542 6989.4634 7041.6896 7086.422 7120.8473 7162.3227Finished Diesel Fuel #6 - Higher subtargets 7142.7321 7078.751 7113.5223 7146.4132 7174.4735 7217.0376Finished Diesel Fuel #7 - Low EV growth 7142.3192 7058.8126 7110.6544 7153.354 7186.0627 7221.8303Finished Diesel Fuel #8 - Renewable energy target 7167.5196 7078.543 7130.2777 7171.4337 7212.236 7281.9627Finished Diesel Fuel #9 - High renewable energy target 7143.2347 7053.924 7099.8366 7146.8729 7190.5873 7255.7768Finished Diesel Fuel #10 - Energy target, no food-based or intermediate 7163.8354 7083.4204 7130.2076 7166.5189 7200.6112 7260.733Finished Gasoline #1 - REDII revision proposal 1767.6812 1701.7765 1735.7388 1771.3599 1803.4774 1835.0982Finished Gasoline #2 - Lower GHG target 1795.7434 1739.9099 1769.2057 1798.9735 1822.99 1857.4088Finished Gasoline #3 - No food-based biofuels 1783.6046 1723.5381 1755.3188 1787.907 1815.6227 1844.584Finished Gasoline #4 - No food-based or intermediate crops 1767.865 1714.6468 1742.2134 1769.2786 1795.0259 1826.7915Finished Gasoline #5 - No intermediate crops 1719.9674 1660.7489 1686.2593 1718.3979 1753.5589 1795.4849Finished Gasoline #6 - Higher subtargets 1768.3173 1707.9253 1739.3424 1772.1797 1802.2904 1828.7877Finished Gasoline #7 - Low EV growth 1786.33 1725.0261 1757.0569 1790.8541 1818.342 1849.195Finished Gasoline #8 - Renewable energy target 1868.0741 1827.901 1845.6372 1861.2168 1884.0377 1943.6223Finished Gasoline #9 - High renewable energy target 1886.7264 1848.5905 1860.1198 1877.287 1904.8365 1965.5009Finished Gasoline #10 - Energy target, no food-based or intermediate 1851.0494 1810.8647 1832.0797 1849.2956 1866.2635 1915.0998Finished Hydrogen #1 - REDII revision proposal 0.0015 0.001 0.0012 0.0014 0.0017 0.0024Finished Hydrogen #2 - Lower GHG target 0.0011 0.0008 0.0009 0.001 0.0012 0.0015Finished Hydrogen #3 - No food-based biofuels 0.0013 0.0009 0.001 0.0012 0.0015 0.0022Finished Hydrogen #4 - No food-based or intermediate crops 0.0033 0.0011 0.0013 0.0019 0.0032 0.0092Finished Hydrogen #5 - No intermediate crops 0.0055 0.0014 0.0018 0.0027 0.0049 0.0156Finished Hydrogen #6 - Higher subtargets 0.0014 0.0009 0.0011 0.0013 0.0016 0.0021Finished Hydrogen #7 - Low EV growth 0.0019 0.0011 0.0014 0.0017 0.0022 0.0034Finished Hydrogen #8 - Renewable energy target 0.0006 0.0005 0.0006 0.0006 0.0006 0.0007Finished Hydrogen #9 - High renewable energy target 0.0006 0.0006 0.0006 0.0006 0.0006 0.0007Finished Hydrogen #10 - Energy target, no food-based or intermediate 0.0006 0.0005 0.0006 0.0006 0.0006 0.0007Finished Jet Fuel #1 - REDII revision proposal 1592.6557 1339.6942 1497.8049 1650.7734 1721.9253 1781.8971Finished Jet Fuel #2 - Lower GHG target 1620.8518 1357.2046 1521.9284 1686.0178 1757.0101 1818.3697Finished Jet Fuel #3 - No food-based biofuels 1612.7035 1353.5038 1513.5101 1671.5341 1751.6693 1813.1459Finished Jet Fuel #4 - No food-based or intermediate crops 1619.4545 1370.3811 1530.0254 1671.2998 1748.5954 1812.8501Finished Jet Fuel #5 - No intermediate crops 1559.6158 1324.9085 1476.9297 1603.9198 1679.6026 1750.8065Finished Jet Fuel #6 - Higher subtargets 1473.6782 1253.3849 1375.8314 1491.5278 1598.6281 1697.0874Finished Jet Fuel #7 - Low EV growth 1582.551 1338.065 1492.7047 1638.4157 1708.6103 1770.0993Finished Jet Fuel #8 - Renewable energy target 1629.406 1342.2125 1506.42 1699.1317 1790.2942 1857.8807Finished Jet Fuel #9 - High renewable energy target 1616.4975 1323.8679 1499.5611 1690.5665 1776.4421 1843.1412Finished Jet Fuel #10 - Energy target, no food-based or intermediate 1610.7239 1356.0707 1495.0973 1647.9284 1775.953 1853.7528Gasoline (BOB) #1 - REDII revision proposal 1644.5858 1583.2704 1614.8677 1648.0083 1677.8892 1707.308Gasoline (BOB) #2 - Lower GHG target 1670.6963 1618.7483 1646.0041 1673.699 1696.0431 1728.065Gasoline (BOB) #3 - No food-based biofuels 1660.6304 1603.9071 1633.5435 1664.2821 1690.2235 1721.1692Gasoline (BOB) #4 - No food-based or intermediate crops 1648.8165 1596.8887 1623.5618 1649.5187 1674.4198 1710.9743Gasoline (BOB) #5 - No intermediate crops 1600.1946 1545.0999 1568.8338 1598.7344 1631.4469 1670.4533Gasoline (BOB) #6 - Higher subtargets 1645.1776 1588.9911 1618.2203 1648.771 1676.7849 1701.437Gasoline (BOB) #7 - Low EV growth 1661.9359 1604.901 1634.7013 1666.145 1691.7186 1720.4232Gasoline (BOB) #8 - Renewable energy target 1737.9877 1700.612 1717.1131 1731.6078 1752.8396 1808.2749Gasoline (BOB) #9 - High renewable energy target 1755.341 1719.8608 1730.5873 1746.5589 1772.19 1828.63Gasoline (BOB) #10 - Energy target, no food-based or intermediate 1725.5494 1684.817 1704.7611 1720.8959 1737.9307 1805.2226Green Hydrogen #1 - REDII revision proposal 0.0015 0.001 0.0012 0.0014 0.0017 0.0024Green Hydrogen #2 - Lower GHG target 0.0011 0.0008 0.0009 0.001 0.0012 0.0015Green Hydrogen #3 - No food-based biofuels 0.0013 0.0009 0.001 0.0012 0.0015 0.0022Green Hydrogen #4 - No food-based or intermediate crops 0.0033 0.0011 0.0013 0.0019 0.0032 0.0092Green Hydrogen #5 - No intermediate crops 0.0055 0.0014 0.0018 0.0027 0.0049 0.0156Green Hydrogen #6 - Higher subtargets 0.0014 0.0009 0.0011 0.0013 0.0016 0.0021Green Hydrogen #7 - Low EV growth 0.0019 0.0011 0.0014 0.0017 0.0022 0.0034Green Hydrogen #8 - Renewable energy target 0.0006 0.0005 0.0006 0.0006 0.0006 0.0007Green Hydrogen #9 - High renewable energy target 0.0006 0.0006 0.0006 0.0006 0.0006 0.0007Green Hydrogen #10 - Energy target, no food-based or intermediate 0.0006 0.0005 0.0006 0.0006 0.0006 0.0007HVO (crude tall oil) #1 - REDII revision proposal 44.476 44.476 44.476 44.476 44.476 44.476HVO (crude tall oil) #2 - Lower GHG target 44.476 44.476 44.476 44.476 44.476 44.476HVO (crude tall oil) #3 - No food-based biofuels 44.476 44.476 44.476 44.476 44.476 44.476HVO (crude tall oil) #4 - No food-based or intermediate crops 44.476 44.476 44.476 44.476 44.476 44.476HVO (crude tall oil) #5 - No intermediate crops 44.476 44.476 44.476 44.476 44.476 44.476

Appendix E. Detailed Fuel Quantity Results 52
HVO (crude tall oil) #6 - Higher subtargets 44.476 44.476 44.476 44.476 44.476 44.476HVO (crude tall oil) #7 - Low EV growth 44.476 44.476 44.476 44.476 44.476 44.476HVO (crude tall oil) #8 - Renewable energy target 44.476 44.476 44.476 44.476 44.476 44.476HVO (crude tall oil) #9 - High renewable energy target 44.476 44.476 44.476 44.476 44.476 44.476HVO (crude tall oil) #10 - Energy target, no food-based or intermediate 44.476 44.476 44.476 44.476 44.476 44.476HVO (palm) #1 - REDII revision proposal 0 0 0 0 0 0HVO (palm) #2 - Lower GHG target 0 0 0 0 0 0HVO (palm) #3 - No food-based biofuels 0 0 0 0 0 0HVO (palm) #4 - No food-based or intermediate crops 0 0 0 0 0 0HVO (palm) #5 - No intermediate crops 0 0 0 0 0 0HVO (palm) #6 - Higher subtargets 0 0 0 0 0 0HVO (palm) #7 - Low EV growth 0 0 0 0 0 0HVO (palm) #8 - Renewable energy target 0 0 0 0 0 0HVO (palm) #9 - High renewable energy target 0 0 0 0 0 0HVO (palm) #10 - Energy target, no food-based or intermediate 0 0 0 0 0 0HVO (rapeseed) #1 - REDII revision proposal 61.957 4.577 10.8627 36.5758 95.7895 199.1316HVO (rapeseed) #2 - Lower GHG target 20.3516 1.496 3.0942 9.4994 27.1904 75.9741HVO (rapeseed) #3 - No food-based biofuels 0 0 0 0 0 0HVO (rapeseed) #4 - No food-based or intermediate crops 0 0 0 0 0 0HVO (rapeseed) #5 - No intermediate crops 37.3762 2.969 6.6374 20.3145 51.9759 127.2915HVO (rapeseed) #6 - Higher subtargets 53.2649 3.9121 9.1149 30.934 80.4613 174.519HVO (rapeseed) #7 - Low EV growth 88.8398 6.365 15.6484 54.0066 137.4683 280.812HVO (rapeseed) #8 - Renewable energy target 74.6921 5.5832 13.8006 46.3161 118.8786 230.0257HVO (rapeseed) #9 - High renewable energy target 114.4685 7.5359 20.0607 73.6352 180.531 349.0697HVO (rapeseed) #10 - Energy target, no food-based or intermediate 0 0 0 0 0 0HVO (soy intermediate crop) #1 - REDII revision proposal 71.7134 4.7194 12.7667 45.7644 113.4117 219.2031HVO (soy intermediate crop) #2 - Lower GHG target 11.6332 0.7204 1.4884 4.8146 14.4256 45.1058HVO (soy intermediate crop) #3 - No food-based biofuels 49.3992 1.8492 5.285 19.8019 68.7808 194.2716HVO (soy intermediate crop) #4 - No food-based or intermediate crops 0 0 0 0 0 0HVO (soy intermediate crop) #5 - No intermediate crops 0 0 0 0 0 0HVO (soy intermediate crop) #6 - Higher subtargets 49.8531 2.9212 7.7992 28.8927 76.5023 164.2193HVO (soy intermediate crop) #7 - Low EV growth 165.6138 18.6947 47.8732 142.6391 265.3928 390.7415HVO (soy intermediate crop) #8 - Renewable energy target 94.3034 9.0268 25.0017 76.8496 151.3445 234.5288HVO (soy intermediate crop) #9 - High renewable energy target 257.429 37.0193 99.7211 255.2708 405.7349 520.564HVO (soy intermediate crop) #10 - Energy target, no food-based or intermediate 0 0 0 0 0 0HVO (soy) #1 - REDII revision proposal 61.8217 4.6489 11.2693 37.3438 93.4526 197.4806HVO (soy) #2 - Lower GHG target 20.4619 1.5494 3.1432 9.5704 26.3595 79.2306HVO (soy) #3 - No food-based biofuels 0 0 0 0 0 0HVO (soy) #4 - No food-based or intermediate crops 0 0 0 0 0 0HVO (soy) #5 - No intermediate crops 38.1483 3.1427 6.7932 21.0544 53.1524 133.814HVO (soy) #6 - Higher subtargets 51.9931 4.0859 9.3132 30.1712 78.3679 168.4891HVO (soy) #7 - Low EV growth 86.21 6.1974 15.2626 52.2737 133.2804 278.702HVO (soy) #8 - Renewable energy target 77.0884 5.9138 15.2806 50.8682 120.5398 225.3898HVO (soy) #9 - High renewable energy target 112.7329 7.3875 20.8509 70.6417 172.5136 359.2513HVO (soy) #10 - Energy target, no food-based or intermediate 0 0 0 0 0 0HVO (tallow) #1 - REDII revision proposal 27.721 2.6326 5.61 14.3205 38.0681 100.2313HVO (tallow) #2 - Lower GHG target 20.4718 2.338 4.5878 11.051 26.4905 74.2708HVO (tallow) #3 - No food-based biofuels 13.044 1.6868 2.9981 6.9304 15.7371 46.9276HVO (tallow) #4 - No food-based or intermediate crops 10.5975 1.2992 2.3407 5.1454 12.3382 39.3913HVO (tallow) #5 - No intermediate crops 17.189 1.496 3.1544 7.8448 21.1091 67.6989HVO (tallow) #6 - Higher subtargets 29.3557 2.7975 5.8866 15.3997 40.7689 105.0012HVO (tallow) #7 - Low EV growth 28.571 2.4276 5.4066 13.9783 39.2854 105.2319HVO (tallow) #8 - Renewable energy target 35.4192 3.9213 8.2391 21.0744 51.4828 115.5248HVO (tallow) #9 - High renewable energy target 34.6602 3.7048 7.6056 20.2948 50.957 113.5088HVO (tallow) #10 - Energy target, no food-based or intermediate 14.3142 1.2992 2.7584 7.1652 18.6271 52.4183HVO (used cooking oil) #1 - REDII revision proposal 107.2142 37.7159 67.9819 112.0881 147.6262 174.5711HVO (used cooking oil) #2 - Lower GHG target 78.251 20.5946 37.7627 73.6682 114.4692 158.4506HVO (used cooking oil) #3 - No food-based biofuels 66.7586 13.6107 26.0029 57.8883 102.1562 151.5255HVO (used cooking oil) #4 - No food-based or intermediate crops 68.9271 13.2011 26.7765 61.0532 106.2628 154.8346HVO (used cooking oil) #5 - No intermediate crops 94.7065 28.6662 53.9786 96.3408 134.0294 168.3622HVO (used cooking oil) #6 - Higher subtargets 110.1968 36.5138 67.9895 118.5165 153.5513 175.1948HVO (used cooking oil) #7 - Low EV growth 115.7968 45.2292 80.1259 122.4599 155.7758 176.4514HVO (used cooking oil) #8 - Renewable energy target 92.1385 24.7817 49.7004 95.017 132.0236 167.2274HVO (used cooking oil) #9 - High renewable energy target 90.4357 22.7638 46.4826 92.6655 130.9878 166.5992HVO (used cooking oil) #10 - Energy target, no food-based or intermediate 44.4287 5.2594 11.6546 31.5126 69.4097 125.3339Hydrogen (fossil sources) #1 - REDII revision proposal 0 0 0 0 0 0Hydrogen (fossil sources) #2 - Lower GHG target 0 0 0 0 0 0Hydrogen (fossil sources) #3 - No food-based biofuels 0 0 0 0 0 0Hydrogen (fossil sources) #4 - No food-based or intermediate crops 0 0 0 0 0 0Hydrogen (fossil sources) #5 - No intermediate crops 0 0 0 0 0 0Hydrogen (fossil sources) #6 - Higher subtargets 0 0 0 0 0 0Hydrogen (fossil sources) #7 - Low EV growth 0 0 0 0 0 0Hydrogen (fossil sources) #8 - Renewable energy target 0 0 0 0 0 0Hydrogen (fossil sources) #9 - High renewable energy target 0 0 0 0 0 0Hydrogen (fossil sources) #10 - Energy target, no food-based or intermediate 0 0 0 0 0 0Kerosene (fossil sources) #1 - REDII revision proposal 1469.7781 1198.6157 1357.8751 1535.286 1609.8671 1673.472Kerosene (fossil sources) #2 - Lower GHG target 1515.8604 1235.0494 1401.2367 1591.26 1661.0802 1720.2585

Appendix E. Detailed Fuel Quantity Results 53
Kerosene (fossil sources) #3 - No food-based biofuels 1508.6786 1236.8625 1393.338 1576.2614 1658.6622 1717.9331Kerosene (fossil sources) #4 - No food-based or intermediate crops 1519.9957 1258.0793 1417.9464 1583.03 1658.5139 1721.5683Kerosene (fossil sources) #5 - No intermediate crops 1447.9824 1195.0223 1348.7137 1500.3126 1578.007 1649.1856Kerosene (fossil sources) #6 - Higher subtargets 1349.4238 1124.2274 1247.5116 1364.5231 1481.5545 1590.6573Kerosene (fossil sources) #7 - Low EV growth 1439.44 1170.1396 1331.6038 1497.1281 1580.8889 1651.4272Kerosene (fossil sources) #8 - Renewable energy target 1478.9847 1141.6234 1335.1266 1552.1045 1668.6743 1742.7948Kerosene (fossil sources) #9 - High renewable energy target 1425.273 1047.7889 1265.9576 1501.6848 1634.3347 1719.1857Kerosene (fossil sources) #10 - Energy target, no food-based or intermediate 1440.3828 1094.3672 1281.8941 1481.978 1662.6441 1753.0878Renewable Electricity #1 - REDII revision proposal 161.6905 129.267 142.9011 162.4126 179.8828 198.4107Renewable Electricity #2 - Lower GHG target 142.0044 120.3816 129.2606 141.8132 154.0969 167.9396Renewable Electricity #3 - No food-based biofuels 152.9878 124.9115 135.3771 151.8708 168.7059 190.5014Renewable Electricity #4 - No food-based or intermediate crops 171.7501 147.4895 161.288 175.3207 184.6355 191.867Renewable Electricity #5 - No intermediate crops 198.5555 163.5031 183.0925 203.5785 216.5153 227.4726Renewable Electricity #6 - Higher subtargets 156.3454 127.3734 139.8272 156.9995 172.863 188.5061Renewable Electricity #7 - Low EV growth 89.695 66.7183 75.1285 88.1547 102.2662 121.6563Renewable Electricity #8 - Renewable energy target 106.7182 103.5664 104.6451 106.3753 108.3187 111.4462Renewable Electricity #9 - High renewable energy target 107.5738 103.9979 105.3052 107.3281 109.4816 112.5152Renewable Electricity #10 - Energy target, no food-based or intermediate 106.9832 103.704 104.7904 106.6662 108.7639 111.7844SAF (tallow) #1 - REDII revision proposal 1.8463 0.0038 0.0103 0.0656 0.5887 11.1442SAF (tallow) #2 - Lower GHG target 2.0296 0.0042 0.0112 0.0723 0.7282 12.412SAF (tallow) #3 - No food-based biofuels 1.7515 0.0024 0.0056 0.0458 0.5495 10.4257SAF (tallow) #4 - No food-based or intermediate crops 1.6334 0.0012 0.0031 0.0377 0.4629 9.6631SAF (tallow) #5 - No intermediate crops 1.4002 0.0011 0.0036 0.0332 0.3552 7.9695SAF (tallow) #6 - Higher subtargets 0.5899 0.003 0.0062 0.0197 0.1113 2.8283SAF (tallow) #7 - Low EV growth 1.7381 0.0031 0.0089 0.0564 0.5077 10.5317SAF (tallow) #8 - Renewable energy target 3.2746 0.0588 0.1538 0.5684 2.3571 17.1832SAF (tallow) #9 - High renewable energy target 3.9485 0.0745 0.1926 0.7413 3.0672 21.1991SAF (tallow) #10 - Energy target, no food-based or intermediate 4.2099 0.089 0.2302 0.9852 3.5921 20.0481SAF (used cooking oil) #1 - REDII revision proposal 19.0728 0.0578 0.296 7.1337 35.3693 65.8981SAF (used cooking oil) #2 - Lower GHG target 18.7341 0.0442 0.2039 6.3218 34.2397 66.1654SAF (used cooking oil) #3 - No food-based biofuels 17.5125 0.0291 0.113 4.0345 32.057 65.3862SAF (used cooking oil) #4 - No food-based or intermediate crops 18.7452 0.0266 0.1036 5.4081 35.4578 66.8962SAF (used cooking oil) #5 - No intermediate crops 18.9006 0.0377 0.1799 5.8882 36.2059 64.8491SAF (used cooking oil) #6 - Higher subtargets 6.5291 0.0365 0.11 0.6682 9.2897 31.1077SAF (used cooking oil) #7 - Low EV growth 19.4077 0.061 0.3163 7.4946 36.4119 65.8123SAF (used cooking oil) #8 - Renewable energy target 35.977 1.2544 5.923 26.9204 56.3057 109.4267SAF (used cooking oil) #9 - High renewable energy target 46.0083 1.8077 8.5944 34.8055 68.211 142.6108SAF (used cooking oil) #10 - Energy target, no food-based or intermediate 61.1023 2.5707 9.7625 41.4049 100.9579 177.7163SAF Alcohol-to-Jet (agricultural residues) #1 - REDII revision proposal 1.3962 0.0486 0.1115 0.3854 1.3862 6.1801SAF Alcohol-to-Jet (agricultural residues) #2 - Lower GHG target 1.6012 0.0542 0.1249 0.4329 1.5873 7.2826SAF Alcohol-to-Jet (agricultural residues) #3 - No food-based biofuels 1.4031 0.0481 0.1153 0.3975 1.3786 6.1589SAF Alcohol-to-Jet (agricultural residues) #4 - No food-based or intermediate crops 1.2279 0.0406 0.0941 0.3054 1.0969 5.2066SAF Alcohol-to-Jet (agricultural residues) #5 - No intermediate crops 1.0914 0.0389 0.0916 0.2997 1.0183 4.8209SAF Alcohol-to-Jet (agricultural residues) #6 - Higher subtargets 1.9243 0.0572 0.1372 0.4922 1.8208 8.5498SAF Alcohol-to-Jet (agricultural residues) #7 - Low EV growth 1.2629 0.0456 0.1022 0.3502 1.2546 5.4377SAF Alcohol-to-Jet (agricultural residues) #8 - Renewable energy target 1.8038 0.0656 0.1471 0.5611 2.0632 7.7852SAF Alcohol-to-Jet (agricultural residues) #9 - High renewable energy target 1.8525 0.0678 0.1572 0.5938 2.1044 8.0826SAF Alcohol-to-Jet (agricultural residues) #10 - Energy target, no food-based or intermediate 3.9322 0.0925 0.2296 0.9251 3.4835 18.2411SAF Alcohol-to-Jet (corn intermediate crop) #1 - REDII revision proposal 0.6915 0.0325 0.0687 0.2162 0.7 2.7364SAF Alcohol-to-Jet (corn intermediate crop) #2 - Lower GHG target 0.0899 0.0103 0.0181 0.045 0.1139 0.3175SAF Alcohol-to-Jet (corn intermediate crop) #3 - No food-based biofuels 0.4056 0.0194 0.0414 0.121 0.3473 1.6828SAF Alcohol-to-Jet (corn intermediate crop) #4 - No food-based or intermediate crops 0 0 0 0 0 0SAF Alcohol-to-Jet (corn intermediate crop) #5 - No intermediate crops 0 0 0 0 0 0SAF Alcohol-to-Jet (corn intermediate crop) #6 - Higher subtargets 0.4348 0.0251 0.0509 0.1526 0.4588 1.6706SAF Alcohol-to-Jet (corn intermediate crop) #7 - Low EV growth 2.0893 0.0615 0.1466 0.5087 1.8788 9.0103SAF Alcohol-to-Jet (corn intermediate crop) #8 - Renewable energy target 1.1966 0.0423 0.0931 0.314 1.0889 5.298SAF Alcohol-to-Jet (corn intermediate crop) #9 - High renewable energy target 4.0301 0.0792 0.2011 0.7371 3.2498 19.2785SAF Alcohol-to-Jet (corn intermediate crop) #10 - Energy target, no food-based or intermediate 0 0 0 0 0 0SAF Alcohol-to-Jet (corn) #1 - REDII revision proposal 0.8838 0.0411 0.0892 0.288 0.9226 3.4218SAF Alcohol-to-Jet (corn) #2 - Lower GHG target 0.2269 0.0183 0.0345 0.0953 0.26 0.8706SAF Alcohol-to-Jet (corn) #3 - No food-based biofuels 0 0 0 0 0 0SAF Alcohol-to-Jet (corn) #4 - No food-based or intermediate crops 0 0 0 0 0 0SAF Alcohol-to-Jet (corn) #5 - No intermediate crops 0.5436 0.0295 0.0614 0.1881 0.569 2.1113SAF Alcohol-to-Jet (corn) #6 - Higher subtargets 0.7049 0.0362 0.0756 0.2492 0.7642 2.694SAF Alcohol-to-Jet (corn) #7 - Low EV growth 1.3499 0.0507 0.1135 0.3736 1.3005 5.3409SAF Alcohol-to-Jet (corn) #8 - Renewable energy target 1.2108 0.0483 0.1049 0.3507 1.1498 5.0578SAF Alcohol-to-Jet (corn) #9 - High renewable energy target 1.9033 0.0597 0.1298 0.4533 1.6783 7.8423SAF Alcohol-to-Jet (corn) #10 - Energy target, no food-based or intermediate 0 0 0 0 0 0SAF Alcohol-to-Jet (energy crops) #1 - REDII revision proposal 1.103 0.0423 0.092 0.3025 1.0437 4.8608SAF Alcohol-to-Jet (energy crops) #2 - Lower GHG target 1.2844 0.048 0.1096 0.36 1.2444 5.61SAF Alcohol-to-Jet (energy crops) #3 - No food-based biofuels 1.144 0.0423 0.0921 0.3015 1.0693 4.8961SAF Alcohol-to-Jet (energy crops) #4 - No food-based or intermediate crops 0.9483 0.034 0.0742 0.2325 0.8539 4.1276SAF Alcohol-to-Jet (energy crops) #5 - No intermediate crops 0.8324 0.0331 0.0711 0.2153 0.7316 3.4647SAF Alcohol-to-Jet (energy crops) #6 - Higher subtargets 1.5778 0.0491 0.1127 0.3893 1.3508 6.9661SAF Alcohol-to-Jet (energy crops) #7 - Low EV growth 0.9956 0.0391 0.0874 0.2809 0.9293 4.2772SAF Alcohol-to-Jet (energy crops) #8 - Renewable energy target 1.4444 0.0595 0.128 0.448 1.5967 6.1878SAF Alcohol-to-Jet (energy crops) #9 - High renewable energy target 1.5912 0.0603 0.1369 0.4871 1.7358 6.8547

Appendix E. Detailed Fuel Quantity Results 54
SAF Alcohol-to-Jet (energy crops) #10 - Energy target, no food-based or intermediate 3.0612 0.0838 0.1989 0.73 2.7808 14.2628SAF Alcohol-to-Jet (flue gas) #1 - REDII revision proposal 0.3223 0.0211 0.0416 0.1225 0.3498 1.2413SAF Alcohol-to-Jet (flue gas) #2 - Lower GHG target 0.0546 0.0076 0.013 0.0299 0.0711 0.1819SAF Alcohol-to-Jet (flue gas) #3 - No food-based biofuels 0.1975 0.0131 0.0264 0.0719 0.1986 0.7584SAF Alcohol-to-Jet (flue gas) #4 - No food-based or intermediate crops 1.8168 0.0279 0.0721 0.2523 1.1007 9.4473SAF Alcohol-to-Jet (flue gas) #5 - No intermediate crops 3.5014 0.067 0.181 0.6907 2.9939 19.1705SAF Alcohol-to-Jet (flue gas) #6 - Higher subtargets 0.2192 0.0167 0.0324 0.0864 0.2388 0.8379SAF Alcohol-to-Jet (flue gas) #7 - Low EV growth 0.8278 0.036 0.0776 0.2584 0.8146 3.528SAF Alcohol-to-Jet (flue gas) #8 - Renewable energy target 0.1774 0.0143 0.0265 0.0727 0.1947 0.6985SAF Alcohol-to-Jet (flue gas) #9 - High renewable energy target 0.4731 0.0242 0.0515 0.1544 0.4742 2.0142SAF Alcohol-to-Jet (flue gas) #10 - Energy target, no food-based or intermediate 3.5148 0.0597 0.1589 0.5876 2.6047 20.9375SAF Alcohol-to-Jet #1 - REDII revision proposal 2.8604 0.0881 0.2084 0.8008 3.0823 12.5361SAF Alcohol-to-Jet #2 - Lower GHG target 0.612 0.0339 0.0695 0.2177 0.6905 2.5299SAF Alcohol-to-Jet #3 - No food-based biofuels 0 0 0 0 0 0SAF Alcohol-to-Jet #4 - No food-based or intermediate crops 0 0 0 0 0 0SAF Alcohol-to-Jet #5 - No intermediate crops 3.2442 0.098 0.2373 0.9117 3.4952 14.4353SAF Alcohol-to-Jet #6 - Higher subtargets 2.1715 0.0743 0.1734 0.6157 2.33 9.4142SAF Alcohol-to-Jet #7 - Low EV growth 4.8851 0.1231 0.2988 1.1857 4.7989 21.1172SAF Alcohol-to-Jet #8 - Renewable energy target 1.5185 0.0569 0.1224 0.4201 1.4744 6.435SAF Alcohol-to-Jet #9 - High renewable energy target 2.3812 0.0644 0.15 0.5868 2.1171 10.1905SAF Alcohol-to-Jet #10 - Energy target, no food-based or intermediate 0 0 0 0 0 0SAF e-Fuels #1 - REDII revision proposal 48.0178 11.8348 12.2562 32.3242 84.6708 113.1534SAF e-Fuels #2 - Lower GHG target 49.0348 12.1037 12.5573 35.674 84.5028 113.7489SAF e-Fuels #3 - No food-based biofuels 52.5424 12.1479 12.6596 41.9426 90.8257 114.2022SAF e-Fuels #4 - No food-based or intermediate crops 51.5462 12.1064 12.6305 39.8869 89.3735 113.6268SAF e-Fuels #5 - No intermediate crops 48.0818 11.5147 12.0175 33.4122 85.0594 112.4956SAF e-Fuels #6 - Higher subtargets 60.219 34.0265 37.4681 42.213 87.3313 113.369SAF e-Fuels #7 - Low EV growth 48.1482 11.737 12.1598 32.6304 85.8986 112.98SAF e-Fuels #8 - Renewable energy target 51.1501 12.3605 12.8514 40.2086 87.3655 114.804SAF e-Fuels #9 - High renewable energy target 47.7879 12.0363 12.5101 30.7014 85.7886 114.1008SAF e-Fuels #10 - Energy target, no food-based or intermediate 39.7635 11.3701 12.4493 21.9597 61.4633 112.0895SAF Fischer-Tropsch (agricultural residues) #1 - REDII revision proposal 3.2208 0.0951 0.2309 0.9102 3.4959 15.0717SAF Fischer-Tropsch (agricultural residues) #2 - Lower GHG target 3.2296 0.0949 0.23 0.9087 3.5422 15.1158SAF Fischer-Tropsch (agricultural residues) #3 - No food-based biofuels 3.112 0.0938 0.2232 0.8619 3.3496 14.493SAF Fischer-Tropsch (agricultural residues) #4 - No food-based or intermediate crops 3.0328 0.091 0.2187 0.8358 3.2384 14.2186SAF Fischer-Tropsch (agricultural residues) #5 - No intermediate crops 3.0165 0.0936 0.2219 0.8392 3.1634 13.9542SAF Fischer-Tropsch (agricultural residues) #6 - Higher subtargets 4.2491 0.1125 0.2718 1.108 4.3149 19.7472SAF Fischer-Tropsch (agricultural residues) #7 - Low EV growth 3.1023 0.0948 0.2267 0.8809 3.2841 14.5381SAF Fischer-Tropsch (agricultural residues) #8 - Renewable energy target 3.0358 0.0945 0.2311 0.8811 3.3834 13.8756SAF Fischer-Tropsch (agricultural residues) #9 - High renewable energy target 3.1861 0.1004 0.2463 0.9584 3.5941 14.0268SAF Fischer-Tropsch (agricultural residues) #10 - Energy target, no food-based or intermediate 6.4477 0.133 0.3358 1.4326 6.3034 31.5419SAF Fischer-Tropsch (energy crops) #1 - REDII revision proposal 2.1954 0.0737 0.173 0.6196 2.3374 10.0239SAF Fischer-Tropsch (energy crops) #2 - Lower GHG target 2.2797 0.0763 0.1794 0.6402 2.4407 10.4755SAF Fischer-Tropsch (energy crops) #3 - No food-based biofuels 2.2096 0.0738 0.1722 0.6093 2.374 10.3849SAF Fischer-Tropsch (energy crops) #4 - No food-based or intermediate crops 2.0812 0.0692 0.1562 0.5428 2.1105 10.0161SAF Fischer-Tropsch (energy crops) #5 - No intermediate crops 2.0717 0.0729 0.1721 0.5965 2.1995 9.476SAF Fischer-Tropsch (energy crops) #6 - Higher subtargets 2.9532 0.0851 0.2048 0.7339 2.848 14.1703SAF Fischer-Tropsch (energy crops) #7 - Low EV growth 2.1375 0.0743 0.1745 0.6162 2.3043 9.745SAF Fischer-Tropsch (energy crops) #8 - Renewable energy target 2.1369 0.0726 0.1642 0.6154 2.2782 9.7596SAF Fischer-Tropsch (energy crops) #9 - High renewable energy target 2.2404 0.0786 0.1808 0.6599 2.4278 10.2186SAF Fischer-Tropsch (energy crops) #10 - Energy target, no food-based or intermediate 4.7992 0.1111 0.2741 1.0605 4.2059 21.9709SAF Fischer-Tropsch (municipal solid waste) #1 - REDII revision proposal 20.1051 0.6736 2.0876 10.0286 33.8959 64.828SAF Fischer-Tropsch (municipal solid waste) #2 - Lower GHG target 19.7354 0.6735 2.0847 10.5054 33.347 62.5357SAF Fischer-Tropsch (municipal solid waste) #3 - No food-based biofuels 19.0307 0.6619 1.9528 9.6969 32.6289 60.3988SAF Fischer-Tropsch (municipal solid waste) #4 - No food-based or intermediate crops 18.427 0.6231 1.8675 9.3938 31.2957 59.8106SAF Fischer-Tropsch (municipal solid waste) #5 - No intermediate crops 19.8496 0.6483 1.9496 9.457 33.048 64.7399SAF Fischer-Tropsch (municipal solid waste) #6 - Higher subtargets 26.0571 0.791 2.4176 12.7059 38.6379 89.9734SAF Fischer-Tropsch (municipal solid waste) #7 - Low EV growth 19.8681 0.6379 1.8914 9.766 33.2691 65.0815SAF Fischer-Tropsch (municipal solid waste) #8 - Renewable energy target 19.1714 0.5456 1.5806 8.4116 29.9021 66.9714SAF Fischer-Tropsch (municipal solid waste) #9 - High renewable energy target 21.5902 0.6518 1.7966 9.5714 31.4069 82.9366SAF Fischer-Tropsch (municipal solid waste) #10 - Energy target, no food-based or intermediate 43.5104 0.9029 2.903 16.9064 66.2959 166.4394SAF HEFA (palm) #1 - REDII revision proposal 0 0 0 0 0 0SAF HEFA (palm) #2 - Lower GHG target 0 0 0 0 0 0SAF HEFA (palm) #3 - No food-based biofuels 0 0 0 0 0 0SAF HEFA (palm) #4 - No food-based or intermediate crops 0 0 0 0 0 0SAF HEFA (palm) #5 - No intermediate crops 0 0 0 0 0 0SAF HEFA (palm) #6 - Higher subtargets 0 0 0 0 0 0SAF HEFA (palm) #7 - Low EV growth 0 0 0 0 0 0SAF HEFA (palm) #8 - Renewable energy target 0 0 0 0 0 0SAF HEFA (palm) #9 - High renewable energy target 0 0 0 0 0 0SAF HEFA (palm) #10 - Energy target, no food-based or intermediate 0 0 0 0 0 0SAF HEFA (rapeseed) #1 - REDII revision proposal 6.8495 0.6941 1.2837 3.2172 8.6436 24.1976SAF HEFA (rapeseed) #2 - Lower GHG target 2.4554 0.3415 0.5927 1.361 3.1875 8.035SAF HEFA (rapeseed) #3 - No food-based biofuels 0 0 0 0 0 0SAF HEFA (rapeseed) #4 - No food-based or intermediate crops 0 0 0 0 0 0SAF HEFA (rapeseed) #5 - No intermediate crops 4.6218 0.5127 0.918 2.2604 5.8069 16.5044SAF HEFA (rapeseed) #6 - Higher subtargets 5.8452 0.6309 1.1527 2.8293 7.3771 20.6313

Appendix E. Detailed Fuel Quantity Results 55
SAF HEFA (rapeseed) #7 - Low EV growth 9.4428 0.8347 1.592 4.1519 11.6652 33.92SAF HEFA (rapeseed) #8 - Renewable energy target 8.8067 0.7639 1.4671 3.9179 10.6667 32.9898SAF HEFA (rapeseed) #9 - High renewable energy target 12.2522 0.9203 1.784 4.8867 13.8662 47.1154SAF HEFA (rapeseed) #10 - Energy target, no food-based or intermediate 0 0 0 0 0 0SAF HEFA (soy intermediate crop) #1 - REDII revision proposal 7.5777 0.5281 1.0644 3.0495 8.3724 29.3116SAF HEFA (soy intermediate crop) #2 - Lower GHG target 1.2143 0.174 0.2912 0.6419 1.5411 4.1245SAF HEFA (soy intermediate crop) #3 - No food-based biofuels 4.7162 0.3213 0.6349 1.6372 4.7693 18.8535SAF HEFA (soy intermediate crop) #4 - No food-based or intermediate crops 0 0 0 0 0 0SAF HEFA (soy intermediate crop) #5 - No intermediate crops 0 0 0 0 0 0SAF HEFA (soy intermediate crop) #6 - Higher subtargets 5.1509 0.3939 0.7614 2.1197 5.7385 20.1035SAF HEFA (soy intermediate crop) #7 - Low EV growth 18.4993 0.9621 2.063 6.4456 20.7436 77.3596SAF HEFA (soy intermediate crop) #8 - Renewable energy target 11.1712 0.6844 1.3799 3.9536 12.4801 47.6823SAF HEFA (soy intermediate crop) #9 - High renewable energy target 30.2344 1.2455 2.8354 9.887 33.2933 129.8587SAF HEFA (soy intermediate crop) #10 - Energy target, no food-based or intermediate 0 0 0 0 0 0SAF HEFA (soy) #1 - REDII revision proposal 6.7348 0.6953 1.2481 3.2281 8.4381 24.0724SAF HEFA (soy) #2 - Lower GHG target 2.4096 0.3527 0.5919 1.3339 3.1402 7.9645SAF HEFA (soy) #3 - No food-based biofuels 0 0 0 0 0 0SAF HEFA (soy) #4 - No food-based or intermediate crops 0 0 0 0 0 0SAF HEFA (soy) #5 - No intermediate crops 4.4782 0.5219 0.9294 2.3085 5.6796 15.7273SAF HEFA (soy) #6 - Higher subtargets 5.6283 0.6179 1.1043 2.7785 7.1654 19.4258SAF HEFA (soy) #7 - Low EV growth 9.3564 0.8339 1.5967 4.1933 11.3083 34.897SAF HEFA (soy) #8 - Renewable energy target 8.3462 0.7854 1.4914 3.9582 10.2201 31.2766SAF HEFA (soy) #9 - High renewable energy target 11.7451 0.9124 1.7942 4.9303 13.2954 44.4605SAF HEFA (soy) #10 - Energy target, no food-based or intermediate 0 0 0 0 0 0
TABLE E.1: Detailed fuel quantity results (all units are in billion MJ).

56
Bibliography
[1] European Commission. Communication from the Commission: The European Green Deal. Dec. 2019.URL: https://ec.europa.eu/info/strategy/priorities-2019-2024/european-green-deal_en.
[2] European Commission. Delivering the European Green Deal. URL: https://ec.europa.eu/info/strategy/priorities-2019-2024/european-green-deal/delivering-european-green-deal_en.
[3] European Commission. Proposal for a Directive of the European Parliament and of the councilamending Directive (EU) 2018/2001 of the European Parliament and of the Council, Regulation(EU) 2018/1999 of the European Parliament and of the Council and Directive 98/70/EC of the Euro-pean Parliament and of the Council as regards the promotion of energy from renewable sources, andrepealing Council Directive (EU) 2015/652. July 2021. URL: https://ec.europa.eu/info/sites / default / files / amendment - renewable - energy - directive - 2030 -climate-target-with-annexes_en.pdf.
[4] European Commission. Proposal for a Regulation of the European Parliament and of the Coun-cil on ensuring a level playing field for sustainable air transport. July 2021. URL: https://ec.europa.eu/info/sites/default/files/refueleu_aviation_-_sustainable_aviation_fuels.pdf.
[5] European Commission. Proposal for a Regulation of the European Parliament and of the Council onthe use of renewable and low-carbon fuels in maritime transport and amending Directive 2009/16/EC.July 2021. URL: https://ec.europa.eu/info/sites/default/files/fueleu_maritime_-_green_european_maritime_space.pdf.
[6] European Commission. Directive (EU) 2018/2001 of the European Parliament and of the Councilof 11 December 2018 on the promotion of the use of energy from renewable sources. July 2021.URL: https://ec.europa.eu/energy/topics/renewable-energy/directive-targets-and-rules/renewable-energy-directive_en.
[7] European Commission. Stepping up Europe’s 2030 climate ambition - Investing in a climate-neutralfuture for the benefit of our people. URL: https://ec.europa.eu/clima/sites/clima/files/eu-climate-action/docs/impact_en.pdf.
[8] Thomas Rutherford. Lecture notes on constant elasticity functions. Nov. 2002. URL: http://www.gamsworld.org/mpsge/debreu/ces.pdf.
[9] Hugo Valin et al. “The land use change impact of biofuels consumed in the EU: Quantification ofarea and greenhouse gas impacts”. In: (2015). Publisher: Ecofys Netherlands BV. URL: https://ec.europa.eu/energy/sites/ener/files/documents/Final%20Report_GLOBIOM_publication.pdf.

Bibliography 57
[10] Mohamed Amine Bouhlel et al. “A Python surrogate modeling framework with derivatives”. In: Ad-vances in Engineering Software (2019), p. 102662. ISSN: 0965-9978. DOI: https://doi.org/10.1016/j.advengsoft.2019.03.005.
[11] D Peters and V Stojcheva. “Crude Tall Oil Low ILUC Risk Assessment—Comparing Global Supplyand Demand”. In: ECOFYS Netherlands BV: Utrecht, The Netherlands (2017), pp. 1–23.
[12] Chelsea Baldino et al. “The potential for low carbon renewable methane as a transport fuel in France,Italy, and Spain”. In: Working Paper 2018-28 (2018). URL: https://theicct.org/sites/default/files/publications/Biogas_potential_FR_IT_ES_20181109.pdf.
[13] LanzaTech. Technical background on the LanzaTech process. URL: http://www.arpae-summit.com/paperclip/exhibitor_docs/14AE/LanzaTech_Inc._131.pdf.
[14] CO2 reduction and biofuels in Germany’s transport sector - implementing the RED II directive. en.Nov. 2020. URL: https://www.cleanenergywire.org/factsheets/co2-reduction-and-biofuels-germanys-transport-sector-implementing-red-ii-directive(visited on 08/05/2021).
[15] European Commission. 2030 Climate Target Plan. en. Text. Sept. 2020. URL: https://ec.europa.eu/clima/policies/eu- climate- action/2030_ctp_en (visited on08/05/2021).
[16] Bert Smit et al. Adoption of cover crops for climate change mitigation in the EU. Tech. rep. JointResearch Centre (Seville site), 2019. URL: https://op.europa.eu/en/publication-detail/-/publication/0638ab96-f939-11e9-8c1f-01aa75ed71a1.
[17] Kaley Hart et al. Evaluation study of the payment for agricultural practices beneficial for the climateand the environment. Tech. rep. Joint Research Centre (Seville site), Nov. 2017. URL: https://op.europa.eu/en/publication-detail/-/publication/0638ab96-f939-11e9-8c1f-01aa75ed71a1.
[18] Soybean and Corn Advisor. Conab - 2020/21 Brazilian Soy Production up 7.1%, Corn up 2.6%.URL: http : / / www . soybeansandcorn . com / news / Oct9 _ 20 - Conab - 202021 -Brazilian-Soy-Production-up-7_1-Corn-up-2_6.
[19] Food and Agriculture Organization of the United Nations. FAO/OECD: Latin America and the Caribbeanwill account for 25 % of global agricultural and fisheries exports by 2028. URL: http://www.fao.org/americas/noticias/ver/en/c/1200912/.
[20] Allison Borchers et al. “Multi-cropping practices: recent trends in double-cropping”. In: (2014). URL:https://www.ers.usda.gov/webdocs/publications/43862/46871_eib125.pdf?v=41787.
[21] European Commission. DRAFT rules to verify sustainability and greenhouse gas emissions savingcriteria and low indirect land-use change-risk criteria. URL: https://ec.europa.eu/info/law/better-regulation/have-your-say/initiatives/12723-Sustainable-biofuels-bioliquids-and-biomass-fuels-voluntary-schemes-implementing-rules-_en.
[22] Energy Information Administration. Gasoline prices tend to have little effect on demand for cartravel. URL: https://www.eia.gov/todayinenergy/detail.php?id=19191.
Bibliography 58
[23] InterVISTAS Consulting Inc. Estimating Air Travel Demand Elasticities. Tech. rep. Dec. 2007. URL:https://www.iata.org/en/iata- repository/publications/economic-reports/estimating-air-travel-demand-elasticities---by-intervistas/.
[24] European Commission. Weekly Oil Bulletin. URL: https://ec.europa.eu/energy/data-analysis/weekly-oil-bulletin_en.
[25] Dan Rutherford et al. “Potential tankering under an EU sustainable aviation fuels mandate”. In:(2021). URL: https://theicct.org/publications/tankering-eu-SAF-mandate-apr2021.
[26] Eurostat. Prices of natural gas and electricity. URL: https://ec.europa.eu/eurostat.
[27] Neste Oil. Biodiesel prices (SME & FAME). URL: https://www.neste.com/investors/market-data/biodiesel-prices-sme-fame#2e6c0fc6.
[28] USDA Economic Research Service. Oil Crops Yearbook. URL: https://www.ers.usda.gov/data-products/oil-crops-yearbook/.
[29] Nikita Pavlenko, Stephanie Searle, and Adam Christensen. “The cost of supporting alternative jet fu-els in the European Union”. In: International Council on Clean Transportation (ICCT), WashingtonDC, USA (2019). URL: https://theicct.org/sites/default/files/publications/Alternative_jet_fuels_cost_EU_2020_06_v3.pdf.
[30] International Civil Aviation Organization. CORSIA Eligible Fuels – Life Cycle Assessment Methodol-ogy. Tech. rep. June 2019. URL: https://www.icao.int/environmental-protection/CORSIA/Documents/CORSIA%20Supporting%20Document_CORSIA%20Eligible%20Fuels_LCA%20Methodology.pdf.
[31] Stephanie Searle et al. “Potential greenhouse gas savings from a 2030 greenhouse gas reductiontarget with indirect emissions accounting for the European Union”. In: (2017). URL: https://theicct.org/publications/potential- greenhouse- gas- savings- 2030-greenhouse-gas-reduction-target-indirect.
[32] Stephanie Searle and Adam Christensen. “Decarbonization potential of electrofuels in the EuropeanUnion”. In: (2018). URL: https://theicct.org/publications/decarbonization-potential-electrofuels-eu.
[33] P. Schmidt et al. Power to Liquids: Potentials and Perspectives for the Future Supply of RenewableAviation Fuel. Tech. rep. German Environment Agency (Umwelt Bundesamt), 2016.
[34] Chelsea Baldino et al. Hydrogen for heating? Decarbonization options for households in the UnitedKingdom in 2050. 2020. URL: https://theicct.org/sites/default/files/publications/Hydrogen-heating-UK-dec2020.pdf.
[35] Michael Penev, Jarett Zuboy, and Chad Hunter. “Economic analysis of a high-pressure urban pipelineconcept (HyLine) for delivering hydrogen to retail fueling stations”. In: Transportation Research PartD: Transport and Environment 77 (2019). Publisher: Elsevier, pp. 92–105.
Bibliography 59
[36] Adam Christensen. “Assessment of hydrogen production costs from electrolysis: United States andEurope”. In: International Council on Clean Transportation: Washington, DC, USA (2020), pp. 1–73.URL: https://theicct.org/publications/assessment-hydrogen-production-costs-electrolysis-united-states-and-europe.
[37] M Mann and P Spath. Life Cycle Assessment of Renewable Hydrogen Production via Wind/Electrolysis:Milestone Completion Report. Tech. rep. National Renewable Energy Lab., Golden, CO.(US), 2004.
[38] Robert Edwards et al. “WELL-TO-WHEELS Report Version 4. a JEC WELL-TO-WHEELS ANAL-YSIS”. In: Institute for Energy and Transport, Joint Research Centre, Luxembourg: PublicationsOffice of the European Union 2014 (2014). URL: https : / / www . researchgate . net /profile / Laura - Lonza / publication / 280566047 _ JEC _ Well - to - Wheels _Report_Version_4a/links/55ba1d6808aec0e5f43e8a97/JEC-Well-to-Wheels-Report-Version-4a.pdf.
[39] Adam Brown et al. “Advanced Biofuels—Potential for Cost Reduction”. In: IEA Bioenergy 88 (2020).URL: https://www.ieabioenergy.com/wp-content/uploads/2020/02/IEABioenergy-2pSummary-CostAdvancedBiofuels.pdf.
[40] F Mueller-Langer et al. “Techno-economic assessment of hydrogen production processes for the hy-drogen economy for the short and medium term”. In: International journal of hydrogen energy 32.16(2007). Publisher: Elsevier, pp. 3797–3810. URL: https://www.sciencedirect.com/science/article/abs/pii/S0360319907003011.
[41] Nils Johnson, Nathan Parker, and Joan Ogden. “How negative can biofuels with CCS take us and atwhat cost? Refining the economic potential of biofuel production with CCS using spatially-explicitmodeling”. In: Energy Procedia 63 (2014). Publisher: Elsevier, pp. 6770–6791. URL: https://www.sciencedirect.com/science/article/pii/S1876610214025272.
[42] Argonne National Laboratory. The Greenhouse Gases, Regulated Emissions, and Energy use in Tech-nologies Model (GREET). 2019. URL: https://greet.es.anl.gov/.
[43] Stergios Zacharakis and Chrysa Glystra. “European ETBE premium to MTBE reaches historic high”.In: S&P Global Platts (Jan. 2020). URL: https://www.spglobal.com/platts/en/market-insights/latest-news/agriculture/012320-european-etbe-premium-to-mtbe-reaches-historic-high.


