33
Transportation Equity and Access to Jobs in Metropolitan Milwaukee A Report Prepared by: The University of Wisconsin-Milwaukee Center for Economic Development September 2004

Transportation Equity and Access to Jobs in Metropolitan Milwaukee
A Report Prepared by:
The University of Wisconsin-Milwaukee
Center for Economic Development
September 2004

2
About This Report
This report was produced at the University of Wisconsin-Milwaukee Center for Economic
Development (UWMCED), a unit of the College of Letters and Science at the University of
Wisconsin-Milwaukee. The College established UWMCED in 1990, with the assistance of a
grant from the U.S. Department of Commerce, Economic Development Administration’s
“University Center” program, to provide university research and technical assistance to
community organizations and units of government working to improve the Greater Milwaukee
economy. In 2000, UWMCED also became part of UWM’s “Milwaukee Idea,” as one of the
core units of the “Consortium for Economic Opportunity.” The analysis and conclusions
presented in this report are solely those of UWMCED and do not necessarily reflect the views
and opinions of UW-Milwaukee or the U.S. Department of Commerce.
The author of this report is Joel Rast, assistant professor of Political Science and Urban Studies.
Chieko Maene, a research assistant at the Center, provided indispensable assistance.
UWMCED strongly believes that informed public debate is vital to the development of good
public policy. The Center publishes briefing papers, detailed analyses of economic trends and
policies, and “technical assistance” reports on issues of applied economic development. In these
ways, as well as in conferences and public lectures sponsored by the Center, we hope to
contribute to public discussion of economic development policy in Southeastern Wisconsin.
Further information about the Center and its reports and activities is available
at our web site: www.ced.uwm.edu

3
Executive Summary
This study examines how well public transit in Milwaukee, Ozaukee, Waukesha, and
Washington counties provides low-income residents of the 4-county region with access to job
opportunities. Researchers have long observed a “spatial mismatch” between job growth centers
and low-income residential communities in metropolitan areas around the country. Studies show
that for decades, the suburban share of metropolitan jobs has been steadily increasing, while low-
income populations typically remain concentrated in central city neighborhoods far removed
from regional job growth centers. Because low-income persons frequently do not have access to
an automobile, effective public transportation is often crucial in bridging the gap between the
inner-city locations of low-income populations and the increasingly suburban locations of job
opportunities.
Our research confirms the presence of a spatial mismatch between low-income residential
communities and job opportunities in the Milwaukee region. Eighty-one percent of families
living below the poverty line are located in the city of Milwaukee. By contrast, only 30 percent
of businesses with strong hiring projections for entry-level workers are located in Milwaukee.
The remaining 70 percent are in the suburbs.
Families in the Milwaukee region living below the poverty level rely heavily on public
transportation. According to 2000 US Census data, 36.6 percent of Milwaukee-area families with
incomes below the poverty level have no access to a vehicle, while only 4.4 percent of families
above the poverty level have no access to a vehicle. Public transit is only partially effective in
connecting inner-city residents with job opportunities in the region. Most low-income families
are located within walking distance of bus stops. However, many potential job opportunities are
inaccessible by transit. Our analysis shows that:
• 59.1 percent of businesses with strong hiring projections for entry-level workers are located
within ¼ mile of bus lines.
• 63.5 percent of businesses with strong hiring projections for entry-level workers are located
within ½ mile of bus lines.

4
When travel times are factored into the analysis, the percentage of businesses accessible by low-
income residents declines significantly. For example, for residents of the Washington
Park/Walnut Hill neighborhood on Milwaukee’s west side, only 40.4 percent of businesses with
strong hiring projections for entry-level workers are located within ¼ mile of bus lines and
reachable within a one-hour commute. For residents of the Near South Side, the number falls to
32.4 percent.
Our findings take on added significance when recent developments in regional transportation
operations and planning are taken into account. In 2003, the Southeastern Wisconsin Regional
Planning Commission (SEWRPC) revised its long-range regional transportation plan to include a
proposed $6.23 billion reconstruction of the entire 270-mile Southeastern Wisconsin highway
system. If implemented, the plan will consume a substantial share of the region’s federal and
state transportation dollars during the next 30 years. Meanwhile, Milwaukee County Transit
Services (MCTS), the principal transit provider in the region, has reduced bus service every year
since 2001. The present climate in Southeastern Wisconsin is thus one of retrenchment for public
transit and expansion for highways.
Choices presently being made about the future of transportation in Southeastern Wisconsin will
shape the region’s transportation infrastructure for years to come. If we continue along the
present trajectory—massive public investments in highway reconstruction and reduced funding
for public transit—the outcome is clear. Ultimately, we will find ourselves with two
transportation systems, separate and unequal—one, a state-of-the-art highway network whose
principal beneficiaries are white, middle-class suburban residents; the other, an underfunded
public transit system serving as the transportation of last resort for the region’s least privileged
residents. It will take significantly greater vision and foresight than policymakers have recently
shown to reverse the course we are presently on. Should we fail to do so, the price will be a
region increasingly divided by race and class.

5
Introduction
This study examines how well public transit in Milwaukee, Ozaukee, Waukesha, and
Washington counties provides low-income residents of the 4-county region with access to job
opportunities. Researchers have long observed a “spatial mismatch” between job growth centers
and low-income residential communities in metropolitan areas around the country. Studies show
that for decades, the suburban share of metropolitan jobs has been steadily increasing, while low-
income populations typically remain concentrated in central city neighborhoods far removed
from regional job growth centers. Because low-income persons frequently do not have access to
an automobile, effective public transportation is often crucial in bridging the gap between the
inner-city locations of low-income populations and the increasingly suburban locations of job
opportunities.
In recent years, a number of developments have given the issue of job access by low-income
populations renewed salience. In 1996, President Clinton signed the Personal Responsibility and
Work Opportunity Reconciliation Act, which replaced Aid to Families with Dependent Children
(AFDC) with Temporary Assistance for Needy Families (TANF). Under TANF, the federal
government no longer provides cash assistance directly to welfare recipients. Instead, states
receive block grants to establish and administer their own family assistance programs within
federal guidelines. Wisconsin’s TANF program, Wisconsin Works (W-2), was established in
1997.
A key objective of both TANF and Wisconsin’s W-2 program is work participation. Federal law
requires that a certain percentage of each state’s TANF recipients participate in work related
activities for a minimum number of hours per week. In addition, both TANF and W-2 contain a
five year limit on assistance. Families cannot receive assistance for more than five years unless
they qualify for a special hardship exemption. Work participation requirements and time limits
on the receipt of benefits make access to job opportunities a crucial aspect of welfare reform. As
former US Secretary of Transportation Rodney Slater once put it, “Transportation is the ‘to’ in
Welfare-to-Work.”

6
The issues of spatial mismatch and job access for low-income residents are also important in the
current debate over the future of transportation in Southeastern Wisconsin. In 2003, the
Southeastern Wisconsin Regional Planning Commission (SEWRPC) revised its long-range
regional transportation plan to include a proposed $6.23 billion reconstruction of the entire 270-
mile Southeastern Wisconsin highway system. In addition to rebuilding the existing highway
system, the plan recommends the construction of additional freeway lanes on 127 miles of the
system. If implemented, the plan will consume a substantial share of the region’s federal and
state transportation dollars during the next 30 years. Meanwhile, funding for public transit
continues to decrease. Milwaukee County Transit Services (MCTS), the principal transit
provider in the region, has reduced bus service every year since 2001. Together with a bus fare
increase approved in 2003 to help address the revenue shortfall, service reductions are expected
to reduce ridership to the lowest levels since 1976 (Sandler & Umhoefer, 2003). The present
climate in Southeastern Wisconsin is thus one of retrenchment for public transit and expansion
for highways.
This study seeks to address two principal questions:
• Is there a spatial mismatch between low-income residential neighborhoods and locations of
job opportunities in the 4-county Milwaukee region?
• How well does public transportation provide low-income residents with access to job
opportunities in the 4-county region?
We begin by examining the degree to which low-income populations in the Milwaukee region
rely on public transportation for access to job opportunities. We then identify the locations of
entry-level jobs in the region with strong hiring projections. Next we determine how effectively
public transportation provides low-income residents with access to these job sites. Finally, we
consider the implications of recent transportation-related developments—including SEWRPC’s
highway reconstruction plans and MCTS’s service reductions—for transit-dependent workers
and job seekers.
Spatial Mismatch and Access to Employment
The spatial mismatch thesis was first advanced by Harvard economist John Kain in a 1968 article
in the Quarterly Journal of Economics (Kain, 1968). Kain examined the residential locations of

7
African Americans in Detroit and Chicago and trends in the location of employment
opportunities in both regions. He found that businesses were decentralizing at a rapid pace and
that housing discrimination prevented African Americans from following jobs to the suburbs.
Moreover, suburban job growth centers were largely inaccessible to inner-city residents via
public transit. Kain concluded that high unemployment rates of inner-city African Americans
were partially attributable to job decentralization and the failure of public transit to connect
inner-city residents with suburban job locations.
Kain’s findings led to a voluminous body of literature on the issue of spatial mismatch which
largely supports his thesis (Ihlanfeldt & Sjoquist, 1998; Holzer, 1991; Ihlanfeldt, 1992; Moss &
Tilly, 1991; Wheeler, 1990). If anything, the literature suggests that the patterns Kain observed
during the 1960s have become more pronounced over time, as low-income and minority
populations remain largely concentrated in central city locations, while businesses continue to
decentralize at a rapid pace (Jargowski, 1997). John Kasarda (1995) estimates that metropolitan
employment has been shifting to the suburbs at a rate of roughly 1 percent per year since the
1970s.
Recent developments have sparked renewed interest in the spatial mismatch question. First, the
welfare reform initiatives of the 1990s have made the issue of access to jobs an increasingly
central public policy question in states and metropolitan regions around the country. TANF’s
work participation requirements and 5-year limit on the receipt of benefits have encouraged
public officials to reexamine transportation links between welfare recipients and potential job
locations. Some regional planning agencies have produced studies to identify potential spatial
mismatch problems and provide recommendations to address the issue (Delaware Valley
Regional Planning Commission, 1998, 1999; New Jersey Transportation Planning Authority,
1999; San Luis Obispo Council of Governments, 1998).
In addition, new federal environmental justice laws require Metropolitan Planning Organizations
(MPOs) to examine equity concerns in the preparation of regional transportation plans. In
accordance with President Clinton’s 1994 executive order on environmental justice, the Federal
Highway Administration now requires MPOs to demonstrate that regional transportation plans
specifically address the transportation needs of low-income and minority populations. To comply

8
with federal requirements on environmental justice, MPOs have conducted studies to determine
whether regional public transportation systems are effective in providing access to job growth
centers by low-income and minority residents (Federal Highway Administration, 2000).
Finally, recent studies examining access to jobs have benefited from the introduction of
Geographic Information Systems (GIS) technology, which enables researchers to spatially
represent transit lines, low-income residential areas, and job locations. GIS has vastly improved
the analytical capabilities of spatial mismatch research. For example, GIS allows researchers to
determine the percentage of low-income households in a region located within walking distance
of public transit, or the percentage of job opportunities located within walking distance of public
transit.
Low-Income Populations and Public Transportation
The US Census Bureau currently defines poverty as an income of $16,895 or less for a family of
four. By this definition, there are a total of 29,386 families living in poverty in the 4-county
Milwaukee region, according to 2000 US Census figures. Map 1 shows the locations of these
families. The vast majority of them are located in either the city of Milwaukee (81 percent) or in
Milwaukee County (90 percent).
To what extent do these families rely on public transportation? Map 2 shows the percentage of
households with no vehicle available for each census block group in the 4-county region. In the
areas shaded in red, between 45 and 100 percent of households have no vehicle available. By
contrast, in the areas in white, 10 percent or fewer households have no vehicle available. As Map
2 indicates, households with no vehicles available are far more likely to be located in the city of
Milwaukee and Milwaukee County than elsewhere in the 4-county region.
Although it is interesting to observe that households in Milwaukee County are less likely to have
access to a car than households elsewhere in the region, we wanted to know more specifically
how closely vehicle ownership is correlated with household income. We used descriptive
statistics (Pearson’s r) to test this correlation. Figure 1 shows the relationship between two
variables: the percentage of households with no vehicle available and the percentage of families

9
living below the poverty level in the 4-county region. Each point in Figure 1 represents one
census block group. The Pearson’s r coefficients indicate that there is a strong linear relationship
between the two variables. The higher the percentage of families below the poverty level in a
given block group, the higher the percentage of households with no vehicle available.

10

11
Figure 1. Auto Ownership and Families Below the Poverty Level, Milwaukee Metro Area
Percent of families below poverty level
100806040200
Perc
ent o
f HH
with
no
vehi
cle
avai
labl
e
100
80
60
40
20
0
Coefficients: between % of households with no vehicle available & % of families in poverty
Model Unstandardized Coefficients Standardized Coefficients t Sig.
B Std. Error Beta 1 (Constant) 5.278 .310 17.034 .000
Families in poverty .799 .017 .789 45.778 .000
Dependent variable: Percentage of households with no vehicle available
As an additional measure of vehicle ownership, we examined US Census PUMS data for the 4-
county region. According to the data, 36.6 percent of families below the poverty level have no
access to a vehicle, while only 4.4 percent of families above the poverty level have no access to a
vehicle. The results are slightly different when households instead of families are used as the unit
of analysis. For households below the poverty line, 42.1 percent have no access to a vehicle; for
households above the poverty line, the number falls to 8.8 percent.

12
Finally, US Census data on the racial and income characteristics of bus riders in the Milwaukee
Metropolitan area indicate that a large percentage of bus riders are low-income and minority
residents. Figure 2 shows the income profile for commuters in the 4-county region. Twenty-six
percent of bus commuters in the region have household incomes below $20,000, as compared
with 7.3 percent of all commuters. Figure 3 shows the racial and ethnic profile of bus commuters
in the 4-county region. In the city of Milwaukee, the vast majority of bus commuters (67.2
percent) are minorities, with African Americans representing the largest share (49.4 percent)
followed by Latinos (13.8 percent) and Asians (1.7 percent).
Figure 2. Income Profiles, Metro Milwaukee Commuters
25.5%
32.1%
20.5% 21.9%
7.3%
17.1%
22.3%
53.3%
0.0%
10.0%
20.0%
30.0%
40.0%
50.0%
60.0%
Under $20K $20K-40K $40K-60K $60K or +
Bus Commuters
All Commuters
Source: US Census, 2000, PUMS

13
Figure 3. Racial and Ethnic Profiles, Metro Milwaukee Bus Commuters
32.8%
84.7%
97.1%
49.4%
3.9%0.0%1.7% 3.7%
0.0%
13.8%
6.1%2.0%
0.0%
20.0%
40.0%
60.0%
80.0%
100.0%
Milwaukee City Reminder of Milw Co. WOW Counties
NH white
NH Black
NH Asian
Hispanic
Source: US Census, 2000, PUMS
The data on vehicle ownership and transit use in the 4-county region suggest that effective public
transportation is crucial in meeting the transportation needs of both low-income and minority
populations. Low vehicle ownership rates for households living in poverty mean that public
transportation is likely to play a decisive role in efforts to connect low-income residents with job
opportunities in the region.
Entry-Level Job Locations
As in most metropolitan areas around the country, job growth in the Milwaukee region in recent
decades has been concentrated in the suburbs. Table 1 shows changes in employment for the 4-
county region from 1970-2000. In 1970, 57 percent of the 4-county region’s jobs were located in
the city of Milwaukee. By 2000, that figure had dropped to 38 percent.

14
Table 1. Job Decentralization in the Milwaukee Region
1970 1980 1990 2000 % Change, 1970-2000
Milwaukee (city)
293,800 306,697 314,960 285,260 -2.9
Milwaukee County
420,000 456,126 483,594 463,914 10.5
Ozaukee County
16,400 22,037 30,172 39,126 138.6
Waukesha County
62,700 105,833 160,711 209,068 178.6
Washington County
17,400 26,773 36,574 48,482 233.4
Metro Total
516,500 610,769 711,021 760,590 47.3
Source: US Census (1970, 1980, 1990, 2000). Journey to Work.
Although it is clear that employment has decentralized, our objective is to determine more
specifically how decentralization has affected access to job opportunities for low-income
residents. To do so, it is first necessary to determine how employment opportunities for low-
income persons will be measured. Studies have done this in different ways. Some studies simply
include all job locations in the region (San Luis Obispo Council of Governments, 1998). This,
however, clearly overstates prospective job opportunities for low-income persons since it
includes many positions for which such persons are unlikely to be qualified. Other studies have
singled out the largest employers in the region (North Central Florida Regional Planning
Council, 1999). This is also problematic because the largest employers may not be the ones most
likely to hire low-income persons. Some studies focus specifically on entry-level positions
(Lacombe, 1998; Thakuriah et al., 1999). This seems appropriate since most low-income job
seekers are likely to be looking for entry-level jobs.
Our study uses employment projections from the Wisconsin Department of Workforce
Development report, Wisconsin Projections, 1998-2008. The report identifies occupations with
the largest number of projected annual openings requiring short-term, on-the-job training in the
4-county Milwaukee region. This data source is particularly useful because it includes those
entry-level positions for which hiring is likely to be greatest. We selected the 10 occupations
projected to produce the highest number of new job openings during the 1998-2008 period. The

15
Department of Workforce Development projects that these 10 occupations will yield an average
of 6,568 job openings per year from 1998-2008. Table 2 lists these occupations and employment
projections.
Table 2. Occupations with the Largest Number of Annual Openings Requiring Short-Term, On-The-Job Training, 1998-2008.
Occupation Projected Annual Openings, 1998-2008 (4-County Region)
% of Total Annual Openings
Retail Salespersons 1,068
16.3
Cashiers 1,000
15.2
Office Clerks, General 870
13.2
Waiters & Waitresses 816
12.4
Food Prep/Service Workers, Fast Food
545 8.3
Food Preparation Workers
500 7.6
Helpers/Laborers/Movers, NEC
488 7.4
Janitors & Cleaners 455
6.9
Assemblers & Fabricators, NEC
415 6.3
Hand Packers & Packagers
411 6.3
Total
6,568 100
Source: Wisconsin Department of Workforce Development, Wisconsin Projections, 1998-2008.
To determine the employers most likely to hire workers in these occupations, we converted the
occupations to businesses using the US Department of Labor’s industry-occupation matrix. We
then identified the locations of these businesses using SNAP data from the Wisconsin
Department of Workforce Development. The SNAP database contains the addresses of all
Wisconsin employers covered under the state’s unemployment insurance laws. Using this
method, we identified a total of 13,987 prospective employers of low-income residents in the
4-county region. Map 3 shows the locations of these businesses. Many of them are located

16
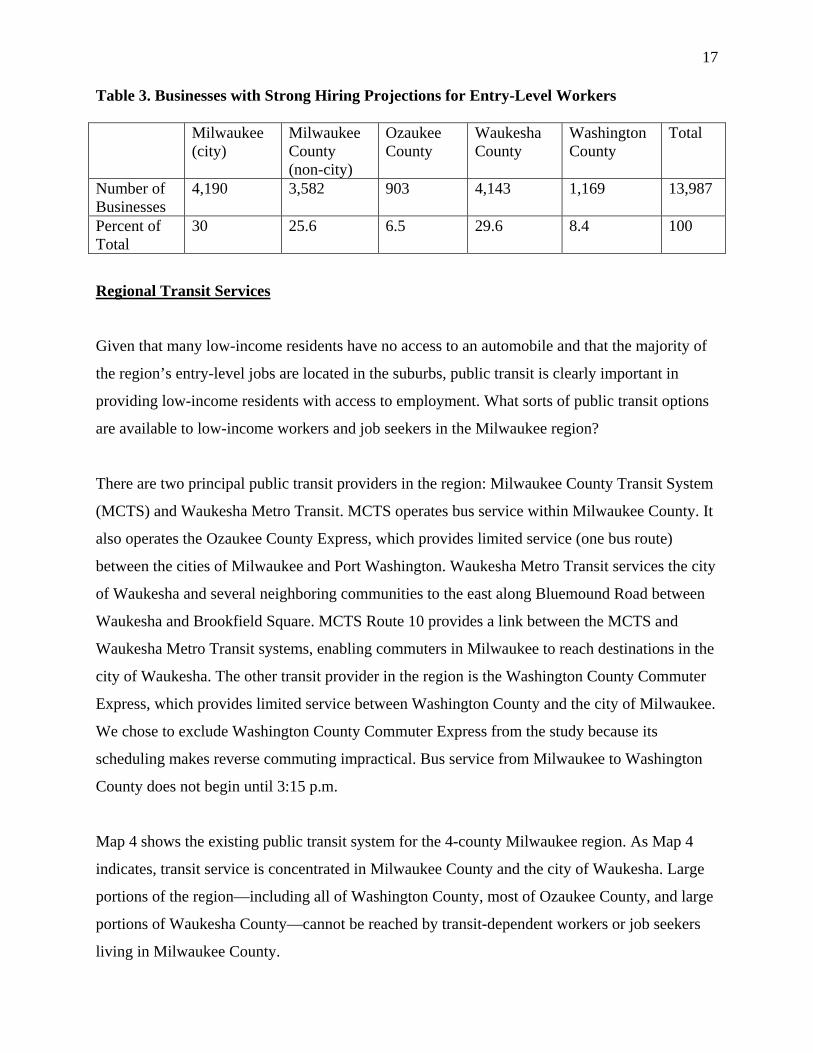
outside of the city of Milwaukee. As Table 3 shows, 4,190 employers (30 percent of total) are
located within the city of Milwaukee, while 9,797 employers (70 percent of total) are located
elsewhere in the 4-county region.
17
Table 3. Businesses with Strong Hiring Projections for Entry-Level Workers Milwaukee
(city) Milwaukee County (non-city)
Ozaukee County
Waukesha County
Washington County
Total
Number of Businesses
4,190 3,582 903 4,143 1,169 13,987
Percent of Total
30 25.6 6.5 29.6 8.4 100
Regional Transit Services
Given that many low-income residents have no access to an automobile and that the majority of
the region’s entry-level jobs are located in the suburbs, public transit is clearly important in
providing low-income residents with access to employment. What sorts of public transit options
are available to low-income workers and job seekers in the Milwaukee region?
There are two principal public transit providers in the region: Milwaukee County Transit System
(MCTS) and Waukesha Metro Transit. MCTS operates bus service within Milwaukee County. It
also operates the Ozaukee County Express, which provides limited service (one bus route)
between the cities of Milwaukee and Port Washington. Waukesha Metro Transit services the city
of Waukesha and several neighboring communities to the east along Bluemound Road between
Waukesha and Brookfield Square. MCTS Route 10 provides a link between the MCTS and
Waukesha Metro Transit systems, enabling commuters in Milwaukee to reach destinations in the
city of Waukesha. The other transit provider in the region is the Washington County Commuter
Express, which provides limited service between Washington County and the city of Milwaukee.
We chose to exclude Washington County Commuter Express from the study because its
scheduling makes reverse commuting impractical. Bus service from Milwaukee to Washington
County does not begin until 3:15 p.m.
Map 4 shows the existing public transit system for the 4-county Milwaukee region. As Map 4
indicates, transit service is concentrated in Milwaukee County and the city of Waukesha. Large
portions of the region—including all of Washington County, most of Ozaukee County, and large
portions of Waukesha County—cannot be reached by transit-dependent workers or job seekers
living in Milwaukee County.

18
Access to Jobs by Low-Income Residents
How effectively does public transit meet the commuting needs of low-income workers and job
seekers in the Milwaukee region? To answer this question, our first step was to determine the
degree to which low-income residents have access to transit. Map 5 shows the location of high-
poverty census block groups and bus routes in the 4-county region.1 Because our geographic data
for families with incomes below the poverty line consists of census block groups rather than
personal addresses, we were unable to determine access to transit with great precision. However,
our analysis does suggest that most low-income families in the region have good access to
transit. All high-poverty census block groups are located within ¼ mile of a bus route.
1 High poverty census block groups were defined as block groups in which 20 percent or more families had incomes below the poverty threshold.

19

20
Our next step was to determine which businesses in the region representing the most likely
employers of low-income residents are accessible by public transit. Map 6 shows regional bus
routes and the locations of businesses with strong hiring projections for entry-level workers. It is
clear from Map 6 that many of these businesses cannot be reached by public transit. Using GIS
analysis, it is possible to determine more precisely what percentage of these businesses are
located within walking distance of bus routes. Our analysis shows that:
• 59.1 percent of businesses with strong hiring projections for entry-level workers are located
within ¼ mile of bus lines.
• 63.5 percent of businesses with strong hiring projections for entry-level workers are located
within ½ mile of bus lines.
These figures represent a first cut at determining how well public transportation provides low-
income residents with access to job opportunities. However, these numbers clearly overstate the
percentage of prospective employers of low-income residents accessible by public transit. This is
the case because our analysis thus far does not incorporate commute times. Bus travel can be
time consuming. Inner-city residents traveling to employment sites in distant portions of the
region may be required to make one or more transfers. Realistically, some portion of the
businesses located within ¼ or ½ mile of bus routes are inaccessible to many low-income
persons using public transit because commute times would be excessive.
We wanted to determine what effect bus commute times have on access to employment for the
residents of Milwaukee’s poorest neighborhoods. Map 7 shows the density of families in poverty
in the Milwaukee metropolitan area. We selected two areas where poverty is particularly
concentrated. The first is the Washington Park/Walnut Hill neighborhood on Milwaukee’s west
side. The Washington Park/Walnut Hill neighborhood is bordered by Locust Street to the north,
Vliet Street, to the south, 47th Street to the west, and 29th Street to the east.2 According to 2000
US Census data, 39.9 percent of families in this neighborhood live below the poverty level, while
38.7 percent of households have no access to private vehicles. Eighty-one percent of
neighborhood residents are African American.
2 Our neighborhood boundaries do not correspond precisely with officially recognized neighborhood boundaries because we drew them based on where poverty was most heavily concentrated.

21

22
The second area we selected is the Near South Side. This neighborhood is bordered by Pierce
Street to the north, Rogers Street to the south, 23rd Street to the west, and 9th Street to the east.
According to 2000 US Census data, 32.6 percent of families in this neighborhood live below the
poverty level, while 31.7 percent of households have no access to private vehicles. Sixty-six

23
percent of neighborhood residents are Hispanic; eighty-one percent are minorities. Maps 8 and 9
show these two neighborhoods in detail.

24

25
To estimate commute times from these neighborhoods to high-growth, entry level job locations
accessible by transit, we modeled bus travel patterns using GIS.3 Maps 10 and 11 show the
destinations that can be reached from these two neighborhoods by public transit in a one-hour
commute.4 Our analysis indicates that well below 50 percent of the region’s entry-level jobs with
strong hiring projections can be reached by residents of these neighborhoods in one hour or less.
For Washington Park/Walnut Hill:
• 40.4 percent of businesses (5,646 out of 13,987) with strong hiring projections for entry-level
workers are located within ¼ mile of bus lines and reachable within a one-hour commute.
• 44.2 percent of businesses (6,176 out of 13,987) with strong hiring projections for entry-level
workers are located within ½ mile of bus lines and reachable within a one-hour commute.
For the Near South Side:
• 32.4 percent of businesses (4,537 out of 13,987) with strong hiring projections for entry-level
workers are located within ¼ mile of bus lines and reachable within a one-hour commute.
• 36.3 percent of businesses (5,074 out of 13,987) with strong hiring projections for entry-level
workers are located within ½ mile of bus lines and reachable within a one-hour commute.
These figures suggest that transportation represents a significant barrier to employment for low-
income residents of the 4-county Milwaukee region. Many low-income households do not have
access to an automobile, and public transportation is inadequate to enable them to reach a large
percentage of potential employers.
3 To model bus commute times, we assigned speed and travel times to each route segment for the entire MCTS and Waukesha Transit systems. Average travel times were assigned to routes from a travel speed determined by calculating distance and travel time between origin point and destination point. Travel speeds range from 25 mph (Route 143) to 10.7 mph (Route 10), but most are close to 15 mph. Because our data did not include bus stops, we assumed that points where bus routes intersected represented potential transfer points. All possible transfer point information was stored in a database table to calculate travel time in GIS software, and we estimated a one-hour commuting zone from the center point of both the Washington Park/Walnut Hill and the Near South Side neighborhoods. In the commuting time calculation, walking time to get to the first bus stop and waiting time for the first bus arrival is not included. The intersection of North Avenue and 35th Street was used as the center point for the Washington Park/Walnut Hill neighborhood. The intersection of Greenfield Avenue and Cesar Chavez Drive was used as the center point for the Near South Side. 4 The selection of one hour as the maximum commute time was based in part on US Census data, which indicates that only 3.7 percent of all commuters in the Milwaukee region spend more than one hour commuting to work.

26

27

28
Recent Developments in Regional Transportation
Our findings take on added significance when recent developments concerning the future of
transportation in the Milwaukee region and southeastern Wisconsin are taken into account.
Several years ago, at the request of the Wisconsin Department of Transportation, the
Southeastern Wisconsin Regional Planning Commission (SEWRPC) initiated a major study of
the 270-mile freeway system in the 7-county Southeastern Wisconsin region. SEWRPC is the
Metropolitan Planning Organization (MPO) for Southeastern Wisconsin. MPOs are
organizations of elected officials from throughout the region that have responsibility to conduct
regional transportation planning and to prioritize transportation projects for state and federal
funding.
The purpose of SEWRPC’s freeway study was to identify options for reconstruction of the
system. Much of the freeway system in Southeastern Wisconsin was built in the 1960s and early
1970s. According to SEWRPC, the system is approaching the end of its 40- to 50-year design
life and will need to be rebuilt during the next 30 years.
SEWRPC’s study considered three options for rebuilding the freeway system:
• Rebuild the system as is;
• Rebuild the system incorporating modern design standards to address safety and other
concerns;
• Rebuild the system incorporating modern design standards and adding new highway lanes to
accommodate projected traffic increases.
In March 2003, SEWRPC’s 25-member study advisory committee voted 14-9 in favor of the
third option. This option calls for rebuilding the entire existing freeway system and adding
additional freeway lanes on approximately 127 miles of the system to address growing traffic
congestion. This includes adding lanes on 19 miles of the freeway system located within the city
of Milwaukee. In May 2003, SEWRPC incorporated the recommendations of the freeway
advisory committee into its long-range transportation plan for Southeastern Wisconsin.
SEWRPC’s recommended option for rebuilding the regional highway system is the most
expensive of the three options considered. Table 4 shows SEWRPC’s estimated construction

29
costs for each option. SEWRPC estimates that the total cost of its preferred option will reach
$6.23 billion. If implemented, SEWRPC’s plan will consume a large share of Southeastern
Wisconsin’s state and federal transportation funds during the next 30 years (roughly $208
million annually). The commitment of funds to a 30-year, $6.23 billion program of highway
improvements will significantly compromise the region’s ability to address shortcomings with
public transit and other non-automobile-related transportation infrastructure.
Table 4. Projected Construction Costs for Freeway Reconstruction Design Options Option Description Incremental Cost Total Projected Cost Option 1 Rebuild system as is $3.37 billion $3.37 billion Option 2 Incorporate modern design
standards $2.15 billion $5.52 billion
Option 3 Provide additional highway lanes $0.71 billion $6.23 billion Source: SEWRPC
MCTS, the principal public transit provider in the region, already faces a significant funding
crisis. As a result of budget constraints, the Milwaukee County Board approved a 25-cent bus
fare increase in 2003 that has made MCTS the most expensive bus-only transit system in the 48
contiguous states. In addition, MCTS has implemented a series of service reductions during the
past several years. Table 5 shows the impact of these service reductions. Scheduled bus miles fell
from 22.2 million in 2000 to 19.7 million in 2003, a decline of 11 percent.
Table 5. MCTS Bus Operations, 2000-2003 2000 2001 2002 2003 Scheduled Miles 22,196,312 21,849,130 20,756,207 19,745,234 Scheduled Hours 1,650,523 1,621,094 1,541,903 1,468,383 Total Passengers 62,418,330 60,036,791 56,691,658 55,825,185 Source: MCTS
MCTS uses ridership data for individual bus routes to determine which routes to eliminate or
curtail. Because ridership is generally lowest on routes serving outlying areas in Milwaukee
County, those areas of the county have been disproportionately affected by service reductions.
This is potentially troublesome from a job access standpoint because it compromises the ability
of central city residents to reach job growth centers in outlying areas of Milwaukee County.

30
Conclusion
Our analysis confirms the existence of a significant spatial mismatch between job opportunities
and low-income populations in the Milwaukee region. Most of the region’s job growth in recent
decades has been concentrated in the suburbs. In addition, the majority of businesses with strong
hiring projections for entry-level workers are in suburban locations. The vast majority of the
region’s low-income residents, by contrast, live in central city neighborhoods far removed from
many of the region’s job growth centers.
Public transit is only partially effective in connecting inner-city residents with job opportunities
in the region. Many low-income residents have good access to public transit, and the majority of
businesses most likely to employ low-income workers are located within walking distance of
transit. However, many of these businesses remain inaccessible to residents of Milwaukee’s
poorest neighborhoods because bus travel would involve commutes well in excess of one hour
both to and from work.
Choices presently being made about the future of transportation in Southeastern Wisconsin will
shape the region’s transportation infrastructure for years to come. If we continue along the
present trajectory—massive public investments in highway reconstruction and reduced funding
for public transit—the outcome is clear. Ultimately, we will find ourselves with two
transportation systems, separate and unequal—one, a state-of-the-art highway network whose
principal beneficiaries are white, middle-class suburban residents; the other, an underfunded
public transit system serving as the transportation of last resort for the region’s least privileged
residents.
The policy implications of following this trajectory are far reaching. Doing so jeopardizes the
prospects of the W-2 program by preventing welfare recipients from accessing some of the
region’s most lucrative job locations. It also raises questions of environmental justice, given new
federal requirements that regional transportation plans address the transportation needs of all
citizens, including low-income and minority residents. In the long run, it will compromise the
ability of policymakers to address the problem of concentrated poverty by further isolating the
poorest Milwaukee neighborhoods from other parts of the city and the region.

31
Another possibility—one we believe better serves the interests of all the region’s residents—
would be to scale back SEWRPC’s planned $6.23 billion highway reconstruction plan and use
the money saved to fund regional transit improvements. We find SEWRPC’s recommendations
that more than $700 million be spent for construction of new highway lanes particularly
objectionable. Although there is a lack of consensus on this issue in the transportation literature,
some studies have provided convincing evidence that adding new highway lanes provides only a
short-term fix for traffic congestion problems (Downs, 1992; Transportation Research Board,
1995). We believe this money would be better spent supporting alternatives to automobile use.
As in most cities, the spatial mismatch between inner-city residents and suburban job growth
centers is a significant problem in the Milwaukee region. However, the situation here is far from
hopeless. Many employers are currently located within walking distance of transit, as are most of
the region’s low-income residential neighborhoods. A targeted expansion of the public transit
systems serving the region could put a substantial majority of the region’s entry-level employers
within commuting distance of many low-income residents. The problem right now is that we are
moving in the opposite direction. As the transit system shrinks, access to jobs by low-income
residents is increasingly curtailed. It will take significantly greater vision and foresight than
policymakers have recently shown to reverse the course we are presently on. Should we fail to
do so, the price will be a region increasingly divided by race and class.

32
REFERENCES Delaware Valley Regional Planning Commission. (1999). Access to opportunities in the Delaware Valley region. Philadelphia: Delaware Valley Regional Planning Commission. Delaware Valley Regional Planning Commission. (1998). Access-to-jobs: Addressing barriers to bi-state commuting. Philadelphia: Delaware Valley Regional Planning Commission. Downs, A. (1992). Stuck in traffic: Coping with peak-hour traffic congestion. Cambridge, MA: The Lincoln Institute of Land Policy. Federal Highway Administration. (2000). Transportation and environmental justice: Case studies. Washington, DC: US Department of Transportation. Holzer, H.J. (1991). The spatial mismatch hypothesis: What has the evidence shown? Urban Studies 28: 105-122. Ihlanfeldt, K.R. (1992). Job accessibility and the employment and school enrollment of teenagers. Kalamazoo, MI: W.E. Upjohn Institute for Employment Research. Ihlanfeldt, K.R., & Sjoquist, D.L. (1998). The spatial mismatch hypothesis: A review of recent studies and their implications for welfare reform. Housing Policy Debate 9: 849-892. Jargowski, P.A. (1997). Poverty and place: Ghettos, barrios, and the American city. New York: Russell Sage Foundation. Kain, J. (1968). Housing segregation, Negro employment, and metropolitan decentralization. Quarterly Journal of Economics 82: 175-197. Kasarda, J.D. (1995). Industrial restructuring and the changing location of jobs. In R. Farley, ed., State of the Union: America in the 1990s, Volume I: Economic Trends. New York: Russell Sage Foundation. Lacombe, A. (1998). Welfare reform and access to jobs in Boston. Washington, DC: US Department of Transportation, Bureau of Transportation Statistics. Moss, P., & Tilly, C. (1991). Why black men are doing worse in the labor market: A review of supply-side and demand-side explanations. New York: Social Science Research Council. New Jersey Transportation Planning Authority. (1999). Regional job access and reverse commute transportation plan. Newark: New Jersey Transportation Planning Authority. North Central Florida Regional Planning Council. (1999). Innovative transportation solutions for WAGES participants: Geographic Information System project. Gainsville, FL: North Central Florida Regional Planning Council. San Luis Obispo Council of Governments. (1998). Welfare reform mobility study. San Luis Obispo, CA: San Luis Obispo Council of Governments.

33
Sandler, L., & Umhoefer, D. (2003). Bus fare would be no. 2 in U.S. Milwaukee Journal-Sentinel, 14 October. Thakuriah, P., Soot, S., Metaxos, P., Yanos, G., Dirks, L., Yang, D., & Sternberg, T. (1999). Welfare reform and suburban Chicago transit demand. Chicago: Urban Transportation Center, University of Illinois at Chicago. Transportation Research Board. (1995). Special report 245: Expanding metropolitan highways. Washington, DC: Transportation Research Board, National Research Council. Wheeler, L.A. (1990). A review of the spatial mismatch hypothesis: Its impact on the current plight of the central city in the United States. Occasional Paper No. 137. Syracuse University, Maxwell School of Citizenship and Public Affairs, Metropolitan Studies Program.


