1 Transportation hazards A book chapter in Transportation Engineers’ Handbook edited by Myer Kutz by Thomas J. Cova and Steven Conger Center for Natural and Technological Hazards Department of Geography University of Utah Salt Lake City, UT 84112-9155 [email protected](801) 581-7930, FAX: (801) 581-8219 May, 2003 Cova, T.J. and Conger, S. (2004) Transportation hazards, in Transportation Engineers’ Handbook , M. Kutz (ed.), in press.
Transcript
1
Transportation hazards
A book chapter in
Transportation Engineers’ Handbook edited by Myer Kutz
by
Thomas J. Cova and Steven Conger Center for Natural and Technological Hazards
Cova, T.J. and Conger, S. (2004) Transportation hazards, in Transportation Engineers’ Handbook, M. Kutz (ed.), in press.
2
1. Introduction
Transportation systems are designed to move people, goods and services efficiently,
economically and safely from one point on the earth’s surface to another. Despite this
broad goal, there are many environmental hazards that commonly disrupt or damage
these systems at a variety of spatial and temporal scales. Whereas road curve geometry
and other engineered hazards can be addressed through design (Persaud, et al., 2000),
hazards such as extreme weather, landslides and earthquakes are much more difficult to
predict, manage and mitigate. These adverse events can dramatically reduce network
serviceability, increase costs, and decrease safety. The economic livelihood of many
individuals, firms, and nations depends on efficient transportation, and this is embodied
in twentieth-century innovations like just- in-time manufacturing and overnight shipping.
As the movement of people, goods, and services increases at all scales due to population
growth, technological innovation, and globalization (Janelle and Beuthe, 1997), the
systematic study of these events becomes increasingly important.
Research in the area of transportation hazards aids governments in allocating scarce
resources to the four phases of emergency management: mitigation, preparedness,
response and recovery. New fields of study are emerging to address this need, as in the
case of Highway Meteorology, which focuses on the adverse effects of extreme weather
on transportation systems (Perry and Symons, 1991). The growing importance of this
particular field in the U.S. can be seen in the recent publication of, “Weather Information
for Surface Transportation – National Needs Assessment Report (OFCM, 2002).” Some
transportation agencies organize special teams to manage and mitigate the effects of one
3
or more of these hazards. Recurrence intervals for an event span from daily to centuries,
while the associated consequences range from inconvenient to catastrophic. In some
cases one event may cause another – torrential rain can trigger a landslide that blocks a
road. Some occur unexpectedly, while others arrive with significant warning, but all are
amenable to some level of prediction and mitigation.
Transportation systems also create hazards. Accelerated movement comes with risks,
and the corresponding accidents that occur disrupt lives and transportation systems daily.
Vehicles collide, trains derail, boats capsize, and airplanes crash often enough to keep
emergency managers and news reporters busy. The transportation of hazardous materials
(HazMat) is a controversial example in this regard because it places substantial
involuntary risks on proximal people and the environment. From the Lusitania to the
World Trade Center, we are occasionally reminded that transportation disasters can be
intentional acts. Lesser-known transportation hazards include elevated irrigation canals,
gas pipelines, and electrical transmission lines. Intramodal risks are present in many
transportation systems, as in wake turbulence behind large aircraft (Gerz, et al., 2002;
Harris, et al., 2002), but intermodal risks are also a significant factor – a train might
collide with a truck at an at-grade crossing (Austin and Carson, 2002; Panchaanathan and
Faghri, 1995), or a river barge might bump a bridge leading to the derailment of a train.
Transportation systems that are disrupted by a hazardous event also play a critical role in
emergency management. Transportation lifelines are generally considered the most
important in an emergency because of their vital role in the restoration of all other
4
lifelines. Emergency managers must route personnel to an accident site, restore lifelines,
relocate threatened populations, and provide relief, all of which rely on transportation.
Research in this area is increasing, and there are many methods and tools to aid in
addressing problems in this domain. The 2000 Cerro Grande Fire in Los Alamos, New
Mexico is a case where a low-capacity transportation network was partially disabled yet
successfully used to manage a large fire and safely relocate more than ten thousand
residents.
This chapter reviews recent research and practice in three areas related to transportation
and hazards: 1) environmental hazards to transportation systems, 2) transportation risks to
proximal people and resources, and 3) the role of transportation in emergency
management.
2. Hazard, vulnerability, and risk
The study of adverse transportation events can be broadly divided into transportation
hazard analysis, vulnerability analysis, and risk analysis. The focus in hazard analysis is
identifying threats to a transportation system, its users, and surrounding people and
resources. This is also referred to as hazard identification. The term ‘hazard’ is often
used to refer to environmental threats like fog, wind, and floods, but transportation
hazards exist at all scales from a sidewalk curb that might trip a pedestrian to the
potential for sea- level rise to flood a coastal highway. In the most general sense, a hazard
is simply a threat to people and things they value. Vulnerability analysis focuses on
variation in the susceptibility to loss from hazardous events. Vulnerability can be viewed
5
as the inverse of resilience, as resiliency implies less susceptib ility to shocks. Risk
analysis incorporates the likelihood of an event and its consequences, where an event can
range from a minor road accident to a dam break that inundates an urban area. For
example, identifying the lifelines in a given area that might be compromised by a
landslide would be transportation hazard analysis. The loss of a lifeline to a landslide, or
a reduction in its service, will have varying consequences depending on the design of the
lifeline, its importance in the system, and the spatial economic consequences to the
region. Analyzing this variation would constitute vulnerability analysis. In risk analysis,
the likelihood of a landslide and its associated consequences would both be incorporated,
often with the goal of identifying potential landslides that represent an ‘unacceptable’
risk. The following sections review these three areas in greater depth.
2.1. Hazard analysis
There are many questions that drive transportation hazard analysis. In the simplest case,
we could assemble a list of the potential hazards that might affect transportation systems
in a region. This could be accomplished by creating a hazard matrix (hazard against
travel mode) that indicates whether a given hazard threatens a mode. The next level
would be to identify where and when these events might occur. This is typically
approached from two perspectives. In one case, we might map the potential for each
hazard in a region and overlay areas of high hazard with road, rail, pipeline, and
transmission networks to identify points where the two coincide. In the second case, we
could select a link and inventory its potential hazards. The first approach requires a
method for hazard mapping. This can be further divided into deductive and inductive
6
modeling approaches to hazards mapping (Wadge, et al, 1993). In a deductive approach,
an analyst builds a physical process model using governing equations. For example, if
landslides are the hazard in question, one could use slope instability equations to
determine landslide hazard along a road. In an inductive approach to landslide hazard
mapping, an empirical study is undertaken to map past events to determine the conditions
that lead to their occurrence. Areas with similar characteristics are then identified, often
with techniques in map overlay, because they may also be hazardous. The line between
inductive and deductive approaches should not be drawn too sharply because most hazard
analyses rely on both. For example, past events may be studied to help build a deductive
process model.
There are a number of important dimensions in transportation hazard analysis, most
notably the spatial and temporal scales. The spatial scale includes both the extent of the
study and the resolution or detail. The spatial extent might be global, national, regional,
local, or an individual link in a network. Detail and spatial extent are correlated, but as
computer storage continues to increases, this is weakening, and we may soon see national
(or larger) studies with very fine spatial and temporal detail. The temporal extent and
resolution are also important. A central question is the time-horizon of the study, which
can range from a single time period (cross sectional) to any duration (longitudinal). Time
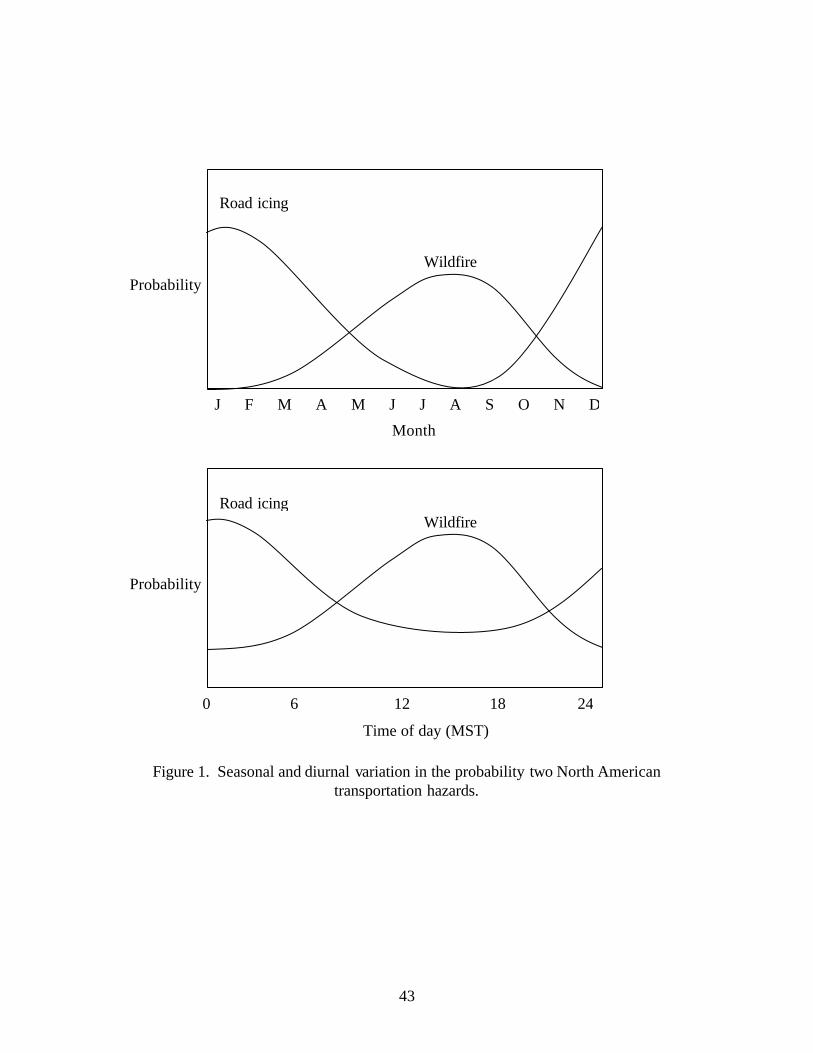
is also important because of the many cycles that affect the potential for hazards. Road
icing is most common at night in the winter, thus it varies seasonally and diurnally.
Landslides occur more often during the rainy season, avalanches occur in the winter and
7
fires during the dry season. Figure 1 depicts the changing likelihood of hazardous events
over time, and this becomes more important in risk analysis.
[Figure 1 about here.]
2.2. Vulnerability analysis
Vulnerability is an increasing focus in researching threats to transportation systems
(Berdica, 2002; Lleras-Echeverri and Sanchez-Silva, 2001; Menoni, et al., 2002). There
are many definitions for hazard vulnerability in the research literature (Cutter, 1996). As
noted, vulnerability in a transportation context recognizes that susceptibility is not
uniform across people, vehicles, traffic flow, infrastructure, and the environment.
Vulnerability can refer to the physical vulnerability of the users or the potential for an
incident to decrease the serviceability of the transportation system. Vulnerability in a
transportation context can also be approached from the point of view of network
reliability, as a reliable network is less vulnerable, and Berdica (2002) links these two
concepts. For an example of differing road network vulnerability, a road accident in a
two-way tunnel may temporarily cripple a regional transportation system leading to
significant delays, but a system with a separate tunnel in each direction would be less
vulnerable to an incident halting traffic in both directions. People and environmental
resources in proximity to a transportation corridor are also vulnerable to adverse events.
For example, in transporting hazardous materials along a populated corridor,
vulnerability along the corridor may vary significantly from point to point, and two
potential incidents a few miles apart can have very different outcomes. There are also
8
regional economic vulnerabilities because adverse events can disrupt commerce.
Individuals can miss meetings, retail outlets can lose customers, commodities can be
delayed, and tourism can be adversely impacted, all of which have economic
consequences.
2.3. Risk analysis
The most common definition of risk incorporates both the likelihood of an event and its
consequences. It is not possible to avoid all risks, only to choose from risk-benefit trade-
offs (Starr, 1969). Kaplan and Garrick (1981) define risk as a set of triplets:
(s, p, c) (1)
where s is a scenario, p its probability and c its consequences. Risk analysis can be
viewed as the process of enumerating all triplets of interest within a spatial and temporal
envelope. The probability of a scenario varies inversely with its consequences, which is
embodied in the concept of a risk curve (figure 2). In Kaplan and Garrick’s framework,
the definition of a scenario can be arbitrarily precise. For example, one scenario might be
an intoxicated driver speeding on a wet road at night, while another might be an
earthquake induced landslide above a town. The concept of vulnerability enters the
triplet through the consequence term, which varies as a function of the unique
vulnerabilities of the scenario elements. In accident analysis, the consequence term can
be held constant for comparison purposes, as in a road casualty. This effectively
removes the c term, which allows an analyst to focus on estimating p for different
9
scenarios and levels of risk exposure (Thorpe, 1964; Chapman, 1973; Wolfe, 1982). An
example would be comparing the probability of a daytime versus nighttime road casualty.
It is difficult to estimating p for extreme events with little historical data, and Bier, et al.
(1999) provide an excellent survey of current methods to address this problem.
[Figure 2 about here.]
A thought experiment might help convey the related concepts of hazard, vulnerability,
and risk in a transportation context. Imagine two motorcyclists riding in adjacent lanes
with the hazard in question being a crash. All characteristics of the drivers, vehicles, and
the environment are equal. We would say that the two face the same hazard,
vulnerability, and risk because the likelihood and consequences of either motorcyclist
crashing are equal. To understand vulnerability, place a helmet on one rider. The
likelihood of a crash has not been altered, but both the vulnerability and the risk of the
rider with the helmet have decreased. Now, imagine that both riders are wearing a
helmet, but the surface of one lane is wet. The vulnerability of both drivers is equal, but
the likelihood of a crash is higher (as is the risk) for the rider in the wet lane. To make it
tricky, imagine that the rider in the wet lane is wearing a helmet, but the rider in the dry
lane is not. One has a greater likelihood of a crash and the other a greater vulnerability to
a crash, but which rider is at greater risk? An empirical approach to this problem would
be to compare the casualty rate for motorcyclists wearing a helmet in rainy conditions
with the rate for riders without a helmet in dry conditions, attempting to control for all
other variables.
10
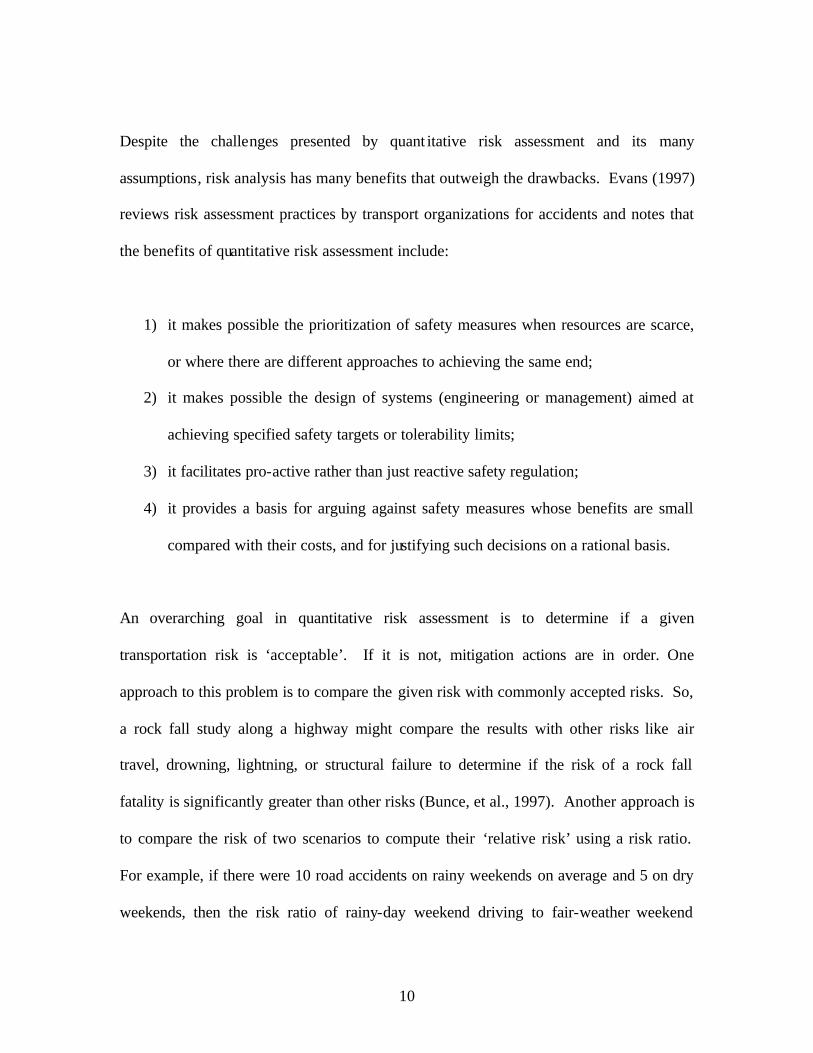
Despite the challenges presented by quant itative risk assessment and its many
assumptions, risk analysis has many benefits that outweigh the drawbacks. Evans (1997)
reviews risk assessment practices by transport organizations for accidents and notes that
the benefits of quantitative risk assessment include:
1) it makes possible the prioritization of safety measures when resources are scarce,
or where there are different approaches to achieving the same end;
2) it makes possible the design of systems (engineering or management) aimed at
achieving specified safety targets or tolerability limits;
3) it facilitates pro-active rather than just reactive safety regulation;
4) it provides a basis for arguing against safety measures whose benefits are small
compared with their costs, and for justifying such decisions on a rational basis.
An overarching goal in quantitative risk assessment is to determine if a given
transportation risk is ‘acceptable’. If it is not, mitigation actions are in order. One
approach to this problem is to compare the given risk with commonly accepted risks. So,
a rock fall study along a highway might compare the results with other risks like air
travel, drowning, lightning, or structural failure to determine if the risk of a rock fall
fatality is significantly greater than other risks (Bunce, et al., 1997). Another approach is
to compare the risk of two scenarios to compute their ‘relative risk’ using a risk ratio.
For example, if there were 10 road accidents on rainy weekends on average and 5 on dry
weekends, then the risk ratio of rainy-day weekend driving to fair-weather weekend
11
driving would be 10 / 5 = 2, or twice as risky, assuming that the amount of driving
(aggregate exposure) was roughly the same from weekend to weekend.
3.0 Hazards to transportation systems
There are many environmental hazards that may damage or disrupt transportation
systems, and we only review the more common ones here. For example, figure 3 depicts
familiar road hazards grouped by their principal effect along with some of their causal
relationships. In general, road hazards can: 1) compromise the quality of the surface, 2)
block or damage infrastructure, 3) compromise user visibility, 4) compromise steering, 5)
create a temporary obstacle, or 6) some combination of the prior five. From the figure, it
is clear that rain, wind, and earthquakes have causal links with many other hazards. Rain
and earthquakes can both induce a flood, landslide, rock fall or debris flow. Earthquakes
can also start a fire or result in a toxic release. Extreme wind can kick up dust, start a
fire, drive smoke from a fire, blow trees and debris into the roadway, or redeposit snow
leading to an avalanche. This is only a sample of the many hazards and relationships that
might exist. Hazards can also coincide, as in a nighttime earthquake in severe rain. This
section reviews recent research in the analysis of many of these hazards, but it should not
be considered comprehensive. The review is multi-modal and driven primarily by these
questions:
[Figure 3 about here.]
• What is the hazard?
12
• What has been done to address the hazard in research and practice?
• What travel modes does the hazard affect?
• How well can we predict the hazard in space and time?
• What are the consequences of the hazard and how are they defined and measured?
• What mitigation actions exist and what might be developed?
3.1. Avalanches
An avalanche is a sudden transfer of potential energy inherent in a snow pack into kinetic
energy. The principal contributing factors include snow, topographic effects, and wind
which can redeposit snow. ‘Snow structure’ refers to the composition of its vertical
profile, which can become instable as new layers are added. An avalanche occurs when
the strength of the snowpack no longer exceeds the internal and external stresses.
Avalanches are typically divided into ‘dry or wet’ and ‘loose or slab’ avalanches. Dry
slab avalanches accelerate rapidly and can reach speeds in excess of 120 miles per hour,
but wet avalanches move much slower.
The systematic study of ava lanches in North America dates back to the 1950’s in Alta,
Utah. Figure 4 depicts the most active and damaging slide paths in Alta. The most
useful, general reference is McClung and Schaerer’s (1993) avalanche handbook.
Avalanches typically reduce the serviceability of a road, but they can also damage
infrastructure and cause injury or death. Other modes affected include rail, pipelines and
transmission lines. The science of predicting the timing of avalanches is called
forecasting (Schweizer, et al., 1998), and it has improved significantly over the last fifty
13
years. Snow pits, weather instrumentation, field observation, and remote sensing are
combined to forecast avalanches. The corridors that receive the greatest attention are
those with high traffic volume and a documented avalanche history. Avalanche path
identification using terrain and vegetation is also a common task in areas where historical
records may not be available.
[Figure 4 about here.]
Three challenges that transportation agencies face in avalanche control include: 1)
selecting paths where mitigation would be most beneficial, 2) evaluating mitigation
measures, and 3) comparing the risks of different roads. The avalanche-hazard index
(Schaerer, 1989) combines forecasting with traffic flow volumes to address these needs.
The index includes the likelihood of vehicles being impacted by an avalanche along a
road as well as the potential consequences. It also incorporates the observation that loss
of life can occur when a neighboring ava lanche overcomes traffic halted by another slide.
The composite avalanche-hazard index for a road is:
∑∑ +=i j
wijmijj PPwI )( (2)
Where Pmij is the likelihood with which moving traffic might be hit by an avalanche of
class j at path i, Pwij is the likelihood with which waiting traffic might be hit by an
avalanche of class j at path i , and wj is the consequence of an avalanche of class j. The
14
index can also be calculated separately for each avalanche path along a road to determine
where mitigation would make the largest contribution to overall hazard reduction.
A number of avalanche risk case studies for transportation corridors have been performed
that include Glacier National Park (Schweizer, et al., 1998), the Colorado Front Range
(Rayback, 1998), and the Himalaya (De Scally and Gardner, 1994). Avalanche
mitigation options, increasing in cost, include explosives, snow sheds, and deflection
dams. Rice, et al. (2000) provide an example of system for automatically detecting
avalanches on rural roads.
3.2. Earthquakes
The study of earthquakes and seismic risk spans many fields in the sciences and social
sciences. They are widely researched by transportation engineers from a variety of
perspectives because they can severely damage and disrupt transportation systems. A
devastating earthquake epitomizes a low-probability high-consequence event in risk
analysis. The recurrence interval for a large earthquake in a region can be centuries,
varying inversely with magnitude, yet devastating earthquakes occur almost every year
somewhere in the world. For many populated areas without a history of severe
earthquake loss, the likelihood of facing an earthquake that damages transportation
lifelines is a near certainty because the geologic record reveals past large earthquakes
(Clague, 2002). No major transport mode is exempt from the adverse affects of an
earthquake. Roadways, railways, pipelines, transmission lines, and air and sea ports can
all be damaged with tremendous economic costs (Cho, et al., 2001). Earthquakes can
15
also start fires, trigger landslides (Refice and Capolongo, 2002), release toxic chemicals
(Lindell and Perry, 1996), cause dam failures, and create sudden earthen dams via
landslides leading to inevitable flooding (Schuster, 1986).
Pre-impact earthquake research in transportation engineering focuses on vulnerable
structures like bridges (Malik, 2000), tunnels (Hashash, et al., 2001), and water delivery
systems (Chang, et al., 2002). The central problem is estimating the response
characteristics of these structures to ground shaking and liquefaction (Price, et al., 2000;
Selcuk and Yuceman, 2000; Sevtap and Semih, 2000; Romero, et al., 2000). Werner
(1997) notes that earthquake losses to highway systems depend not only on the response
characteristics of the highway components, but also on the nature of the overall highway
system’s configuration, redundancy, capacity and traffic demand (see also Basoz and
Kiremidjian, 1996). For example, two bridges may be equally susceptible to ground
shaking, but one may be much more important in serving the daily travel demand to an
important destination. Retrofitting is typically in high order when a bridge highly
susceptible to the effects of an earthquake is also essential in serving a large volume of
travel demand.
Post-impact earthquake research focuses on immediate damage assessment (Park, et al.,
2001), the performance of the transportation system (Chang, 2000), and the lifeline
restoration process (Isumi, et al., 1985; Opricovic and Tzeng, 2002). Chang (2000)
examines post-earthquake port performance following the Kobe quake in 1995 and
frames the economic loss (and thus vulnerability) in terms of three types of traffic: 1)
16
cargo originating from or destined to the immediate hinterland, 2) cargo from/to the rest
of Japan, and 3) foreign transshipment cargo. By examining the pre and post conditions
of these cargo types, Chang concludes that (2) and (3) suffered the most resulting in both
short-term loss of revenue and long-term loss of competitive position. Economic impacts
may last beyond the point where the infrastructure has been repaired. Kobe demonstrates
that (3) is especially important, and the central port vulnerability question can be framed
as the percent that a port's revenue is tied to transshipment cargo.
3.3. Floods and dam breaks
Floods cause the greatest loss in many countries because they occur frequently and their
severity is compounded by dense development along many rivers. The National Weather
Service (NWS) in the U.S. estimates that greater than half of all flood-related deaths
occur in vehicles at low-water crossings. Flood damage to transportation systems
represents one of the largest losses in the public sector. Intense rainfall is the chief cause
of floods, but hurricanes also hold the potential to cause a significant amount of storm
surge inundation. Dam breaks are included here as a special type of technologically-
induced flood. This includes earthen dam breaks caused by earthquake- induced
landslides (Schuster, 1986). The modeling of dam breaks has increased in recent years
because agencies such as the U.S. Bureau of Reclamation (USBR) are required to submit
a report and associated inundation animations of potential dam breaks to local emergency
managers downstream from all dams for emergency planning purposes.
17
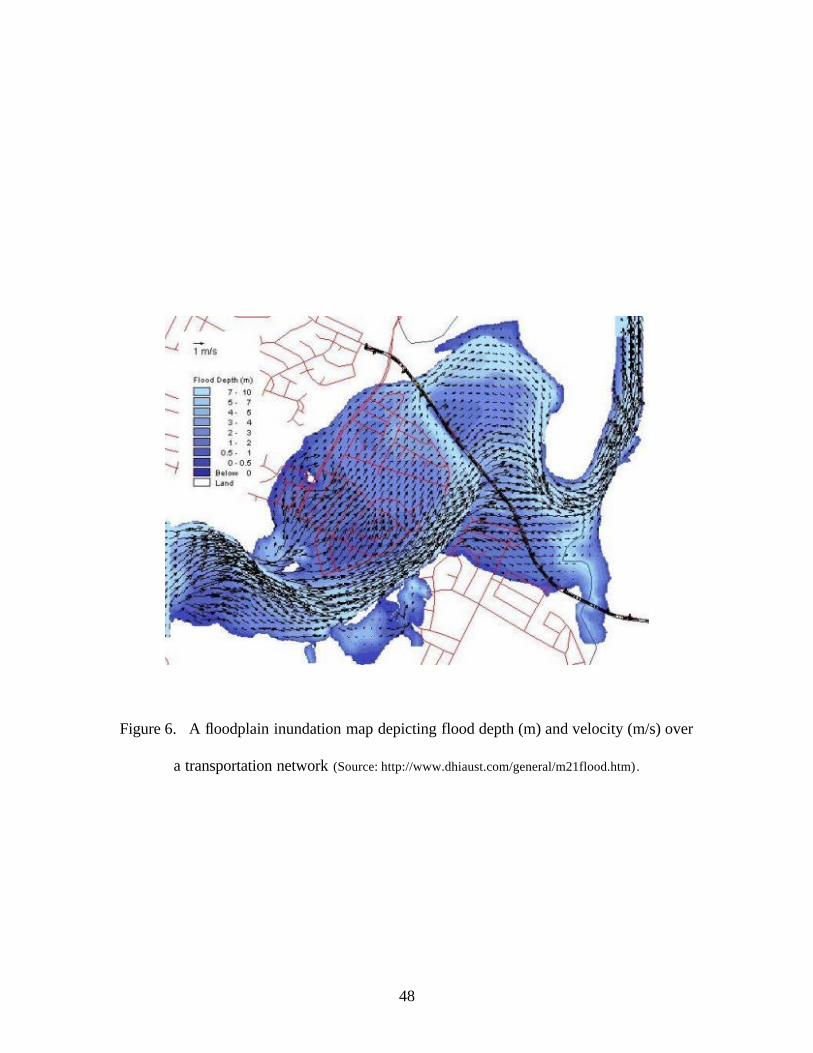
Figure 5 depicts an example of modeling flooding across a transportation network. The
depth of the flood is shown in meters with the direction and velocity of the flood depicted
using a vector field. This example is output from the MIKE 21 flood simulation system
for modeling two-dimensional free surface flows. The system can model many
conditions that occur in a floodplain including flooding and drainage of floodplains,
embankment overtopping, flow through hydraulic structures, tidal forces, and storm
surge. MIKE 21 is an excellent example of a deductive process-oriented hazard mapping
approach because the system solves non-linear equations of continuity and conservation
of momentum for flooding.
[Figure 5 about here.]
Flooding is a serious problem in many areas because of its ability to rapidly degage the
serviceability of a transportation network at various points. Ferrante, et. al. (2000)
combine a numerical model for flood propagation in urban areas with a network path-
finding algorithm to identify “least- flood-risk” paths for rescuing people as well as
providing relief. They use Dijkstra’s (1959) shortest path algorithm, but the cost of a link
is calculated in a very novel manner using the flood flow depth and velocity across the
road. In this way, the “cost” of traversing a link is a function of both the length of the
road as well as its flood characteristics:
vh
ijij
Lc
αα= (?)
18
where cij is the cost/risk of traversing the link, Lij is the length of the link, hα is a
parameter (0-1) related to food height and vα is a parameter related to water velocity (0-
1). Each alpha parameter decreases as flood height or velocity increases, respectively,
until the maximum allowable flood height (e.g. .3 m) or velocity (e.g. 1 m/s) is reached,
whereby they become 0. At this point, link cost is infinite, and it is no longer traversable.
So, the travel cost of a link without flooding is its length, but as flood height and velocity
across the link increase, its cost and risk quickly increase. This example links a hazard
process model with a network algorithm, which points to a valuable opportunity for
analysts, as many hazards reduce the serviceability of network links. Real-time path
finding in a network degraded by a hazard is a very valuable application. The challenge
is to develop a means for acquiring accurate, timely information on the hazard as well as
to manage and convey the uncertainty in the results.
3.4. Fog, dust, smoke, sunlight and darkness
Fog, dust, smoke, sunlight and darkness are transportation hazards that compromise the
visibility of system users. This hazard category does not apply to pipeline networks,
transmission lines, and other networks where visibility is not an issue. From a roadway
perspective, Perry and Symons (1991) provide an excellent source on these hazards.
Musk (1991) thoroughly covers the fog hazard, and Brazel (1991) describes a dust storm
case-study for Arizona. Although smoke from wildfires routinely disrupts roadways and
inhibits operations at airports each summer, it appears to be an under-researched topic in
transportation hazards. Darkness also has an understandably adverse effect on road
safety, especially when combined with fog, smoke or dust.
19
Fog can cause spectacular road accidents involving hundreds of vehicles on a roadway.
Musk (1991) describes the Fog Potential Index (FPI) which expresses the susceptibility
of a location p on a road to thick radiation fog on a scale from 0 to 100. The values of
two locations are comparative in that a value of 30 at location A and a value 20 at
location B means that location A should experience 50% more hours of thick radiation
fog than location B. The index is of the form:
estdIp 321010 +++= (3)
where d is the distance of the location p from standing surface water, t is a function of the
local topography at p (e.g. hill or valley), s is a function of the road site topography (e.g.
bridge or embankment), and e incorporates other environmental features likely to affect
the formation of radiation fog (e.g. proximity to power station cooling). The index
coefficients are weights that affect the relative importance of the variables. This index
can be applied at any linear resolution, but 1 km is common. The index can then be
tested against in situ observations of visibility.
3.5. Rain, snow and ice
Rain, snow and ice are common hazards that compromise visibility and the quality of a
road, rail or airport surface (Benedetto, 2002; Andrey, 1990). All road users are familiar
with road signs like “slippery when wet” or “bridges may be icy” (Carson and
Mannering, 2001). Ice is also a hazard for aircraft because of its effect on lift, as well sea
20
travel because it creates obstacles (Tangborn and Post, 1998). In a road network context,
skidding is the most common explanation for accidents that occur in the context of these
hazards. The skidding rate is the statistic used to quantify this factor, which is the
percentage of accidents where one or more vehicles are reported to have skidded (Perry
and Symons, 1991). Example skidding rates for cars are given in figure 6 for Great
Britain in 1987. This figure shows that rain roughly doubles the percentage of accidents
where skidding is a factor over dry conditions, and snow and ice quadruple the rate over
dry conditions. The overall skidding rate for cars for all road conditions is about 14%.
[Figure 6 about here.]
The question of how rain, snow, and ice affect the total number of road accidents is not
straightforward. Palutikof (1983) found that people drive more carefully in snow or
simply postpone or cancel journeys. This leads to reduction in the total number of
accidents over that which would be expected. Rain does not seem to have the same effect
on travel decision making, and Brodsky and Hakkert (1988) found that the number of
accidents increases in wet conditions. Al Hassan and Barker (1999) found a slightly
greater drop in traffic activity owed to inclement weather on the weekend (> 4%) than on
weekdays (< 3%). In a case study of Chicago, Bertness (1980) found that rain roughly
doubled the number of road accidents with the greatest effect in rural areas. It is
important to keep in mind that rain, snow, and ice studies tend to underestimate the risk
because road accidents are typically underreported.
21
Hazards that affect the road surface represent the most costly maintenance function for
many cities, counties, and state transportation departments. Salt is the most common
road de-icer with about 10,000,000 tons applied each year in the U.S. (Perry and
Symons, 1991). This is expensive and comes with environmental side effects. Eriksson
and Norman (2001) note that road weather information systems have a very high benefit-
cost ratio in reducing weather-related risk. The widespread adoption of Doppler radar
has greatly improved the reporting of precipitation, and some systems can now report
rain- intensity to levels as detailed as an individual street segment. There is much work in
developing and installing in situ road sensors to automatically detect poor road
conditions. This can greatly improve road maintenance procedures because managers
can apply mitigation measures like salt where it is most needed.
3.6. Landslides, rock fall, and debris flow
Many miles of roads, rail, and pipeline travel through areas with rock faces and steep
slopes in mountainous terrain. Geomorphic hazards that commonly affect transportation
corridors include landslides, rock fall, and debris flow. A debris- flow is essentially a
fast-moving landslide. These hazards can damage or reduce the serviceability of
infrastructure, crush or bury vehicles, and result in death. In some cases they occur
without little or no warning, but they are typically preceded by intense rain (Al Homoud,
et al., 1999). They can also be earthquake or volcanically induced (Dalziell and
Nicholson, 2001) and create sudden earthen dams that lead to flooding (Schuster, et al.,
1998). An excellent, general source on landslides and debris flows is the Transportation
Research Board (TRB) report on Landslides edited by Turner and Schuster (1996). In
22
terms of case studies, Marchi et al. (2002) examine ten years of debris flows in the Italian
Alps, Evans and Savigny (1994) examine landslides in Canada, He, et al. (2002) looked
at debris flows along the China-Nepal Highway, Budetta (2002) conducted a risk
assessment for a 1 km stretch of road subject to debris flows in Italy, and Petley (1998)
examined geomorphic road hazards along a stretch of road in Taiwan. Fish and Lane
(2002) discuss a rock-cut management system, and Franklin and Senior (1997) describe a
rock fall hazard rating system.
Bunce, et al. (1996) provide an excellent example method for assessing the risk of loss of
life from rock fall along a highway. They used rock fall impact-mark mapping
supplemented by documented rock fall records to establish a rock fall frequency for the
Argillite Cut on Highway 99 in British Columbia. The method relies on separate
calculations for the risk of a rock hitting a stationary vehicle versus a moving vehicle, as
well as a moving vehicle hitting a rock on the road. The probability that a one or more
vehicles is hit is given as:
NHSPSP ))|(1(1)( −−= (4)
where )|( HSP is the probability that a vehicle occupies the portion of the road affected
by a rockfall and N is the number of rocks that fall. This equation states that the
probability of a vehicle being hit is one minus the probability that a vehicle is not hit.
With a series of assumptions, they estimate the risk of death due to rockfall for a one-
time road user and daily commuter at .00000006 and .00003 per year, respectively.
23
3.7. Wind, tornados and hurricanes
Wind is a significant hazard to road, rail, sea, and air transport (Perry and Symons, 1994).
Gusts, eddies, lulls, and changes in wind direction are often greatest near the ground in
extreme wind episodes. In these episodes, the majority of fatalities are generally
transport related. It is difficult to summarize the effects of wind on road and rail
transport because little data exists, although it is generally viewed as less of a hazard than
ice, snow, and rain. Figure 7 depicts wind that is blowing smoke across an interstate and
blocking traffic. Perry and Symons (1994) divide the wind hazard into three categories:
direct interference with a vehicle, obstructions, and indirect effects. Direct interference
includes its effects on vehicle steering, which may push one vehicle into another or run a
vehicle off the road. Extreme winds can overturn high-profile trucks and trains when the
wind vector is orthogonal to the direction of travel because the force of the wind is
proportional to the vehicle area presented (Baker, 1988). Wind can impede transport by
blowing dust or smoke across a road, which can reduce visibility. It can also blow trees
and other debris onto a road or railway and create temporary obstacles. Indirect effects
include the redeposition of snow leading to an avalanche, as well as its adverse effect on
bridges and air and sea-based termini. Overall, wind can impede transport operation or
damage vehicles and infrastructure, all of which can result in economic impacts, injuries,
and fatalities.
[Figure 7 about here.]
24
Air transport faces the greatest hazard from wind. A violent downdraft from a
thunderstorm (microburst) on takeoff or landing is one example, but any exceptionally
large local wind gradient (wind shear) can affect lift adversely at low altitudes
(Vorobtsov, 2002; Goh and Wiegmann, 2002). In many air disasters, wind is considered
the primary contributing factor. Small aircraft are much more vulnerable to in-flight
storms and are often warned to completely avoid storms. Measures to reduce wind
hazard include permanent wind breaks, warnings, road closures, and low-level wind shear
alert systems. An airport wind-warning system generally consists of a set of
anemometers that are analyzed by computer. A warning is issued when levels differ by
some threshold. Automated wind-warning systems for individual roads may appear soon
because of advances in weather instrumentation. The finest level that wind warnings are
commonly issued is at a county scale. Improved weather forecasting is generally viewed
as the principal means for reducing the hazard (Perry and Symons, 1994).
Hurricanes and tornados represent special cases of extreme winds. Due to satellite, radar,
and other in situ sensor networks, their prediction has greatly increased in recent years.
Much of the transportation research in this area focuses on evacuation. Wolshon (2001)
reviews the problems and prospects for contraflow freeway operations to reduce the
vulnerability of coastal communities by reversing lanes to increase freeway capacities in
directions favorable for evacuation. This problem is simple conceptually but represents a
significant challenge for both traffic engineers and emergency managers.
3.8. Wildlife
25
Wildlife is a familiar hazard to most drivers because of the many warning signs along
roadways. Wildlife accidents typically result in vehicle damage, but they can also result
in injury or death. Two common examples of wildlife hazards include the threat that
undulates such as moose (Joyce and Mahoney, 2001) present to vehicles and the threat
that birds present to aircraft. The number of these collisions is staggering, and it is
estimated that in 1991 greater than half a million deer were killed by vehicles in the
United States (Romin and Bissonnette, 1996). Lehnert and Bissonette (1997) review
research on deer-vehicle collisions and describe a field experiment on the effectiveness of
highway crosswalk-structures as a means of mitigation. The crosswalk system evaluated
forces deer to cross at specific areas that are well marked for motorists. Although deer
fatalities decreased by 42% following the installation of the crosswalks, they were unable
to attribute this reduction to the crosswalks because there was an 11% probability that it
may have occurred by chance.
Bird hazards to aircraft are also a significant concern, and Lovell and Dolbeer (1999)
provide a recent review with a study to validate the results of the U.S. Air Force (USAF)
bird avoidance model (BAM). BAM provides information to pilots regarding elevated
bird activity based on refuge surveys, migration dates, and routes. Lovell and Dolbeer
note that since 1986, birds have caused 33 fatalities and almost $500 million in damage to
USAF aircraft alone. On average, USAF aircraft incur 2,500 bird strikes a year with
most occurring in the fall and spring migration. Waterfowl and raptors account for 69%
of the damaging strikes to low-level flying military aircraft. Lovell and Dolbeer found
26
that BAM predicted significantly higher hazard for routes where bird strikes have
occurred in the past and thus can assist in minimizing strikes.
4.0 Transportation as hazard
In addition to the many environmental hazards that threaten transportation systems,
transportation itself presents hazards to people, property, and the environment. Road
traffic accidents are the most common example, and the majority of transportation
casualties in most countries can be attributed to road accidents. The contributing factors
for road accidents are typically classified into those associated with the driver, vehicle,
and the environment. Contributing factors associated with the driver include error,
speeding, experience, and blood-alcohol level. Factors associated with the vehicle
include its type, condition, and center of gravity. Environmental factors include the
quality of the infrastructure, weather, and obstacles. The majority of road accidents are
attributed to driver factors (Evans, 1991), and this holds for many other modes such as
boats (Bob-Manuel, 2002), bicycles (Cherington, 2000), snow mobiles (Osterom and
Eriksson, 2002) and all terrain vehicles (Rogers, 1993). Taken together, this implies that
most transportation casualties in the world are road accidents chiefly attributed to the
driver. Not surprisingly, research on driver factors represents the largest area of
transportation hazards research (see the journal Accident Analysis & Prevention).
Transportation accidents have severe effects on those directly involved, as well as side
effects to others. Other effects might include severe traffic delays leading to missed
meetings, lost sales to businesses, delayed commodity shipments, and increased
insurance costs. Research in accident analysis spans all modes and typically focuses on
27
assessing the role of various driver, vehicle, and environmental factors as well as
methods for mitigating accidents. (See chapter on incident management).
In addition to common traffic incidents, there are also low-probability high-consequence
transportation events that place risks on people and environmental resources in proximity
to transportation corridors and ports. Rail, road, pipeline, and marine HazMat transport is
the prime example in this area because it places considerable involuntary risks on people
(and resources) who do not perceive much benefit to the transport of hazardous materials.
HazMat has been studied from a number of perspectives for many materials and modes,
so there are numerous frameworks for analysis (Bonvicini, et al., 1998; Cassini, 1998;
Erkut and Ingolfsson, 2000; Fabiano, et al., 2002; Helander and Melachrinoudis, 1997;
Jacobs and Warmerdam, 1994; Klein, 1991). Aldrich (2002) provides an historic
perspective on rail HazMat shipments from 1833 to 1930, and Cutter (1997) reviews
recent trends in hazardous material spills. Caputo and Pelagagge (2002) present a system
for monitoring pipeline HazMat shipments. Singh, et al. (2002) examine the spontaneous
coal combustion in sea transport. Raj and Pritchard (2000) present a risk analysis tool
used by the Federal Railway Administration. Hwang, et al. (2001) present a
comprehensive risk analysis approach for all modes that includes 90% of the dangerous
chemicals. Abkowitz, et al. (1990) describe a method for evaluating the economic
consequences of HazMat trucking. Verter and Kara (2001) review HazMat truck routing
in Canada. Dobbins and Abkowitz (2002) look at inland marine HazMat shipments.
Saccommano and Haastrup (2002) focus on HazMat risks in tunnels. Marianov, et al.
28
(2002) propose that proximal communities receive a tax reduction to offset the risk of
proximal HazMat shipments.
Following the events of September 11th 2001, transportation security has become a
national research priority led by the Transportation Security Administration (TSA)
recently reorganized under the Department of Homeland Security. Transportation
terrorism has not been a focus of transportation hazards researchers in the past, so there is
little to review at this point. However, reports and proposals are beginning to surface that
indicate that this will be one of the largest areas of transportation hazards research for
many years.
5.0 Transportation in emergency management
Transportation lifelines are vital during an emergency, and play an important role in all
four phases of emergency management: mitigation, preparedness, response, and recovery.
The concern in the mitigation phase is reducing the likelihood of an event, its
consequences, or both. The focus of the preparedness phase is improving operational
capabilities to respond to an emergency such as training emergency personnel, installing
notification systems, and redeploying resources to maximize readiness (Sorensen, 2001).
The mitigation and preparedness phases both help reduce the impact of hazardous events.
The response phase begins immediately following an event, and this is when plans
devised in the preparedness phase as well on-the-fly plans are activated. Common
concerns include evacuating and sheltering victims, providing medical care, containing
the hazard, and protecting property and the environment. The recovery phase addresses
29
longer-term projects like damage assessment and rebuilding, which feeds back into the
mitigation phase because this phase presents an opportunity to rethink hazardous areas.
Mitigation strategies for specific hazards and assets were discussed in the prior section on
hazards to transportation systems. The overarching challenge in the mitigation phase is
identifying and prioritizing mitigation projects in a region and allocating scarce resources
to their completion. Benefit-cost analysis is a valuable method in this regard, but it must
be preceded by risk assessments for all potential hazards. The effectiveness of the
mitigation strategy is also important, and this can be considered part of the benefit.
Research in the preparedness and response phase has been fueled by new technologies.
Enhanced 911 (E-911) is a significant relatively recent innovation, and this is covered in
the chapter on incident management. Relevant topics that are actively researched in this
phase include optimally locating emergency teams (List and Turnquist, 1998), locating
and stocking road maintenance stations, optimal fire station location for urban areas and
airports (Revelle, 1991; Tzeng and Chen, 1999), and installing hazard-specific warning
systems. Evacuation planning in this phase focuses on delimiting emergency planning
zones (Sorensen, et al., 1992), designing and simulating evacuations (Sinuany-Stern and
Stern, 1993; Southworth, 1991; Cova and Johnson, 2002), developing and testing
evacuation routing schemes (Dunn, 1993; Yamada, 1996; Cova and Johnson, 2003), and
identifying potential evacuation bottlenecks (Cova and Church, 1997). Reverse 911
systems that allow police to call evacuees are becoming increasingly important in dealing
with notification. State-of-the-art systems allow emergency managers to send custom
30
messages with departure timing and routing instructions to zones defined on-the-fly with
a mouse. Other research in the preparedness and response phase include methods for
keeping roadways open following an earthquake or landslide (Santi, et al, 2002).
One problem that complicates emergency planning by transportation agencies is the
increasing amount of development in many hazardous areas. This is nearly universal as
populations increase in floodplains, coastal areas subject to hurricanes, fire-prone
wildlands, areas near toxic facilities (Johnson and Zeigler, 1986), regions at-risk to
seismic activity, and so on. This presents a problem because in many of these areas (and
at many scales) the transportation system is not being improved to deal with these
increasing populations. This means that evacuating threatened populations is becoming
increasingly difficulty at all scales, as new development occurs. In other words,
vulnerability to environmental hazards is continually increasing owed both to the fact that
populations in hazardous areas are increasing at the same time that the ability of
emergency managers to invoke protective actions such as evacuation are decreasing.
Figure 8 show two maps from Cova and Johnson (2002) that show the effect of a new
road on household evacuation times for a community at risk to wildfire near Salt Lake
City. Before the construction of the new road, homes in the back of the canyon had the
greatest evacuation times, as the sole road out of the canyon would get congested. In this
scenario, the average vehicle departure-time following notification to evacuate was 10
minutes and the average number of vehicles per household was 2.5, so it can be
considered a reasonably urgent evacuation when most residents are home. Note that
houses in the back of the canyon stand to gain much more from the construction of the
31
new exit because their evacuation times decrease much more than homes near the
original exit from this community. Also, all evacuation times become more consistent
because the second exit reduces the delay caused by everyone using one exit. Viewed
another way, the new exit reduces the number of households per exiting road from 250/1
= 250 to 250/2 = 125.
[Figure 8 about here.]
6.0 New technologies There are many new technologies that hold promise to aid transportation agencies in
reducing the effects of transportation hazards. Weather instrumentation is prime example
that is improving both in terms of breadth of measurement, as well as the number of
installed road weather stations. The suite of geospatial technologies including the global
positioning system (GPS), geographic information systems (GIS), and remote sensing
also hold much promise to improve the amount of information available to transportation
users, planners, and emergency responders. The recent formation of the National
Consortia for Remote Sensing in Transportation (NCRST) is dedicated to this task
(Gomez, 2002). The consortia are divided into four themes that include hazards,
environment, infrastructure, and flow. NCRST Hazards (NCRST-H) is the most relevant
in the context of applying geospatial technologies to monitoring and mitigating
transportation hazards.
A simple benefit of GPS in accident analysis is that it is an inexpensive means for greatly
improving the locational component of crash data (Graettinger, 2001). Remote sensing
32
can be used to detect and monitor fires, volcanoes (Oppenheimer, 1998), landslides,
avalanches, and many other hazards. One technology that is having a significant affect
on the study of transportation hazards is geographic information systems (GIS). For a
comprehensive review of GIS in transportation (GIS-T) see Miller and Shaw (2001). GIS
is being used in transportation applications such as mapping collision data (Arthur and
Waters, 1997; Austin, et al., 1997), routing HazMat shipments (Brainard, et al., 1996;
Lepofsky, et al., 1993), identifying hazardous highway locations (Spring and Hummer,
1995), modeling the vulnerability of populations to toxic spills (Chakraborty and
Armstrong, 1996), among many other transportation hazard applications.
7.0 Conclusion
Transportation and hazards is a growing field in terms of research and practice. New
methods for predicting and mitigating hazards are continually being developed, and
researchers are linking these methods and models to tasks in transportation planning and
mitigation. Globalization is increasing our dependence on transportation systems at all
scales. For this reason, disruptions will only become more costly and important to
mitigate. New information technologies are converging that promise to drastically
change this field in the coming years. These technologies are emerging during a shifting
emphasis toward transportation security. This will bring information-based research on
reducing the effects of transportation terrorism to the forefront of this research area.
Finally, development in hazardous areas is increasingly along with corresponding
increases in traffic volumes along many lifelines at-risk to hazards. This will present
substantial challenges to transportation researchers and analysts for the foreseeable
future.
33
References Abkowitz, M., Cheng, P.D.M., and Lepofsky, M. (1990) Use of geographic information systems in managing hazardous materials shipments, Transportation Research Record, 1261, 35-43. Aldrich, M. (2002) Regulating transportation of hazardous substances: railroads and reform, 1883-1930, Business History Review, 76 (2): 267-297. Al Hassan, Y., Barker, D.J. (1999) The impact of unseasonable or extreme weather on traffic activity within Lothian region, Scotland, Journal of Transport Geography, 209-213. Al Homoud, A.S., Prior, G., and Awad, A. (1999) Modeling the effect of rainfall on instabilities of slopes along highways, Environmental Geology, 37: 317-325. Andrey, J. (1990) Relationships between weather and traffic safety: past, present, and future directions, Climatological Bulletin, 24: 124-136. Arthur, R., and Waters, N. (1997) Formal scientific research of traffic collision data utilizing a GIS, Transportation Planning and Technology, 21: 121-137. Austin R.D., and Carson J.L. (2002) An alternative accident prediction model for highway-rail interfaces, Accident Analysis and Prevention, 34: 31-42. Austin, K., Tight, M., and Kirby, H. (1997) The use of geographical information systems to enhance road safety analysis, Transportation Planning and Technology, 20: 249-266. Baker, C.J. (1988) High-sided articulated lorries in strong cross winds, Journal of Wind Energy and Industrial Aerodynamics, 31: 67-85. Basoz, N., and A. Kiremidjian (1996) Risk assessment for highway transportation systems. Stanford, Calif.: J. A. Blume Earthquake Engineering Center, Dept. Civil Eng., Stanford, University. Report No. 118. Benedetto, A. (2002) A decision support system for the safety of airport runways: the case of heavy rainstorms, Transportation Research Part A: Policy and Practice, 8: 665-682. Berdica, K. (2002) An introduction to road vulnerability: what has been done, is done and should be done, Transport Policy, 9: 117-127. Bertness, J. (1980) Rain related impacts on selected transportation activities and utility services in the Chicago Area, Journal of Applied Meteorology, 19: 545-556.
34
Bier, V.M., Zimmerman, R., Haimes, Y.Y., Lambert, J.H., Matalas, N.C. (1999) A survey of approaches for assessing and managing the risk of extremes, Risk Analysis, 19: 83-94. Bob-Manuel, K.D.H. (2002) Probabilistic prediction of capsize applied to small high-speed craft, Ocean Engineering 29: 1841-1851. Bonvicini, S., Leonelli, P., and Spadoni, G. (1998) Risk analysis of hazardous materials transportation: evaluating uncertainty by means of fuzzy logic, Journal of Hazardous Materials, 62: 59-74. Brainard, J., Lovett, A., Parfitt, J. (1996) Assessing hazardous waste transport using a GIS, International Journal of Geographical Information Science, 10: 831-849. Brazel, A.I. (1991) Blowing dust and highways: the case of Arizona, USA, in Perry, A.H. and Symons, L.J. (eds.), Highway Meteorology, pp.131-161. Brodsky, H., Hakkert, A.S. (1988) Risk of a road accident in rainy weather, Accident Analysis and Prevention, 17: 147-154. Budetta, P. (2002) Risk assessment from debris flows in pyroclastic deposits along a motorway, Italy, Bulletin of Engineering Geology and the Environment, 61: 293-301. Bunce, C.M., Cruden, D.M., Morgenstern, N.R. (1997) Assessment of the hazard from rock fall on a highway. Canadian Geotech Journal, 34: 344-356. Caputo, A.C., and Pelagagge, P.M. (2002) An inverse approach for piping networks monitoring, Journal of Loss Prevention in the Process Industries, 15: 497-505. Carson, J., and Mannering, F. (2001) The effect of ice warning signs on ice-accident frequencies and severities, Accident Analysis & Prevention, 33: 99-109. Cassini P. (1998) Road transportation of dangerous goods: quantitative risk assessment and route comparison, Journal of Hazardous Materials, 61: 133-138. Chakraborty, J., Armstrong, M.P. (1996) Using geographic plume analysis to assess community vulnerability to hazardous accidents. Computers, Environment, and Urban Systems, 19: 341-356. Chang, S.E. (2000) Disasters and transport systems: loss, recovery and competition at the Port of Kobe after the 1995 earthquake, Journal of Transport Geography, 8: 53-65. Chang, S.E., Svekla, W.D., and Shinozuka (2002) Linking infrastructure and urban economy: simulation of water-disruption impacts in earthquakes, Environment and Planning B: Planning and Design 29, 2: 281-301.
35
Changnon, S.A. (1999) Record flood-producing rainstorms of 17-18 July 1996 in the Chicago metropolitan area. Part III: impacts and responses to the flash flooding. Journal of Applied Meteorology, 38: 273-280. Chapman, R. (1973) The concept of exposure. Accident Analysis and Prevention, 5: 95-110. Cherington, M. (2000) Hazards of bicycling: from handlebars to lightning, Seminars in Neurology, 20 (2): 247-253 2000 Cho, S., Shinozuka, M., and Chang, S. (2001) Integrating transportation network and regional economic models to estimate the costs of a large urban earthquake, Journal of Regional Science, 41: 39-65. Clague, J.J. (2002) The earthquake threat in southwestern British Columbia: A geologic perspective, Natural Hazards, 26: 7-34. Collins-Garcia, H., Tia, M., Roque, R., and Choubane, B. (2000) Alternative solvent for reducing health and environmental hazards in extracting asphalt - An evaluation Construction 2000 – Transportation Research Record, 1712: 79-85. Cowen, D.J., Jensen, J.R., Hendrix, C., Hodgson, M.E., Schill, S.R. (2000) A GIS-assisted rail construction econometric model that incorporates LIDAR data. Photogrammetric Engineering and Remote Sensing, 66: 1323-1328. Cova, T.J. (1999) GIS in emergency management. In: Geographical Information Systems: Principles, Techniques, Applications, and Management, P.A. Longley, M.F. Goodchild, D.J. Maguire, D.W. Rhind (eds.), John Wiley & Sons, New York, 845-858. Cova, T.J., and Church, R.L. (1997) Modelling community evacuation vulnerability using GIS. International Journal of Geographical Information Science, 11(8), 763-784. Cova, T.J., and Johnson, J.P. (2002) Microsimulation of neighborhood evacuations in the urban-wildland interface, Environment and Planning A, 34:12, 2211-2229. Cova, T.J., and Johnson, J.P. (2003) A network flow model for lane- level evacuation routing, Transportation Research Part A: Policy and Practice, in press. Cutter, S.L. (1997) Trends in U.S. hazardous materials spills, Professional Geographer, 49: 318-331. Cutter, S. (1996) Vulnerability to environmental hazards, Progress in Human Geography, 20, 529-539 Dalziell, E., and Nicholson, A. (2001) Risk and impact of natural hazards on a road network, Journal of Transportation Engineering, 127: 159-166.
36
De Scally, F.A.,and Gardner, J.S. (1994) Characteristics and mitigation of the snow avalanche hazard in Kaghan Valley, Pakistan Himalaya, Natural Hazards, 9: 197-213. Dobbins, J.P., and Abkowitz, M.D. (2002) Development of an inland marine transportation risk management information system, Marine Transportation and Port Operations; Transportation Research Record, 1782: 31-39. Dunn, C.E., Newton, D., 1992. Optimal routes in GIS and emergency planning applications, Area, 24: 259-267. Eriksson, M., and Norrman, J. (2001) Analysis of station locations in a road weather information system, Meteorological Applications, 8: 437-448. Erkut, E., and Ingolfsson, A. (2000) Catastrophe avoidance models for hazardous materials route planning, Transportation Science, 34: 165-179. Evans S.G., Savigny K.W. (1994) Landslides in the Vancouver-Fraser Valley-Whistler region, Bulletin - Geological Survey of Canada, 481: 251-286. Evans, A.W. (1997) Risk assessment by highway organizations. Transport Reviews, 2: 145-163. Evans, L. (1991) Traffic safety and the driver, Van Nostrand Reinhold : New York. Fabiano, B., Curro, F., Palazzi, E., Pastorino, R. (2002) A framework for risk assessment and decision-making strategies in dangerous good transportation, Journal of Hazardous Materials, 93: 1-15. Ferrante, M., Napolitano, F., Ubertini, L. (2000) Optimization of transportation networks during urban flooding, Journal of the American Water Resources Association, 36: 1115-1120. Fish, M., and Lane, R. (2002) Linking New Hampshire's rock cut management system with a geographic information system, Transportation Research Record, 1786: 51-59. Franklin, J.A., and Senior, S.A. (1997) The Ontario rockfall hazard rating system, Engineering geology and the environment. Proc. symposium, Athens, v. 1, p. 647-656. Fridstrom, L., Ifver, J., Ingebrigtsen, S., Kulmala, R., Thomsen, L.K. (1995) Measuring the contribution of randomness, exposure, weather, and daylight to the variation in road accident counts, Accident Analysis & Prevention, 27: 1-20. Gerz, T., Holzapfel, F., and Darracq, D. (2002) Commercial aircraft wake vortices, Progress in Aerospace Sciences, 38 (3): 181-208.
37
Goh, J., and Wiegmann, D. (2002) Human factors analysis of accidents involving visual flight rules flight into adverse weather, Aviation Space and Environmental Medicine, 73: 817-822. Gomez, R.B. (2002) Hyperspectral imaging: a useful technology for transportation analysis, Optical Engineering, 41: 2137-2143. Graettinger, A.J., Rushing, T.W., and McFadden, J. (2001) Evaluation of inexpensive global positioning system units to improve crash location data, Highway Safety: Modelling, Analysis, Management, Statistical Methods, and Crash Location – Transportation Research Record, 1746: 94-101. Harris, M., Young, R.I., Kopp, F., Dolfi, A., Cariou, J.P. (2002) Wake vortex detection and monitoring, Aerospace Science and Technology, 6: 325-331. Hashash, Y.M.A., Hook, J.J., Schmidt, B., and Yao, J.I.C. (2001) Seismic design and analysis of underground structures, Tunnelling and Underground Space Technology, 16 (4): 247 293. He, Y., Ma, D., and Cui, P. (2002) Debris flows along the China-Nepal Highway, Acta Geographica Sinica, 57: 275-283. Helander, M.E., and Melachrinoudis, E. (1997) Facility location and reliable route planning in hazardous material transportation, Transportation Science, 31: 216-226. Hwang, S.T., Brown, D.F., O'Steen, J.K., Policastro, A.J., and Dunn, W.E. (2001) Risk assessment for national transportation of selected hazardous materials, Multimodal and Marine Freight Transportation Issues, Transportation Research Record, 1763: 114-124. Isumi, N., Nomura, N., Shibuya, T. (1985) Simulation of post-earthquake restoration for lifeline systems, International Journal of Mass Emergencies and Disasters, 87-105. Jacobs, T.L., and Warmerdam, J.M. (1994) Simultaneous routing and siting for hazardous waste operations, Journal of Urban Planning & Development, 120: 115-131. Janelle D.G., and Beuthe, M. (1997) Globalization and research issues in transportation, Journal of Transport Geography, 5: 199-206. Johnson, J.H. and Zeigler, D.J. (1986) Evacuation planning for technological hazards: an emerging imperative, Cities, 148-156. Joyce, T.L., and Mahoney, S.P. (2001) Spatial and temporal distributions of moose-vehicle collisions in Newfoundland, Wildlife Society Bulletin, 29: 281-291. Kaplan, S., and Garrick, B.J. (1981) On the quantitative definition of risk, Risk Analysis, 1: 11-27.
38
Kim, K., and Levine, N. (1996) Using GIS to improve highway safety, Computers, Environment, and Urban Systems, 20: 289-302. Klein, C.M. (1991) A model for the transportation of hazardous waste, Decision Sciences, 22, 1091-1108. Lehnert, M.E. and Bissonette, J.A. (1997) Effectiveness of highway crosswalk structures at reducing deer-vehicle collisions. Wildlife Society Bulletin, 25: 809-818. Lepofsky, M., Abkowitz, M., and Cheng, P. (1993) Transportation hazard analysis in integrated GIS environment, Journal of Transportation Engineering, 119: 239-254. Levine, N., and Kim, K.E. (1998) The location of motor vehicle crashes in Honolulu: a methodology for geocoding intersections, Computers, Environment, and Urban Systems, 22, 557-576. Lindell, M.K., Perry, R.W. (1996) Addressing gaps in environmental emergency planning: hazardous materials releases during earthquakes, Journal of Environmental Planning and Management, 39: 529-543. List, G.F., and Turnquist, M.A. (1998) Routing and emergency-response-team siting for high level radioactive waste shipments, IEEE Transactions on Engineering Management, 45: 141-152. Lleras-Echeverri, G., and Sanchez-Silva, M. (2001) Vulnerability analysis of highway networks, methodology and case study, Proceedings of the Institution of Civil Engineers - Transport, 147: 223-230. Lovell, C.D. and Dolbeer, R.A. (1999) Validation of the United States Air Force Bird Avoidance Model, Wildlife Society Bulletin, 27: 167-171. Malik, A.H. (2000) Seismic hazard study for New York City area bridges, Fifth International Bridge Engineering Conference, Vols. 1 and 2, Transportation Research Record, 1696: 224-228. Marchi, L., Arattano, M., and Deganutti, A.M. (2002) Ten years of debris- flow monitoring in the Moscardo Torrent (Italian Alps), Geomorphology, 46: 1-17. Marianov, V., ReVelle, C., and Shih, S. (2002) Anticoverage models for obnoxious material transportation, Environment and Planning B – Planning & Design, 29: 141-150. McClung, D., and Schaerer, P. (1993) The avalanche handbook, Seattle: The Mountaineers.
39
Menoni, S., Petrini, V., Pergalani, F., Boni, M.P. (2002) Lifelines earthquake vulnerability assessment: a systemic approach, Soil Dynamics and Earthquake Engineering, 22: 1199-1208. Miller, H.J. and Shaw, S-L.(2001) Geographic information systems for transportation: principles and applications, New York: Oxford University Press. Musk, L.F. (1991) Climate as a factor in the planning and design of new roads and Motorways, in Perry, A.H. and Symons, L.J. (eds.), Highway Meteorology, pp. 1-25. (OFCM) Office of the Federal Coordinator for Meteorological Services and Supporting Research (2002) Weather Information for Surface Transportation – National Needs Assesment Report, U.S. Department of Commerce, National Oceanic and Atmospheric Administration (NOAA), FCM-R18-2002. Oppenheimer, C. (1998) Volcanological applications of meterological satellites, International Journal of Remote Sensing, 19: 2829-2864. Opricovic, S., and Tzeng, G.H. (2002) Multicriteria planning of post-earthquake sustainable reconstruction, Computer-Aided Civil and Infrastructure Engineering, 17: 211-220. Osterom, M., and Eriksson, A. (2002) Snow mobile fatalities: aspects on preventive measures form a 25-year review, Accident Analysis & Prevention, 34: 563-568. Panchaanathan, S., and Faghri, A. (1995) Knowledge-based geographic information system for safety analysis at rail-highway grade crossings, Transportation Research Record, 1497, 91-100. Park, G., Cudney, H.H., Inman, D.J. (2001) Feasibility of using impedance-based damage assessment for pipeline structures, Earthquake Engineering and Structural Dynamics, 30: 1463-1474. Perry, A.H., and Symons, L.J. (1991) Highway Meteorology, New York: E & FN Spon. Perry, A.H., and Symons, L.J. (1994) The wind hazard in the British Isles and its effects on transportation, Journal of Transport Geography, 2: 122-130. Persaud, B., Retting, R.A., and Lyon, C. (2000) Guidelines for identification of hazardous highway curves, Highway and Traffic Safety: Crash Data, Analysis Tools, and Statistical Methods, Transportation Research Record, 1717: 14-18. Petley, D.N. (1998) Geomorphological mapping for hazard assessment in a neotectonic terrain. The Geographical Review, 164: 183-201.
40
Price, B.E., Stilson, M., Hansen, M., Bischoff, J., and Youd, T.L. (2000) Liquefaction and lateral spread evaluation and mitigation for highway overpass structure - Cherry Hill Interchange, Davis County, Utah, Soil Mechanics 2000, Transportation Research Record, 1736: 119-126. Raj, P.K., and Pritchard, E.W. (2000) Hazardous materials transportation on US railroads Application of risk analysis methods to decision making in development of regulations, Transportation Research Record, 1707: 22-26. Rayback, S.A. (1998) A dendrogeomorphological analysis of snow avalanches in the Colorado Front Range, Physical Geography, 19: 502-515. Refice, A., and Capolongo, D. (2002) Probabilistic modeling of uncertainties in earthquake- induced landslide hazard assessment, Computers and Geosciences, 28: 735-749. ReVelle, C. (1991). Siting ambulances and fire companies: new tools for planners. Journal of the American Planning Association, 57: 471-484. Rice, R., Decker, R., Jensen, N., Patterson, R., and Singer, S. (2000) Rural intelligent transportation system for snow avalanche detection and warning, Transportation Research Record, 1700: 17-23. Rogers, G.B. (1993) All terrain vehicle injury risks and the effects of regulation, Accident Analysis & Prevention, 25: 335-346. Romero, S., Rix, G.J., and French, S.P. (2000) Identification of Transportation Routes in Soils Susceptible to Ground Motion Amplification in the New Madrid Seismic Zone, Transportation Research Record 1736, Transportation Research Board, National Research Council, Washington, D.C., pp. 127-133. Romin, L.A., and Bissonette, J.A. (1996) Deer-vehicle collisions: status of state monitoring activities and mitigation efforts, Wildlife Society Bulletin, 24: 276-283. Saccomanno, F., and Haastrup, P. (2002) Influence of safety measures on the risks of transporting dangerous goods through road tunnels, Risk Analysis, 22: 1059-1069. Santi, P.M., Neuner, E.J., and Anderson, N.L. (2002) Preliminary evaluation of siesmic hazards for emergency rescue route, U.S. 60, Missouri, Environmental and Engineering Geoscience, 8: 261-277. Schaerer, P. (1989) The avalanche-hazard index, Annals of Glaciology, 13: 241-247. Schuster R.L., Wieczorek, G.F. , and Hope D.G. II. (1998) Landslide dams in Santa Cruz County, California resulting from the earthquake, US Geological Survey Professional Paper 1551-C, p. 51-70.
41
Schweizer, J., Jamieson, B., and Skjonsberg, D. (1998) Avalanche forcasting for transportation corridor and backcountry in Glacier National Park (BC, Canada), in Proceedings of 25 Years of Snow Avalanche Research, E. Hestnes (ed.), Norwegian Geotechnical Institute, publication 203, 238-244. Selcuk, A.S., and Yucemen, M.S. (2000) Reliability of lifeline networks with multiple sources under seismic hazard, Natural Hazards, 21: 1-18. Sevtap, S.A., and Semih, Y.M. (2000) Reliability of lifeline networks with multiple sources under seismic hazard, Natural Hazards 21: 1-18. Singh, R.N., Shonhardt, J.A., and Terezopoulos, N. (2002) A new dimension to studies of spontaneous combustion of coal, Mineral Resource Engineering, 11: 147-163. Sinuany-Stern, Z, and Stern, E. (1993) Simulating the evacuation of a small city: the effects of traffic factors, Socio-Economic Planning Sciences, 27: 97-108. Sorensen, P.A. (2001) Locating resources for the provision of emergency medical services, Ph.D. Dissertation, Department of Geography, University of California Santa Barbara. Sorensen, J., Carnes, S., and Rogers, G. (1992) An approach for deriving emergency planning zones for chemical stockpile emergencies," Journal of Hazardous Materials, 30: 223-242. Southworth, F. (1991) Regional evacuation modeling: a state-of-the-art review. Oak Ridge National Laboratory, ORNL/TM-11740. Spring, G.S., and Hummer, J. (1995) Identification of hazardous highway locations using knowledged-based GIS: a case study, Transportation Research Record, 1497, 83-90. Starr, C. (1969) Societal benefit versus technological risk, Science, 165: 1232-38. Tangborn, W., and Post, A. (1998) Iceberg prediction model to reduce navigation hazards, in Ice in Surface Waters, Shen (ed.), Balkema: Rotterdam, 231-236. Thorpe, J. (1964) Calculating relative involvements rates in accidents without determining exposure, Australian Road Research, 2: 25-36. Turner, A.K., and Schuster, R.L. (1996) Landslides: investigation and mitigation, Transportation Research Board Special Report 247, National Academy Press: Washington, DC.
42
Tzeng, G.H., Chen, Y.W. (1999) The optimal location of airport fire stations: a fuzzy multi-objective programming and revised genetic algorithm approach, Transportation Planning and Technology 23: 37-55. Ullman, G.L. (2000) Special flashing warning lights for construction, maintenance, and service vehicles - Are amber beacons always enough?, Work Zone Safety; Pavement Marking Retroreflectivity, Transportation Research Record, 1715: 43-50. Verter, V., and Kara, B.Y. (2001) A GIS-based framework for hazardous materials transport risk assessment, Risk Analysis, 21: 1109-1120. Vorobtsov, S.N. (2002) Estimation of the hazard of aircraft flight in conditions of shears, of a three-dimensional wind, Journal of Computer and Systems Science International, 41: 703-715. Wadge, G., Wislocki, A., and Pearson, E.J. (1993) Spatial analysis in GIS for natural hazard assessment, in Goodchild, M.F., Parks, B.O. and Steyaert, L.T. (eds.) Environmental Modelling with GIS. Oxford University Press, Oxford. pp. 332-338. Werner, S. and Taylor, C.E., and Moore, J.E. (1997) Loss estimation due to seismic risks to highway systems, Earthquake Spectra, 13: 585-604. Wolfe, A. (1982) The concept of exposure and the risk of a road traffic accident and an overview of exposure data collection methods, Accident Analysis and Prevention, 14: 337-340. Wolshon, B. (2001) ‘One way out’ contraflow freeway operation for hurricane evacuation. Natural Hazards Review, 2: Yamada, T. (1996) A network flow approach to a city emergency evacuation planning, International Journal of Systems Science, 27: 931-936.
43
Figure 1. Seasonal and diurnal variation in the probability two North American transportation hazards.
0 6 12 18 24
Wildfire Road icing
Time of day (MST)
Probability
J F M A M J J A S O N D
Wildfire
Road icing
Month
Probability
44
Figure 2. An example risk curve.
Consequences
Probability
45
Figure 3. Example road hazards grouped by their principle effect including some of their
causal relationships.
Block or Damage Infrastructure
Flood Landslide Rock fall
Debris flow Earthquake Avalanche
Heat
Compromise Visibility
Dust Smoke
Darkness Fog
Compromise Surface
Rain Ice
Snow
Create Obstacles
Trees Debris
Fire Toxic release
Wildlife
Compromise Steering
Wind
Causes or affects
46
Figure 4. The most active avalanche slide paths in Little Cottonwood Canyon, Utah shown with their mean recurrence interval (years), the number of road hits in the last 10 years, the percentage of times they hit the road, and the percentage of the length of the
road they covered (Source: William Naisbitt, Alex Hogle, and Wendy Bates).
47
0.0
5.0
10.0
15.0
20.0
25.0
30.0
35.0
40.0
45.0
50.0
dry wet/flood snow/ice All
Figure 5. Example skidding rates (the percentage of accidents where skidding is a factor) for Great Britain (adapted fro m Perry and Symons, 1991).
48
Figure 6. A floodplain inundation map depicting flood depth (m) and velocity (m/s) over
a transportation network (Source: http://www.dhiaust.com/general/m21flood.htm).
49
Figure 7. A wildfire adjacent to an interstate blocking traffic
(Source: http://www.commanderchuck.com).
50
Figure 8. The effect of the construction of a second access road (dashed line) on household evacuation times in a fire-prone canyon east of Salt Lake City, Utah.