Transportation Impacts of a Cascadia Subduction Zone Earthquake Presentation to the Tacoma Transportation Club Maj Gen Bret Daugherty, The Adjutant General Robert Ezelle, Emergency Management Director Lt Col Clay Braun, Deputy J3 & J35, WA NG (Domestic Operations) 13 November 2017 1
Transcript
Transportation Impacts of a Cascadia Subduction Zone Earthquake
Presentation to the Tacoma Transportation Club
Maj Gen Bret Daugherty, The Adjutant GeneralRobert Ezelle, Emergency Management Director
Lt Col Clay Braun, Deputy J3 & J35, WA NG (Domestic Operations)
13 November 2017
1
EMD MissionEMD leads and coordinates mitigation, preparedness, response and
recovery in Washington State to minimize the impact of disasters and emergencies on the people, property, environment and economy.
2
National Response Framework (NRF)
• Guidance for all-hazards response
• Partnership between all levels of government:
– Local government responds first
– State government assists as needed
– Federal government assistance as the last resort
3
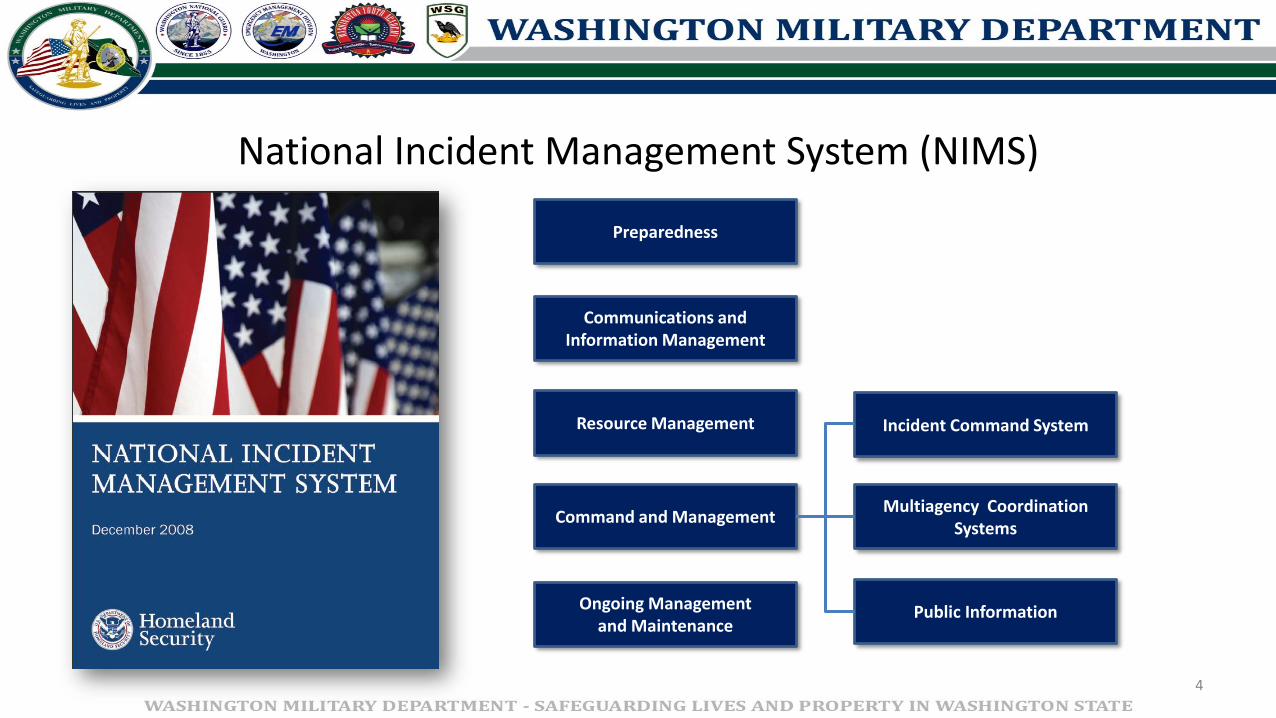
National Incident Management System (NIMS)
Preparedness
Communications and Information Management
Resource Management
Command and Management
Ongoing Managementand Maintenance
Incident Command System
Multiagency Coordination Systems
Public Information
4
Incident Command System (ICS)
• Common terminology
• Chain of command
• Unity of command
• Management by objectives
• Scalable, modular organization
• Manageable span of control
• Comprehensive resource management
• Integrated communications
• Accountability
Incident Commander
Finance/AdministrationLogisticsPlanningOperations
5
NIMS/ICS Across All Levels of Government
On-scene Command
Off
-sce
ne
Co
ord
inat
ion
Incident Command Post withIncident Command/Unified Command/Type III, II, or I Incident Management Team
City/County Emergency Operations Centerand elected Officials
State Emergency Operations Centerand elected officials
Re
sou
rce
s
Joint Field Office with Unified Coordination Group
Re
qu
est
s an
d In
form
atio
n
Delegation of Authority
Mutual Aid:EMAC, PNEMA
Mutual Aid:WAMAS
Mutual Aid:LE, Fire, EMS
6
Washington’s Disaster Experience
2017 Federal Declarations
1 Major Disaster (Severe Winter Storms, Flooding, Landslides, and Mudslides)
1 Small Business Administration Disaster Loan Declaration
3 Fire Management Assistance
2016 Federal Declarations
2 Small Business Administration Disaster Loan Declarations
4 Fire Management Assistance
2015 Federal Declarations
4 Major Disasters (Historic Fires; Windstorm; Nov Severe Storm; Dec Severe Storm)
12 Fire Management Assistance
6 Small Business Administration Disaster Loan Declarations
7
2014 Federal Declarations
2 Major Disasters (SR530 Landslide/Central Washington Firestorm)
8 Fire Management Assistance
5 Small Business Administration Disaster Loan Declarations
2013 Federal Declarations
3 Fire Management Assistance
1 Small Business Administration (Skagit River Bridge, economic injury loans)
2012 Federal Declarations
2 Major Disasters (January winter storm, July high winds and flooding)
6 Small Business Administration Disaster Loan Declarations
8 Fire Management Assistance
7
FMAG Totals: 38
Major Disaster Declarations:
Fire 2
Windstorm 2
Winter Storms 4
Landslide 1
SBA 21
Washington’s Disasters Over Time
Since 1956 – 152 Federal Declarations
• 53 Major Disasters
• 7 Emergency Declarations
• 92 Federal Fire Suppression/Management Declarations
Washington’s Probability of an Earthquake in the Next 50 Years – Get Prepared Now
An increase of 1 in magnitude results in 32x more energy released by an earthquake. Thus, an M7.0 releases 32x more energy than a M6.0, and an M8.0 releases 1024x the energy of an M6.0!
Areas of circles to the right represent relative energy release for M 6, 7, 8, and 9 earthquakes
10-20% Probability
M9.0+
25-40% Probability
M8.0+
84% ProbabilityDeep Earthquake
M7.0
M6.0
The CSZ ThreatWith focus on Transportation
Infrastructure
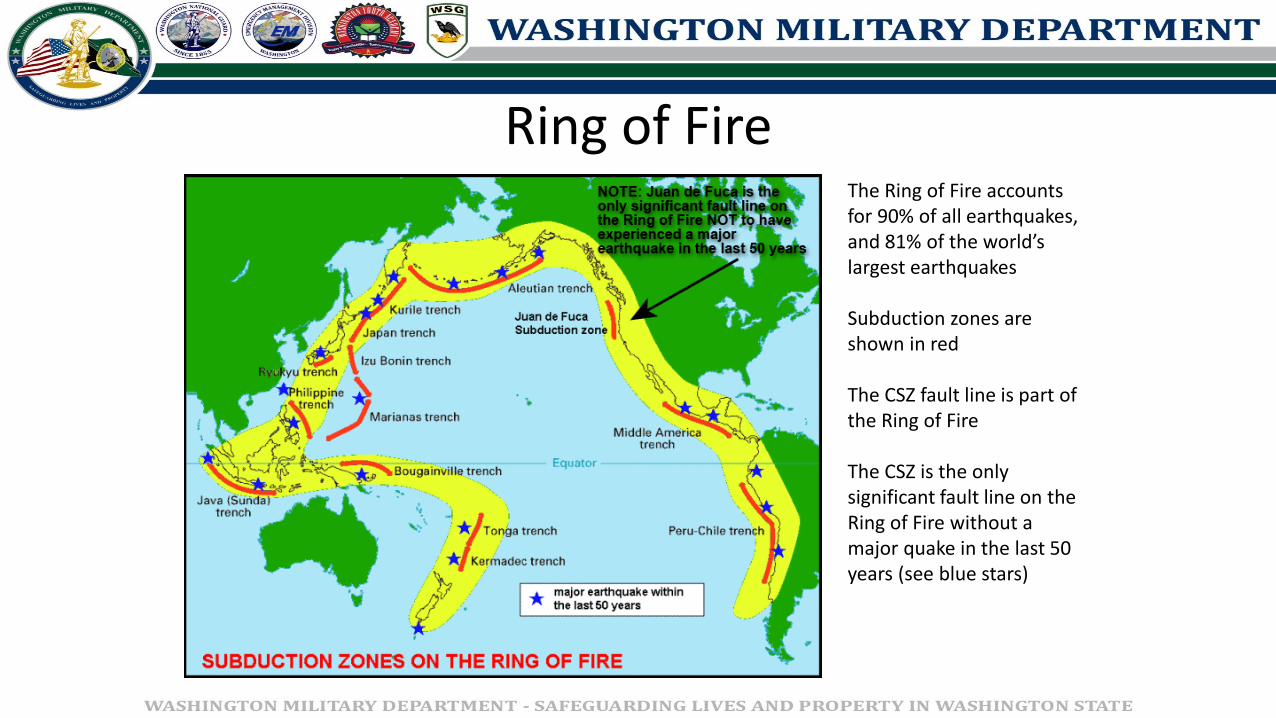
Ring of FireThe Ring of Fire accounts for 90% of all earthquakes, and 81% of the world’s largest earthquakes
Subduction zones are shown in red
The CSZ fault line is part of the Ring of Fire
The CSZ is the only significant fault line on the Ring of Fire without a major quake in the last 50 years (see blue stars)
Cascadia Subduction ZoneThe CSZ runs 800 miles from Southern British Columbia to Northern California, and lies 50 to 80 miles off the Pacific Coast
The heavy Juan de Fuca plate is sliding under the lighter North American plate
A magnitude 9.0 CSZ earthquake has occurred every 300 to 500 years (USGS – 400-600 years). The last CSZ earthquake occurred in the year 1700 (January 26).
Ground Shaking EffectsMercalli Index: Ground shaking will depend on the actual fault rupture method and can not be accurately forecast. It is anticipated that the fault will rupture along its entire 700 mile length resulting in a magnitude 9.0 earthquake that will last 3-5 minutes. The intensity of the shaking will decrease with distance from the fault. Even so, Seattle is expected to experience a 7.0 magnitude or higher earthquake with 5 minutes of shaking.
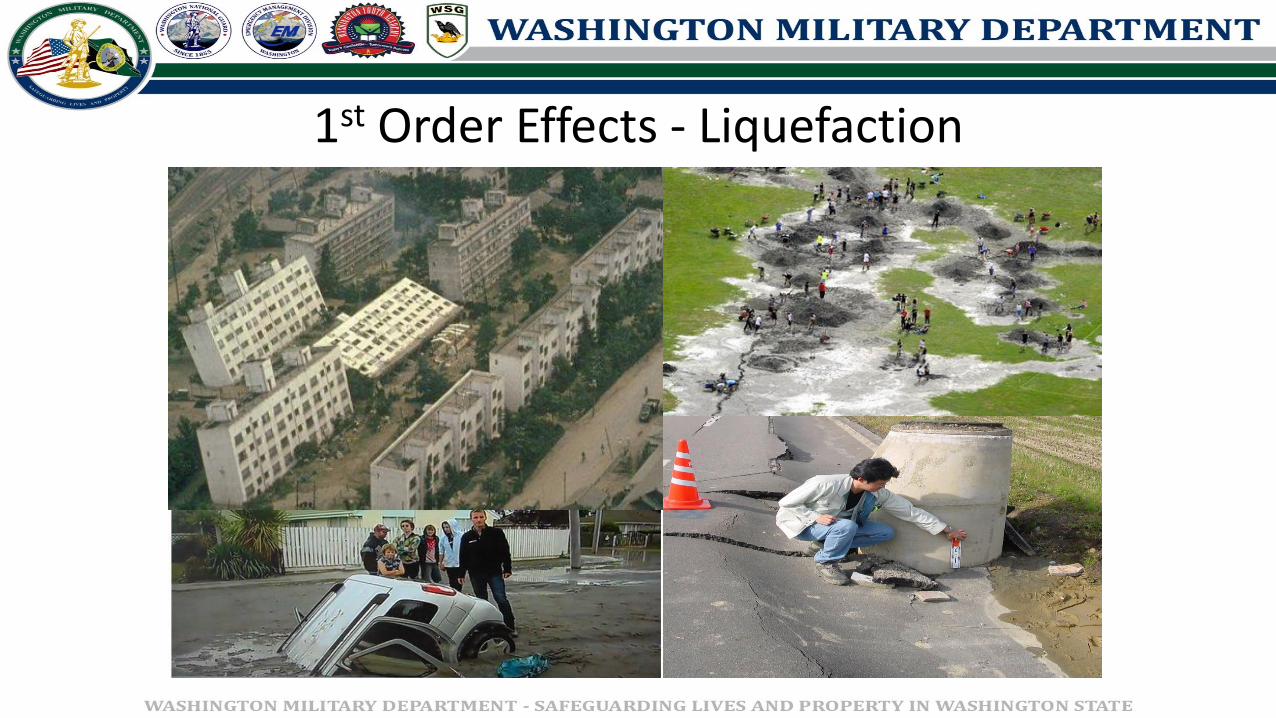
Liquefaction: The cause of some of the most dramatic damage resulting from an earthquake, liquefaction areas can be accurately forecast based on soil types and water content. Some of the most susceptible areas are areas that have a high commercial potentiality, i.e. ports, bridges, commercial areas.
Landslides: Landslides will occur up to hundreds of miles from the fault due to the intensity of the shaking. Landslide potential significantly increases with water content. If the CSZ rupture occurs during the rainy season, landslides will be most prolific.
Tsunami Inundation: Tsunami’s are historically the biggest killer associated with earthquakes. The residents most affected are along Pacific Coastal areas. The numbers in jeopardy will increase sharply in summer months. Current estimates place as many as 50,000 residents in the hazard zone in February.
HospitalsThese are general locations and forecast status of the known Hospitals.
There are 112 Hospitals in the affected area.
36% suffer severe damage, are unusable, and will likely be completely offline.
17% suffer moderate damage and are only assumed capable of 50% normal capacity.
Total reduction is assumed to be 45% of total hospital capacity.
47% suffer slight damage and are able to continue to operate at capacity.
The facilities nearer to the epicenter suffer most significant damage resulting in virtually no Hospital capacity west of the I5 corridor.
These numbers discuss STRUCTURAL capacity, not patient capacity, which is further reduced due to lack of electricity, potable water, sanitation, etc.
Senior Living FacilitiesThere are approximately 2,156 senior living facilities in the affected area.
Significant numbers (approaching 100%) of facilities West of the I-5 corridor suffer extensive damage, and are likely unusable.
The vast majority of facilities along the I-5 corridor suffer complete to severe damage and are likely unusable, or are significantly degraded.
The facilities nearest the epicenter suffer most significant damage resulting in virtually no senior living facility capacity West of theI-5 corridor.
Fire StationsThese are general locations and forecast status of the known Fire Stations.
There are 971 Fire Stations in the affected area.
30% suffer severe damage, are unusable, and are planned to be completely offline.
6% suffer moderate damage and are only assumed capable of 50% normal capacity.
Total reduction is assumed to be 33% of Fire Response capability.
64% suffer slight or no damage and are able to continue to operate at capacity.
The facilities nearer to the epicenter suffer most significant damage resulting in significantly reduced capability west of Shelton.
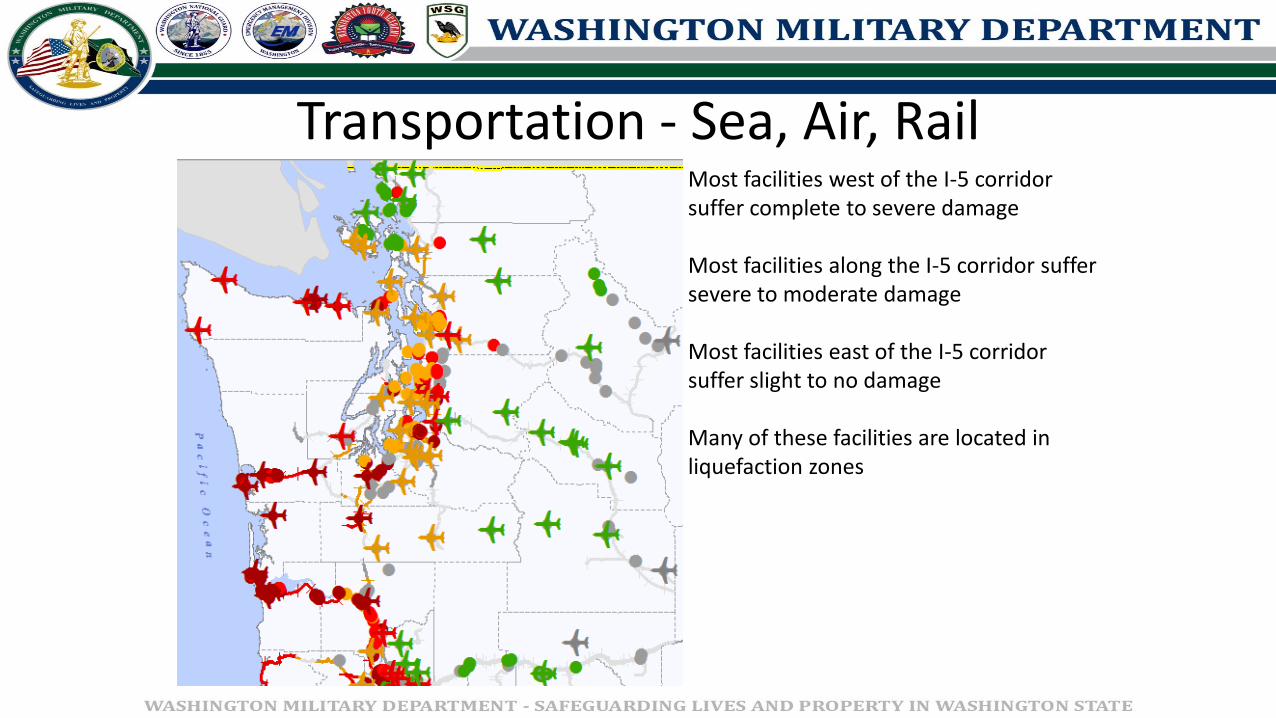
Transportation - Sea, Air, RailMost facilities west of the I-5 corridor suffer complete to severe damage
Most facilities along the I-5 corridor suffersevere to moderate damage
Most facilities east of the I-5 corridor suffer slight to no damage
Many of these facilities are located in liquefaction zones
Transportation- HighwaysThere is a vast network of County, State, and Federally maintained highways in the affected area. Ground transportation is the primary method of movement for most commodities.
The highway system will suffer the most damage in the vicinity of the coast with both earthquake and tsunami damage. This will significantly impact any lifesaving or recovery operations, and will drive route clearance and roadway repair to a very high priority across the region.
In the I-5 corridor roads in areas of high liquefaction susceptibility are likely to prove impassable.
In the initial stages of the CSZ response the only method of reaching coastal communities will be by air. There are no surviving ground routes to the coastal region.
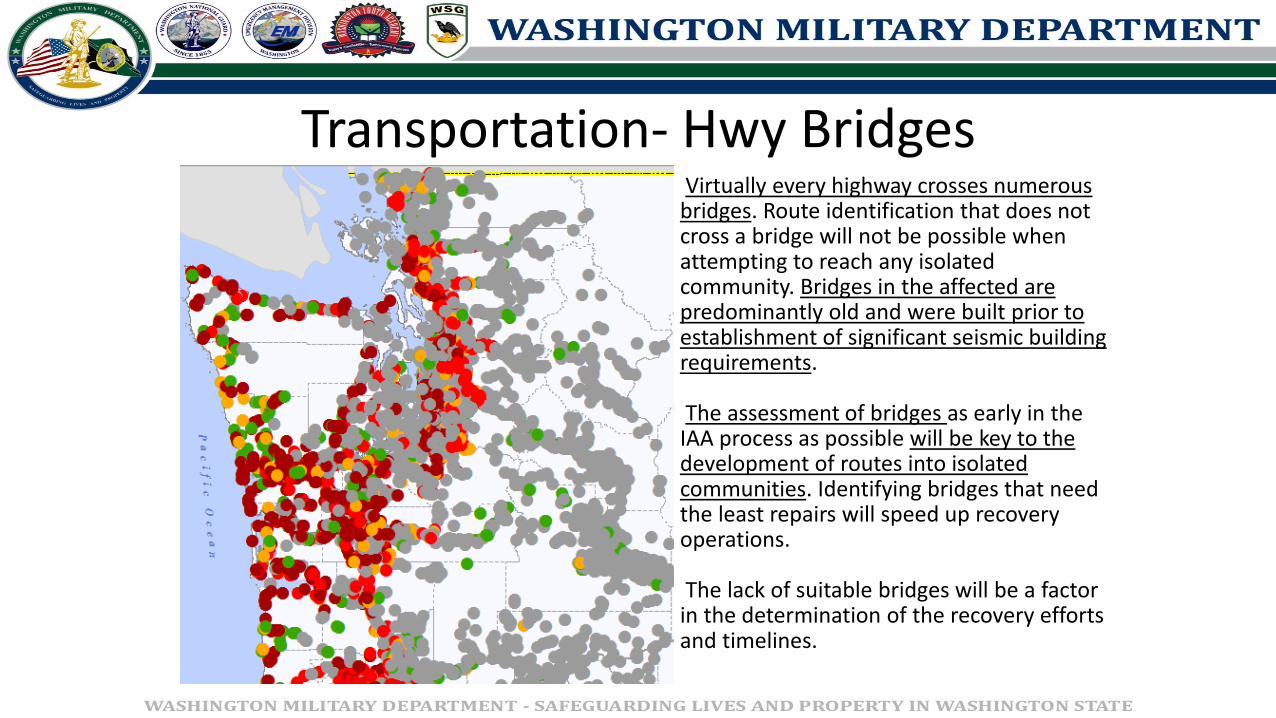
Transportation- Hwy BridgesVirtually every highway crosses numerous
bridges. Route identification that does not cross a bridge will not be possible when attempting to reach any isolated community. Bridges in the affected are predominantly old and were built prior to establishment of significant seismic building requirements.
The assessment of bridges as early in the IAA process as possible will be key to the development of routes into isolated communities. Identifying bridges that need the least repairs will speed up recovery operations.
The lack of suitable bridges will be a factor in the determination of the recovery efforts and timelines.
Micro Islands – King County
Planning Factors (FEMA)Washington
TotalNotes
Land Area (Sq. Miles) 71,303
Miles of Pacific Coastline 157 Does not include Strait of Juan de Fuca or shores of Puget Sound.
Population 6,894,121
Population exposed to tsunami 50,190
Residential buildings damaged
(Slight to complete damage)507,701
Short term human sheltering
requirements410,127
Short term pet sheltering
requirements254,357
Mass feeding and hydration
requirements (People)1,274,327
Mass feeding and hydration
requirements (Pets)777,340
Deaths 8,440
Injuries 12,114
Hospital patient evacuation
requirements15,501
Nursing home patient evacuation
requirements65,249
Building debris (Cubic Yards) 13,174,243
Projection accounts for initial earthquake and tsunami, does not account for exposure,
disease, dehydration, starvation, or follow on tsunami's and aftershocks.
Evacuation requirements based on projected numbers of facilities determined to be
unusable. Does not account for evacuation to create room for newly injured.
Historical Comparisons
Cascadia Rising 16
28
Cascadia Rising 16
• Joint Federal, State, Local Exercise conducted 7 to 10 June, 2016
• National Linkage
• Focus Areas:
– Operational Coordination
– Operational Communication
– Situational Awareness
– Mass Care
– Public Health and Medical Services
– Critical Transportation
29
Cascadia Rising 16 Strategic Observations
• Time is of the essence – Massive National/International response required
– Needs and immediacy are overwhelming
• Detailed Planning is imperative
• Transportation infrastructure is the lynchpin of successful response
• Effective, survivable communication is essential
• Public preparedness is crucial
• CSZ is a National Issue
30
Hurricane Maria has validated the importance of these
• Regional Catastrophic Planning
• Statewide Catastrophic Incident Planning Team
• WSDOT Lifeline Corridor Initiative
• Resilient Washington
• National Guard Response Plan
31
What Has Been Done So Far
• Response Planning– ESF-6 Mass Care and Sheltering
– ESF-8 Public Health and Medical
– ESF-1 Transportation
– ESF-2 Communications
– ESF-12 Energy
• Mitigation Planning– Focused on building resiliency in our critical infrastructure, in particular our lifeline
sectors - transportation, communications, energy
– Family and personal preparedness/resiliency
• Recovery Planning– Washington Restoration Framework
32
Our Focus Going Forward
• State-led detailed planning, coordinated across all levels of government (tribal, local, state, federal) and whole of community
• Pre-identify resource needs and develop plans to deliver the required commodities where and when needed
• Timeline – 3 to 4 years to accomplish baseline plans for the 5 ESFs, exercise the plans in 2021
• Continue to refine plans and focus on additional ESFs – 12 years to accomplish appendices for all ESFs
33
Planning Concept
Current Initiatives
• Major exercise on the scale of CR16 to test current state of catastrophic plans. Targeted toward specific capabilities rather than a broad, do-everything exercise.
• We lack the resources to put on another large exercise and FEMA has indicated they will not have funding available
• Will necessitate a modest budget request in the FY21-23 biennium for exercise design and execution
35
Cascadia Rising 22
Regional Resiliency Assessment Program (RRAP)
The Regional Resiliency Assessment Program (RRAP) is a cooperative assessment of specific critical infrastructure within a
designated geographic area and a regional analysis of the surrounding infrastructure to address a range of infrastructure
resilience issues that could have regionally and nationally significant consequences. These voluntary, nonregulatory RRAP projects are led by the Department of Homeland Security and
are selected each year by the Department with input and guidance from federal, state, and local partners.
36
Regional Resiliency Assessment Program (RRAP)• Objective 1: Analyze and identify priority multi-modal transport routes and facilities that
would likely be utilized in the CSZ response phase and determine capacity of existing, most-viable routes– Connectivity between Incident Support Bases (ISBs) and regional Federal Staging Areas (FSAs) and grocery
Distribution Center (DC) cluster– Connectivity between seaports and regional FSAs and DC cluster – Corridor and route focus; no facility-level focus at this phase– Physical viability of routes, not what goods on which routes
• Objective 2: Identify and prioritize transportation routes and facilities for potential investments of hardening, retrofitting, and mitigation measures– Focus on priority route hazard vulnerabilities (e.g., liquefaction, landslide, seismic forces, tsunami) to
corridors– System-level analysis of infrastructure physical impacts– Assessment of potential infrastructure system viability post-disaster; prioritization of corridors and
facilities to mitigate damage to systems most valuable to response operations
37
38
Resilient Washington Subcabinet• Purpose & Timeframe of Governor Directive 16-19, November 2016 :
• To better enable preparedness and response to earthquakes and tsunamis in Washington State
• Capitalize on the work from the 2012 Resilient WA report, and the Cascadia Rising exercise, with the goal of making the state resilient over the next 50 years.
• Provide a draft report with initial findings by June 30, 2017. Time was extended to Aug 30, 2017 due to added recommendations from mid term meeting with Governor.
• Accomplished by a collaborative effort from more than 20 different State agencies, and organizations
• The RW Subcabinet report was to report out on the following:
• Gaps and Barriers• Need for expanded research to identify seismic risk to transportation infrastructure• Lifeline plan needs to extend beyond urban core• Coordination with other jurisdictions needed to identify alternate routes• Current construction and retrofitting does not ensure usability, repairs may be necessary• Retrofitting does not include subsurface work to mitigate liquefaction• Inadequate resources to address landslides following a CSZ event• Additional research to identify tsunami impacts to transportation facilities
RW Transportation Findings/Recommendations
40
• Subcabinet priority recommendations:• Conduct research to thoroughly analyze the effects of a CSZ event on WSDOT Structures
• Determine if current building standards for 1,000-year and 2,500-year events allow structures to withstand the full effect of a CSZ event.
• Expand Seismic lifeline into a comprehensive North-South route from Oregon to British Columbia and East-West from the coast to beyond the Cascades
• Other recommendations• Conduct unstable slope mitigation research• Liquefaction susceptibility and mitigation research• Tsunami mitigation
RW Transportation Findings/Recommendations
The Road Ahead
Transportation Appendix to Catastrophic Annex
• Identify lifeline routes, route clearing strategies, and alternate routes to bring commodities into the impacted area
• Develop an airspace control plan and a plan for rapidly assessing and opening airfields
• Partner with rail owners to develop rail restoration plans
• Partner with ports to develop port restoration plans
42
• The transportation industry is a crucial link in the supply chains that move critical supplies around the region (to include groceries, pharmaceuticals, and fuels). – Many of the companies that create the backbone of these supply chains perform
comprehensive business continuity planning and work to ensure they are resilient to all forms of disasters. But there is still room for growth, particularly in the coordination between private sector responses to supply chain disruption, and public sector coordination through emergency management.
– Under the auspices of the FEMA Technical Assistance Program, 5 Puget Sound jurisdictions (Snohomish County, King County, City of Seattle, Pierce County, Thurston County) have embarked on a study of the region’s supply chains relating to grocery stores, pharmaceuticals, and fuel. The WA State Emergency Management Division is supporting the effort to help maintain continuity with existing programs across the state (including the RRAP)
What can you do to help?
What can you do to help?
• Understanding the (inter)dependencies at the nexus of transportation, energy, communication and water/wastewater is crucial to guide priorities during response. To achieve this understanding, public sector emergency managers need to work hand-in-hand with private sector owner/operators to develop shared solutions to common problems– In order to provide a forum for these discussions, and to build a
community around lifeline infrastructure, the state facilitates an Infrastructure Resilience Sub-Committee (IRSC) to coordinate efforts, build programs and guide policy.