Transportation leadership you can trus presented to 2008 Highway Safety Summit, Boise Idaho presented by Lowell M. Porter Cambridge Systematics, Inc. May 13, 2008 Nighttime Seat Belt Enforcement: The Washington Experience
Transcript
Transportation leadership you can trust.
presented to
2008 Highway Safety Summit, Boise Idaho
presented by
Lowell M. Porter
Cambridge Systematics, Inc.
May 13, 2008
Nighttime Seat Belt Enforcement:The Washington Experience
3
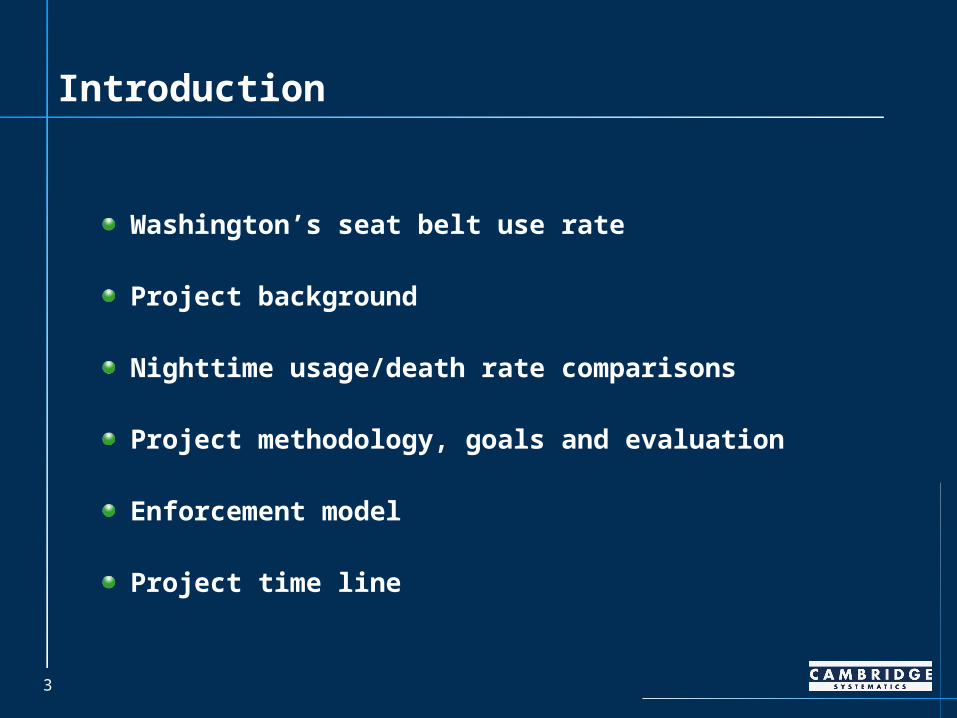
Introduction
Washington’s seat belt use rate
Project background
Nighttime usage/death rate comparisons
Project methodology, goals and evaluation
Enforcement model
Project time line
4
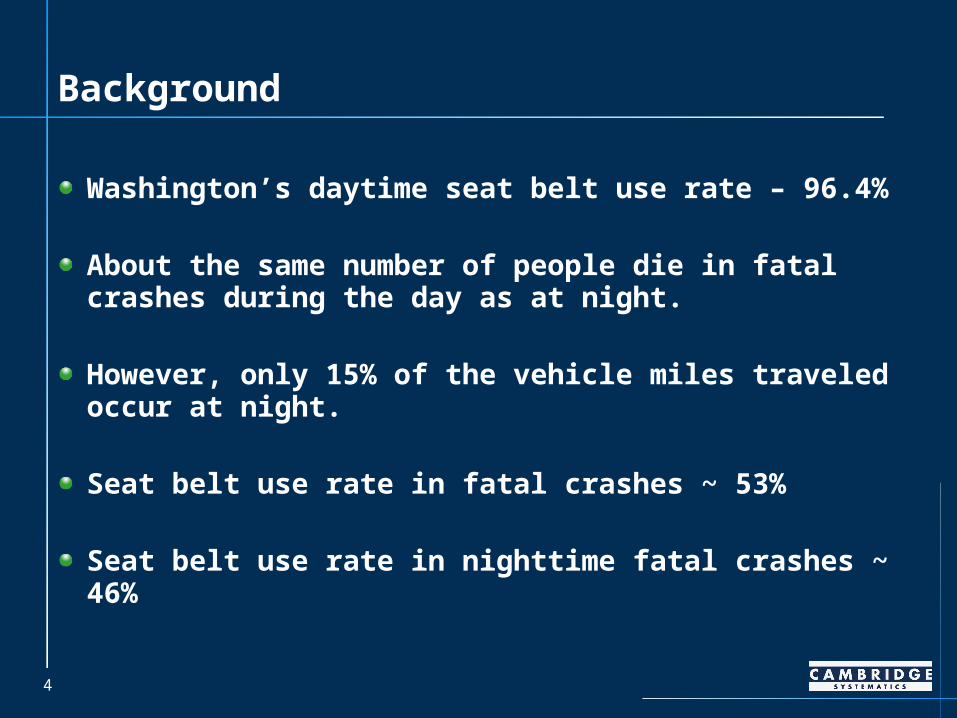
Background
Washington’s daytime seat belt use rate – 96.4%
About the same number of people die in fatal crashes during the day as at night.
However, only 15% of the vehicle miles traveled occur at night.
Seat belt use rate in fatal crashes ~ 53%
Seat belt use rate in nighttime fatal crashes ~ 46%
5
Background
WA death rate at night is 4 times higher.
Research shows that unbuckled drivers in WA are some of the highest risk taking drivers on the states roadways.
Therefore, NHTSA and the WA. Traffic Safety Commission (WTSC) are conducting a demonstration project to research effective nighttime seat belt enforcement and the occurrence of other high risk driving behaviors.
6
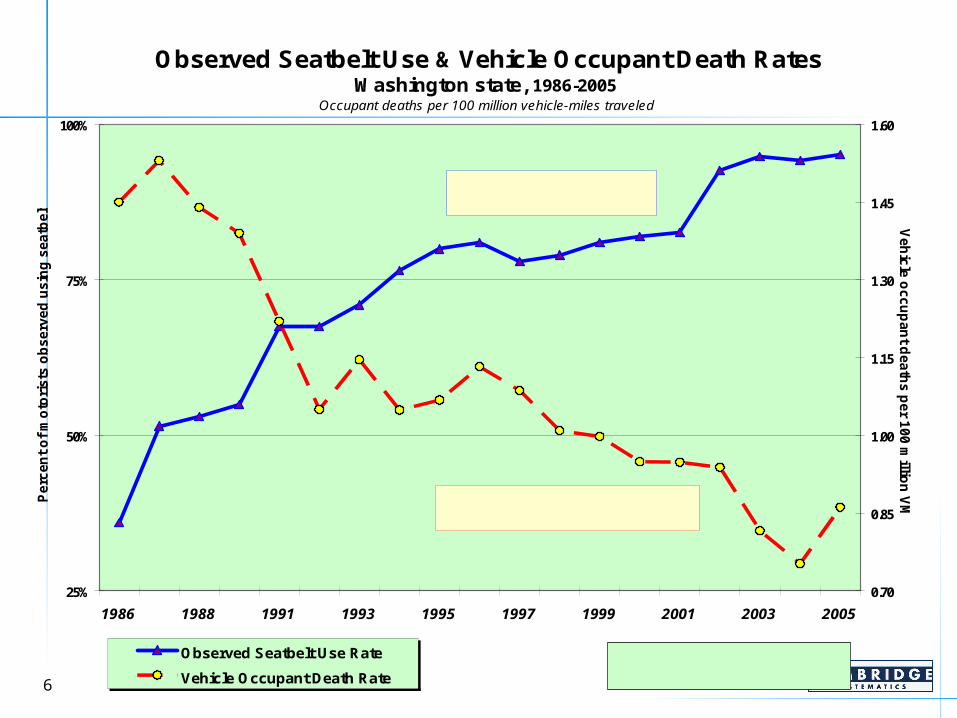
Observed Seatbelt Use & Vehicle Occupant Death Rates Washington state, 1986-2005
Occupant deaths per 100 million vehicle-miles traveled
25%
50%
75%
100%
1986 1988 1991 1993 1995 1997 1999 2001 2003 2005
Perc
en
t o
f m
oto
ris
ts o
bs
erv
ed
usin
g s
ea
tbelt
s
0.70
0.85
1.00
1.15
1.30
1.45
1.60
Veh
icle
oc
cu
pan
t dea
ths
pe
r 100
millio
n V
MT
Observed Seatbelt Use Rate
Vehicle Occupant Death RateSource: FARS, WSDOT, WTSC
*Seatbelt survey not conducted in 1990
Seatbelt Use Rate
Vehicle Occupant Death Rate
7
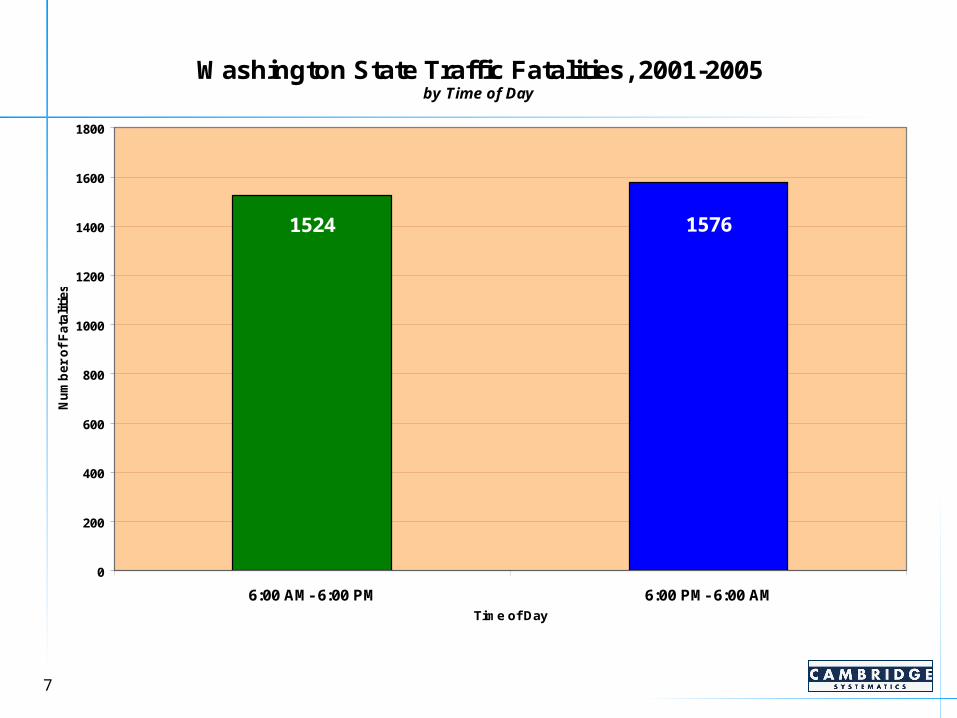
Washington State Traffic Fatalities, 2001-2005 by Time of Day
15761524
0
200
400
600
800
1000
1200
1400
1600
1800
6:00 AM- 6:00 PM 6:00 PM- 6:00 AMTime of Day
Nu
mb
er
of
Fata
liti
es
Source: FARS
8
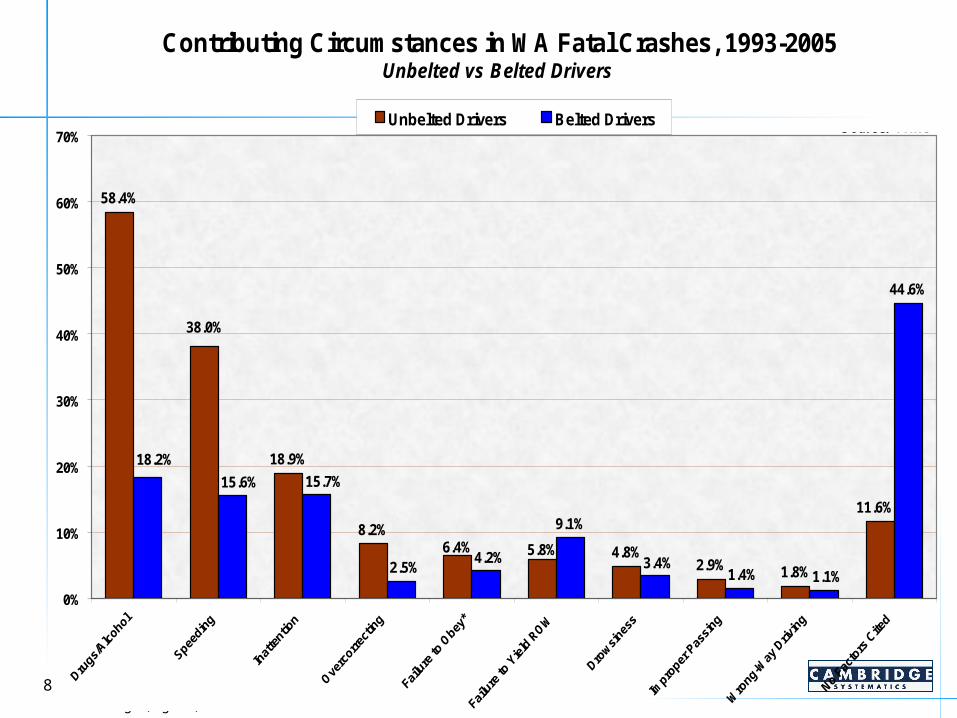
Contributing Circumstances in WA Fatal Crashes, 1993-2005Unbelted vs Belted Drivers
58.4%
18.9%
8.2%
4.8%2.9% 1.8%
9.1%
44.6%
11.6%
5.8%6.4%
38.0%
1.1%1.4%3.4%4.2%
2.5%
15.7%15.6%
18.2%
0%
10%
20%
30%
40%
50%
60%
70%Unbelted Drivers Belted Drivers Source: FARS
*Signs, signals, officers
9
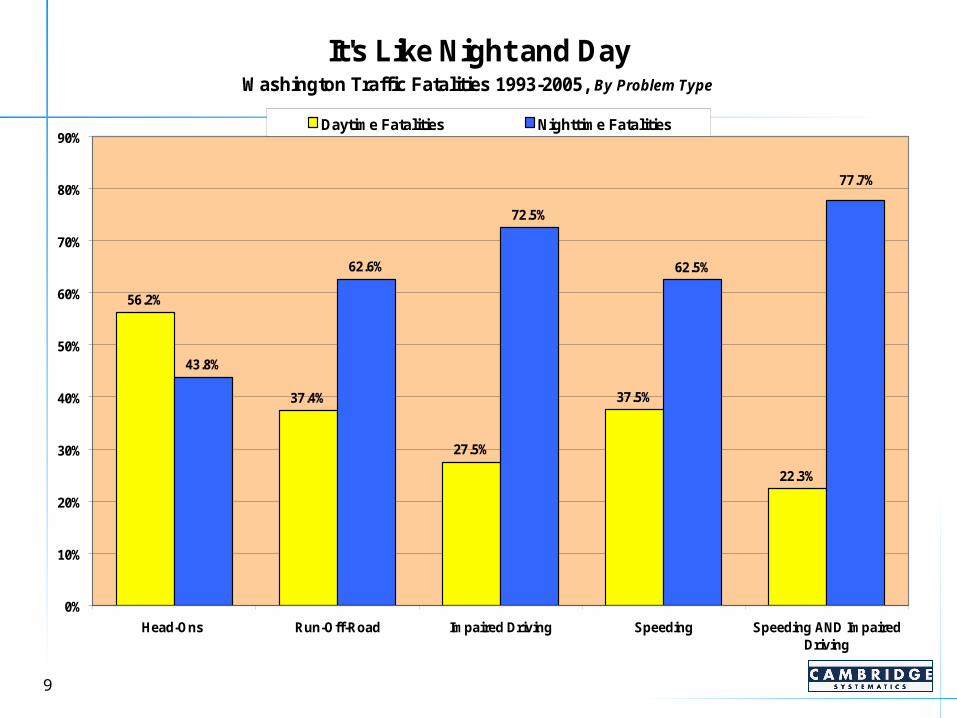
It's Like Night and DayWashington Traffic Fatalities 1993-2005, By Problem Type
56.2%
37.4%
27.5%
37.5%
22.3%
43.8%
62.6%
72.5%
62.5%
77.7%
0%
10%
20%
30%
40%
50%
60%
70%
80%
90%
Head-Ons Run-Off-Road Impaired Driving Speeding Speeding AND ImpairedDriving
Daytime Fatalities Nighttime Fatalities Source: FARS
10
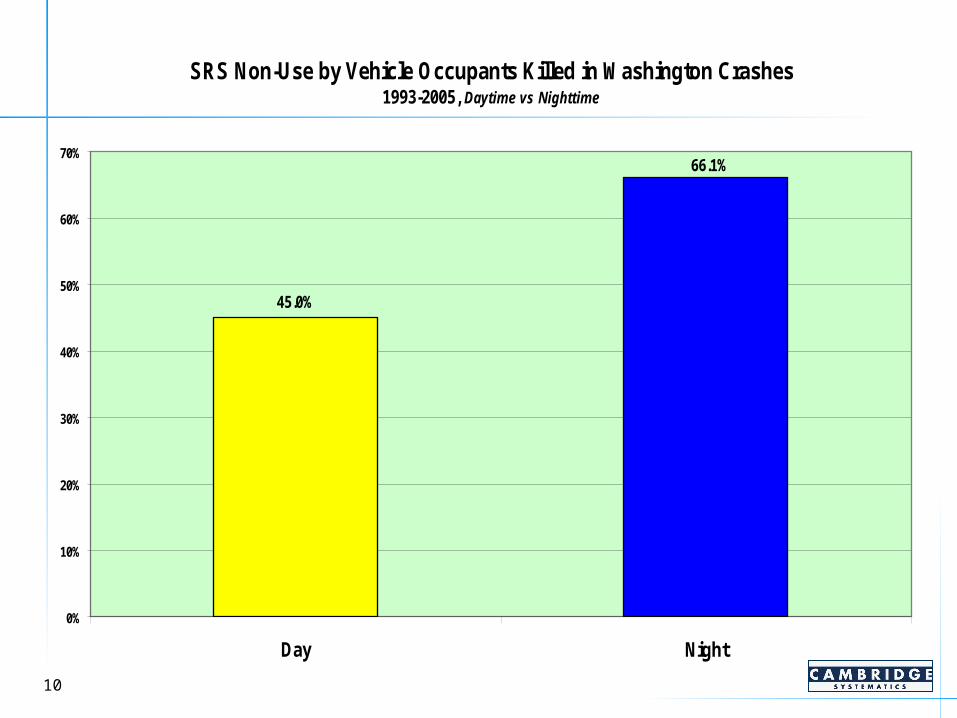
SRS Non-Use by Vehicle Occupants Killed in Washington Crashes1993-2005, Daytime vs Nighttime
45.0%
66.1%
0%
10%
20%
30%
40%
50%
60%
70%
Day Night
Source: FARS
11
Project Goals
Determine if the CIOT model can be used effectively to increase nighttime seat belt use.
Determine if this strategy can reduce injury and death rates as occurred with daytime enforcement.
Learn who the unbuckled motorists are and how to most effectively change their behavior.
Measure the impact this project has on other high risk driving behaviors and the frequency at which other criminal offenses are identified.
12
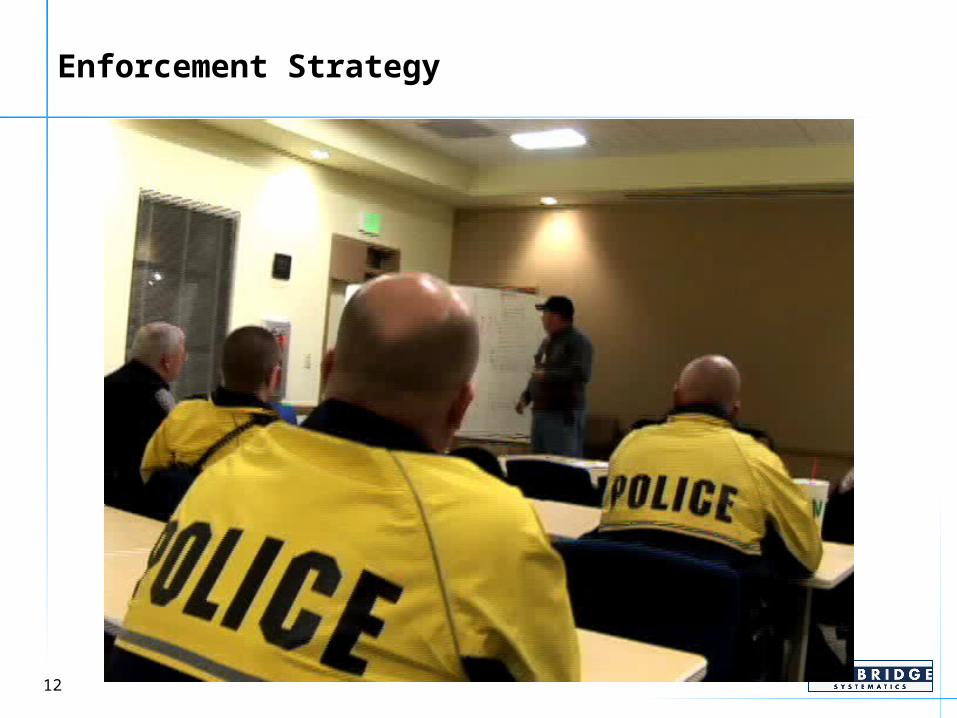
Enforcement Strategy
13
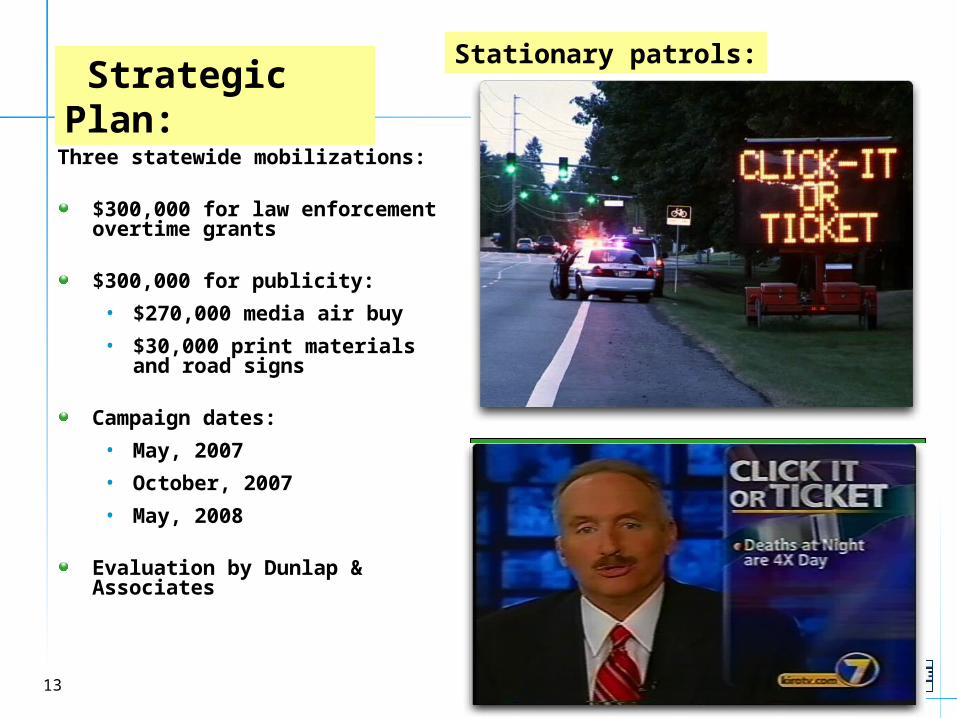
Three statewide mobilizations:
$300,000 for law enforcement overtime grants
$300,000 for publicity:
• $270,000 media air buy
• $30,000 print materials and road signs
Campaign dates:
• May, 2007
• October, 2007
• May, 2008
Evaluation by Dunlap & Associates
Strategic Plan: Stationary patrols:
14
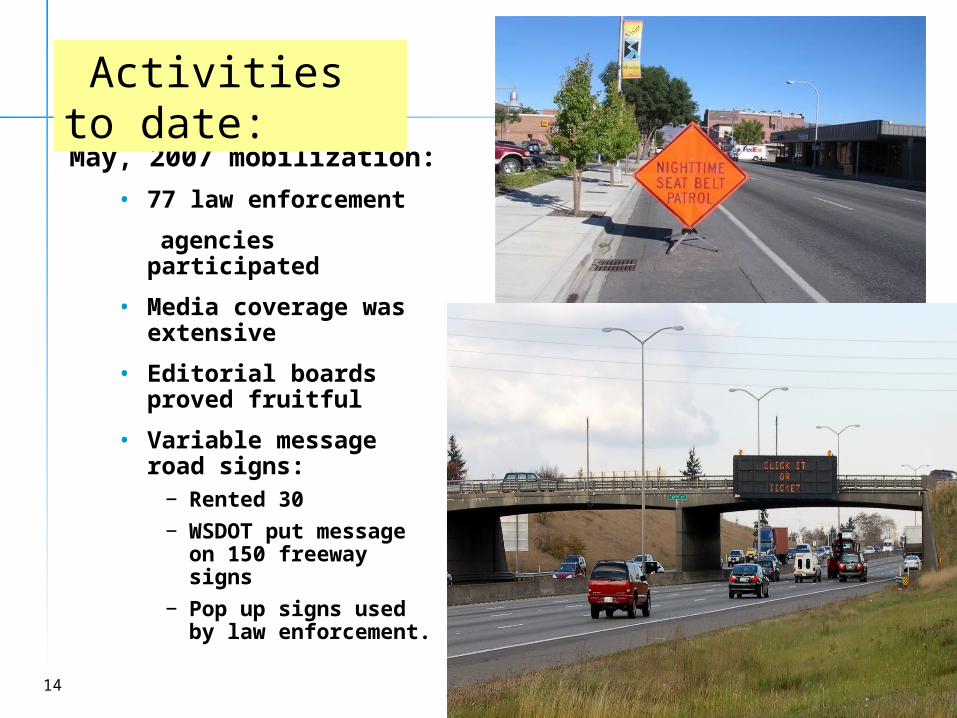
May, 2007 mobilization:
• 77 law enforcement
agencies participated
• Media coverage was extensive
• Editorial boards proved fruitful
• Variable message road signs:
− Rented 30
− WSDOT put message on 150 freeway signs
− Pop up signs used by law enforcement.
Activities to date:
15
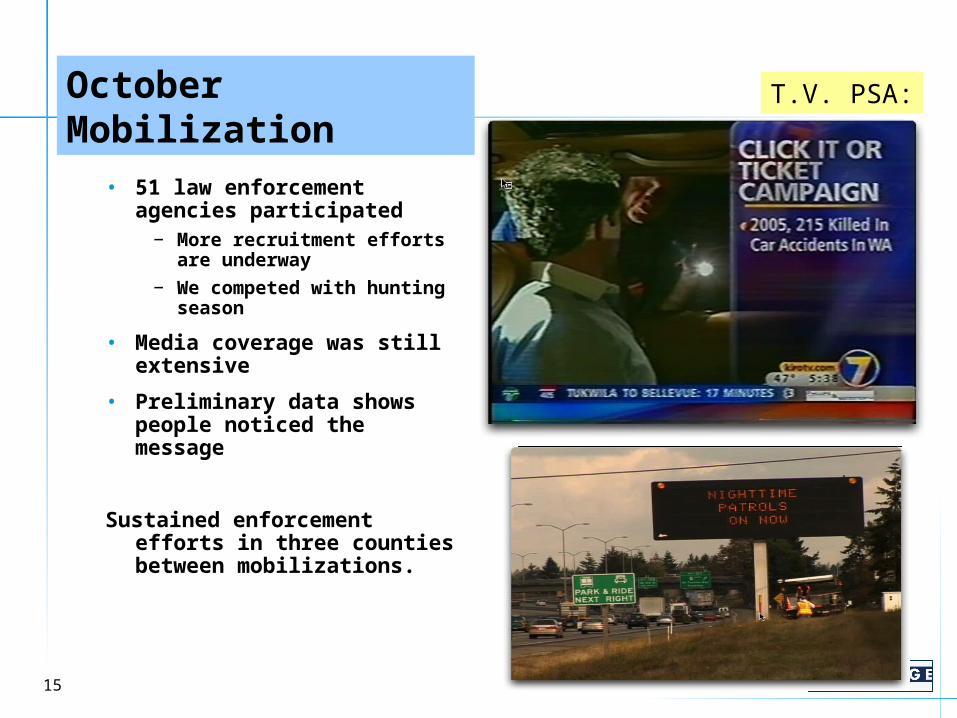
• 51 law enforcement agencies participated
− More recruitment efforts are underway
− We competed with hunting season
• Media coverage was still extensive
• Preliminary data shows people noticed the message
Sustained enforcement efforts in three counties between mobilizations.
October Mobilization T.V. PSA:
16
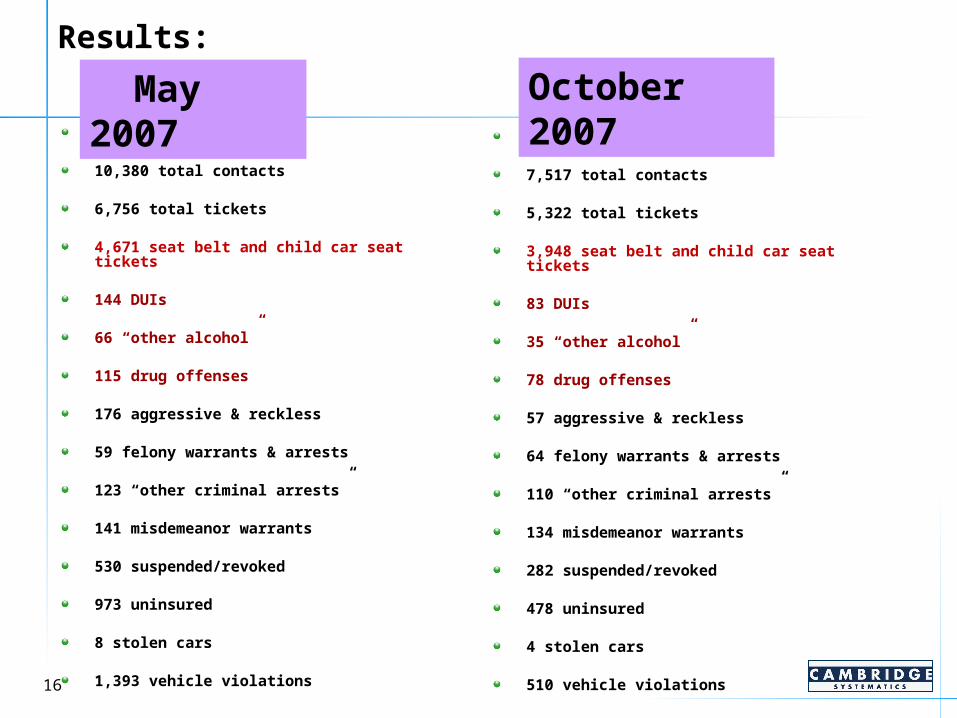
Results:
5,715 hours worked
10,380 total contacts
6,756 total tickets
4,671 seat belt and child car seat tickets
144 DUIs
66 “other alcohol”
115 drug offenses
176 aggressive & reckless
59 felony warrants & arrests
123 “other criminal arrests”
141 misdemeanor warrants
530 suspended/revoked
973 uninsured
8 stolen cars
1,393 vehicle violations
5,362 hours worked
7,517 total contacts
5,322 total tickets
3,948 seat belt and child car seat tickets
83 DUIs
35 “other alcohol”
78 drug offenses
57 aggressive & reckless
64 felony warrants & arrests
110 “other criminal arrests”
134 misdemeanor warrants
282 suspended/revoked
478 uninsured
4 stolen cars
510 vehicle violations
May 2007 October 2007
17
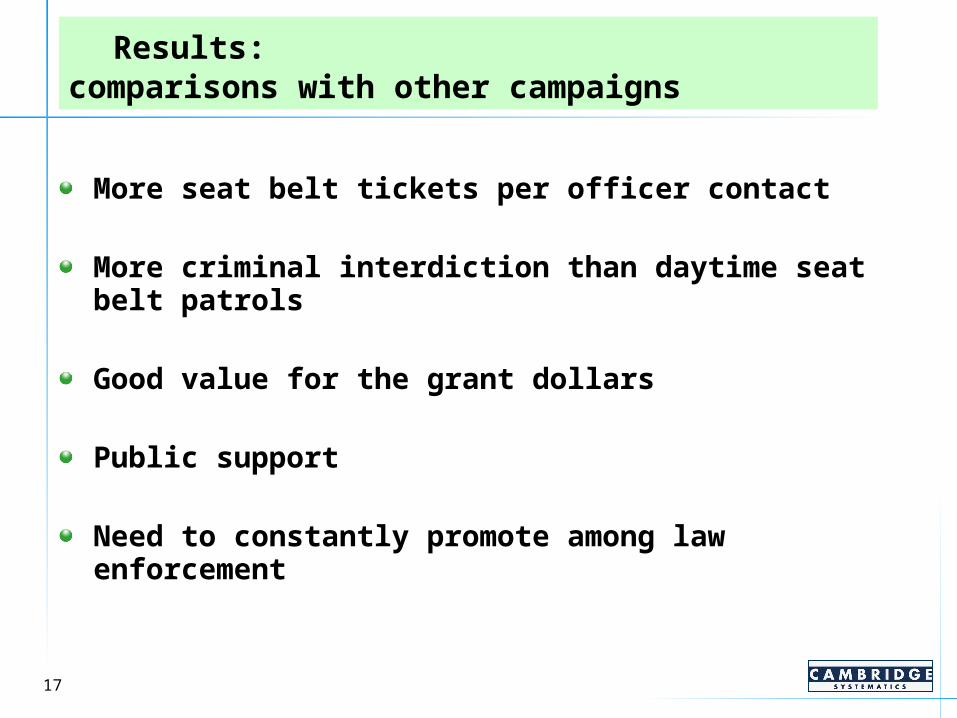
More seat belt tickets per officer contact
More criminal interdiction than daytime seat belt patrols
Good value for the grant dollars
Public support
Need to constantly promote among law enforcement
Results: comparisons with other campaigns
18
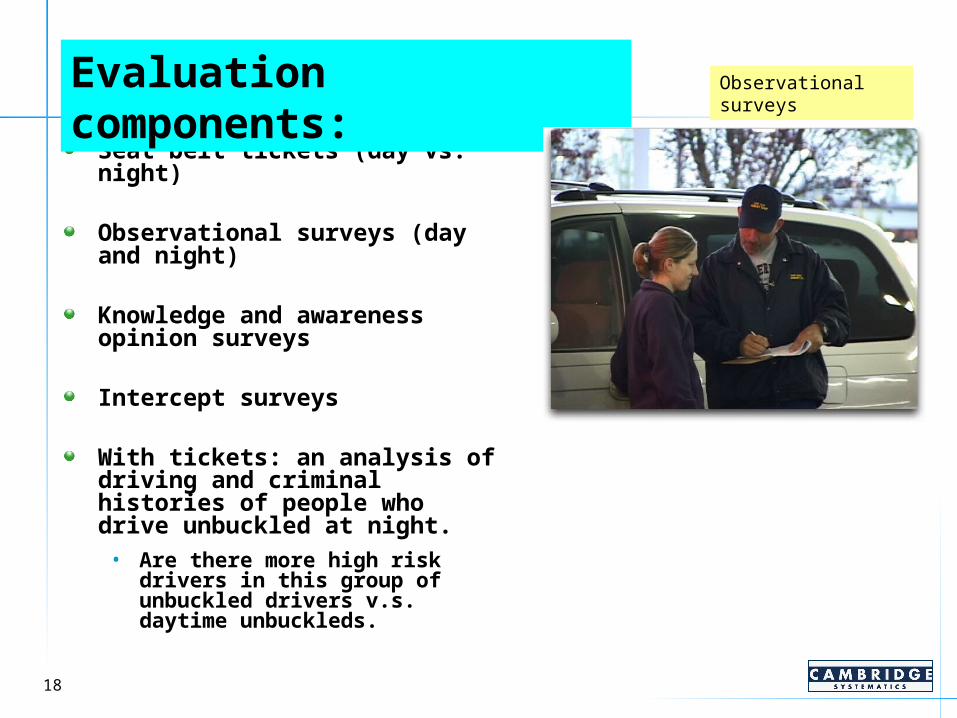
Seat belt tickets (day vs. night)
Observational surveys (day and night)
Knowledge and awareness opinion surveys
Intercept surveys
With tickets: an analysis of driving and criminal histories of people who drive unbuckled at night.
• Are there more high risk drivers in this group of unbuckled drivers v.s. daytime unbuckleds.
Evaluation components: Observational surveys
19
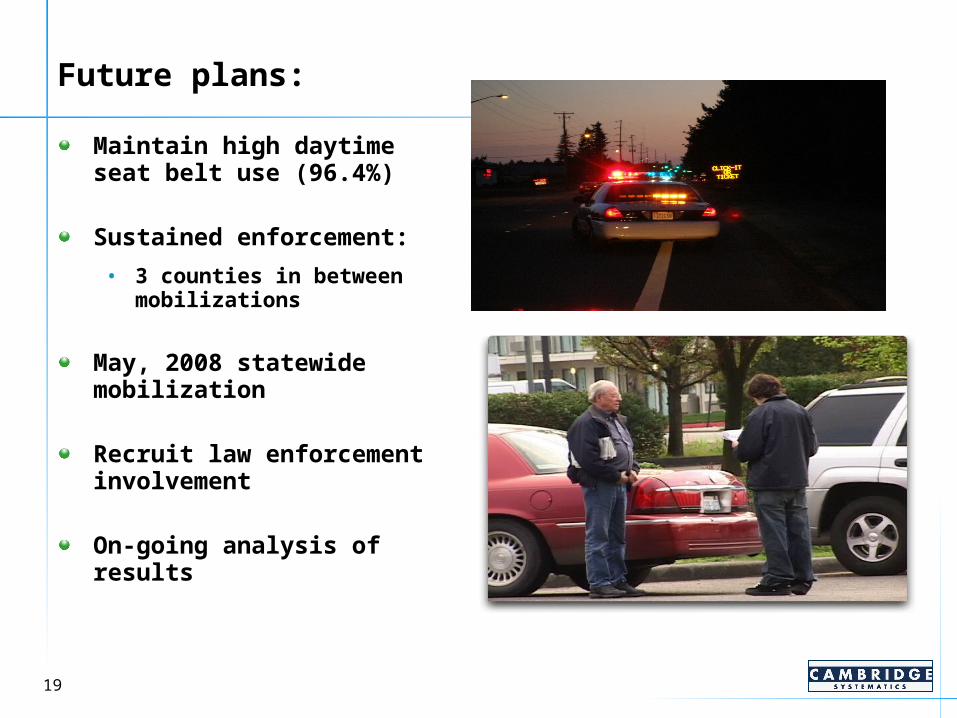
Future plans:
Maintain high daytime seat belt use (96.4%)
Sustained enforcement:
• 3 counties in between mobilizations
May, 2008 statewide mobilization
Recruit law enforcement involvement
On-going analysis of results
Insert law enforcementPhoto here
20
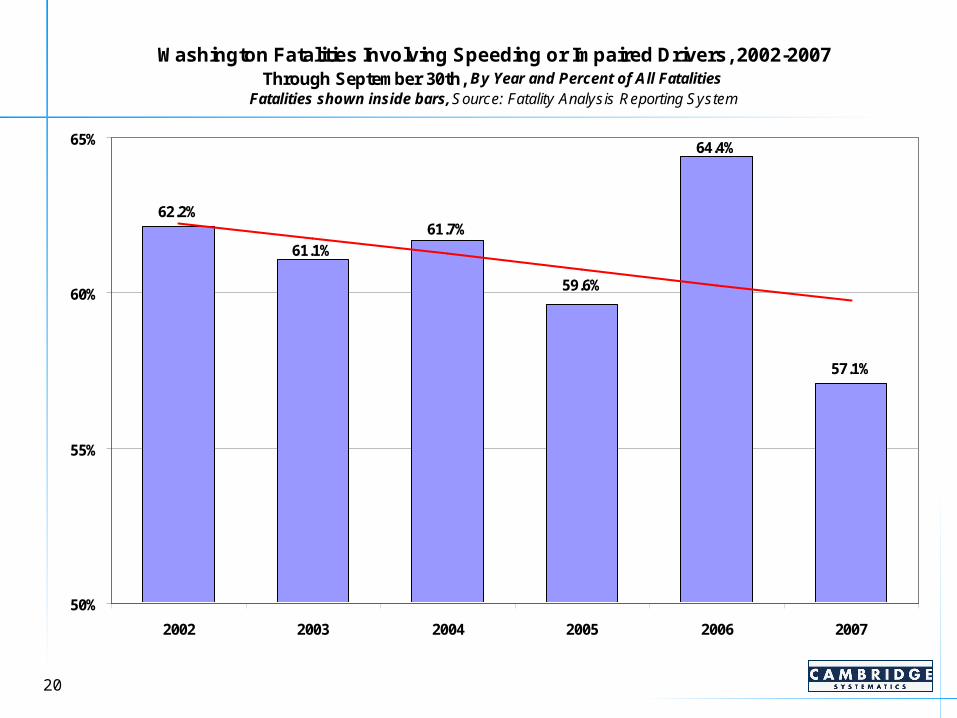
Washington Fatalities Involving Speeding or Impaired Drivers, 2002-2007Through September 30th, By Year and Percent of All Fatalities
Fatalities shown inside bars,Source: Fatality Analysis Reporting System
62.2%
57.1%
61.7%
64.4%
59.6%
61.1%
50%
55%
60%
65%
2002 2003 2004 2005 2006 2007
312 276 272 285 315 242
21
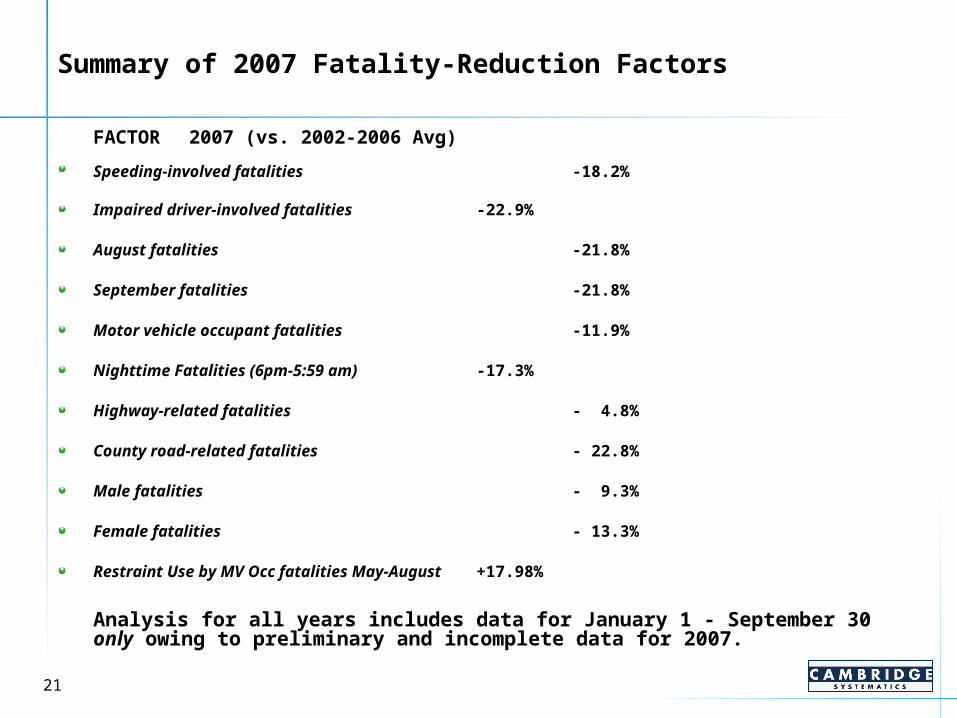
Summary of 2007 Fatality-Reduction Factors
FACTOR 2007 (vs. 2002-2006 Avg)
Speeding-involved fatalities -18.2%
Impaired driver-involved fatalities -22.9%
August fatalities -21.8%
September fatalities -21.8%
Motor vehicle occupant fatalities -11.9%
Nighttime Fatalities (6pm-5:59 am) -17.3%
Highway-related fatalities - 4.8%
County road-related fatalities - 22.8%
Male fatalities - 9.3%
Female fatalities - 13.3%
Restraint Use by MV Occ fatalities May-August +17.98%
Analysis for all years includes data for January 1 - September 30 only owing to preliminary and incomplete data for 2007.