Transportation leadership you can trus presented to Talking Freight Seminar presented by Michael Fischer Cambridge Systematics, Inc. December 12, 2007 Economic Impacts of Large Scale Freight Investments
Transcript
Transportation leadership you can trust.
presented to
Talking Freight Seminar
presented by
Michael FischerCambridge Systematics, Inc.
December 12, 2007
Economic Impacts of Large Scale Freight Investments
2
Overview
Background and Purpose
Economic Impact Analysis Framework
Case Study – Baltimore Rail Tunnel
Overview of Toolbox
3
What Is Economic Impact Analysis?
Investments affect transportation system performance
Transportation system performance affects business costs, output, and profitability – economic effects
Economic effects impact general economy• Output (GDP), employment, income – macro economy
• Geography of effects
• Incidence of effects
Focus of guidebook is economic effects• National scale of benefits – large scale
• Public vs. private impacts
• Logistics and supply chain effects – second order
4
Challenges for Evaluating Large Scale Projects
Public benefit consideration
National level significance
Multiple modes of travel
Allocation of costs and benefits among wide array of stakeholders
5
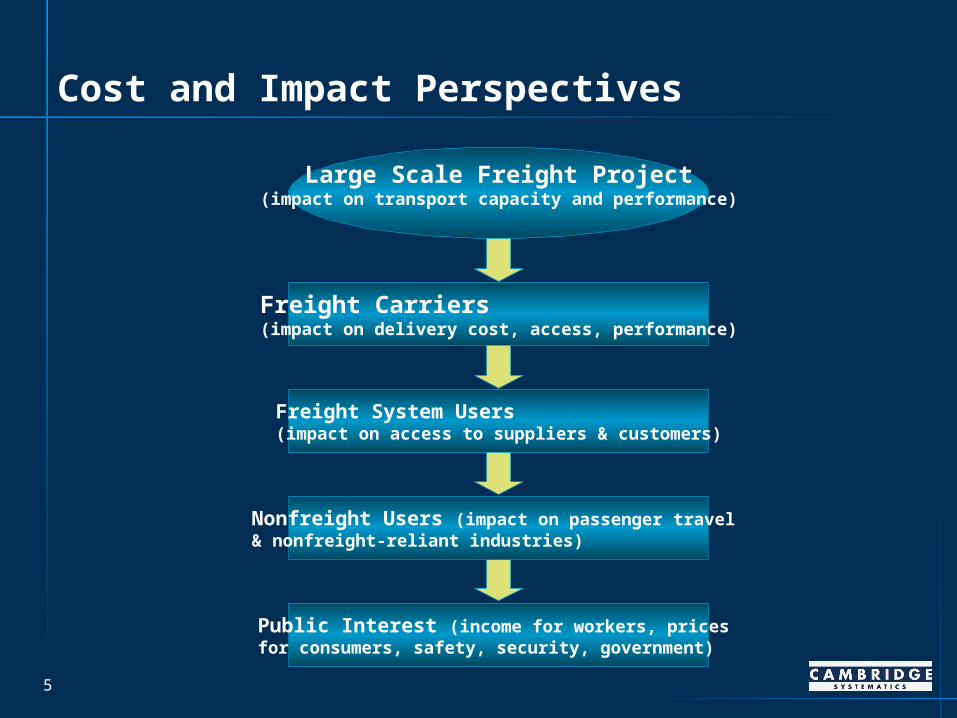
Cost and Impact Perspectives
Freight Carriers(impact on delivery cost, access, performance)
Freight System Users(impact on access to suppliers & customers)
Public Interest (income for workers, prices for consumers, safety, security, government)
Non-Freight Users (impact on Nonfreight Users (impact on passenger travel & nonfreight-reliant industries)
Large Scale Freight Project(impact on transport capacity and performance)
6
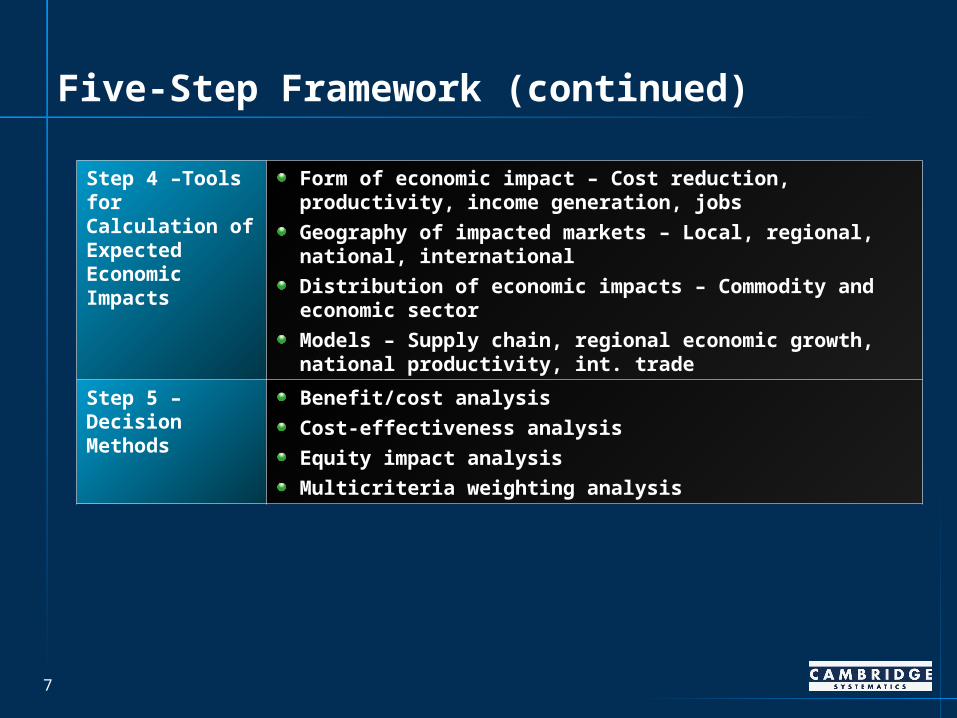
Five-Step Framework
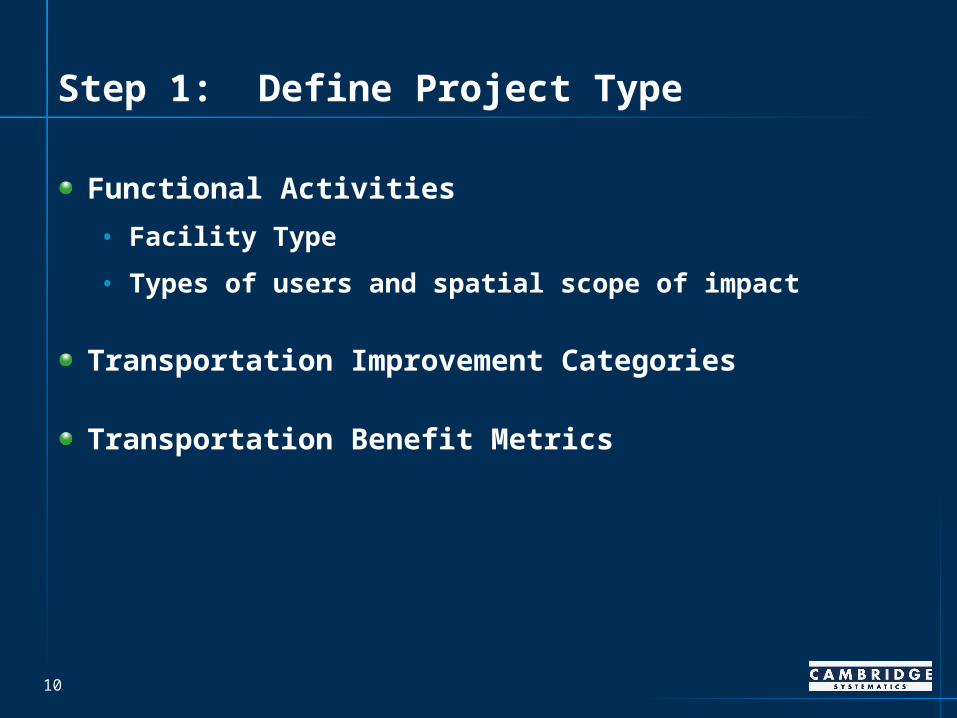
Step 1 – Classify the Type of Project (Transportation Impact)
Facility location – Local entry/access point, regional corridor, facility
Modes involved – Air, water, rail, truck, combinations of modes
Transport change – Capacity, access, speed/flow, and cost
Investment – Expand existing facility, build new or alternative facility
Step 2 – Define the Relevant Evaluation Issues (Economic Impact)
National and international scale freight network capacity and level-of-service needs
Economic competitiveness, growth, productivity, and trade
Benefits to specific regions, modes, or industry-specific targets
Allocation of costs and benefits among affected parties to assess equitable funding
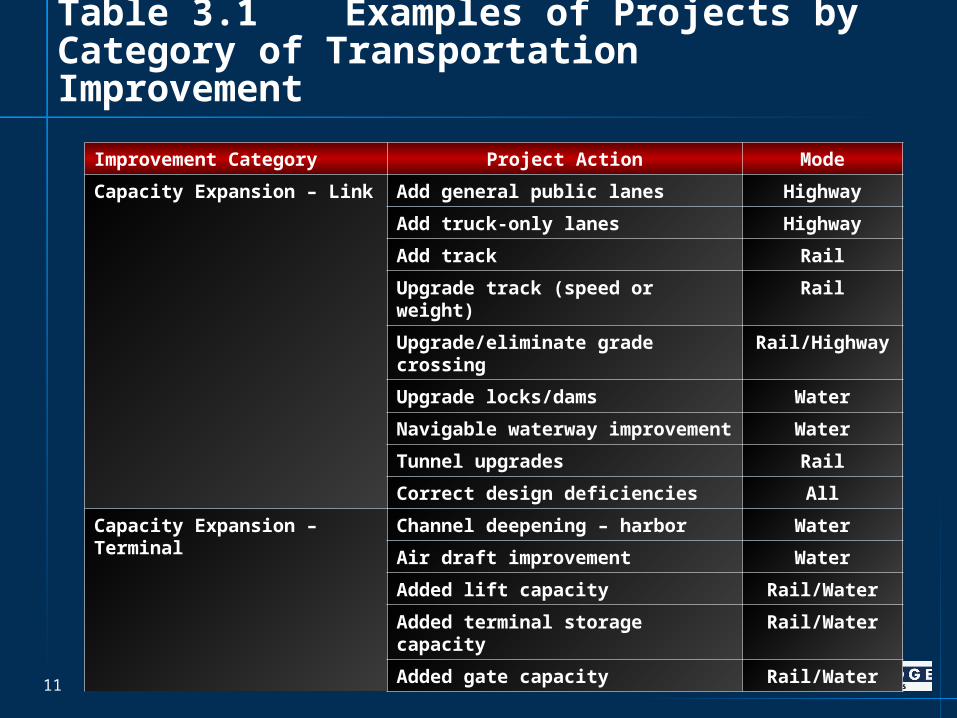
Step 3 –Tools for Calculation of Transportation Impacts
Rail/Hwy Congestion – Time savings/car cycling Travel time, cycle time
Potential reliability – Queue impact On time performance
Diversion to rail reduces congestion Volume, travel time
Upgrade track (speed or weight)
Rail Improved travel time, railcar cycle time New weight/speed
Potential reliability On time performance
Potential safety Accidents
Upgrade/eliminate grade crossing
Rail/Hwy Potential speed/travel time savings Average speed
Accident reduction – Reliability savings
Accidents
14
Step 2: Define Evaluation Issues
Identifying Issues and Audiences
National and Local Issues
Stakeholders: Incidence of Benefits and Costs
Alternative Impact Metrics
15
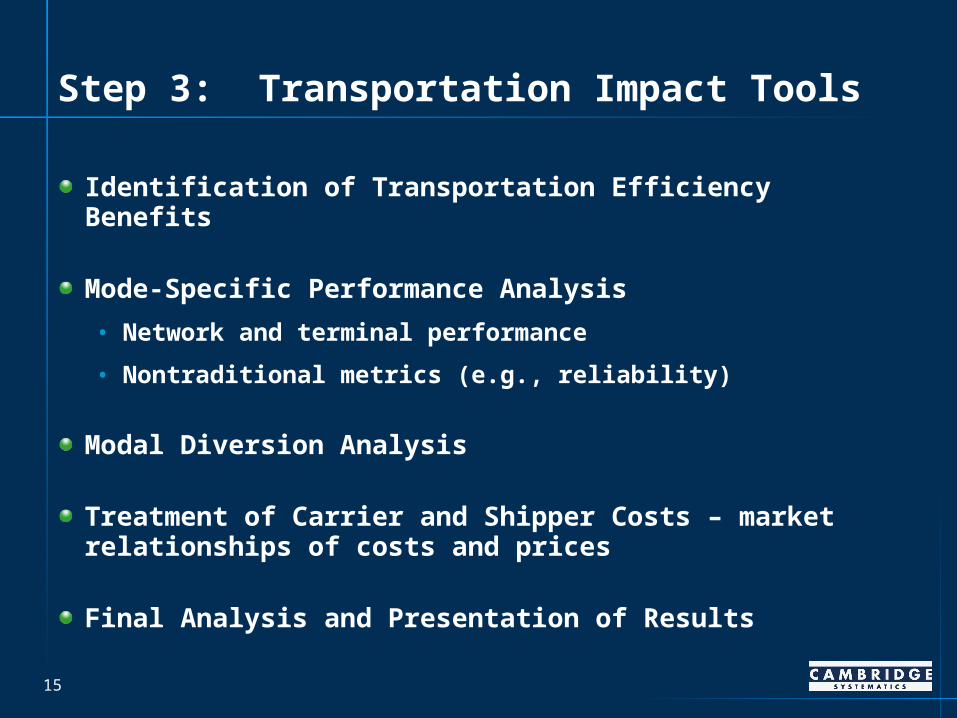
Step 3: Transportation Impact Tools
Identification of Transportation Efficiency Benefits
Mode-Specific Performance Analysis
• Network and terminal performance
• Nontraditional metrics (e.g., reliability)
Modal Diversion Analysis
Treatment of Carrier and Shipper Costs – market relationships of costs and prices
Final Analysis and Presentation of Results
16
Example Portrayal of Findings from Transportation Analysis
Truck Rail Air Sea
System Performance Impacts
Increased Vehicle Capacity (TEUs or tons per vehicle)
Increased Line or Terminal Capacity (vehicles per hour)
Increased Schedule Frequency
Reduction in Recurrent Interchange or Bottleneck Delays
Reduction in Nonrecurrent Incident Delays
Improved Safety
System Throughput Changes
Predicted Change in Throughput Volume
Shipper Impacts
Reduced Transport Costs
Reduced Logistics Costs
Improved Productivity
Improved Terminal Access
Enlarged Delivery Market Area Access
17
Step 4: Select and Apply Economic Impact Tool
Screening: Overall Economic Benefit
Industry Reorganization Effects
Establishing National and Local Distinctions
Selection and Application of Economic Models
Final Analysis and Presentation of Results
18
Measuring the Economic Impacts of Transportation Projects
Input Output Final Output
National Economic Impacts
Reduced Transport Costs
Reduced Logistics Costs
Business Market Expansion
Exports and Imports
Total U.S. output
GDP (Value Added)
Personal income
Local/Regional Economic Impacts
Change in local production costsa; or
Change in final demandb ; or
Change in accessibility/ quality of rail, air/sea port, highwayc
Total local outputa,b
Output from new business attractionc
Local personal incomea
Local GDP (value added)a
State and local tax revenuea
Value of externalities (discussed elsewhere)
19
Measuring the Economic Impacts of Transportation Projects (continued)
Input Output Final Output
Sector-Specific Economic Impacts
Change in production costs
Employment by freight carriers (by mode)
Output by freight carriers (by mode)
Profits by freight carriers (by mode)
Employment at logistics firms
Output and Profits logistics firms
Employment in nontransportation sectorsd
Output in nontransportation sectorsd
Profits in nontransportation sectorsd
a Denotes econometric model;b Denotes multiplier analysis;c Denotes business attraction model; andd Denotes stratification by North American Industrial Classification System.
20
Rough “First Cut” Estimate of the Supply Chain Benefit from a 10% Transportation Improvement
Source: Boston Logistics Group, Inc.Note: These benefits are indicative and preliminary estimates only that are based on average
companies in a broad cross-section of industries, including many that have little transportation cost and do not move physical product. More precise estimates that are targeted at specific Supply Chain Types™ should be developed using the tools referenced throughout this text.
Infrastructural Benefit
Supply Chain Impact
Supply Chain Benefit
Expressed As % of Operating Cost
Supply Chain Benefit
Expressed As % of Transport Cost
10% Transport Cost Reduction
Lower material cost by substituting farther cheaper sources
0.1% 1.5%
Consolidate plants due to extended reach 0.2% 4.1%
Switch modes and reduce shipment size, decreasing inventory
0.1% 1.2%
10% Capacity Increase
Less safety stock 0.1% 1.1%
Rationalization of fleet and warehouse assets 0.01% 0.3%
Secondary Effects
Increasing service levels Not quantified Not quantified
Converting cost savings into price reductions Not quantified Not quantified
On demand supply chains Not quantified Not quantified