54
Transporta Transporta tion tion Logistics Logistics CEE 587 CEE 587 Professor Professor Goodchild Goodchild 3/30/09 3/30/09
| Date post: | 20-Dec-2015 |
| Category: |
Documents |
| View: | 215 times |
| Download: | 1 times |

TransportaTransportation tion
LogisticsLogisticsCEE 587CEE 587
Professor Professor GoodchildGoodchild
3/30/093/30/09
IntroductionsIntroductions
NameNameHome departmentHome department
Degree program, stageDegree program, stageAcademic interestsAcademic interests

AssignmentsAssignments
5 homework assignments5 homework assignments Readings – in class quizzes and final Readings – in class quizzes and final
examexam Final exam (6/9)Final exam (6/9) Project (6/9)Project (6/9) In-class exercises (various)In-class exercises (various)
courses.washington.edu/cee587courses.washington.edu/cee587

What is What is Transportation Transportation
Logistics?Logistics?The Business School perspectiveThe Business School perspective
The Industrial Engineering The Industrial Engineering perspectiveperspective
The Civil Engineering perspectiveThe Civil Engineering perspectiveand there are others….and there are others….

Supply Chain Supply Chain ManagementManagement
Supply Chain Management is the Supply Chain Management is the management of the entire value-added management of the entire value-added chain, from the supplier to manufacturer chain, from the supplier to manufacturer right through to the retailer and the right through to the retailer and the final customer. SCM has three primary final customer. SCM has three primary goals: Reduce inventory, increase the goals: Reduce inventory, increase the transaction speed by exchanging data in transaction speed by exchanging data in real-time, and increase sales by real-time, and increase sales by implementing customer requirements implementing customer requirements more efficiently. more efficiently.

Supply chainsSupply chains Complex logistics system in which Complex logistics system in which
raw materials are converted into raw materials are converted into finished products and then finished products and then distributed to end users.distributed to end users.
In a In a pullpull chain finished products are chain finished products are manufactured when requested.manufactured when requested.
In a In a pushpush chain production and chain production and distribution are based on forecasts.distribution are based on forecasts.

LogisticsLogistics
““that part of supply chain that part of supply chain management that plans, implements, management that plans, implements, and controls the efficient, effective and controls the efficient, effective forward and reverse flow and forward and reverse flow and storage of goods, services and storage of goods, services and related information between the related information between the point of origin and the point of point of origin and the point of consumption in order to meet consumption in order to meet customers' requirements.”customers' requirements.”

LogisticsLogistics
Get the right materials to the right Get the right materials to the right place at the right time (minimize place at the right time (minimize cost, meet constraints)cost, meet constraints)
Estimated logistics costs, 11% GDPEstimated logistics costs, 11% GDP Logistics system: a set of facilities Logistics system: a set of facilities
(materials processed) linked by (materials processed) linked by transportation services (move transportation services (move materials) materials)

Freight Transportation Freight Transportation (Goods Movement)(Goods Movement)
The transit of goods. This occurs The transit of goods. This occurs through many modes of transportation through many modes of transportation including: maritime, air, rail, and truck. including: maritime, air, rail, and truck. Freight transportation includes the Freight transportation includes the handling of goods in distribution centers handling of goods in distribution centers and terminals (such as marine ports or and terminals (such as marine ports or airports). Cargo can be held in a variety airports). Cargo can be held in a variety of different containers. Intermodal of different containers. Intermodal transportation includes more than one transportation includes more than one mode.mode.

Transportation LogisticsTransportation Logistics
Supply chain Supply chain management, management, typically the typically the business school business school perspective, serves perspective, serves individual companiesindividual companies
Industrial Industrial engineering focusses engineering focusses on methodologies for on methodologies for improving logistics improving logistics in all contextsin all contexts
Transportation Transportation logistics from the CEE logistics from the CEE perspective looks at perspective looks at transportation from a transportation from a societal perspective, societal perspective, the net flow and the net flow and impact on the impact on the infrastructure. To infrastructure. To understand this we understand this we must know something must know something about SCM and IE.about SCM and IE.

Why is it Why is it important?important?

U.S. Business Logistics U.S. Business Logistics Costs, 2002, Billions of Costs, 2002, Billions of
Dollars Dollars InterestInterest 2323
Taxes, Obsolescence, Depreciation, Taxes, Obsolescence, Depreciation, InsuranceInsurance
197197
WarehousingWarehousing 7878
Truck – IntercityTruck – Intercity 300300
Truck - LocalTruck - Local 162162
RailroadsRailroads 3737
WaterWater 2727
Oil PipelinesOil Pipelines 99
AirAir 2727
ForwardersForwarders 99
Shipper Related CostsShipper Related Costs 66
Logistics AdministrationLogistics Administration 3535
Total Logistic CostsTotal Logistic Costs 910910

Growth in Freight Growth in Freight DemandDemand
100
150
200
250
300
1970 1975 1980 1985 1990 1995 2000
Ind
ex (
1975
=10
0)
Real GDP Total Ton-Miles Truck Ton-Miles

-
1,000,000
2,000,000
3,000,000
4,000,000
5,000,000
6,000,000
7,000,000
8,000,000
9,000,000
2006
2005
2004
2003
2002
2001
2000
1999
1998
1997
1996
1995
1994
1993
1992
1991
1990
1989
1988
1987
1986
1985
1984
1983
1982
1981
1980
Vancouver
Long Beach
Los Angeles
Oakland
Portland
Seattle
Tacoma

Alameda Alameda CorridorCorridor
Professor GoodchildProfessor Goodchild
Spring 09Spring 09

The ProblemThe Problem
Cities originally developed around ports, so Cities originally developed around ports, so our major port cities are also significant our major port cities are also significant urban areasurban areas
Ports are on the waterPorts are on the water Railroads head inlandRailroads head inland Historically rail lines terminated at the Historically rail lines terminated at the
historic center of the urban region, leaving historic center of the urban region, leaving a gap between the rail lines and the port.a gap between the rail lines and the port.
The connection between rail infrastructure The connection between rail infrastructure and port infrastructure is often very poor.and port infrastructure is often very poor.
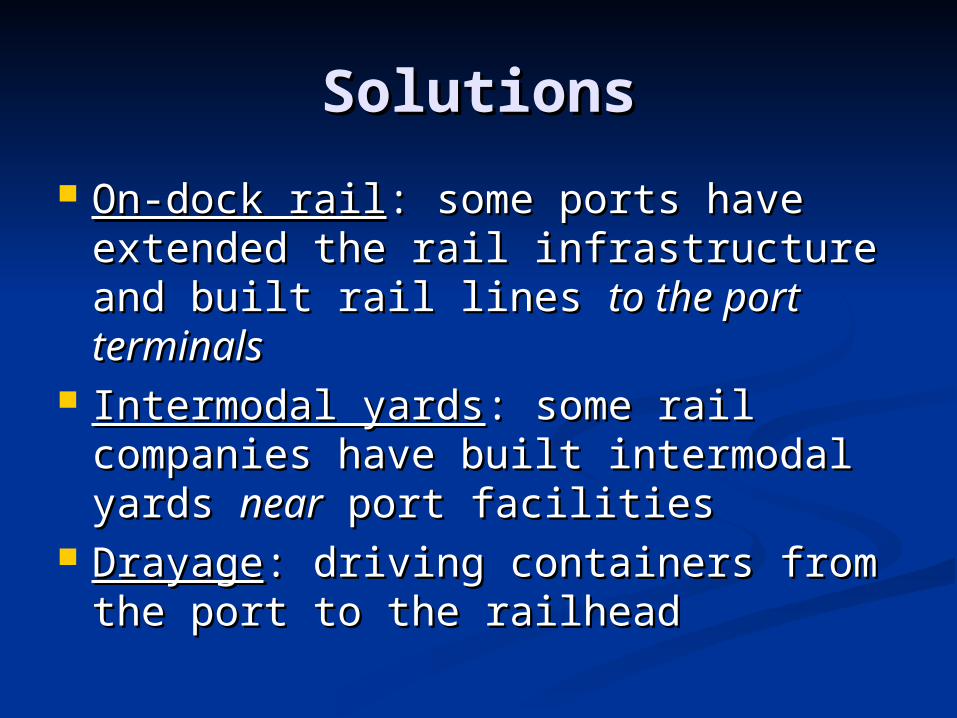
SolutionsSolutions
On-dock railOn-dock rail: some ports have : some ports have extended the rail infrastructure and extended the rail infrastructure and built rail lines built rail lines to the port terminalsto the port terminals
Intermodal yardsIntermodal yards: some rail : some rail companies have built intermodal companies have built intermodal yards yards nearnear port facilities port facilities
DrayageDrayage: driving containers from the : driving containers from the port to the railheadport to the railhead

BNSF and UP Railheads
Ports of LA/LB

34,000 truck trips per 34,000 truck trips per day day

One Solution in LA/LBOne Solution in LA/LB
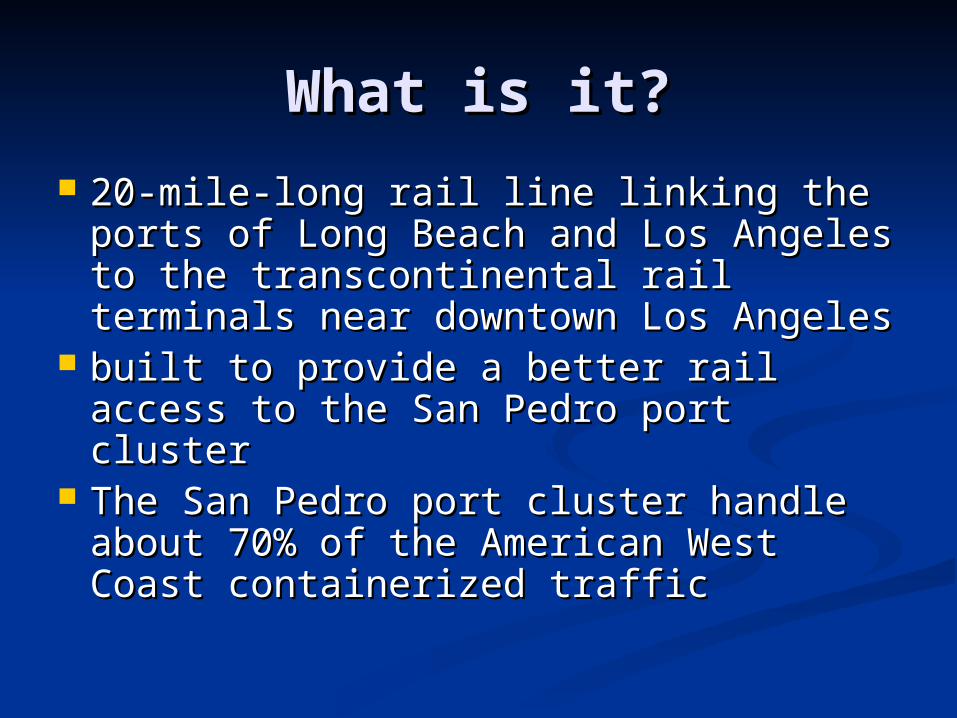
What is it?What is it?
20-mile-long rail line linking the 20-mile-long rail line linking the ports of Long Beach and Los Angeles ports of Long Beach and Los Angeles to the transcontinental rail terminals to the transcontinental rail terminals near downtown Los Angeles near downtown Los Angeles
built to provide a better rail access built to provide a better rail access to the San Pedro port clusterto the San Pedro port cluster
The San Pedro port cluster handle The San Pedro port cluster handle about 70% of the American West about 70% of the American West Coast containerized traffic Coast containerized traffic
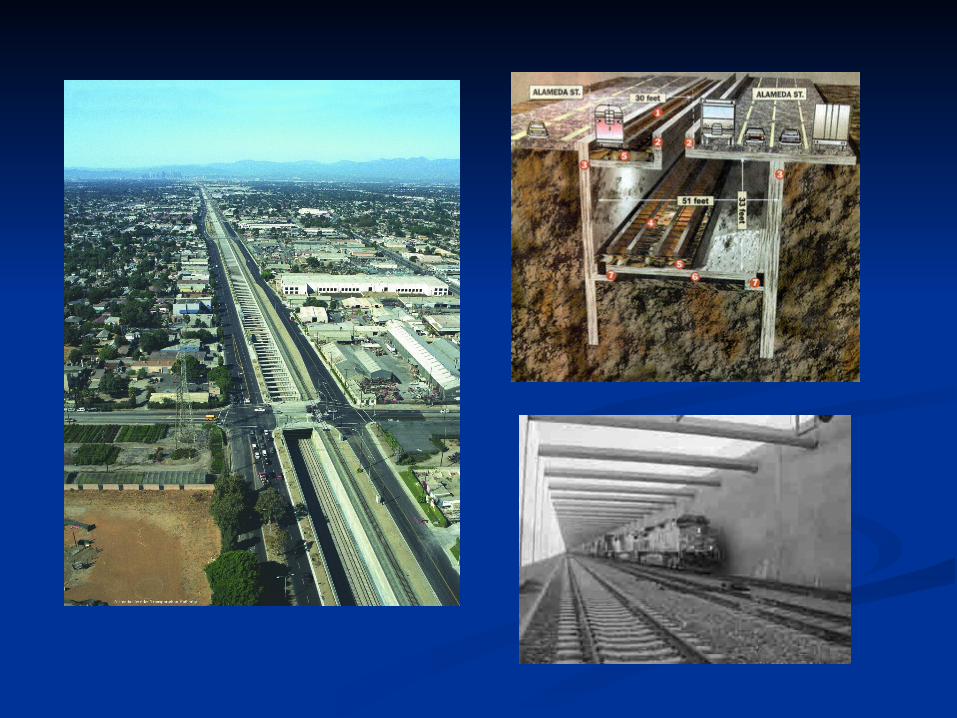

Alameda CorridorAlameda Corridor a series of bridges, underpasses, overpasses and a series of bridges, underpasses, overpasses and
street improvements that separate rail freight street improvements that separate rail freight circulation from local road circulationcirculation from local road circulation
$2.4 billion dollars$2.4 billion dollars Eliminate 200 at-grade roadway crossingsEliminate 200 at-grade roadway crossings Railroads pay $15 for each loaded 20 ft Railroads pay $15 for each loaded 20 ft
equivalent unit (TEU) container, $4 for each equivalent unit (TEU) container, $4 for each empty container, and $8 for other types of loaded empty container, and $8 for other types of loaded railcars, such as tankers and coal carriers. railcars, such as tankers and coal carriers.
Hope to encourage a modal shift from truck to Hope to encourage a modal shift from truck to rail – reduce congestionrail – reduce congestion

30% of trans-shipment 30% of trans-shipment traffic uses the facilitytraffic uses the facility

Demand was lower than Demand was lower than anticipatedanticipated
The corridor has succeeded in The corridor has succeeded in meeting revenue projections not meeting revenue projections not because they caused a modal shift because they caused a modal shift but because port traffic has grown but because port traffic has grown faster than anticipatedfaster than anticipated
No modal shift occurred although No modal shift occurred although the corridor did improve rail servicethe corridor did improve rail service reliability (2-6 hours to 45 minutes)reliability (2-6 hours to 45 minutes) travel time travel time

Why was demand lower Why was demand lower than anticipated?than anticipated?
Locally bound freight flowsLocally bound freight flows They could have anticipated thisThey could have anticipated this
Relative transport costsRelative transport costs Trucking industry rationalizationTrucking industry rationalization
Relocation of the bottleneckRelocation of the bottleneck High intermodal costsHigh intermodal costs
They could have anticipated thisThey could have anticipated this Freight distribution centersFreight distribution centers

Lack of understanding of Lack of understanding of goods movement dynamicsgoods movement dynamics
Many importers use distribution and Many importers use distribution and handling facilities in the LA/LB region to handling facilities in the LA/LB region to rehandle goods before putting them on rehandle goods before putting them on trainstrains
The assumption was that all goods that The assumption was that all goods that left the region on rail could simply be left the region on rail could simply be transferred without being handledtransferred without being handled
If they understood the underlying If they understood the underlying economic choices they could have better economic choices they could have better predicted the use of the facilitypredicted the use of the facility

Why are these goods Why are these goods handled?handled?
Inventory management strategies we Inventory management strategies we already discussed, also:already discussed, also:
Transfer from marine containers to Transfer from marine containers to domestic containersdomestic containers
Delay destination decisionsDelay destination decisions Tagging, handling, packaging, etc.Tagging, handling, packaging, etc. Factory based loading to store based Factory based loading to store based
loadingloading


Copyright © 1998-2007, Dr. Jean-Paul Rodrigue, Dept. of Economics & Geography, Hofstra University. For personal or classroom use ONLY. This material (including graphics) is not public domain and cannot be published, in whole or in part, in ANY form (printed or electronic) and on any media without consent. This includes conference presentations. Permission MUST be requested prior to use.
§̈¦105
§̈¦110§̈¦710
§̈¦405
§̈¦10
§̈¦5
§̈¦605§̈¦105
§̈¦10
§̈¦710
§̈¦710
§̈¦10
§̈¦10
§̈¦710
§̈¦10
£¤101
UV42
UV1
UV19
UV72
UV91
UV22
UV47
UV1
UV22
Alameda Corridor
Ground Level
Trench (30 feet)
0 2 4 6 81Miles
Port of Los AngelesPort of Long Beach
CBD
UP & BNSF Railyards
Mid-CorridorTrench (10 miles)
Alameda Corridor
UP & BNSF Railyards
Port of Los Angeles
Port of Long Beach
Thruport
Port Cluster

Copyright © 1998-2007, Dr. Jean-Paul Rodrigue, Dept. of Economics & Geography, Hofstra University. For personal or classroom use ONLY. This material (including graphics) is not public domain and cannot be published, in whole or in part, in ANY form (printed or electronic) and on any media without consent. This includes conference presentations. Permission MUST be requested prior to use.
San Pedro Bay Port San Pedro Bay Port Container DistributionContainer Distribution
51.4%
20.4%
8.5%
11.3%
8.5%
Truck to/from DC (regional)
Direct to rail (national)
Truck to/from near dock (national)
Truck to/from off dock (national)
Truck to/from DC then to rail (national)

Copyright © 1998-2007, Dr. Jean-Paul Rodrigue, Dept. of Economics & Geography, Hofstra University. For personal or classroom use ONLY. This material (including graphics) is not public domain and cannot be published, in whole or in part, in ANY form (printed or electronic) and on any media without consent. This includes conference presentations. Permission MUST be requested prior to use.
Number of Trains Running Through the Number of Trains Running Through the Alameda Corridor per Year and Alameda Corridor per Year and
Containers Handled by the San Pedro Containers Handled by the San Pedro Port Cluster, 2002-2007Port Cluster, 2002-2007
10,25914,558 15,972 17,306 19,924 17,824
0
10,000
20,000
30,000
40,000
50,000
2002 2003 2004 2005 2006 2007
Trai
ns p
er Y
ear
0
2
4
6
8
10
12
14
16
Mill
ions
San
Pedr
o Po
rts
(TEU
)
Usage Unused Capacity San Pedro Ports (TEU)
Supply ChainsSupply Chains

Supply Chain of an Supply Chain of an Individual FirmIndividual Firm
VendorsPlantsports
warehouse Factory DestinationCustomers
Transportation (rail, marine, road)
Transportation(e.g. long haul truck)
Transportation(e.g. local delivery truck)
warehouse
Transportation(e.g. LTL truck)
Information flow(security, internal management, and control)
Supply Distribution
Conflict between consumer oriented and inventory managementOperators, owners, managersSpatial distribution

Supply chainsSupply chains
In a In a pullpull chain finished products are chain finished products are manufactured when requested.manufactured when requested.
In a In a pushpush chain production and chain production and distribution are based on forecasts.distribution are based on forecasts.
This has integrated inventory This has integrated inventory management into business planningmanagement into business planning

Logistics DecisionsLogistics Decisions
Improve/change your existing Improve/change your existing systemsystem
Create a new systemCreate a new system Comparison with other systemsComparison with other systems Evaluate choices in your own systemEvaluate choices in your own system

Transportation GoalsTransportation Goals
Reduce cost (5-10% of sales)Reduce cost (5-10% of sales) Meet reliability goalsMeet reliability goals Meet service quality goalsMeet service quality goals Simplify operationsSimplify operations

Integration of Logistics into Integration of Logistics into Business OperationsBusiness Operations
Operational, or daily decisions are made by Operational, or daily decisions are made by comparing transportation and inventory comparing transportation and inventory costscosts
Strategic, or long term decisions are made Strategic, or long term decisions are made by comparing logistics costs (by comparing logistics costs (transportationtransportation and and inventoryinventory) to manufacturing and ) to manufacturing and production costsproduction costs
Lengthening of supply chains as Lengthening of supply chains as transportation cost decreased and new transportation cost decreased and new opportunities to reduce manufacturing cost opportunities to reduce manufacturing cost were foundwere found
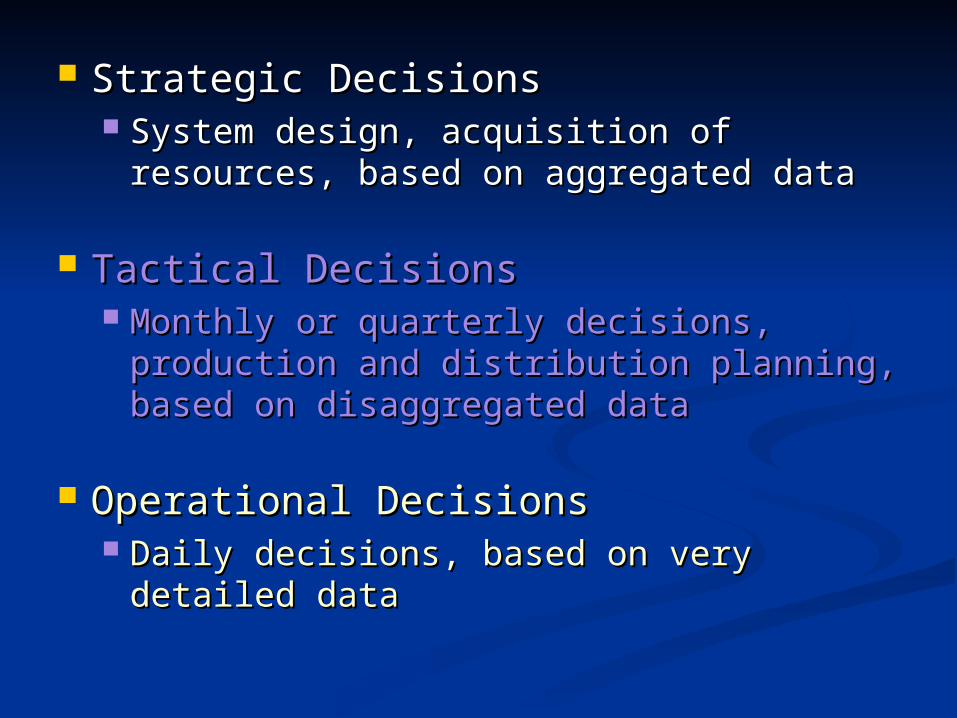
Strategic DecisionsStrategic Decisions System design, acquisition of resources, System design, acquisition of resources,
based on aggregated databased on aggregated data
Tactical DecisionsTactical Decisions Monthly or quarterly decisions, Monthly or quarterly decisions,
production and distribution planning, production and distribution planning, based on disaggregated databased on disaggregated data
Operational DecisionsOperational Decisions Daily decisions, based on very detailed Daily decisions, based on very detailed
datadata

MethodsMethods
BenchmarkingBenchmarking
SimulationSimulation
Optimization Optimization
Continuous approximationContinuous approximation

ConsiderationsConsiderations How accurate is your input data?How accurate is your input data? How do errors propagate in your analysis?How do errors propagate in your analysis? What have you learned from the analysis?What have you learned from the analysis? What kind of decision will you be making?What kind of decision will you be making? How does your analysis handle variability?How does your analysis handle variability? How well can your results be How well can your results be
communicated?communicated? Can your method be solved, or is your Can your method be solved, or is your
answer an approximation?answer an approximation? What level of complexity can be managed?What level of complexity can be managed?

Logistics DecisionsLogistics Decisions
Should I open a new facility? Where?Should I open a new facility? Where? How many trucks should I buy? What How many trucks should I buy? What
size?size? How much should be manufactured? How much should be manufactured?
Where?Where? How often should I send out delivery How often should I send out delivery
trucks?trucks? What mode of transportation should I What mode of transportation should I
use?use? How many drivers do I need today?How many drivers do I need today?

Logistics CostsLogistics Costs
Initial gains from deregulation (restructuring of networks) dropping off$1000 reduction to each household annually

How does REI get goods to How does REI get goods to market?market?
Asian Factories
West CoastPort
Distribution Center
Destination Store
Container on marine vessel
Drayage truck
Short orLong-haul
truck
Due to infrastructure government infrastructure investments and decreases in Transportation cost, transportation cost is typically much less significant than theReductions in manufacturing. Inventory management has been the area of attention.

In-transit inventory or pipeline inventoryIn-transit inventory or pipeline inventory: : inventory that is in the process of movement inventory that is in the process of movement from point of receipt or production and from point of receipt or production and between points of storage and distribution. between points of storage and distribution.
Inventory-at-restInventory-at-rest: inventory that is NOT in : inventory that is NOT in the process of movement from point of the process of movement from point of receipt or production and between points of receipt or production and between points of storage and distribution, rather it is storage and distribution, rather it is stationary, typically at a production facility, stationary, typically at a production facility, warehouse, distribution center, or warehouse, distribution center, or consumption facility.consumption facility.

How does REI get goods to How does REI get goods to market?market?
Asian Factories
West CoastPort
Distribution Center
Destination Store
Container on marine vessel
Drayage truck
Short orLong-haul
truck
In transit inventory

Cycle InventoryCycle Inventory: the average amount of inventory used to satisfy : the average amount of inventory used to satisfy demand between receipt of supplier shipments. The size of the demand between receipt of supplier shipments. The size of the cycle inventory is a result of the production or purchase of cycle inventory is a result of the production or purchase of material in large lots. Companies produce or purchase in large material in large lots. Companies produce or purchase in large lots to exploit economies of scale in the production, lots to exploit economies of scale in the production, transportation, or purchasing process. With the increase in lot transportation, or purchasing process. With the increase in lot size, however, also comes an increase in carrying costs. The size, however, also comes an increase in carrying costs. The basic trade-off supply managers face is the cost of holding basic trade-off supply managers face is the cost of holding larger lots of inventory (when cycle inventory is high) versus the larger lots of inventory (when cycle inventory is high) versus the cost of ordering product frequently (when cycle inventory is cost of ordering product frequently (when cycle inventory is low). Some of this inventory may be in-transit, while some may low). Some of this inventory may be in-transit, while some may be inventory-at-rest.be inventory-at-rest.
Safety inventorySafety inventory: inventory held in case demand exceeds : inventory held in case demand exceeds expectation; it is held to counter uncertainty. If they have too expectation; it is held to counter uncertainty. If they have too much safety inventory, goods go unsold and may have to be much safety inventory, goods go unsold and may have to be discounted. If the company has ordered too little safety discounted. If the company has ordered too little safety inventory, however, the company will lose sales and the margin inventory, however, the company will lose sales and the margin those sales would have brought. Therefore, choosing safety those sales would have brought. Therefore, choosing safety inventory involves making a trade-off between the costs of inventory involves making a trade-off between the costs of having too much inventory and the costs of losing sales due to having too much inventory and the costs of losing sales due to not having enough inventory. Generally this inventory is not having enough inventory. Generally this inventory is inventory-at-rest, so that it is immediately available.inventory-at-rest, so that it is immediately available.

Infrastructure Infrastructure ConsequencesConsequences
Global FlowsGlobal Flows North American FlowsNorth American Flows Regional FlowsRegional Flows Local FlowsLocal Flows

Growth in international Growth in international tradetrade
Caused greater reliance on intermodal connections, ports, and air terminals
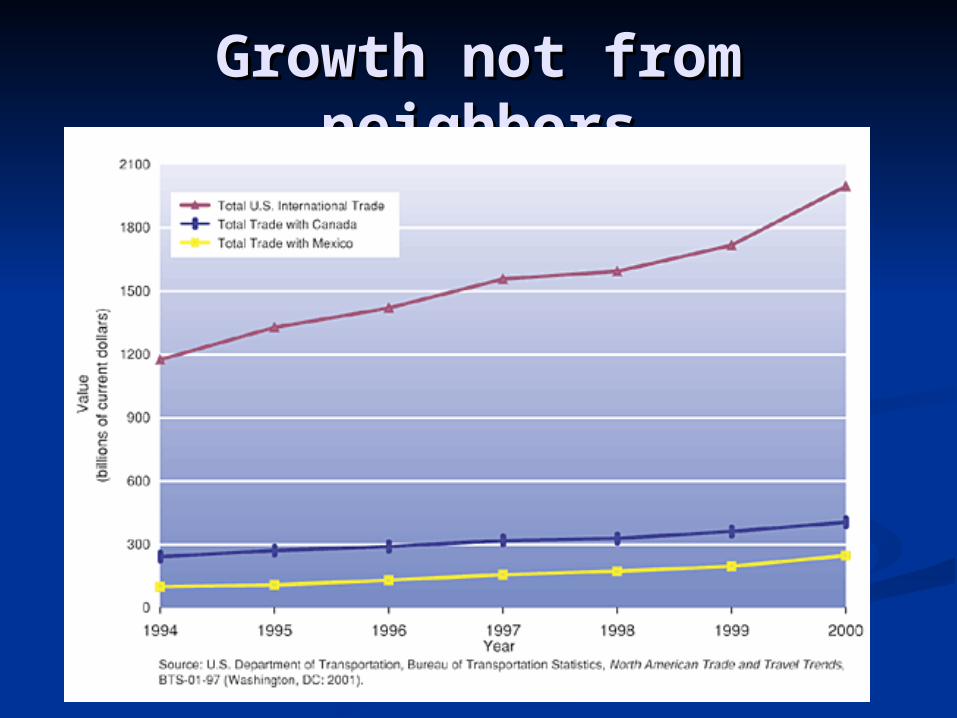
Growth not from Growth not from neighborsneighbors

US International Trade in Goods and Services
0
20,000
40,000
60,000
80,000
100,000
120,000
140,000
160,000
180,000
200,000
Janu
ary
Febru
ary
Mar
chApr
ilM
ayJu
ne July
Augus
t
Septe
mbe
r
Octobe
r
Novem
ber
Decem
ber
Janu
ary (
R)
Febru
ary (
R)
Mar
ch (R
)
April (
R)
May
(R)
June
(R)
July
(R)
Augus
t (R)
Septe
mbe
r (R)
Octobe
r (R)
Novem
ber (
R)
Decem
ber (
R)
Janu
ary
2006 - present
mil
lio
ns
of
do
lla
rs
export goods
export services
import goods
import services

Major GatewaysMajor Gateways
Importance of east-west corridors
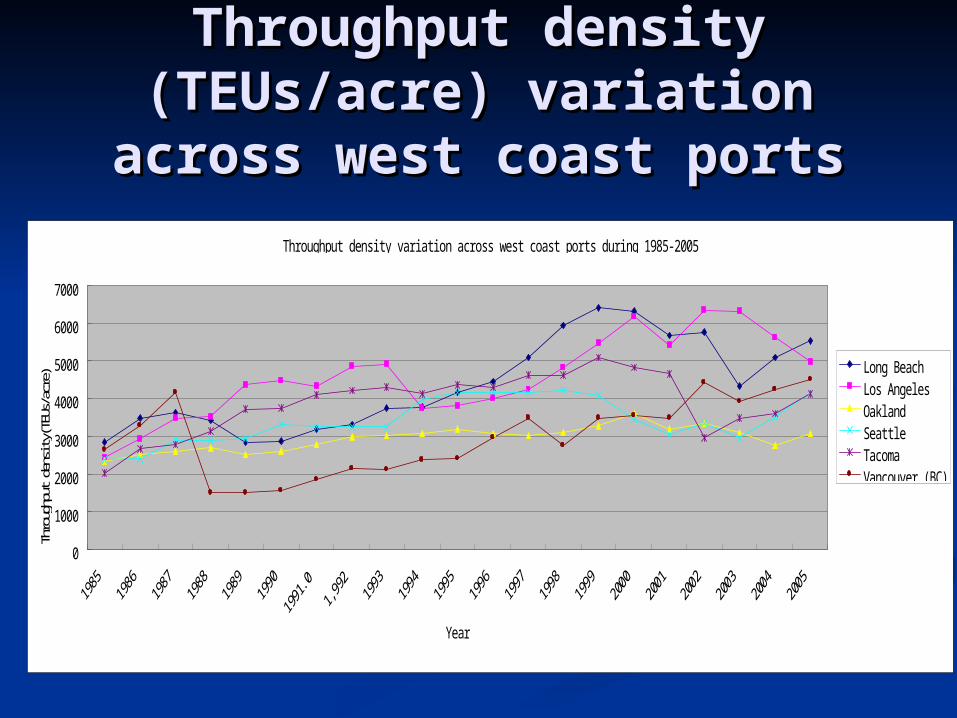
Throughput density Throughput density (TEUs/acre) variation (TEUs/acre) variation
across west coast portsacross west coast portsThroughput densi ty var i at i on across west coast ports dur i ng 1985- 2005
0
1000
2000
3000
4000
5000
6000
7000
Year
Thro
ughp
ut d
ensi
ty(T
EUs/
acre
) Long BeachLos Angel esOakl andSeat t l eTacomaVancouver (BC)

Shifting warehousing Shifting warehousing patternspatterns
0
5,000
10,000
15,000
20,000
25,000
30,000
35,000
40,000
45,000
50,000
0 2 4 6 8 10 12 14 16 18
King Employment
King Avg Wage
Pierce Employment
Pierce Avg Wage


