39
TRANSPORTATION RESEARCH C C I I R R C C U U L L A A R R Number E-CO14 September 2000 Traffic Analysis Software Tools TRANSPORTATION RESEARCH BOARD / NATIONAL RESEARCH COUNCIL
TRANSPORTATION RESEARCH
CCCIIIRRRCCCUUULLLAAARRRNumber E-CO14 September 2000
Traffic Analysis Software Tools
TRANSPORTATION RESEARCH BOARD / NATIONAL RESEARCH COUNCIL
2
FOREWORD
his Transportation Research Circular is an overview of Traffic Analysis SoftwareTools. It was developed for the Committees on Traffic Signal Systems (A3A18) and
Traffic Flow Theory and Characteristics (A3A11) of the Transportation Research Board. Itis intended for use by state and local transportation agency personnel and consultants tounderstand the availability and applicability of traffic software analysis tools.
Administrators, engineers, and researchers are continually faced with trafficproblems and situations that are often not easily solved by simple engineering analysistechniques. Models have been developed to facilitate such analyses, and many of these havebeen implemented in software. Often, managers are not familiar with the software toolsavailable, and as a result, such tools are not always used for these analyses. This report ofthe Transportation Research Board describes the state of the art in traffic software tools,primarily for the benefit of managers and administrators.
T
TRB WEBSITE: nationalacademies.org/trb
3
ACKNOWLEDGMENTS
his circular was completed by the Transportation Research Board (TRB) under thesupervision of Richard Cunard, Engineer of Traffic.
Special appreciation is expressed to Dr. Ziad Sabra, Sabra & Associates, Inc; Dr. Charles E.Wallace, University of Florida; and Dr. Feng-Bor Lin, Clarkson University, who wereresponsible for the preparation of the report.
Some of the materials in this report were initially contained in papers originallypublished in the ITE Journal and McTrans newsletter.
This circular was prepared by the authors as a service to TRB and the committeeslisted above. The authors appreciate the support of the committees.
T
TRADEMARKS AND COPYRIGHTS
The following names used in this guide are trademarks or copyrights of the companies ororganizations indicated:
• AAP8, HCS8, McT7F8, SOAP8, TRANSYT-7F8 and WHICH8 arecopyright, University of Florida.
• CORSIM8 and TSIS8 are copyright, ITT Industries, Systems Division.• FREQ8 is copyright, University of California, Berkeley.• HCM/CINEMA8 is copyright, KLD Associates, Inc.• INTEGRATION8 is copyright, Michael Van Aerde.• Microsoft7 is a registered trademark of Microsoft Corporation. WindowsTM
is a trademark of Microsoft Corporation.• NOSTOP and TEAPAC8 are copyright, Strong Concepts.• PASSER7 is a registered trademark of the Texas Transportation Institute.• PROGO8 and SNAG8 are copyright, COURAGE & WALLACE.• SIDRA8 is copyright, ARRB Research, Ltd.• Texas8 is copyright, University of Texas at Austin.• SYNCHRO8 is copyright, TrafficWare.• TRANSYT-7F8 is copyright, University of Florida.• TSDWIN8 is copyright, Fortran Traffic Systems Limited.• TS/PP-Draft8 is copyright, Greg Bullock.
4
TRAFFIC ANALYSIS SOFTWARE TOOLS
Dr Ziad SabraSabra and Associates, Inc.
Dr. Charles E. WallaceUniversity of Florida
Dr. Feng-bor LinClarkson University
INTRODUCTION
wenty years ago only a limited number of practitioners had access to the large-framecomputers required to use computerized traffic modeling tools . Highway/transportation
departments, large metropolitan areas, universities, and large companies were the fortunatefew. Others had to use analytical, manual techniques, or pay a high price for commercialcomputer services.
Now, microcomputers are as commonly available as the electronic calculators of the70s and, while more expensive than calculators, are easily within the economic reach ofvirtually every transportation professional in most locations throughout the world.
Developers of computerized traffic tools, such as the U.S. Department ofTransportation and some state Departments of Highways and Transportation, universitiesand private organizations have promulgated a substantial suite of software tools for everyphase of transportation planning and engineering in the past decades. The Federal HighwayAdministration (FHWA) and Federal Transit Administration (FTA) have even set upmicrocomputer software distribution and support centers to help get the products to users.
Currently for example, the Center for Microcomputers in Transportation(McTrans), lists over 475 software tools in these functional areas:
• Construction management;• Highway design, pavements, bridge design and hydraulics;• Maintenance;• Safety and accident records;• Surveying;• Traffic engineering;• Transit; and• Urban transportation planning.
The largest single group of software concerns traffic operations. Traffic operationssoftware tools have a wide range of applications. Some of them provide an alternative tomanual applications of widely used highway capacity analysis procedures. Others utilizesimulation for evaluation of the impact of changing traffic patterns, geometric designs andcontrol strategies. Also a number of tools have imbedded optimization capabilities to allowthe development of the best control strategies. Despite the abundance of traffic operations software, the lack of understanding ofsuch software among the executive and management levels of the transportation engineering
T
Transportation Research Circular E-C014: Traffic Analysis Software Tools 5
profession has inhibited software applications. Many public and private leaders in theprofession do not know what software is available or about its capabilities. They mistrustcomputers in general and sometimes even fear software because of the “black box”syndrome. The latter is certainly a legitimate concern, but proper education in the first twoareas, coupled with competent and proper use of computer programs by practitioners, cango a long way to allay the fear of the black box. The first question is, perhaps, “Why use computerized traffic tools in the firstplace?” Computerized traffic tools can be used to substantially increase the number ofalternative problem solutions an engineer, planner or analyst can consider. Indeed, usingcomputerized tools lets one examine potential solutions that are impossible to consider withmanual, analytical methods. Productivity is increased by an order of magnitude overtraditional non-computerized techniques. Using simulation tools lets us try out proposed designs and transportation improve-ments in the safety of the office without subjecting the public to potential hazards, and atconsiderably less cost than field trials. Optimization tools give the designer the opportunityto consider many options in a matter of minutes. There are many reasons to use such tools,but these are the main ones. The abundance of programs available today also creates some practical questions forusers and managers. “What program should I buy? Is there one program that can do it all?”Obviously, one must determine the objective of a specific application before choosing the“best” program. Unfortunately, this is not always the case, because many users and agenciesusually do not know enough about the programs. It is not unusual, therefore, to purchase anumber of programs and eventually only use one or two of them. Recognizing the need to better educate and inform both leaders and practitionersabout software, several agencies have set about a multi-pronged education program. In1993 the FHWA published the second edition of a “Traffic Models Overview Handbook (1,2).” This very detailed handbook is aimed at practitioners to give them an in-depth view ofthe programs’ capabilities, so they can thoroughly evaluate the potential applications. Thishandbook may, however, be too detailed for most executives and managers, plus it was notvery widely distributed. A compact disc (CD), “Advanced Traffic Analysis,” was developed for FHWA thatoffers those with CD-ROM drives on their computers an excellent preview of most oftoday’s publicly available traffic operations software. While the multi-media presentation isunsurpassed as a presentation medium, its exposure to executives and managers might belimited. To fill this vital gap in getting information on computer tools (primarily) to theleadership of agencies and companies, the Transportation Research Board (TRB) undertookthis effort to develop an “executive primer” on traffic operations tools (3). The TRBCommittees on Traffic Signal Systems and Traffic Flow Theory formed a joint task force inJanuary 1995 to develop a circular on this topic (4).
PURPOSE
The primary purpose of this circular is to present a concise, yet comprehensive introductionto the world of traffic operations analysis and optimization tools (5). Specifically, it
Transportation Research Circular E-C014: Traffic Analysis Software Tools 6
identifies and promotes traffic model applications for signalized and unsignalizedintersections, arterial highways, networks, freeways, and freeway/arterial corridors.
The objectives are to
• Identify the most useful, and most used, publicly as well as privately developedcomputerized packages for the profession, and
• Introduce the basic functions and capabilities of the software products.
The primary audience of the primer is the upper organizational echelon of agencies,although it should be of equal interest to practitioners as a convenient prelude to thehandbook and CD-ROM products. SCOPE Traffic congestion and mitigation, advanced traffic management strategies, non-construction-based improvements, and signal timing and re-timing, are among the areas inwhich traffic operations tools can be used effectively to help engineers make soundplanning, design, and operating decisions. This circular covers programs for trafficoperations that provide for simulation, capacity analysis, traffic signal timing analysis andoptimization, and freeway and corridor operations. Software used purely for data-collectionis not considered for inclusion. As noted above, both publicly and privately developed software products areincluded in the circular. Selection was made by the task force, based on two basic methods(The task force comprises experts in this field and most of the selected packages were wellknown to them.):
• A general “call for offers” was distributed in the March 1995 McTransnewsletter for others to request inclusion of their products (6).
• Selected software has to meet these criteria, and− If developed, the software must have had a proven “track record,” includingdocumented users or an acceptable publication record.− If under development, the value to the profession needs to be self-evident.
ORGANIZATION
This circular covers five major applications areas, as follows: 1) isolated intersections, 2)arterial highways, 3) networks, 4) freeways and freeway corridors, and 5) special analyses.Each area and its associated tools are discussed in the following sections.
It might be obvious that some tools listed in one application area can have multipleapplications. In such a case the tool is listed in accordance with its primary application.
ISOLATED INTERSECTION ANALYSIS AND SIGNAL TIMING TOOLS
Traffic analysis and optimization tools for isolated intersections have more than tripled inthe past five years. One reason is the promulgation of the Highway Capacity Manual(HCM), most recently updated in 1997 (TRB, 1997). The Highway Capacity Software
Transportation Research Circular E-C014: Traffic Analysis Software Tools 7
(HCS) (Sampson et al., 1997), was developed as a full and faithful implementation of theHCM, at least for all the commonly used chapters/facilities, but is limited to the HCMprocedures. Developers have sensed the need for other functionality, such as additionalperformance measures, unusual geometry and, of course, design features. Recent additionsto the suite of intersection analysis tools have tended to combine this expanded functionalitywith either the HCM procedures by imbedding them directly or by linking to the HCS.
Some tools naturally perform still other functions altogether, but all have a role inthe intersection design and analysis process (7). Typical examples of commonly usedperformance measures are delay, queues, number of stops, fuel consumption, and vehicleexhaust emissions.
Most importantly, some of the advanced tools can optimize phase sequences, cyclelengths and signal timing settings for actuated controllers. Some packages even provideusers with animation and visualization tools.
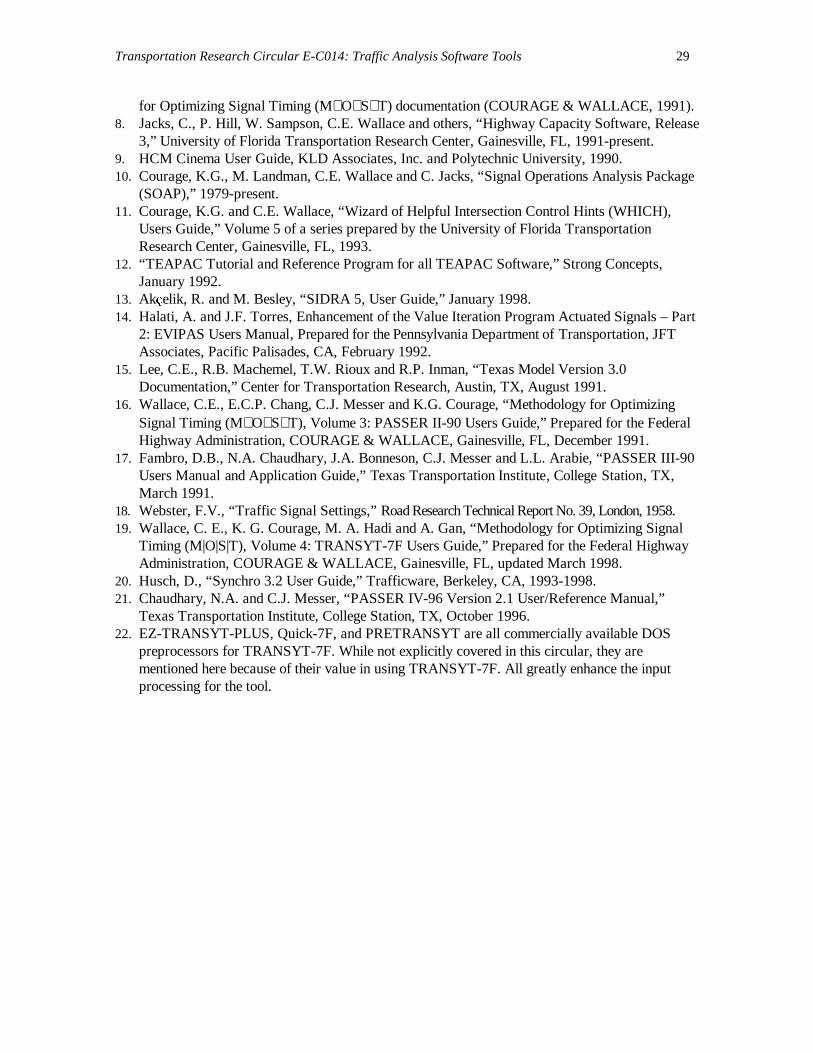
Tables 1 and 2 feature several major intersection-based programs. These programsinclude EVIPAS, HCM/CINEMA, HCS, SIDRA, SIGNAL97, SOAP, and Texas. Table 1presents a summary of the tools’ characteristics, such as applications and results. Table 2lists the tools’ data input and computer system requirements. Each of these programs isdiscussed below.
Highway Capacity Software
The most widely used computerized highway capacity method for signalized intersections isthe Highway Capacity Software (HCS) (8). It is a user-friendly procedure for estimatingintersection capacity and level of service (LOS). As noted earlier, the HCS is a faithfulimplementation of the HCM. It performs the procedures in the manual, and no more.
The HCS allows the user to enter intersection configuration data, traffic flows, andsignal phasing and timing data to compute stopped delay, volume-to-capacity ratio andLOS. The HCS does not perform timing design. The HCS application is limited to four-legintersections, multiple turning lanes and pre-timed and actuated signal control, to the extentcovered in the HCM.
A Windows-based version of the HCS is replacing the DOS version in early fall1998. This version of HCS is fully compatible with the 1997 update to the HCM.
HCM/CINEMA
HCM/CINEMA combines the HCM Chapter 9 procedure for analyzing isolated signalizedintersection level of service with a microscopic simulation tool (9). In addition to the basicHCM procedure, HCM/CINEMA optimizes the phase splits when used for design applications.The program allows the user to view intersection graphics during data entry and, mostimportantly, to view a microscopic simulation and dynamic animation of the results, usingthe simulation outputs of the NETSIM program (see section on CORSIM/NETSIM).
The NETSIM module used to create the simulation and animation is included withHCM/CINEMA; thus it needs not be acquired separately. HCM/CINEMA can also link toword-processing and desk-top publishing software to enhance the appearance and clarity ofreports.
Transportation Research Circular E-C014: Traffic Analysis Software Tools 8
The animation feature of HCM/CINEMA is very effective as a PR tool, especiallyfor small meetings, as well as for evaluating timing plans, geometric improvements anddetermining operational problems, such as queuing and overflows. HCM/CINEMA alsooffers measures of effectiveness (MOEs) such as delay, level of service, average speed,spillback in the worst lane, fuel consumption, emissions, speeds and queues. Passive anddynamic graphics screens can be printed at any time during a session of HCM/CINEMA.Animated screens can be zoomed and panned to view traffic movements and queuing onany section of the simulation approaches. The limits of HCM/CINEMA include fourapproaches, six lanes on each approach, two left-turn lanes, two right-turn lanes, sixoutbound lanes, 1300 m (4000 ft) for approach length, up to 330 m (1000 ft) for pocketlanes, up to 5 m (15 ft) lane width and up to 9999 vehicles per hour per movement. Otherdefined parameters include heavy vehicles, pedestrians, parking maneuvers, transit, andsignal phasing. HCM/CINEMA is compatible with the 1994 update to the HCM.
SOAP
Signal Operations Analysis Package (SOAP) can be used to determine signal timing plansfor pre-timed controllers and limited capabilities for actuated controllers (10). AlthoughSOAP is still used by several agencies, it has been largely overshadowed by more advancedand broader programs. Its main appeal is its inclusion in the Wizard of Helpful IntersectionControl Hints (WHICH) package, so it serves many users as a timing plan optimizer for usein conjunction with WHICH-supported tools (11).
The original version (still separately available) can perform multi-period analysis, butthe WHICH version is a single-period tool, since all other programs in the WHICH suite arelimited to single periods. The program optimizes cycle lengths and splits based on delay andstops.
SIGNAL97
SIGNAL97 can be used to perform capacity analysis, signal timing optimization and designof intersection geometry and control. SIGNAL97 is based on the 1997 update of the HCM.SIGNAL97 can analyze existing traffic conditions and timing as well as generate optimumsignal timing and phasing patterns. The optimizer seeks to establish the best attainable LOSfor critical movements within a specified range of cycle lengths.
The major benefit of the program is the flexibility it offers users to developindividual intersection control strategies spanning a variety of possible signal timingsolutions. For example, SIGNAL97 can be used to find the best cycle length for a givenLOS, to find the best phase sequence and optimal splits for a given cycle and a given LOS,to optimize the cycle length over a range of LOSs, and to analyze protected and permittedleft turns. It can provide a full summary report similar to the HCS but with more MOEs,such as maximum queues, fuel consumption, emissions, number of vehicles stopped, andaverage and total delay. SIGNAL97 also provides a schematic of the best phase sequence.
Another unique feature of SIGNAL97 is its planning application. Even withunknown signal phasing and timing data, the program can be used to optimize signalphasing and timing based on proposed geometry and forecast volumes. In addition, the
Transportation Research Circular E-C014: Traffic Analysis Software Tools 9
input and output data for SIGNAL97 are fully integratable with any of the TEAPACprogram family of tools (12, page 24). It is available for DOS and Windows.
SIDRA
Signalised and Unsignalised Intersection Design and Research Aid (SIDRA) is anintersection-based program developed by ARRB Transport Research, Ltd., in Australia asan aid for capacity, timing and performance analysis of isolated intersections (13). SIDRA isa very powerful analytical program for signalized intersections; roundabouts; and yield-,two-way stop-, or all-way stop-controlled intersections, with up to eight approaches. Besidesoptimizing phase sequences, splits, and cycle lengths, SIDRA has a wealth of graphic displaysof intersection geometry, including the number of lanes, turning lanes, and channelization.
An option to implement the U.S. HCM method is include d in SIDRA to help theanalysis and investigation of the differences between the SIDRA and HCM methods.SIDRA can be used to perform lane-by-lane analysis, lane flow calculations, shared lanesand lane blockage, right turn on red, capacities of short lanes, performance measures,variable cycle lengths, variable flow scale, and modeling of unequal lane utilization. Thevariable cycle length profiles allows agencies to determine the best cycle length and phasesequence based on user-determined criteria for signal optimization. Such functions includeminimizing stops and delay, queues, vehicle emissions, fuel consumption, or operating cost.The variable flow scale profiles can be used to investigate future growth scenarios. SIDRAhas the capability to model upstream and downstream short lanes, slip lanes, shared lanes,and opposed turns with multiple green periods.
SIDRA is perhaps the richest MOE-based intersection program. It offers MOEssuch as total and average delay, v/c ratios, queues, stops, speeds, fuel consumption,emissions, and operating costs. SIDRA is the only program that calculates capacity-basedMOEs on a lane-by-lane basis for all approaches, in addition to the total intersection MOEs.SIDRA is designed for single time periods, random arrival patterns (but with provision forplatooned arrivals generated by coordinated signals), and pre-timed or actuated signals.
SIDRA is also one of three tools that are currently used in the U.S. for capacityanalysis for roundabout intersections (the other two programs being ARCADY and Rodel,both British programs). For roundabout intersections, SIDRA can analyze intersections withup to eight approaches and also has provisions to assume either random or platooned arrivals(bunched vehicles) to analyze the effect of progression from nearby signalized intersections.
EVIPAS
All of the above isolated intersection programs offer limited applications to actuated-controlledintersections. Enhanced Value Iteration Process for Actuated Signals (EVIPAS) is anoptimization and simulation tool (14). EVIPAS is capable of analyzing, and developing theoptimal settings for, a wide variety of intersection geometric configurations, detector layouts,and actuated dual-ring controller phasing sequences. The user can select any of several MOEsas the basis for optimizing signal parameters for pretimed, semi-actuated, and fully-actuatedcontrollers, including volume-density control. EVIPAS also accounts for actuated pedestrianmovements. EVIPAS’ input data include intersection and approach geometric configurations,traffic flows, signal phasing, minimum signal timing periods, and optimization parameters.
Transportation Research Circular E-C014: Traffic Analysis Software Tools 10
The tool’s outputs include signal parameter settings, percent stops, operating costs,average stopped delay, and total vehicles discharged. The signal timing output consists ofsignal-phase variables such as minimum green, vehicle extension, added initial, maximuminitial, time before reduction, time to reduce, and minimum gap. EVIPAS can model only asingle left-turn lane, up to three thru lanes, a single right-turn lane, and intersections with upto five approaches. Two types of detectors are supported: stopline presence detectors and passagedetectors. Only one presence detector is allowed per lane; a total of three detectors is allowedfor each approach. EVIPAS does not optimize phase sequences has no graphics displays.
Texas
While all of the above programs provide users with analytical means to analyze and evaluatetraffic conditions and intersection control strategies, only two programs are capable ofmicroscopic simulation and animation of intersection traffic and roadway conditions:CORSIM and Texas (15). (See section on CORSIM/NETSIM)
Microscopic simulation is useful because it provides very detailed simulation of eachindividual vehicle within an intersection or a network of streets.
Texas is used to evaluate the operational effects of various traffic demands, types oftraffic control, and/or geometric configurations at individual, isolated intersections. It maybe applied in evaluating existing or proposed intersection designs and for assessing theeffects of changes in roadway geometry, driver and vehicle characteristics, flow conditions,intersection control, lane control, and signal timing plans upon traffic operations. It also hasthe capability to analyze signalized diamond interchanges.
A major strength of Texas is its ability to model real-world traffic applicationsincluding pretimed, semi-actuated, fully-actuated controllers, and double and triple left-turnlanes. Besides CORSIM, Texas is the only microscopic intersection-based program that cansimulate actuated controllers and lane-by-lane performance. Texas operates in a user-friendly, interactive environment. Special features include an animated graphics display thatshows color-coded vehicles moving through the intersection.
ARTERIAL ANALYSIS AND SIGNAL TIMING TOOLS
Arterial tools are grouped into two categories: operational analyses and signal timing designs.The analysis methods of the operational tools for uninterrupted and interrupted flow arecovered explicitly in Chapters 7 and 11 of the HCM, respectively. Optimization methods forarteries are covered in two widely accepted tools, namely PASSER II and PASSER III (16, 17).
Since its development in 1986, the computerized tool (HCS-Arterials) for Chapter11 of the HCM has been extensively used by traffic engineers and transportation planners.Generally, the objective of an operational analysis is to determine the total delay and level ofservice for an artery. With design, however, the optimization objective function is typicallyto maximize the sum of green bands on the artery by selecting the best cycle, splits andoffsets solutions. Such solutions are usually achieved with PASSER II for normal arteries.Special applications for optimization of signal timing at frontage road arteries and diamondinterchanges also are achieved by PASSER III. The characteristics, data requirements,performance measures and computer system requirements for these tools are summarized inTables 3 and 4.
Transportation Research Circular E-C014: Traffic Analysis Software Tools 11
HCS-Multilane
The HCS-Multilane method is used for analyzing uninterrupted flow on rural and suburbanartery highways, based on Chapter 7 of the HCM.
Data required for multilane analysis include traffic and roadway conditions, such ashourly traffic volumes and peak hour factors, terrain type, number of lanes, grade, vehicleclassification and composition, free-flow speed, median type, lateral clearance and numberof access points per mile. The results of the analysis include service flow rate, free-flowspeed, average passenger-car speed, density and LOS. The LOS is defined by the density oftraffic.
HCS-Arterials
HCS-Arterials implements the procedures in Chapter 11 of the HCM. HCS-Arterials allowsusers to perform both operational and planning analyses. For example, in the case of anoperational problem, the analysis determines the arterial LOS by investigating the effects ofsignal spacing, arterial classification, and traffic flow. The analysis method uses the HCMsignalized intersection procedure for the lane groups containing thru traffic.
Basic data required for the operational analysis include separation distance and free-flow speed between intersections; artery class for principal and minor arteries, such asurban, intermediate, and suburban (defined in Table 11-2 of the HCM); intersection cyclelength; phase sequence; signal timing; and arrival type.
HCS-Arterials results are presented on a section-by-section basis and includeintersection total delay, running time, arterial speed, and arterial level of service. The LOS isbased on the average travel speed and the arterial classification.
The HCS-Arterials planning method determines the LOS for a given average annualdaily traffic (AADT) value and can also suggest a maximum AADT for a given LOS. Theplanning method uses the same methodology as the operational analysis, but the arterialLOS is determined using default parameter values for signalized intersections.
Data required for the planning analysis include AADT, desired LOS, design-hourfactor (K), directional distribution factor, peak hour factor, adjusted saturation flow rate,percent turns from exclusive lanes, number of thru lanes, artery classification, mediancondition, free-flow speed, section length, number of signalized intersections in the analysis,arrival type for traffic, and signal-related data similar to the operations analysis. Resultsinclude projected two-way hourly volumes, running time, average travel speed, and arterial LOS.
PASSER II
PASSER II (Progression Analysis and Signal System Evaluation Routine, Tool II arteries)was originally developed in 1974 by the Texas Transportation Institute (TTI). PASSER II isan arterial-based bandwidth optimizer, which determines phase sequences, cycle length, andoffsets for a maximum of 20 intersections in a single run. Splits are determined using ananalytical (Webster’s) method, but are fine-tuned to improve progression (18). PASSER IIassumes equivalent pre-timed control, but it does represent dual-ring phasing.
PASSER II requires traffic flow and geometric data, such as design hour turningvolumes, saturation flow rates, minimum phase lengths, distances between intersections,cruise speeds, and allowable phase sequencing at each intersection.
Transportation Research Circular E-C014: Traffic Analysis Software Tools 12
The PASSER II timing outputs include design phase sequences, cycle length, splits,and offsets, and includes a time-space diagram. Performance measures include volume-to-capacity ratio, average delay, total delay, fuel consumption, number of stops, queue length,bandwidth efficiency, and level of service.
In addition to the time-space diagram, PASSER II has a dynamic progression simulator,which lets the user visualize the movement of vehicles along the artery using the design timing plan.
PASSER III
PASSER III, also developed by TTI, analyzes signalized diamond interchanges. Theprogram can evaluate existing conditions and optimize signal timing that minimizes averagedelay. It may also calculate signal timing plans for interconnecting a series of interchangesalong one-way frontage roads, similar to PASSER II.
PASSER III is capable of analyzing various multi-phase treatments, either with orwithout left-turn lanes, including permitted, protected, and permitted-plus-protected left-turn treatments. Common types of diamond interchanges analyzed by the program includehalf diamond, full diamond, full diamond with frontage roads, and split diamond.
PASSER III requires the same basic data as PASSER II, but the volume data mustbe specific as to interchange entry-exit points and additional data are needed on internalstorage capacities.
PASSER III results are similar to that of PASSER II in terms of MOEs and signaltiming settings, but no animated display is available.
NETWORK SIGNAL ANALYSIS, TIMING AND SIMULATION TOOLS
In the 1980s network signal design was dominated by TRANSYT-7F for optimizing delay,stops, and fuel consumption (19). A second tool, MAXBAND, was written for optimizinggreen bands on arteries in networks; however, it was not widely used because of extremerun times and being limited to mainframe users. It is now available for PC applications andruns more efficiently, but it is not widely available or used.
In recent years, however, two other programs have emerged: SYNCHRO andPASSER IV (20, 21). Although SYNCHRO duplicates much of the TRANSYT-7Ffunctionality and capability, it offers broader applications and utilities. It has a better userinterface; enhanced post-processing (including an interactive platoon dispersion diagram)and serves as a preprocessor for TRANSYT-7F, PASSER II, and CORSIM.
PASSER IV is a derivative of MAXBAND, retaining its objective function ofoptimizing green bands for arteries in the network. Tables 5 and 6 provide the details of theprograms in this section.
TRANSYT-7F
TRANSYT-7F (TRAffic Network StudY Tool, version 7, Federal) is designed to optimizetraffic signal systems for arteries and networks. The program accepts user inputs on signaltiming and phase sequences, geometric conditions, operational parameters, and trafficvolumes.
TRANSYT-7F is applied at the arterial or network level, where a consistent set oftraffic conditions is apparent and the traffic signal system hardware can be integrated and
Transportation Research Circular E-C014: Traffic Analysis Software Tools 13
coordinated with respect to a fixed cycle length and coordinated offsets. AlthoughTRANSYT-7F can emulate actuated controllers, its application is limited.
TRANSYT-7F optimizes signal timing by performing a macroscopic simulation oftraffic flow within small time increments while signal timing parameters are varied. Designincludes cycle length, offsets, and splits based on optimizing such objective functions asincreasing progression opportunities; reducing delay, stops, and fuel consumption; reducingtotal operating cost; or a combination of these.
For simulation, the program accepts the inputs as fixed variables and reports theperformance measures in terms of stops, delay, fuel consumption, and queuing. Whenoptimization is performed the user can either fix or select the best cycle length with the leastdelay and stops. Detailed optimization of offsets and splits can be performed for either auser-specified cycle length or the “best” cycle length found by the program. TRANSYT-7F’s performance measures include delay, stops, queue length, travel time, level of service,volume-to-capacity ratio, speed, total travel, fuel consumption, and operating cost. Whenoptimizing, TRANSYT-7F minimizes or maximizes an objective function, called thePerformance Index (PI). The PI may be a combination of delay and stops; fuel consumption;and/or optionally selected excessive maximum back of queue, excess operating costs, orprogression opportunities.
TRANSYT-7F has its own pre- and post-processors; namely, a simple data editor(T7FDIM) and the Platoon Progression Diagram (PPD). The T7FDIM provides the abilityto edit all record types of an input file. T7FDIM, however, requires that the user hasintimate knowledge of the TRANSYT-7F data record types, ordering, and contents.
The PPD presents a “contour” of flow versus time and distance along an artery.Queue build-up, dispersion and arrival of platoons are clearly shown for a visual insight onthe flow patterns normally occurring along the artery.
Other simplified and popular pre- and post-processors for TRANSYT-7F networkapplications include programs such as EZ-TRANSYT PLUS, PRETRANSYT, Quick-7Fand SYNCHRO (22). (See section on SYNCHRO below.)
Unique features of TRANSYT-7F include the program’s ability to analyze doublecycling, multiple greens, overlaps, right-turn-on-red, unsignalized intersections, bus andcarpool lanes, “bottlenecks,” shared lanes, mid-block entry flows, protected and/orpermitted left turns, user-specified bandwidth constraints, and desired degree of saturationfor movements with actuated control. Other applications of the tool include evaluation andsimulation of “grouped intersections” (such as diamond intersections and closely-spacedintersections operating from one controller) and sign-controlled intersections.
The latest release (Release 8, issued in 1998) includes a number of enhancements:explicit handling of saturated conditions, including the effects of queue spillover andintersection blocking; multi-period analysis; random stops; LOS; simulation of differentcycles among intersections; and optimization strategies for saturated conditions.
TRANSYT-7F is also available in both DOS and Windows 95/NT versions.
SYNCHRO
SYNCHRO is a macroscopic traffic signal timing tool that can be used to optimize signaltiming parameters for isolated intersections, generate coordinated traffic signal timing plansfor arteries and networks, and also develop time-space and platoon dispersion diagrams forinteractive fine-tuning. SYNCHRO can analyze fully actuated coordinated signal systems by
Transportation Research Circular E-C014: Traffic Analysis Software Tools 14
mimicking the operation of a NEMA controller, including permissive periods and forceoffpoints. SYNCHRO runs under Windows 95/NT and OS/2. Using a mouse, the user candraw either individual intersections or a network of intersecting arteries, and also canimport .DXF map files of individual intersections or city maps. The program has nolimitations on the number of links and nodes. It can analyze multi-legged signalizedintersections with up to six approaches per intersection. SYNCHRO does not, however,analyze sign-controlled intersections.
SYNCHRO is designed to optimize cycle lengths, splits, offsets, and phase orders.The program also optimizes multiple cycle lengths and performs coordination analysis.When performing coordination analysis, SYNCHRO determines which intersections shouldbe coordinated and those that should run free. The decision process is based on an analysisof each pair of adjacent intersections to determine the “coordinability factor” for the linksbetween them.
SYNCHRO calculates intersection and approach delays either based on Chapter 9 ofthe HCM or a new internal method. The major difference between the HCM method andthe SYNCHRO method is treatment of actuated controllers. The HCM procedures forcalculating delays and LOS are embedded in SYNCHRO; thus, the user does not need toacquire HCM software.
SYNCHRO is useful for agencies that want to operate groups of arteries ondifferent cycle lengths. Using SYNCHRO the user can optimize the entire network orgroups of arteries and intersections in a single run and determine the control boundaries ofthe different arterial groups, based on the program’s selection of the cycle lengths.
SYNCHRO requires mostly the same traffic flow and geometric data asTRANSYT-7F. The program can be used to evaluate existing traffic signal timing or tooptimize the settings for individual intersections, arteries, or a network. The programperformance measures include average approach delay, intersection delay, volume-to-capacity ratio, intersection level of service, 50- and 95-percentile queue lengths, total stops,travel time, emissions, and fuel consumption. Further, SYNCHRO has a generous listing ofuser-specified reports, including capacity analysis, LOS, delay, stops, fuel consumption,blocking analysis, and signal timing settings.
SYNCHRO has unique visual displays, including an interactive platoon dispersiondiagram. The user can change the offsets and splits with a mouse, then observe the impactson delay, stops, and LOS for the individual intersections, as well as the entire network.
Another significant strength of SYNCHRO is its ability to create data input streamsfor PASSER II, TRANSYT-7F, and CORSIM. Once the user has entered the data to runSYNCHRO successfully, it is possible to run any one of these programs without using anyof their preprocessors (these programs must be acquired separately). Following a successfulPASSER II or TRANSYT-7F run, the user has an option to use the results as inputs backinto SYNCHRO, and perform further evaluations.
PASSER IV
Using hourly traffic volumes, user-defined saturation flow rates and optional minimumgreen times, PASSER IV can optimize the progression bands for main arteries as well ascoordinated crossing arteries by computing the optimum cycle length, splits, phasesequences and subsequently adjusting the offsets for a maximum of 20 arteries and 35intersections.
Transportation Research Circular E-C014: Traffic Analysis Software Tools 15
PASSER IV is derived from MAXBAND and has its own user interface and canprint multiple signal timing reports and generate input data files for TRANSYT-7F.
The user interface for PASSER IV is very friendly. Its features include filemanagement functions, context-sensitive help, a powerful output view/print capability,ability to display a network map and three data entry/edit capabilities. The basic datastructure consists of a set of fully labeled screens arranged in hierarchical order. Data can beentered using the hierarchical data entry process, by directly working with the input data fileusing a built-in text editor, or by choosing entities from the network map display. The userinterface also allows the user to run TRANSYT-7F for performing bandwidth-constraineddisutility optimization. The inputs include link lengths, saturation flow rates, traffic volumes,average travel speeds, minimum green splits and the cycle length range.
CORSIM/NETSIM
Simulation tools are ideal tools for public presentations, evaluation of before and afterstudies, and routine planning and operations analysis. Simulation packages can offer theuser a valuable tool to observe animated traffic conditions, and evaluate alternativescenarios for roadway and signal system improvements in urban areas.
Two earlier simulation tools (NETSIM for surface street networks and FRESIM forfreeways) were recently combined into one tool, CORSIM. Some applications still use theindependent NETSIM, but FRESIM has been totally integrated (see CORSIM/FRESIMsection).
The NETSIM component of CORSIM is a program designed to simulate trafficoperations for isolated intersections, arteries, and/or networks. Specific traffic applicationsinclude evaluation of capacity improvements, before-and-after improvement conditions,priority bus lanes, work-zone lane closures, draw-bridge closures, light-rail preemption,two-way stop-controlled intersections, and many other traffic conditions. The programsupports fixed-time and actuated-controlled intersections. CORSIM is one of few programsdescribed in this circular that supports actuated control in its true sense and emulates thefunctions of NEMA and Type 170 controller units.
The NETSIM component of CORSIM is limited to a maximum of 250 nodes, 500links, 100 actuated controllers, 99 bus stops, and seven lanes per approach (with no morethan two left and two right turn lanes per approach). NETSIM can handle approximately 60intersections, with four-lane approaches. The maximum number of vehicles that may beaccommodated is 10,000. CORSIM can model a maximum of five approaches perintersection. The “size” limits for FRESIM applications are higher.
CORSIM is a time-based microscopic tool with stochastic (random) simulation ofindividual vehicles in traffic-controlled urban networks and freeways. The CORSIM trafficflow logic performs a full range of controls on vehicles traveling within specific lanes andresponding to any number of control devices including fixed time and actuated traffic signals,related surveillance systems, yield and stop signs, and ramp transitions. Vehicle flow is guidedby car-following rules, lane-changing logic, and other driver decision-making processes.
CORSIM has a wealth of MOEs, including delays, queue length, queue time, stops,stop time, travel time, speeds, fuel consumption, emissions, and other congestion-basedmeasures. These MOEs are calculated by movement and on a lane-by-lane basis for allintersection approaches.
Transportation Research Circular E-C014: Traffic Analysis Software Tools 16
Support programs for CORSIM include TSIS, the Traffic Software IntegratedSystem, and TRAFVU. TSIS is a Windows-based platform that provides menu-drivenaccess to CORSIM and others. TRAFVU is an interactive display post-processor.
CORFLO
CORFLO is an integrated set of five macroscopic tools: FREFLO, NETFLO 1 and 2,TRAFFIC and Capacity. NETFLO 1 and 2 provide a semi-detailed simulation of urbansignalized street networks and, therefore, they are relevant to this section.
NETFLO 1
NETFLO 1 is comparable to NETSIM but it is an event-based simulation of trafficoperations, rather than a time-based simulation (23). The major difference betweenNETSIM and NETFLO 1 is the level of detail of the individual vehicle movements.NETSIM moves each vehicle on a second-by-second basis according to a car followinglogic. NETFLO 1 is a simplified treatment of individual vehicles in the traffic stream thatdescribes the traffic movement at a lower level of detail than NETSIM. NETFLO 1 moveseach vehicle intermittently, that is whenever an event occurs, and moves that vehicle as fardownstream as possible in a single jump. No car following logic is employed in NETFLO 1;therefore, NETFLO 1 does not generate detailed vehicle trajectories. Each vehicle in thenetwork is treated as an identifiable entity. Its lateral and longitudinal position on a networklink and its relationship to other vehicles are determined by the model’s logic.
NETFLO 1 produces about the same MOE outputs as N ETSIM, but requires lesscomputer resources and execution time (but naturally, sacrificing “accuracy”). NETFLO 1can simulate fixed-time, and emulates stop, yield control, and single-ring actuated control,but does not model dual-ring control.
NETFLO 2
NETFLO 2 produces results similar to NETFLO 1 and NETSIM. NETFLO 2 was adaptedfrom the TRANSYT flow model. Inputs were simplified and the ability to handle time-varying traffic flows and multiple cycle lengths was added to overcome the deficiencies ofconstant traffic volumes and one uniform cycle length for traffic signals in TRANSYT. Thetraffic stream is described in terms of a set of link-specific statistical flow histograms. Thesehistograms describe the platoon structure of the traffic stream on each network link.NETFLO 2 can only simulate fixed-time signal control, and stop and yield controls.
NETFLO 1 and 2 handle up to 700 links and 500 nodes, and 1500 links and 500nodes, respectively. GCOR, the CORFLO interactive display post-processor, provides staticand animated displays and traffic assignment capabilities to NETFLO 1 and 2.
The comparison of the major features of CORSIM and CORFLO’s NETFLO 1 and2 is given in Table 7.
FREEWAY/CORRIDOR ANALYSIS AND RAMP METERING DESIGN TOOLS
Freeway and corridor tools deal primarily with evaluation, simulation, and optimization oftraffic operations on or at mainline sections, ramps, and High Occupancy Vehicle (HOV)lanes. The HCM, for example, has the most popular and widely accepted method for
Transportation Research Circular E-C014: Traffic Analysis Software Tools 17
evaluating capacity and Level of Service for mainlines, weaving sections, and rampjunctions. The HCM method, however, performs neither optimization nor simulation forany of the freeway elements. In addition, it can’t analyze the operation of integratedfreeway sections of ramps and weaving. These functions are performed with tools such asINTEGRATION, CORFLO/FREFLO, FREQ and CORSIM (24-26). Each of these tools isdiscussed below and their features are summarized in Tables 8 and 9.
HCS
The Highway Capacity Software implements basic freeway sections in Chapter 3 of theHCM. HCS-Weave and HCS-Ramps incorporate the procedures defined in Chapters 3, 4,and 5 of the HCM for basic freeway sections, weaving areas, and ramps and ramp junctions,respectively. The basic freeway section module includes operational, design, and planninganalyses. The operational analysis determines the level of service based on free-flow speed;existing traffic volumes; and roadway geometry, including number and width of lanes,grades, and lateral obstructions. The level of service determination is based on thecomputed conditions (maximum service flow rate and speed) for an equivalent ideal trafficstream. The design analysis of basic freeway sections is aimed at determining the number offreeway lanes to maintain a desirable level of service for a projected traffic volume. Theplanning analysis can be performed using either the design or the operational analysismethodology. Generally, the user supplies information on average annual daily trafficvolumes or design hourly volumes.
Data input requirements for the basic freeway analysis include number and width oflanes, free flow speed, terrain, grades, lateral obstructions, vehicle mix, and traffic volumes.
Data input requirements for weaving analysis include non-weaving freeway andweaving traffic volumes, weaving type, number and width of lanes, terrain, lateralobstructions, and the driver population type, such as weekday commuters, as opposed torecreational travel. Outputs include weaving and non-weaving speeds and level of service.The level of service criteria are based on the derived speeds.
Ramp analysis deals with freeway on and off ramps. Data input requirements forramp analysis include freeway and traffic volumes, length of acceleration or decelerationlanes, number and widths of lanes, terrain and free flow speeds of both the freeway as wellas the ramp. Outputs include maximum density and expected average speed of vehicles inthe ramp influenced areas and level of service. The level of service for ramps and rampjunctions is determined based on the computed maximum density in the merge influencearea of the freeway.
INTEGRATION
INTEGRATION is a microscopic tool originally developed in 1984. The tool simulates theinteraction of freeways and surface streets, traffic assignment, static and dynamic controls,and routings, in an integrated fashion. INTEGRATION represents the movement ofindividual vehicles in a time-stepping fashion, based on user specified speed-flow relationshipsfor each link and dynamically considers multi-path vehicle routes in response to any trafficcongestion that may develop during the course of a simulation run. This is one of the onlytools currently in use that has some “intelligent vehicle” capabilities. INTEGRATION has thecapability to evaluate weaving sections and arrival and departure of vehicles in toll plaza lanes.
Transportation Research Circular E-C014: Traffic Analysis Software Tools 18
Data requirements include link capacities, link speed-flow relationships, traffic signaltiming plans, ramp metering cycle lengths and green times, HOV designation, real-time linksurveillance, traffic volumes, origin-destination data, and roadway configuration andgeometry.
The visual output of the tool is an animation of individual vehicle movements andsignal control settings that are superimposed on a graphical representation of the network.This graphical interface permits the user to query the status of individual vehicles or links. Aseries of statistics on travel time, distance, number of stops, queue sizes, fuel consumption,and vehicle emissions are logged during each run to permit extensive post-processing ofselective results. INTEGRATION network outputs include total link travel time, totalnetwork travel time, average network speed, average trip length and time per vehicle, andtotal and average network stops.
The light version of the tool is capable of handling a network with up to 10,000vehicles, 100 links, 50 nodes, and 10 zones. The standard version of the tool has been usedfor networks of several thousand links, 500 zones and nearly 500,000 vehicles.
FREFLO
FREFLO is a component program of the CORFLO package. FREFLO was developed byFHWA and was released for microcomputer applications in 1993. FREFLO is a semi-detailed macroscopic simulation tool. Because of its less detailed simulation, the programcan be used to simulate large urban freeway networks with much less execution time thansome of the other microscopic simulation programs. Users can apply FREFLO to evaluatethe effectiveness of alternative freeway configurations and traffic management schemes, inresponding to predefined traffic flows. Using time-interval-based updates, the program hasthe capability to simulate multiple time periods.
FREFLO uses established relationships for entry flow rates, exit flow rates, density,and space-mean speeds on freeway segments. FREFLO is capable of handling up to 500links and 250 nodes (intersections). Each link may have up to nine lanes. Fleet componentsmay include carpools, cars, trucks, and buses. Merges, weaves, and lane changes cannot bemodeled explicitly. The only means to model ramp metering is to constrain the capacity of aramp link. HOV lanes can be analyzed in FREFLO.
Input requirements include entry volumes, turn percentages, link-node geometrydata, link capacities, free flow speeds, and origin-destination data. All of the inputs can beentered using the TRAFEdit editor. Outputs include travel speed, travel time, delay, fuelconsumption, and emissions. CORFLO has a static graphics post-processor called GCOR SCORG.
One of its major advantages is that FREFLO links can be connected directly toNETFLO 1 and 2 surface street links via an interface node. This permits an integratedcorridor analysis under CORFLO.
FREQ
FREQ was developed in 1968 by the University of California at Berkeley. FREQ is adeterministic, macroscopic traffic simulation tool. It is used for simulation of freewaycorridor priority lanes (FREQPL) and optimization of freeway ramp metering (FREQPE).The most recent improvements to FREQ include improved modeling of fuel consumption,emissions, modal shift, spatial shift, optimization, and improved input and output capabilities.
Transportation Research Circular E-C014: Traffic Analysis Software Tools 19
The simulation of FREQ responds to varying traffic demands, modal shifts, andspatial shifts through a demand-performance feedback process. Weaving and merginganalysis is performed using the 1965 Highway Capacity Manual technique. FREQPL (HOVanalysis tool) requires inputs such as highway section lengths, capacities, speed-flow curves,location and capacity of ramps, grades, lanes, freeway demand patterns or origin-destinationdata, occupancy distribution of each on-ramp, alternate route (i.e., parallel arteries) trafficflows, and HOV lane design data. The latter includes the number of lanes and the cut-offvehicle occupancy limit of the HOV lanes being evaluated. The FREQPE tool (rampmetering) requires much of the same freeway design data as FREQPL (except HOV data),plus ramp control specifications. FREQ includes a DOS graphical user interfacepreprocessor.
FREQPL’s outputs include traffic performance measures such as travel time, delay,queue, speed, fuel consumption, and emissions. Furthermore, FREQPL also producescontour maps of up to 10 traffic performance measures and spatial and modal responsetables comparing non-HOV with HOV alternatives using various traffic performancemeasures. FREQPE’s outputs include flows, densities, v/c ratios, travel times, speeds, rampdelays, queues, cost effectiveness, fuel consumption, and vehicle noise. FREQ also has anoutput processor that lets the user select specific program outputs.
A limitation of FREQ is that its two programs (FREQPL and FREQPE) can’t be runconcurrently and there is no direct interaction between the two programs. The maximumdimension limits of FREQ, version 11, include 24 time slices, 158 freeway subsections, and78 origins and destinations.
CORSIM/FRESIM
FRESIM is the other microscopic tool in the CORSIM simulation package. Simulation isbased on a time scan with each vehicle status updated every second. Because of itsmicroscopic, stochastic simulation, the run time of CORSIM is considerably longer thanmacroscopic programs such as FREFLO. CORSIM is designed to analyze operationalimprovements in freeway networks. FRESIM’s applications in CORSIM may include: oneto five thru-lane freeway mainlines with one- to three-lane ramps and one- to three-laneinter-freeway connectors; variations in grade, radius of curvature, and superelevation on thefreeway; lane additions and lane drops anywhere on the freeway; freeway blockage due toincidents; work zone sections; and auxiliary lanes used by traffic to enter or leave thefreeway. FRESIM does not directly model HOVs or reduced lane widths.
CORSIM provides realistic simulation of operational features such as acomprehensive lane-changing model; time-of-day and traffic-responsive ramp metering;comprehensive representation of a freeway surveillance system; representation of sixdifferent vehicle types, including two passenger car and four truck types, each with its ownperformance capabilities; heavy vehicle movements; differences in driver habits; andwarning parameters to influence the lane-changing behavior of vehicles approaching a lanedrop, incident, or off ramp.
CORSIM’s input requirements include geometry and operations parameters, turnmovements, entry volumes and optionally origin-destination data, and detector surveillanceand ramp metering data. CORSIM’s outputs include link operating statistics including totaltravel time, move time, delay time, total vehicle miles, density, travel speed, fuelconsumption, and vehicle emissions.
Transportation Research Circular E-C014: Traffic Analysis Software Tools 20
FRESIM’s limits within CORSIM include maximums of 10,000 vehicles, 200 links,120 nodes, and 20 freeway segments.
CORSIM may naturally be used for microscopic simulation of freeway/surface streetcorridors.
SPECIAL ANALYSIS TOOLS
For the purpose of this circular, special analysis tools are defined as interactive time-spaceand platoon dispersion tools. These tools are used to generate progression solutions forcoordinated arteries. The tools provide preliminary solutions to aid the traffic engineer infine-tuning optimal green bands for either one-way or two-way arteries.
Time-space diagram programs are good tools to generate preliminary progressionsolutions for coordinated arteries. Frequently, local government agencies are challenged tomake an improvement to exiting timing plans, most specifically to improve progression on asingle or a group (network) of arteries. Generally, to achieve this goal the agency isrequired to collect turning movement counts at each intersection on the affected artery andsubsequently use a computerized tool to predict and analyze the optimal solution forprogression on the artery. A solution is usually determined as a function of the best cyclelength, green splits, and offsets at each intersection that would yield the best progressionbands on the artery(ies). Next comes the field work for fine-tuning the optimal solution, toaccommodate for the variation in driver behavior and roadway conditions.
Although the order of these activities appears to be academically practical, it is veryseldom followed by local agencies. Chief among the reasons are the lack of personnel tocollect traffic volumes and lack of knowledge of computer tools. Despite these reasons,many agencies still fine-tune signal timing plans on arteries by manually preparing time-space diagrams, and subsequently performing travel-time and delay studies.
Since the early 1990s several time-space application programs have been developedto aid traffic engineers. The majority of the programs are demand-independent and onlyrequire input data such as distances between intersections, cycle length, splits, offsets, andtravel speeds. With this information, the programs are able to generate a time-spacediagram and allow the user to interactively manipulate the parameters. The remainder of thissection presents a summary of programs available to accomplish fine-tuning of signaltiming, with and without traffic volumes used as inputs to the programs. Summaries of thedata input, system requirements and objective functions are shown in Tables 10 and 11.
Until recently the application of the majority of time-space programs were limited toarterial applications; namely PASSER II, PROGO, NOSTOP, and TS/PP-Draft (27, 28). In recentyears, however, other programs have been developed for time-space diagram applications forboth arteries and networks. These programs include SNAG, SYNCHRO, and TSDWIN.Furthermore, some of the programs such as SYNCHRO and TS/PP-Draft also have theability to superimpose the platooning and dispersion of vehicles within the green bands.
Generally, platoon dispersion tools supplement a time-space diagram and may haveadditional information such as traffic volumes, queue, and stops superimposed on the time-space diagram. Programs that have both characteristics, that is, time-space and platoonprogression analysis, offer an obvious advantage to the user because of the visualinteraction of arrivals and queue discharge.
Applications, data and system requirements for each of the above programs aresummarized in Tables 10 and 11.
Transportation Research Circular E-C014: Traffic Analysis Software Tools 21
TSDWIN
TSDWIN is a Windows-based graphical tool, designed to assist analysts responsible forfine-tuning signal timing plans (29). The purpose of the program is to provide a quick andeasy method to achieve graphical representation of time-space diagrams for either a singleartery or a group of arteries, based on existing or proposed signal timing data (cycle length,splits, offsets).
TSDWIN organizes intersections into arteries and arterial groups. The program hasa capacity of 999 arteries and up to 12 intersections per artery. A combination of crossingarteries can be fine-tuned and analyzed in a single run. Timing for any intersection, includingthose that are common for crossing arteries, can be locked to prevent changes. Data andcorresponding graphical displays may be selected in either metric or imperial units. Splitsand offsets may be entered in seconds or percent. Coordination points can be referenced toeither the beginning of the green or the yellow interval. The program also allows the user toselect a double-cycle option for any intersection.
Data inputs required for TSDWIN include spacing and travel speeds betweenintersections, cycle length, splits, and offsets for all intersections. Traffic demands are notrequired.
The program’s outputs include graphic displays of the green band and flows. Thegreen band is color-coded and measured in seconds. A green band for both directions oftraffic movements is shown if one can be calculated, based on the timing data entered by theuser. If a continuous green band cannot be calculated, the link-to-link green band ispresented. This allows the user to evaluate how offsets might be adjusted to achieve acontinuous green band.
The directional flow displays show the calculated green band, if one exists, togetherwith a yellow band and red band. The yellow band indicates vehicles outside the green band,but that will clear the next intersection, and the red band represents vehicles that will notclear the next intersection. TSDWIN allows the user to vary the speeds between theintersections and determine the associated impact on existing or proposed progressionbands. Furthermore, using a mouse, TSDWIN provides an interactive user-interface tochange the offsets, splits, and lead-lag phase orders, and it recalculates the time-spacediagram parameters automatically when changed.
The database and any of the graphic displays can be printed in black and white orcolor. Other features of TSDWIN include its ability to import data from PASSER II, importand export delimited ASCII data, and access to context-sensitive on-line help.
NOSTOP
NOSTOP is another demand-independent bandwidth-based program. NOSTOP can be usedto view time-space diagrams based on user-defined signal timing data, optimized cyclelength, and offsets based on progression efficiency. It can determine the optimum cyclelength and offsets for variable speeds. Minimum data input requirements include distancesbetween intersections, green splits, directional speeds, and a range of cycle lengths.
NOSTOP provides the user with a graph of the variations of progression efficiencyover a complete range of cycle lengths and progression speeds. The program selects thecycle length with the best efficiency over a user-specified range. After selecting the optimal
Transportation Research Circular E-C014: Traffic Analysis Software Tools 22
signal timing parameters, NOSTOP calculates the green times for leading and lagging leftturns at each intersection without interfering with the thru band of the coordinated phases.It calculates the unused thru green times and widens the progression band in the preferentialdirection. One may use the optimal time-space diagram control parameters generated byNOSTOP (cycle length, splits, and offsets) and constrain these as inputs to TRANSYT-7Ffor fine tuning.
NOSTOP is available in two levels: level 1 has a capacity of 12 intersections andlevel 2 has a capacity of 25 intersections.
TS/PP-Draft
TS/PP-Draft is an arterial-based time-space and platoon progression diagram tool. UsingTS/PP-Draft the user can change control parameters such as phase sequences, splits,offsets, or cycle length, and observe an immediate change in a graphical time-spacediagram. The program allows the user to select one of two types of time-space diagrams: 1)a time-space diagram with green bands showing the approximate location of the platoon,and 2) a platoon progression diagram showing the traffic flow and queue lengths.
For a detailed analysis of platoon dispersion, the program requires the followingdata: speeds and distances between intersections, number of thru lanes, cycle length, phasesequences, splits, right-turns-on-red, volumes, and ideal saturation flow rates. The programcalculates the “actual” saturation flow rates using the method prescribed in Chapter 9 of theHighway Capacity Manual. For a display of the time-space diagram only, the program doesnot require any of the traffic volumes or lanes data. TS/PP-Draft allows the user to observeplatoon progression flows to enhance the fine tuning capability of the program. Based onthe type of arrivals, the user may easily adjust the offsets, phase sequences, or other controlparameters and view an immediate change on the monitor.
TS/PP-Draft is fully compatible with the AAP, thus allowing the user to import andexport AAP files. TS/PP-Draft can also import and export delimited ASCII data andprovides context-sensitive, on-line help.
PROGO
PROGO (PROgression Graphics and Optimization) is an arterial-based time-spaceoptimization program (30). The program has a limit of 20 intersections. PROGO uses adifferent approach to display progression than traditional time-space diagrams. It takes thetraditional time-space diagram and transforms it to produce a “time-location diagram.” Theuser can edit the time-location diagram to iteratively produce the best solution or theprogram will self-optimize. Fine tuning a PROGO solution can take several forms, bychanging any or a combination of the cycle length, phase sequences, offsets, or splits.
Users can run PROGO directly from within the AAP using “GDF” files created byboth PASSER II and TRANSYT-7F. PROGO is a DOS program.
Data required to run PROGO include link lengths and speeds, cycle length, phasesequences, splits, and offsets. Traffic demands are not required. The program’s onlymeasure of effectiveness is “progression opportunities” (PROS). PROS is defined as thenumber of progression opportunities between adjacent intersections on the artery.
Transportation Research Circular E-C014: Traffic Analysis Software Tools 23
SNAG
SNAG (Signal Network Animated Graphics) allows users to see the animated green bandstravel through the network of coordinated arteries for up to a total of 50 intersections (31).Unlike all other two-dimensional time-space diagram tools, SNAG displays the time-spacediagram in a three-dimensional network, with time being the third dimension. The animatedgraphics of three-dimensional time-space diagrams overcome a major deficiency of the oftenused two-dimensional diagrams. Its best applications can be well appreciated when usingthe program to evaluate progression on multiple arteries. SNAG provides engineers andmanagers with a cost-effective tool to evaluate the quality of any signal timing design in thenetwork. It answers the typical signal timing “What if” questions. Further, it serves as agood PR tool by showing animated graphics of systems at work. SNAG is a DOS program.
To generate a display of a three-dimensional time-space diagram SNAG requires thefollowing data: X-Y coordinates of intersections, phase sequences, link speeds, and signaltiming, including system cycle length, splits, and offsets. Traffic demands are not required.
To evaluate the effectiveness of progression solutions SNAG uses an efficiencyrating (performance index, or PI) similar to PASSER II. The PI is calculated by summingthe proportion of each link that falls into a progression band for each of 50 intervals (or 2%of the cycle). The user can assign link weights as a multiplier so that the PI can be higher ifgood progression exists on the links that are assigned the highest weight. Users can plotstatic displays of the screen graphic of the time-space diagram.
INTEGRATION OF TOOLS
Integration of tools refers to utilities that use a common data entry format for two or moreprograms. Instead of learning several data editors for various programs, integrator utilitiesallow the user to enter the data only once and subsequently run several programs of theuser’s choice. Below are descriptions of the most commonly used integrators for isolatedintersections, arteries, and networks.
A number of Windows-based integration tools are currently, or soon to be,underway. The Traffic Software Integrated System (TSIS), described later in this section,will increasingly become a computing platform for traffic analysis tools. While some of theintegrators described below (notably AAPEX and WHICH) will be functionally replacedwithin a year or two, they remain in wide use today.
WHICH
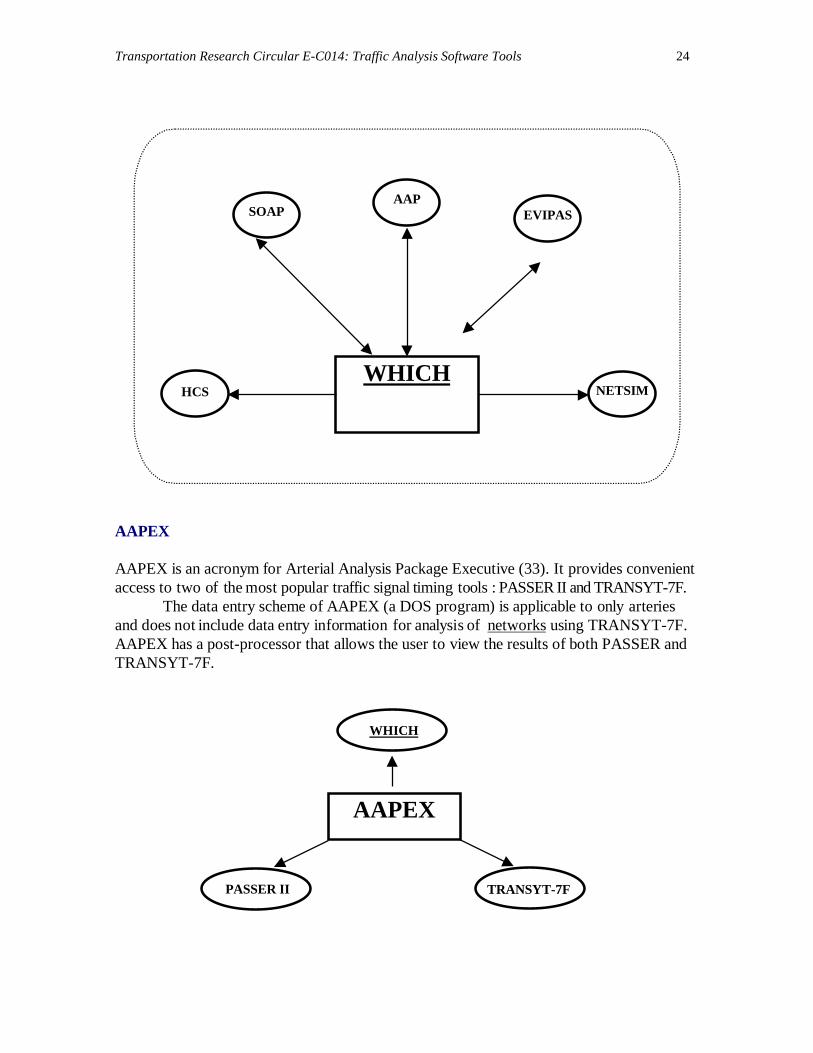
WHICH, the Wizard of Helpful Intersection Control Hints, is an integrator tool that integratestraffic control design parameters for isolated intersections and arteries into one commondata set. By doing so, the user can run several programs without getting into their data editors.WHICH interacts with several component programs such as SOAP, HCS, TRAF-NETSIM andseveral other non-signalized programs (32). Also, WHICH may be linked with the AAP.Some programs, such as TRAF-NETSIM, may require additional data entry from their owndata editors, depending on the specific application. Users should note that WHICH has thecapability to run TRAF-NETSIM only for isolated intersections. TRAF-NETSIM, and HCS arenot distributed with WHICH. (Note: since NETSIM has been merged into CORSIM, new userscan only obtain an unsupported version of the older TRAF-NETSIM to use with WHICH.)
Transportation Research Circular E-C014: Traffic Analysis Software Tools 24
AAPEX
AAPEX is an acronym for Arterial Analysis Package Executive (33). It provides convenientaccess to two of the most popular traffic signal timing tools : PASSER II and TRANSYT-7F.
The data entry scheme of AAPEX (a DOS program) is applicable to only arteriesand does not include data entry information for analysis of networks using TRANSYT-7F.AAPEX has a post-processor that allows the user to view the results of both PASSER andTRANSYT-7F.
WHICHHCS
SOAP
NETSIM
AAPEVIPAS
AAPEX
PASSER II TRANSYT-7F
WHICH
Transportation Research Circular E-C014: Traffic Analysis Software Tools 25
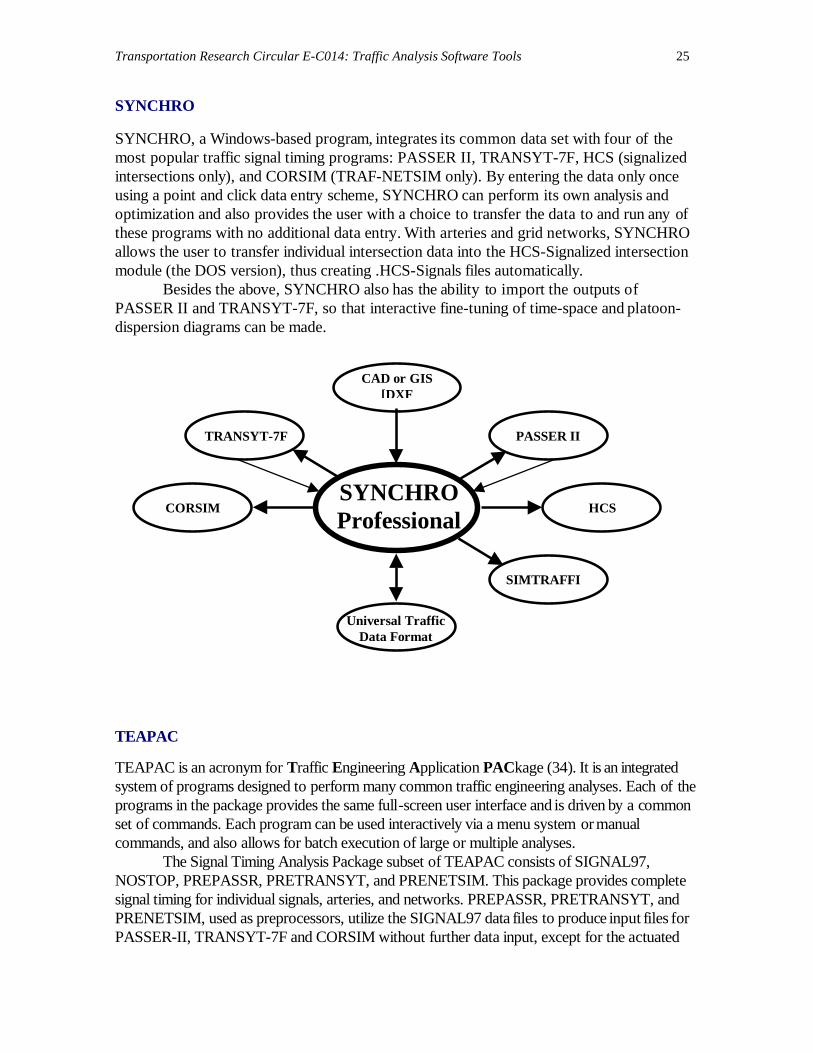
SYNCHRO
SYNCHRO, a Windows-based program, integrates its common data set with four of themost popular traffic signal timing programs: PASSER II, TRANSYT-7F, HCS (signalizedintersections only), and CORSIM (TRAF-NETSIM only). By entering the data only onceusing a point and click data entry scheme, SYNCHRO can perform its own analysis andoptimization and also provides the user with a choice to transfer the data to and run any ofthese programs with no additional data entry. With arteries and grid networks, SYNCHROallows the user to transfer individual intersection data into the HCS-Signalized intersectionmodule (the DOS version), thus creating .HCS-Signals files automatically.
Besides the above, SYNCHRO also has the ability to import the outputs ofPASSER II and TRANSYT-7F, so that interactive fine-tuning of time-space and platoon-dispersion diagrams can be made.
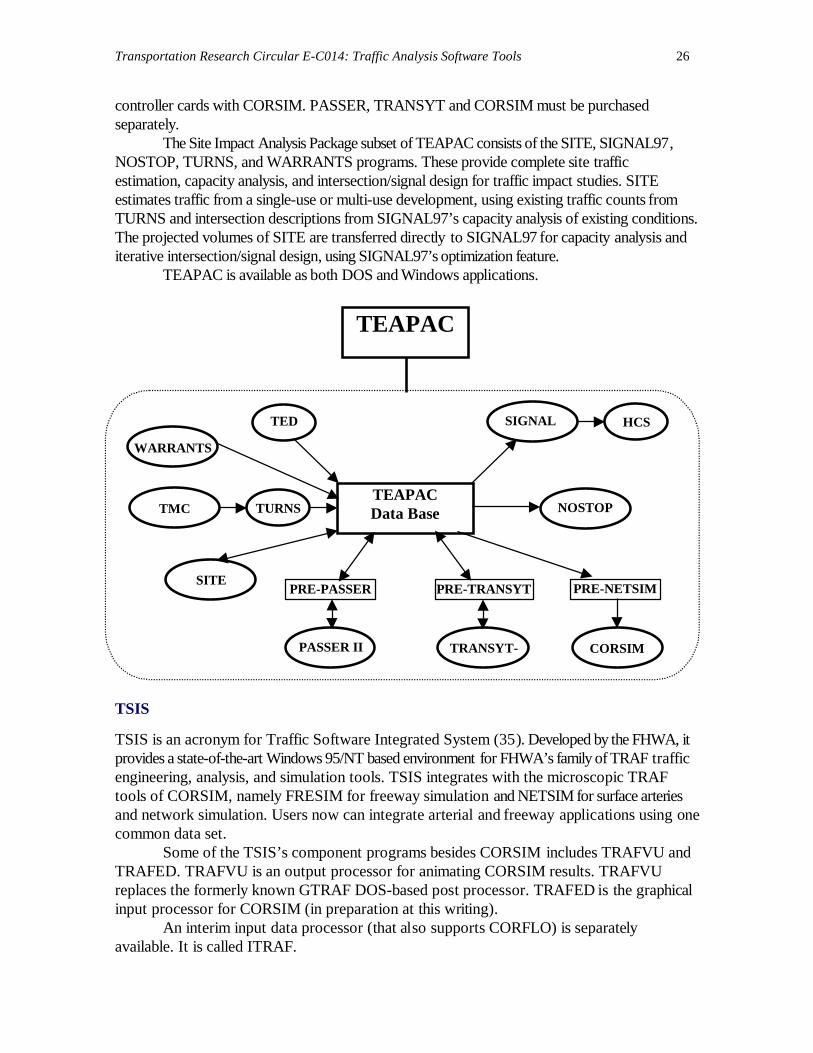
TEAPAC
TEAPAC is an acronym for Traffic Engineering Application PACkage (34). It is an integratedsystem of programs designed to perform many common traffic engineering analyses. Each of theprograms in the package provides the same full-screen user interface and is driven by a commonset of commands. Each program can be used interactively via a menu system or manualcommands, and also allows for batch execution of large or multiple analyses.
The Signal Timing Analysis Package subset of TEAPAC consists of SIGNAL97,NOSTOP, PREPASSR, PRETRANSYT, and PRENETSIM. This package provides completesignal timing for individual signals, arteries, and networks. PREPASSR, PRETRANSYT, andPRENETSIM, used as preprocessors, utilize the SIGNAL97 data files to produce input files forPASSER-II, TRANSYT-7F and CORSIM without further data input, except for the actuated
SYNCHROProfessional
PASSER IITRANSYT-7F
CORSIM HCS
SIMTRAFFI
Universal TrafficData Format
CAD or GIS[DXF
Transportation Research Circular E-C014: Traffic Analysis Software Tools 26
controller cards with CORSIM. PASSER, TRANSYT and CORSIM must be purchasedseparately.
The Site Impact Analysis Package subset of TEAPAC consists of the SITE, SIGNAL97,NOSTOP, TURNS, and WARRANTS programs. These provide complete site trafficestimation, capacity analysis, and intersection/signal design for traffic impact studies. SITEestimates traffic from a single-use or multi-use development, using existing traffic counts fromTURNS and intersection descriptions from SIGNAL97’s capacity analysis of existing conditions.The projected volumes of SITE are transferred directly to SIGNAL97 for capacity analysis anditerative intersection/signal design, using SIGNAL97’s optimization feature.
TEAPAC is available as both DOS and Windows applications.
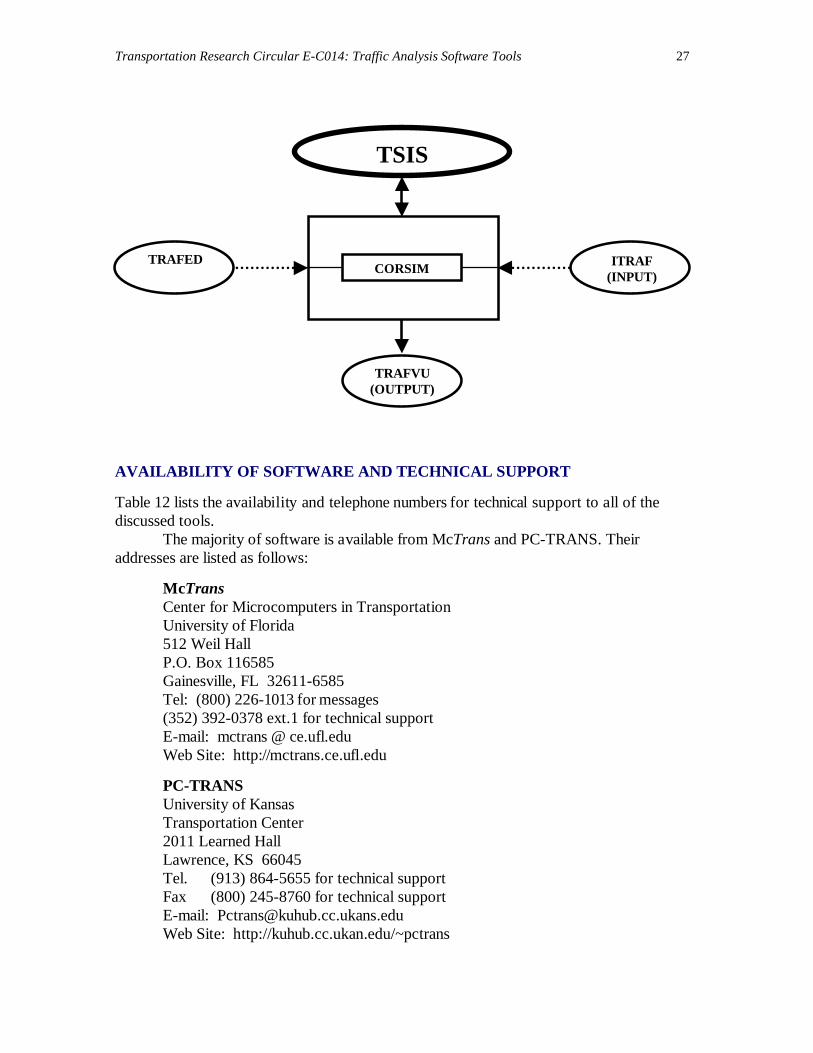
TSIS
TSIS is an acronym for Traffic Software Integrated System (35). Developed by the FHWA, itprovides a state-of-the-art Windows 95/NT based environment for FHWA’s family of TRAF trafficengineering, analysis, and simulation tools. TSIS integrates with the microscopic TRAFtools of CORSIM, namely FRESIM for freeway simulation and NETSIM for surface arteriesand network simulation. Users now can integrate arterial and freeway applications using onecommon data set.
Some of the TSIS’s component programs besides CORSIM includes TRAFVU andTRAFED. TRAFVU is an output processor for animating CORSIM results. TRAFVUreplaces the formerly known GTRAF DOS-based post processor. TRAFED is the graphicalinput processor for CORSIM (in preparation at this writing).
An interim input data processor (that also supports CORFLO) is separatelyavailable. It is called ITRAF.
TEAPACData Base
TEAPAC
HCS
PASSER II
PRE-PASSER
WARRANTS
SITE
TMC
SIGNAL
NOSTOPTURNS
TED
PRE-TRANSYT
TRANSYT-
PRE-NETSIM
CORSIM
Transportation Research Circular E-C014: Traffic Analysis Software Tools 27
AVAILABILITY OF SOFTWARE AND TECHNICAL SUPPORT
Table 12 lists the availability and telephone numbers for technical support to all of thediscussed tools.
The majority of software is available from McTrans and PC-TRANS. Theiraddresses are listed as follows:
McTransCenter for Microcomputers in TransportationUniversity of Florida512 Weil HallP.O. Box 116585Gainesville, FL 32611-6585Tel: (800) 226-1013 for messages(352) 392-0378 ext.1 for technical supportE-mail: mctrans @ ce.ufl.eduWeb Site: http://mctrans.ce.ufl.edu
PC-TRANSUniversity of KansasTransportation Center2011 Learned HallLawrence, KS 66045Tel. (913) 864-5655 for technical supportFax (800) 245-8760 for technical supportE-mail: [email protected] Site: http://kuhub.cc.ukan.edu/~pctrans
TRAFED ITRAF(INPUT)
TSIS
TRAFVU(OUTPUT)
CORSIM
Transportation Research Circular E-C014: Traffic Analysis Software Tools 28
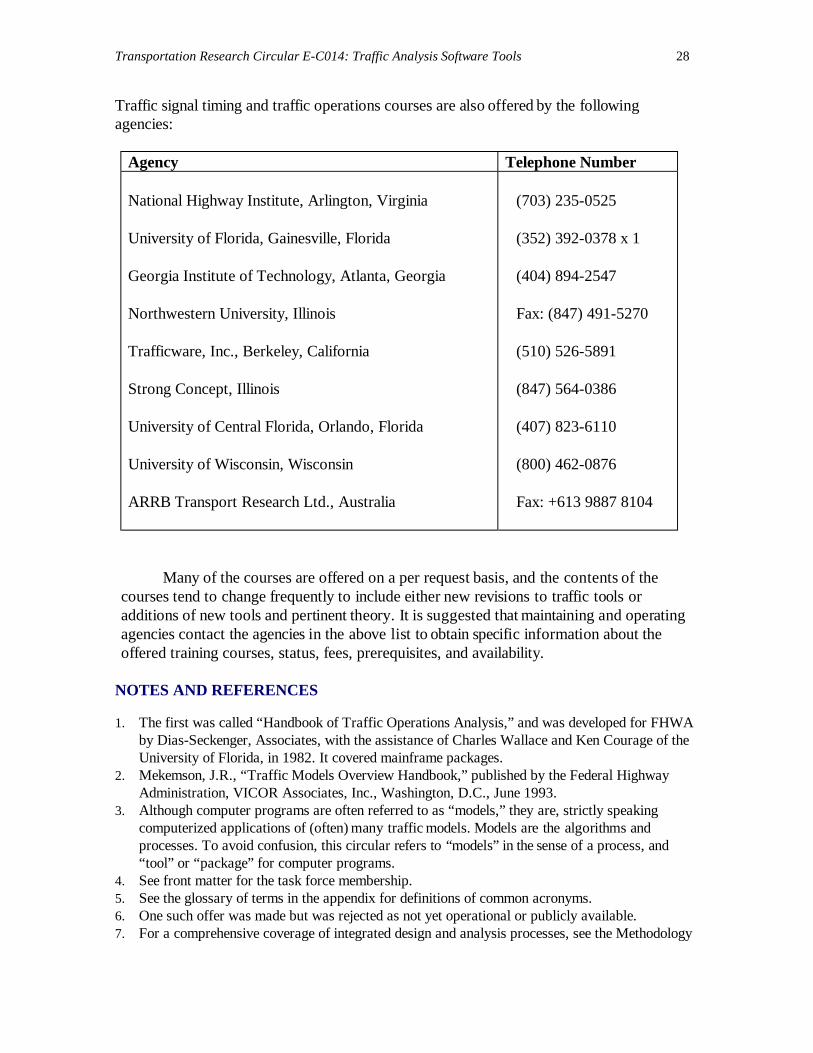
Traffic signal timing and traffic operations courses are also offered by the followingagencies:
Agency Telephone Number
National Highway Institute, Arlington, Virginia
University of Florida, Gainesville, Florida
Georgia Institute of Technology, Atlanta, Georgia
Northwestern University, Illinois
Trafficware, Inc., Berkeley, California
Strong Concept, Illinois
University of Central Florida, Orlando, Florida
University of Wisconsin, Wisconsin
ARRB Transport Research Ltd., Australia
(703) 235-0525
(352) 392-0378 x 1
(404) 894-2547
Fax: (847) 491-5270
(510) 526-5891
(847) 564-0386
(407) 823-6110
(800) 462-0876
Fax: +613 9887 8104
Many of the courses are offered on a per request basis, and the contents of thecourses tend to change frequently to include either new revisions to traffic tools oradditions of new tools and pertinent theory. It is suggested that maintaining and operatingagencies contact the agencies in the above list to obtain specific information about theoffered training courses, status, fees, prerequisites, and availability.
NOTES AND REFERENCES
1. The first was called “Handbook of Traffic Operations Analysis,” and was developed for FHWAby Dias-Seckenger, Associates, with the assistance of Charles Wallace and Ken Courage of theUniversity of Florida, in 1982. It covered mainframe packages.
2. Mekemson, J.R., “Traffic Models Overview Handbook,” published by the Federal HighwayAdministration, VICOR Associates, Inc., Washington, D.C., June 1993.
3. Although computer programs are often referred to as “models,” they are, strictly speakingcomputerized applications of (often) many traffic models. Models are the algorithms andprocesses. To avoid confusion, this circular refers to “models” in the sense of a process, and“tool” or “package” for computer programs.
4. See front matter for the task force membership.5. See the glossary of terms in the appendix for definitions of common acronyms.6. One such offer was made but was rejected as not yet operational or publicly available.7. For a comprehensive coverage of integrated design and analysis processes, see the Methodology
Transportation Research Circular E-C014: Traffic Analysis Software Tools 29
for Optimizing Signal Timing (M O S T) documentation (COURAGE & WALLACE, 1991).8. Jacks, C., P. Hill, W. Sampson, C.E. Wallace and others, “Highway Capacity Software, Release
3,” University of Florida Transportation Research Center, Gainesville, FL, 1991-present.9. HCM Cinema User Guide, KLD Associates, Inc. and Polytechnic University, 1990.10. Courage, K.G., M. Landman, C.E. Wallace and C. Jacks, “Signal Operations Analysis Package
(SOAP),” 1979-present.11. Courage, K.G. and C.E. Wallace, “Wizard of Helpful Intersection Control Hints (WHICH),
Users Guide,” Volume 5 of a series prepared by the University of Florida TransportationResearch Center, Gainesville, FL, 1993.
12. “TEAPAC Tutorial and Reference Program for all TEAPAC Software,” Strong Concepts,January 1992.
13. AkHelik, R. and M. Besley, “SIDRA 5, User Guide,” January 1998.14. Halati, A. and J.F. Torres, Enhancement of the Value Iteration Program Actuated Signals – Part
2: EVIPAS Users Manual, Prepared for the Pennsylvania Department of Transportation, JFTAssociates, Pacific Palisades, CA, February 1992.
15. Lee, C.E., R.B. Machemel, T.W. Rioux and R.P. Inman, “Texas Model Version 3.0Documentation,” Center for Transportation Research, Austin, TX, August 1991.
16. Wallace, C.E., E.C.P. Chang, C.J. Messer and K.G. Courage, “Methodology for OptimizingSignal Timing (M O S T), Volume 3: PASSER II-90 Users Guide,” Prepared for the FederalHighway Administration, COURAGE & WALLACE, Gainesville, FL, December 1991.
17. Fambro, D.B., N.A. Chaudhary, J.A. Bonneson, C.J. Messer and L.L. Arabie, “PASSER III-90Users Manual and Application Guide,” Texas Transportation Institute, College Station, TX,March 1991.
18. Webster, F.V., “Traffic Signal Settings,” Road Research Technical Report No. 39, London, 1958.19. Wallace, C. E., K. G. Courage, M. A. Hadi and A. Gan, “Methodology for Optimizing Signal
Timing (M|O|S|T), Volume 4: TRANSYT-7F Users Guide,” Prepared for the Federal HighwayAdministration, COURAGE & WALLACE, Gainesville, FL, updated March 1998.
20. Husch, D., “Synchro 3.2 User Guide,” Trafficware, Berkeley, CA, 1993-1998.21. Chaudhary, N.A. and C.J. Messer, “PASSER IV-96 Version 2.1 User/Reference Manual,”
Texas Transportation Institute, College Station, TX, October 1996.22. EZ-TRANSYT-PLUS, Quick-7F, and PRETRANSYT are all commercially available DOS
preprocessors for TRANSYT-7F. While not explicitly covered in this circular, they arementioned here because of their value in using TRANSYT-7F. All greatly enhance the inputprocessing for the tool.
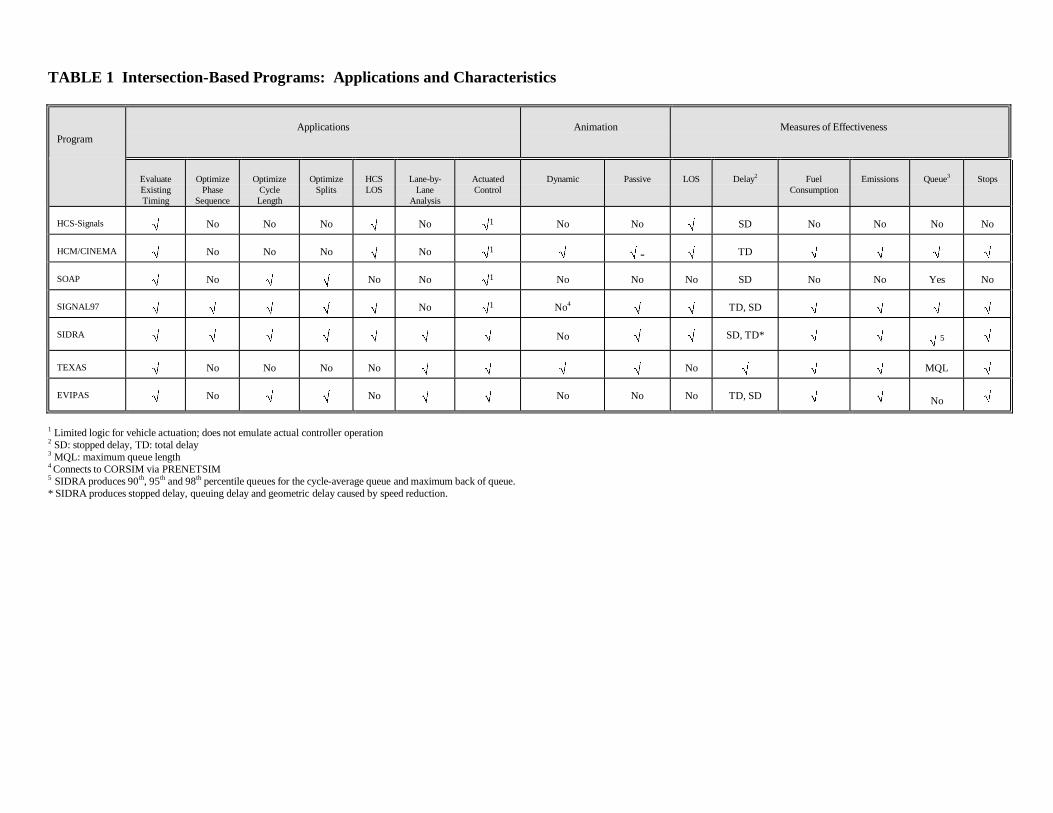
TABLE 1 Intersection-Based Programs: Applications and Characteristics
ProgramApplications Animation Measures of Effectiveness
EvaluateExistingTiming
OptimizePhase
Sequence
OptimizeCycleLength
OptimizeSplits
HCSLOS
Lane-by-Lane
Analysis
ActuatedControl
Dynamic Passive LOS Delay2 FuelConsumption
Emissions Queue3 Stops
HCS-Signals √ No No No √ No √1 No No √ SD No No No No
HCM/CINEMA √ No No No √ No √1 √ √ - √ TD √ √ √ √
SOAP √ No √ √ No No √1 No No No SD No No Yes No
SIGNAL97 √ √ √ √ √ No √1 No4√ √ TD, SD √ √ √ √
SIDRA √ √ √ √ √ √ √ No √ √ SD, TD* √ √ √ 5 √
TEXAS √ No No No No √ √ √ √ No √ √ √ MQL √
EVIPAS √ No √ √ No √ √ No No No TD, SD √ √ No √
1 Limited logic for vehicle actuation; does not emulate actual controller operation2 SD: stopped delay, TD: total delay3 MQL: maximum queue length4 Connects to CORSIM via PRENETSIM5 SIDRA produces 90th, 95th and 98th percentile queues for the cycle-average queue and maximum back of queue.* SIDRA produces stopped delay, queuing delay and geometric delay caused by speed reduction.
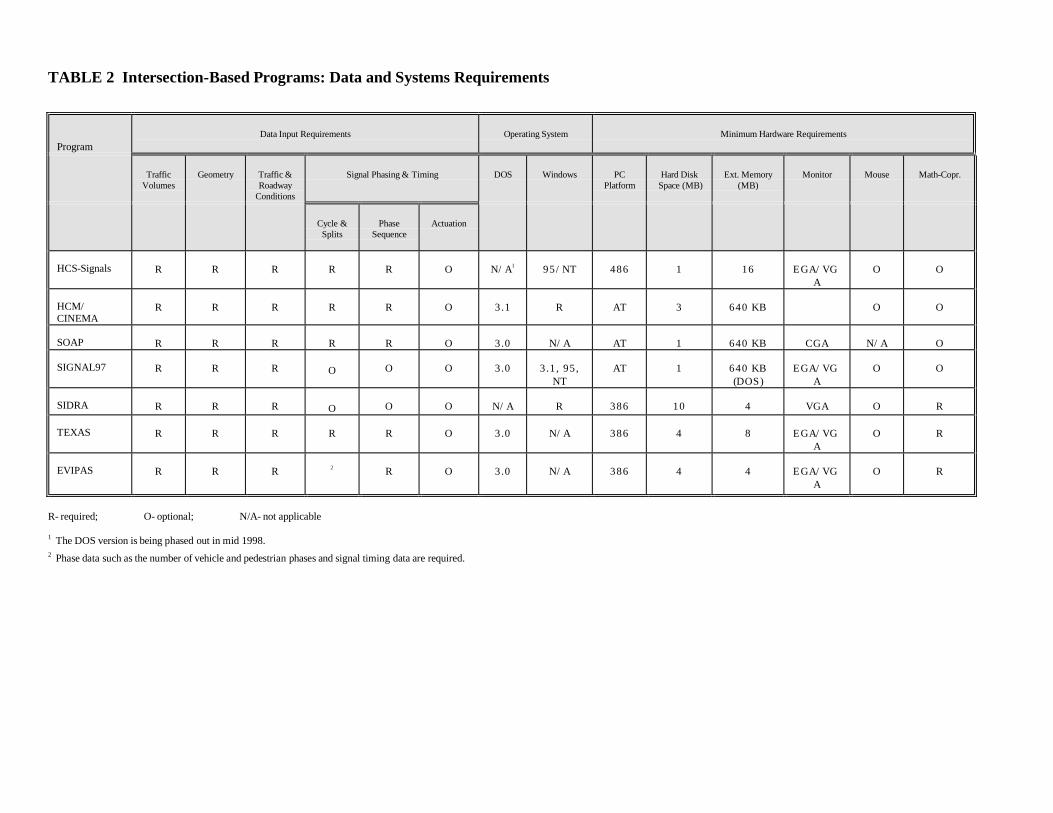
TABLE 2 Intersection-Based Programs: Data and Systems Requirements
ProgramData Input Requirements Operating System Minimum Hardware Requirements
TrafficVolumes
Geometry Traffic &Roadway
Conditions
Signal Phasing & Timing DOS Windows PCPlatform
Hard Disk Space (MB)
Ext. Memory(MB)
Monitor Mouse Math-Copr.
Cycle &Splits
PhaseSequence
Actuation
HCS-Signals R R R R R O N/A1 95/NT 486 1 16 EGA/VGA
O O
HCM/CINEMA
R R R R R O 3.1 R AT 3 640 KB O O
SOAP R R R R R O 3.0 N/A AT 1 640 KB CGA N/A O
SIGNAL97 R R R O O O 3.0 3.1, 95,NT
AT 1 640 KB(DOS)
EGA/VGA
O O
SIDRA R R R O O O N/A R 386 10 4 VGA O R
TEXAS R R R R R O 3.0 N/A 386 4 8 EGA/VGA
O R
EVIPAS R R R 2 R O 3.0 N/A 386 4 4 EGA/VGA
O R
R- required; O- optional; N/A- not applicable
1 The DOS version is being phased out in mid 1998.2 Phase data such as the number of vehicle and pedestrian phases and signal timing data are required.
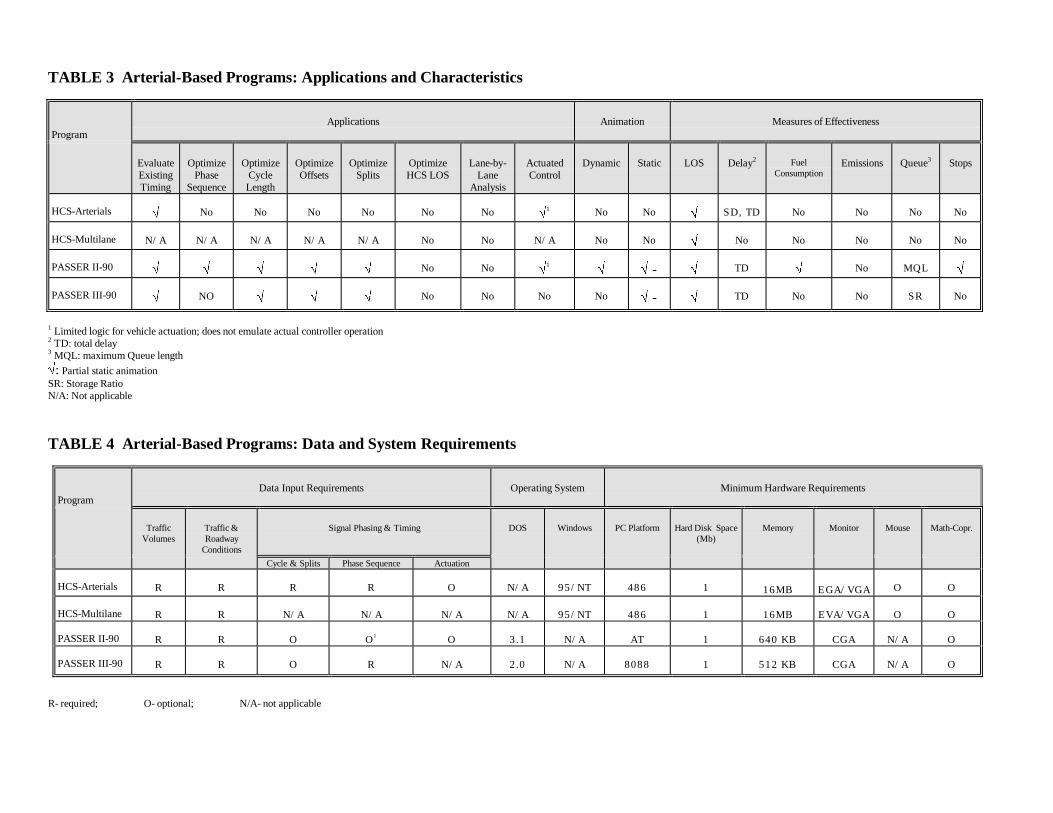
TABLE 3 Arterial-Based Programs: Applications and Characteristics
ProgramApplications Animation Measures of Effectiveness
EvaluateExistingTiming
OptimizePhase
Sequence
OptimizeCycleLength
OptimizeOffsets
OptimizeSplits
OptimizeHCS LOS
Lane-by-Lane
Analysis
ActuatedControl
Dynamic Static LOS Delay2 FuelConsumption
Emissions Queue3 Stops
HCS-Arterials √ No No No No No No √1 No No √ SD, TD No No No No
HCS-Multilane N/A N/A N/A N/A N/A No No N/A No No √ No No No No No
PASSER II-90 √ √ √ √ √ No No √1
√ √ - √ TD √ No MQL √
PASSER III-90 √ NO √ √ √ No No No No √ - √ TD No No SR No
1 Limited logic for vehicle actuation; does not emulate actual controller operation2 TD: total delay3 MQL: maximum Queue length
√: Partial static animationSR: Storage RatioN/A: Not applicable
TABLE 4 Arterial-Based Programs: Data and System Requirements
ProgramData Input Requirements Operating System Minimum Hardware Requirements
TrafficVolumes
Traffic &Roadway
Conditions
Signal Phasing & Timing DOS Windows PC Platform Hard Disk Space(Mb)
Memory Monitor Mouse Math-Copr.
Cycle & Splits Phase Sequence Actuation
HCS-Arterials R R R R O N/A 95/NT 486 1 16MB EGA/VGA O O
HCS-Multilane R R N/A N/A N/A N/A 95/NT 486 1 16MB EVA/VGA O O
PASSER II-90 R R O O1 O 3.1 N/A AT 1 640 KB CGA N/A O
PASSER III-90 R R O R N/A 2.0 N/A 8088 1 512 KB CGA N/A O
R- required; O- optional; N/A- not applicable
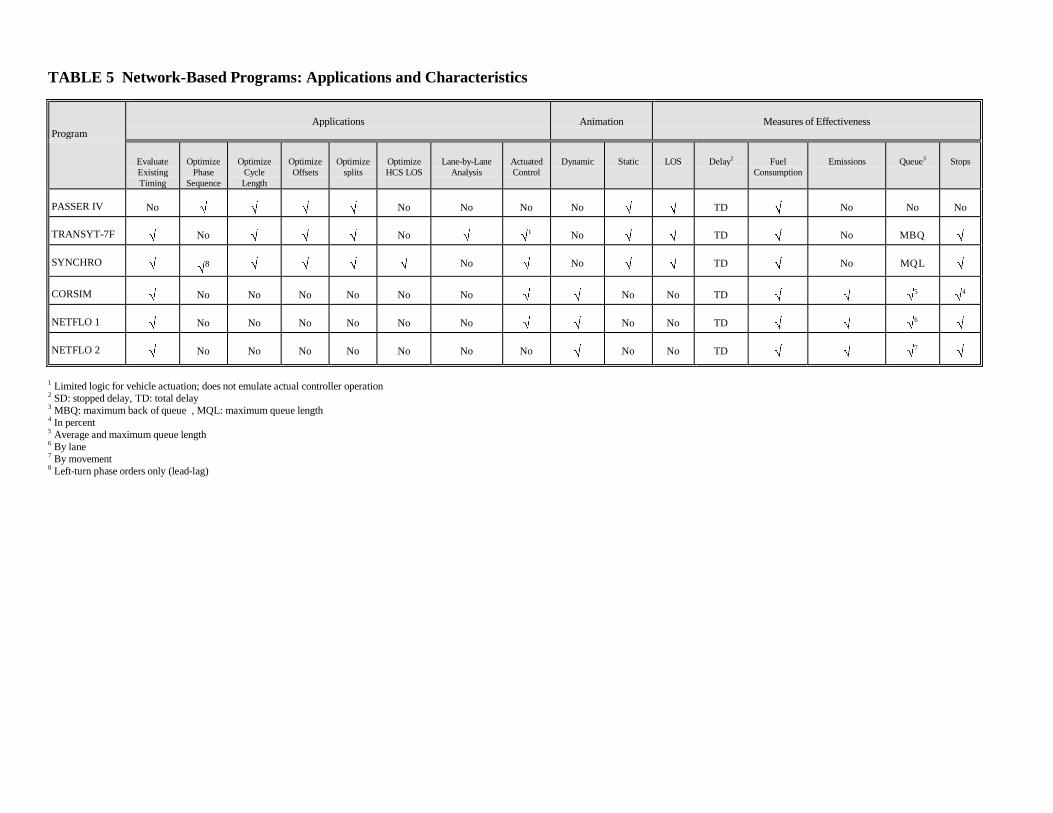
TABLE 5 Network-Based Programs: Applications and Characteristics
ProgramApplications Animation Measures of Effectiveness
EvaluateExistingTiming
OptimizePhase
Sequence
OptimizeCycleLength
OptimizeOffsets
Optimizesplits
OptimizeHCS LOS
Lane-by-LaneAnalysis
ActuatedControl
Dynamic Static LOS Delay2 FuelConsumption
Emissions Queue3 Stops
PASSER IV No √ √ √ √ No No No No √ √ TD √ No No No
TRANSYT-7F √ No √ √ √ No √ √1 No √ √ TD √ No MBQ √
SYNCHRO √ √8 √ √ √ √ No √ No √ √ TD √ No MQL √
CORSIM √ No No No No No No √ √ No No TD √ √ √5
√4
NETFLO 1 √ No No No No No No √ √ No No TD √ √ √6
√
NETFLO 2 √ No No No No No No No √ No No TD √ √ √7
√
1 Limited logic for vehicle actuation; does not emulate actual controller operation2 SD: stopped delay, TD: total delay3 MBQ: maximum back of queue , MQL: maximum queue length4 In percent5 Average and maximum queue length6 By lane7 By movement8 Left-turn phase orders only (lead-lag)
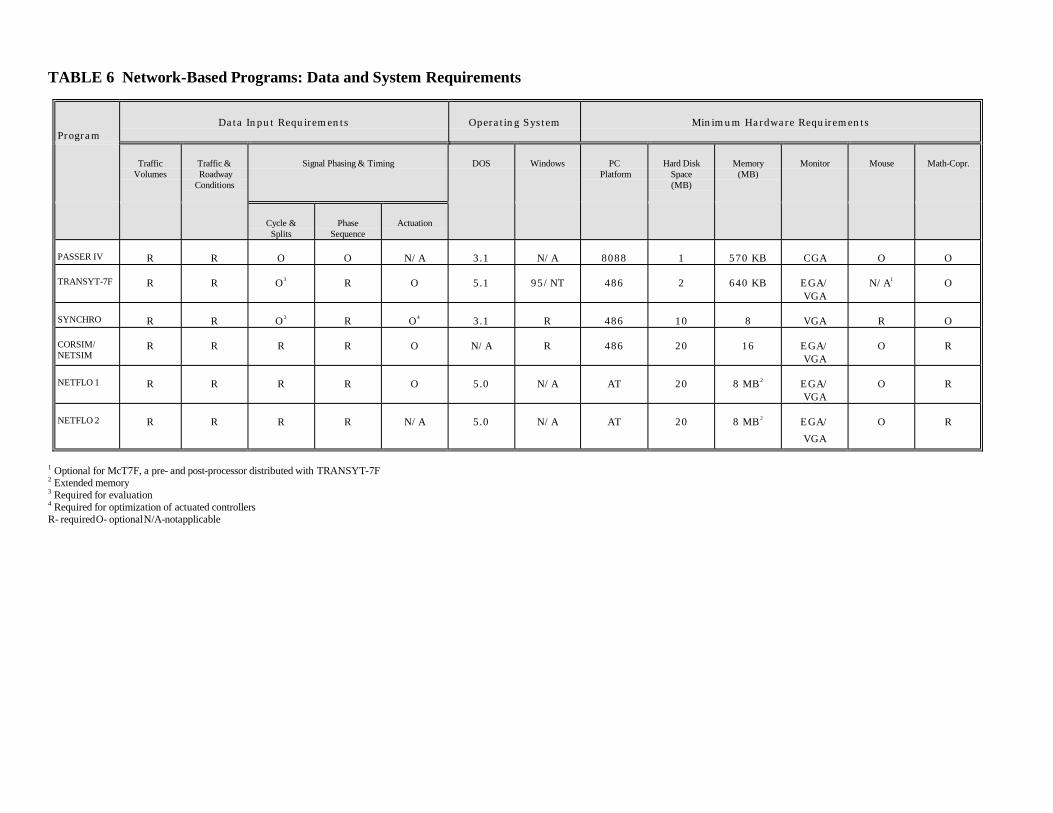
TABLE 6 Network-Based Programs: Data and System Requirements
ProgramData Input Requirements Operating System Minimum Hardware Requirements
TrafficVolumes
Traffic & RoadwayConditions
Signal Phasing & Timing DOS Windows PC Platform
Hard DiskSpace(MB)
Memory(MB)
Monitor Mouse Math-Copr.
Cycle &Splits
PhaseSequence
Actuation
PASSER IV R R O O N/A 3.1 N/A 8088 1 570 KB CGA O O
TRANSYT-7F R R O3 R O 5.1 95/NT 486 2 640 KB EGA/VGA
N/A1 O
SYNCHRO R R O3 R O4 3.1 R 486 10 8 VGA R O
CORSIM/NETSIM
R R R R O N/A R 486 20 16 EGA/VGA
O R
NETFLO 1 R R R R O 5.0 N/A AT 20 8 MB2 EGA/VGA
O R
NETFLO 2 R R R R N/A 5.0 N/A AT 20 8 MB2 EGA/
VGA
O R
1 Optional for McT7F, a pre- and post-processor distributed with TRANSYT-7F2 Extended memory3 Required for evaluation4 Required for optimization of actuated controllersR- requiredO- optionalN/A-notapplicable
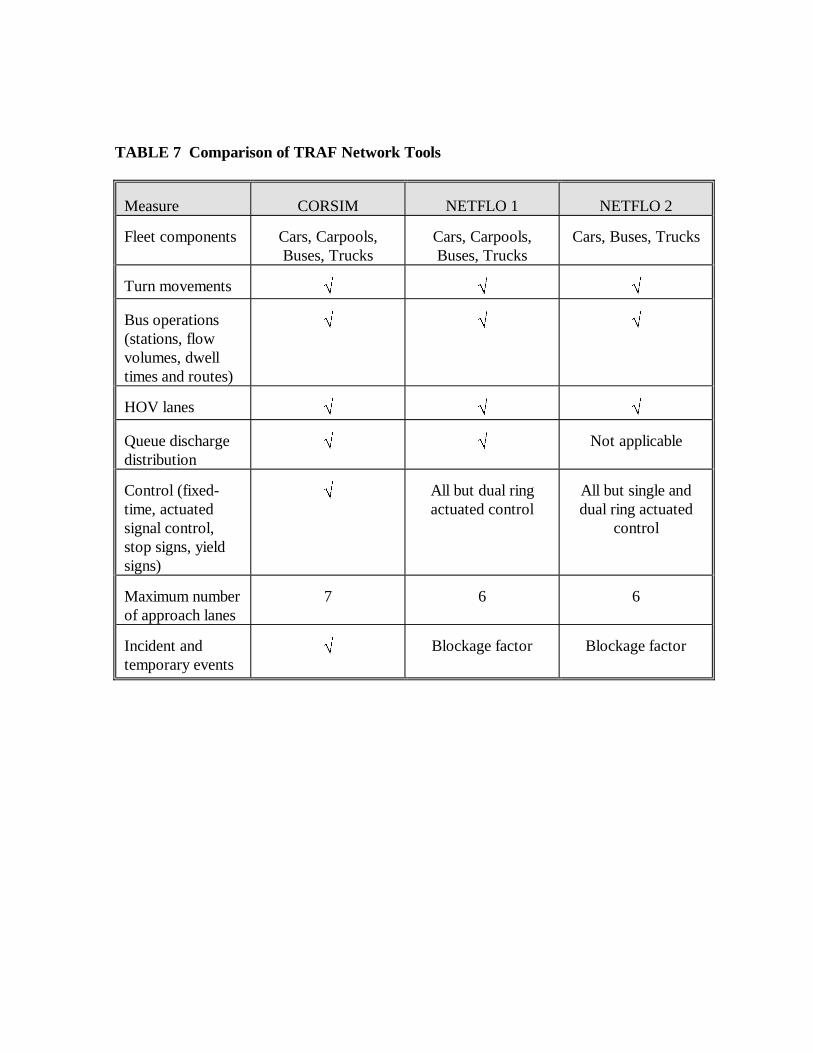
TABLE 7 Comparison of TRAF Network Tools
Measure CORSIM NETFLO 1 NETFLO 2
Fleet components Cars, Carpools,Buses, Trucks
Cars, Carpools,Buses, Trucks
Cars, Buses, Trucks
Turn movements √ √ √
Bus operations(stations, flowvolumes, dwelltimes and routes)
√ √ √
HOV lanes √ √ √
Queue dischargedistribution
√ √ Not applicable
Control (fixed-time, actuatedsignal control,stop signs, yieldsigns)
√ All but dual ringactuated control
All but single anddual ring actuated
control
Maximum numberof approach lanes
7 6 6
Incident andtemporary events
√ Blockage factor Blockage factor
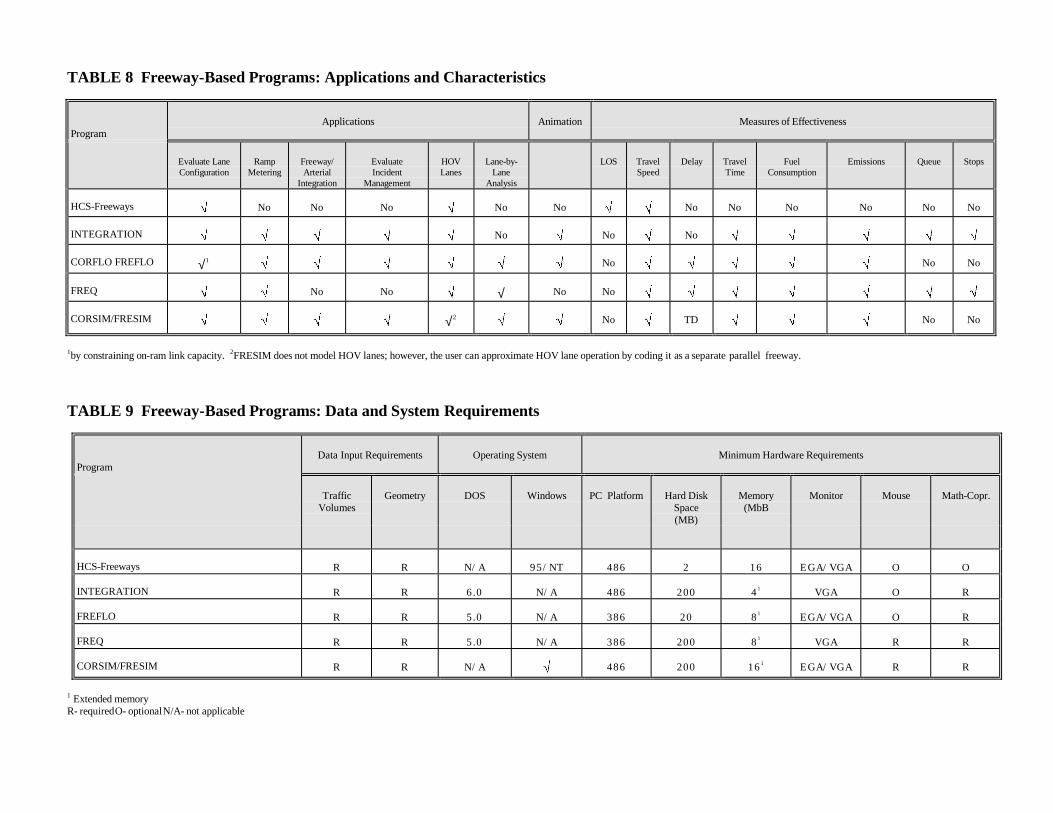
TABLE 8 Freeway-Based Programs: Applications and Characteristics
ProgramApplications Animation Measures of Effectiveness
Evaluate LaneConfiguration
RampMetering
Freeway/Arterial
Integration
EvaluateIncident
Management
HOVLanes
Lane-by-Lane
Analysis
LOS TravelSpeed
Delay TravelTime
FuelConsumption
Emissions Queue Stops
HCS-Freeways √ No No No √ No No √ √ No No No No No No
INTEGRATION √ √ √ √ √ No √ No √ No √ √ √ √ √
CORFLO FREFLO √1 √ √ √ √ √ √ No √ √ √ √ √ No No
FREQ √ √ No No √ √ No No √ √ √ √ √ √ √
CORSIM/FRESIM √ √ √ √ √2 √ √ No √ TD √ √ √ No No
1by constraining on-ram link capacity. 2FRESIM does not model HOV lanes; however, the user can approximate HOV lane operation by coding it as a separate parallel freeway.
TABLE 9 Freeway-Based Programs: Data and System Requirements
ProgramData Input Requirements Operating System Minimum Hardware Requirements
TrafficVolumes
Geometry DOS Windows PC Platform Hard DiskSpace(MB)
Memory(MbB
Monitor Mouse Math-Copr.
HCS-Freeways R R N/A 95/NT 486 2 16 EGA/VGA O O
INTEGRATION R R 6.0 N/A 486 200 41 VGA O R
FREFLO R R 5.0 N/A 386 20 81 EGA/VGA O R
FREQ R R 5.0 N/A 386 200 81 VGA R R
CORSIM/FRESIM R R N/A √ 486 200 161 EGA/VGA R R
1 Extended memoryR- requiredO- optionalN/A- not applicable
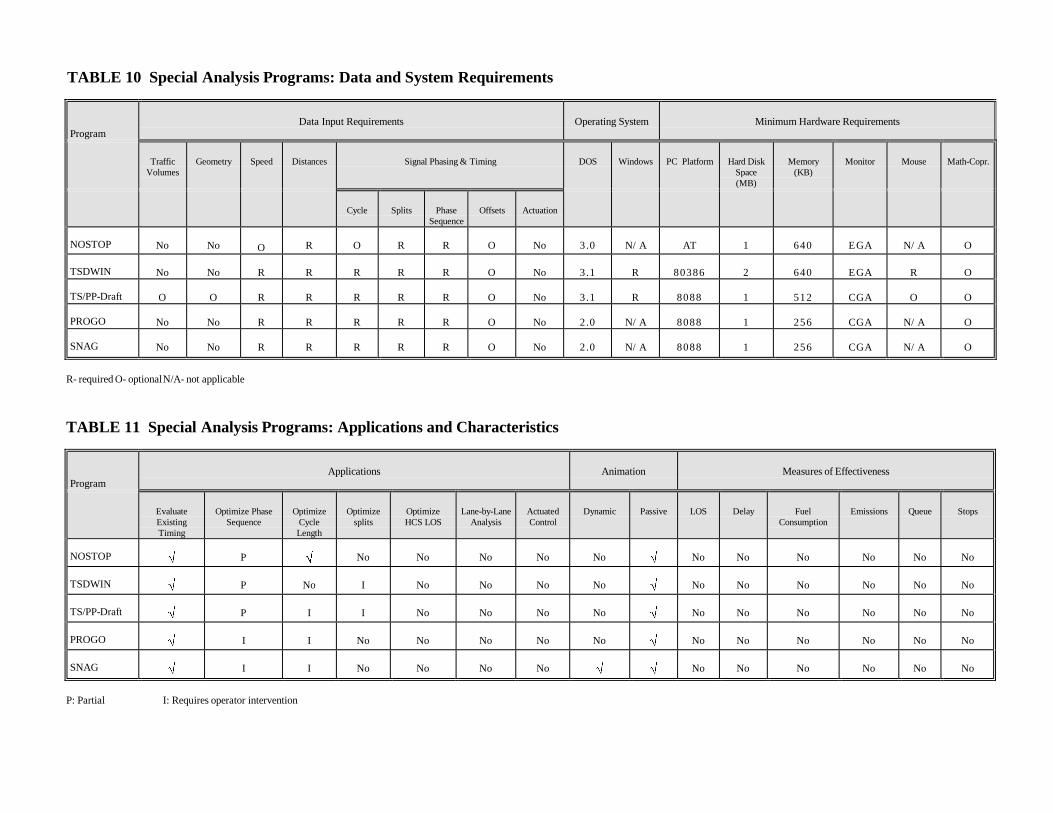
TABLE 10 Special Analysis Programs: Data and System Requirements
ProgramData Input Requirements Operating System Minimum Hardware Requirements
TrafficVolumes
Geometry Speed Distances Signal Phasing & Timing DOS Windows PC Platform Hard DiskSpace(MB)
Memory(KB)
Monitor Mouse Math-Copr.
Cycle Splits PhaseSequence
Offsets Actuation
NOSTOP No No O R O R R O No 3.0 N/A AT 1 640 EGA N/A O
TSDWIN No No R R R R R O No 3.1 R 80386 2 640 EGA R O
TS/PP-Draft O O R R R R R O No 3.1 R 8088 1 512 CGA O O
PROGO No No R R R R R O No 2.0 N/A 8088 1 256 CGA N/A O
SNAG No No R R R R R O No 2.0 N/A 8088 1 256 CGA N/A O
R- required O- optionalN/A- not applicable
TABLE 11 Special Analysis Programs: Applications and Characteristics
ProgramApplications Animation Measures of Effectiveness
EvaluateExistingTiming
Optimize PhaseSequence
OptimizeCycleLength
Optimizesplits
OptimizeHCS LOS
Lane-by-LaneAnalysis
ActuatedControl
Dynamic Passive LOS Delay FuelConsumption
Emissions Queue Stops
NOSTOP √ P √ No No No No No √ No No No No No No
TSDWIN √ P No I No No No No √ No No No No No No
TS/PP-Draft √ P I I No No No No √ No No No No No No
PROGO √ I I No No No No No √ No No No No No No
SNAG √ I I No No No No √ √ No No No No No No
P: Partial I: Requires operator intervention
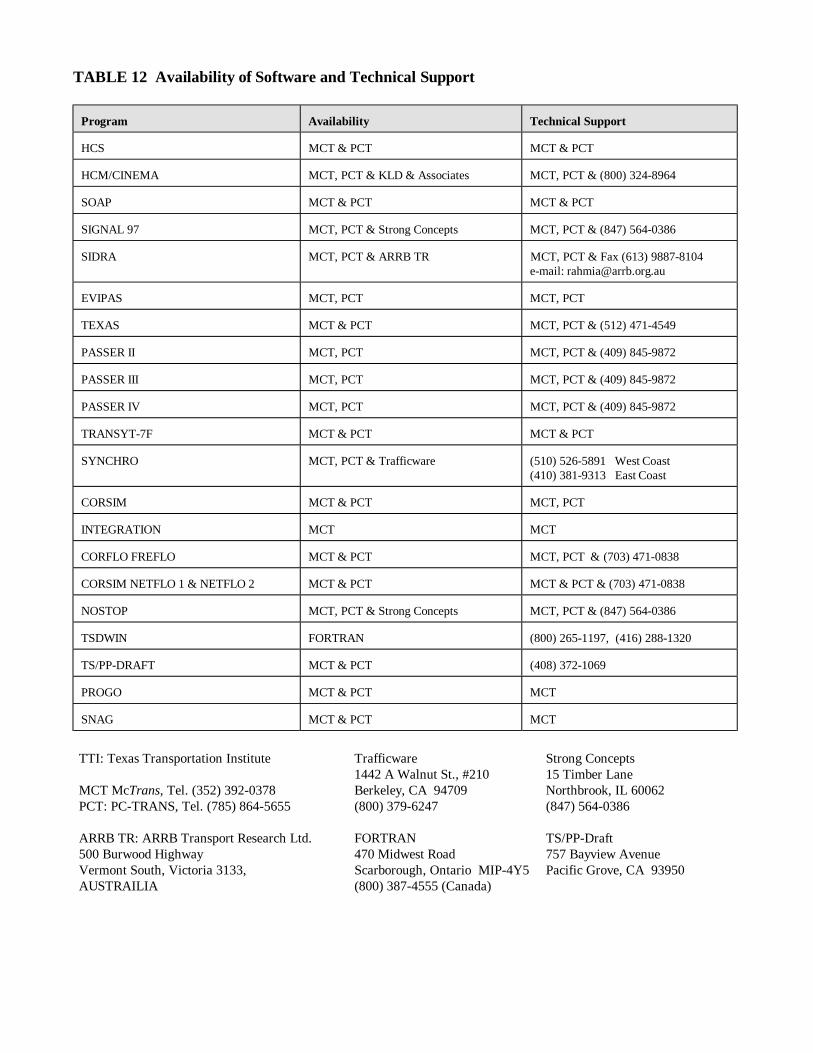
TABLE 12 Availability of Software and Technical Support
Program Availability Technical Support
HCS MCT & PCT MCT & PCT
HCM/CINEMA MCT, PCT & KLD & Associates MCT, PCT & (800) 324-8964
SOAP MCT & PCT MCT & PCT
SIGNAL 97 MCT, PCT & Strong Concepts MCT, PCT & (847) 564-0386
SIDRA MCT, PCT & ARRB TR MCT, PCT & Fax (613) 9887-8104e-mail: [email protected]
EVIPAS MCT, PCT MCT, PCT
TEXAS MCT & PCT MCT, PCT & (512) 471-4549
PASSER II MCT, PCT MCT, PCT & (409) 845-9872
PASSER III MCT, PCT MCT, PCT & (409) 845-9872
PASSER IV MCT, PCT MCT, PCT & (409) 845-9872
TRANSYT-7F MCT & PCT MCT & PCT
SYNCHRO MCT, PCT & Trafficware (510) 526-5891 West Coast(410) 381-9313 East Coast
CORSIM MCT & PCT MCT, PCT
INTEGRATION MCT MCT
CORFLO FREFLO MCT & PCT MCT, PCT & (703) 471-0838
CORSIM NETFLO 1 & NETFLO 2 MCT & PCT MCT & PCT & (703) 471-0838
NOSTOP MCT, PCT & Strong Concepts MCT, PCT & (847) 564-0386
TSDWIN FORTRAN (800) 265-1197, (416) 288-1320
TS/PP-DRAFT MCT & PCT (408) 372-1069
PROGO MCT & PCT MCT
SNAG MCT & PCT MCT
TTI: Texas Transportation Institute Trafficware Strong Concepts1442 A Walnut St., #210 15 Timber Lane
MCT McTrans, Tel. (352) 392-0378 Berkeley, CA 94709 Northbrook, IL 60062PCT: PC-TRANS, Tel. (785) 864-5655 (800) 379-6247 (847) 564-0386
ARRB TR: ARRB Transport Research Ltd. FORTRAN TS/PP-Draft500 Burwood Highway 470 Midwest Road 757 Bayview AvenueVermont South, Victoria 3133, Scarborough, Ontario MIP-4Y5 Pacific Grove, CA 93950AUSTRAILIA (800) 387-4555 (Canada)
The National Academy of Sciences is a private, nonprofit, self-perpetuating society ofdistinguished scholars engaged in scientific and engineering research, dedicated to thefurtherance of science and technology and to their use for the general welfare. Upon the authorityof the charter granted to it by the Congress in 1863, the Academy has a mandate that requires itto advise the federal government on scientific and technical matters. Dr. Bruce M. Alberts ispresident of the National Academy of Sciences.
The National Academy of Engineering was established in 1964, under the charter of theNational Academy of Sciences, as a parallel organization of outstanding engineers. It isautonomous in its administration and in the selection of its members, sharing with the NationalAcademy of Sciences the responsibility for advising the federal government. The NationalAcademy of Engineering also sponsors engineering programs aimed at meeting national needs,encourages education and research, and recognizes the superior achievements of engineers. Dr.William A. Wulf is president of the National Academy of Engineering.
The Institute of Medicine was established in 1970 by the National Academy of Sciences tosecure the services of eminent members of appropriate professions in the examination of policymatters pertaining to the health of the public. The Institute acts under the responsibility given tothe National Academy of Sciences by its congressional charter to be an adviser to the federalgovernment and, upon its own initiative, to identify issues of medical care, research, andeducation. Dr. Kenneth I. Shine is president of the Institute of Medicine.
The National Research Council was organized by the National Academy of Sciences in 1916to associate the broad community of science and technology with the Academy’s purposes offurthering knowledge and advising the federal government. Functioning in accordance withgeneral policies determined by the Academy, the Council has become the principal operatingagency of both the National Academy of Sciences and the National Academy of Engineering inproviding services to the government, the public, and the scientific and engineering communities.The Council is administered jointly by both the Academies and the Institute of Medicine. Dr.Bruce M. Alberts and Dr. William A. Wulf are chairman and vice chairman, respectively, of theNational Research Council.
The Transportation Research Board is a unit of the National Research Council, which servesthe National Academy of Sciences and the National Academy of Engineering. The Board’smission is to promote innovation and progress in transportation by stimulating and conductingresearch, facilitating the dissemination of information, and encouraging the implementation ofresearch results. The Board's varied activities annually engage more than 4,000 engineers,scientists, and other transportation researchers and practitioners from the public and privatesectors and academia, all of whom contribute their expertise in the public interest. The programis supported by state transportation departments, federal agencies including the componentadministrations of the U.S. Department of Transportation, and other organizations andindividuals interested in the development of transportation.


