Future Substitutes for Diesel Fuel in U.S. Truck and Railroad Freight Transportation Author(s): C. Phillip Baumel Source: Journal of the Transportation Research Forum, Vol. 52, No. 2 (Summer 2013), pp. 45-64 Published by: Transportation Research Forum Stable URL: http://www.trforum.org/journal The Transportation Research Forum, founded in 1958, is an independent, nonprofit organization of transportation professionals who conduct, use, and benefit from research. Its purpose is to provide an impartial meeting ground for carriers, shippers, government officials, consultants, university researchers, suppliers, and others seeking exchange of information and ideas related to both passenger and freight transportation. More information on the Transportation Research Forum can be found on the Web at www.trforum.org. Disclaimer: The facts, opinions, and conclusions set forth in this article contained herein are those of the author(s) and quotations should be so attributed. They do not necessarily represent the views and opinions of the Transportation Research Forum (TRF), nor can TRF assume any responsibility for the accuracy or validity of any of the information contained herein. Transportation Research Forum
Transcript
Future Substitutes for Diesel Fuel in U.S. Truck and Railroad Freight Transportation
Author(s): C. Phillip Baumel
Source: Journal of the Transportation Research Forum, Vol. 52, No. 2 (Summer 2013), pp. 45-64
Published by: Transportation Research Forum
Stable URL: http://www.trforum.org/journal
The Transportation Research Forum, founded in 1958, is an independent, nonprofit organization of
transportation professionals who conduct, use, and benefit from research. Its purpose is to provide an impartial
meeting ground for carriers, shippers, government officials, consultants, university researchers, suppliers, and
others seeking exchange of information and ideas related to both passenger and freight transportation. More
information on the Transportation Research Forum can be found on the Web at www.trforum.org.
Disclaimer: The facts, opinions, and conclusions set forth in this article contained herein are those of the
author(s) and quotations should be so attributed. They do not necessarily represent the views and opinions of
the Transportation Research Forum (TRF), nor can TRF assume any responsibility for the accuracy or validity of
Future Substitutes for Diesel Fuel in U.S. Truck and Railroad Freight Transportation
by C. Phillip Baumel
This paper explains why diesel fuel is the preferred fuel in freight transportation. It identifiespossiblesubstitute fuels formotorcarriersandrailroads thatarecurrentlyavailableandunderdevelopment.Itidentifieswhichofthesesubstitutesarelikelytobeusedinthenearandmediumtermyearsandthecircumstancesunderwhichtheywillbeused.Thepaperdiscusseswhichfuelefficiencymeasures have been successfully adopted by railroads andmotor carriers. Finally, itsuggestsopportunitiesfortransportationresearcherstoevaluateinvestmentoptionstoimprovefuelefficienciesinfreighttransportation.
INTRODUCTION
In 1878, Rudolph Diesel, a student in Munich, Germany, learned that the new internal combustion gas engine, developed by Nikolaus Otto, converted only a small percent of the fuel energy into
mechanical energy (Kong 2012). He also learned that a higher compression ratio in a combustion cylinder should produce greater fuel efficiency and more power. The theory was that higher air compression would create enough heat to ignite the fuel in the cylinder. The resulting high
temperature explosion would burn more of the energy in the fuel; this would create greater energy
efficiency and more power than Otto’s spark-ignited engine. Five years later, Rudolph Diesel developed a compressed ignition—diesel—engine that worked. In 2010, medium- and heavy-duty
trucks consumed 91% (33.3 billion gallons) of all the diesel fuel consumed on U.S. highways (U.S. Department of Energy 2012). Class I railroads consumed 3.5 billion gallons (AAR 2011).
The fundamental difference between diesel- and gasoline-powered internal combustion engines
is the method of igniting the fuel in the combustion chambers (Kong 2012). The mixture of air
and fuel injected into the cylinders of gasoline engines is ignited by a spark from the spark plug
in each cylinder. Diesel engines have no spark plugs. Rather, the fuel is ignited by the very high
air temperature in the high compression ratio diesel combustion chamber. The compression ratio
is the volume of the cylinder and combustion chamber at the bottom of the piston stroke divided
by the volume at the peak of the piston stroke (Kong 2012). The compression ratio in gasoline
engines ranges from 8 to 12. The compression ratio of diesel engines ranges from 14 to 25. The
lower compression ratio of gasoline engines restricts them to converting about 35% of the energy
in the fuel to move a vehicle. The higher compression ratio of diesel engines enables them to
convert up to 55% of the energy in the fuel to move a vehicle or ship. However, if a mixture of fuel and air is injected into the cylinder of a diesel engine, the high compression ratio could induce
an undesired pre-ignition, causing the engine to knock. Thus, in Diesel’s new engine, only air is
induced into the cylinder and the liquid fuel is injected into the combustion chamber near the peak
of the compression stroke.
Other advantages of diesel power over gasoline include:
1. Diesel fuel contains more energy than gasoline. One gallon of diesel fuel contains about
128,700 British Thermal Unit (Btu) while one gallon of gasoline contains 115,400 Btu (Table 2). One Btu is the amount of heat required to raise the temperature of one pound of water by one degree Fahrenheit.
Diesel Fuel Substitutes
46
2. Diesel fuel emits only small amounts of carbon monoxide and hydrocarbons that are
attributed to global warming. However, diesel fuel emits large amounts of nitric compounds and soot that lead to acid rain, smog and health problems.
3. Diesel fuel has better lubricating properties than gasoline, which helps make diesel engines
last longer. However, reducing the sulfur content in diesel fuel decreases its lubricating property.
4. Until recently, diesel fuel prices were lower than those for gasoline. Currently, diesel fuel
prices exceed gasoline prices, in part, because of increased costs of removing sulfur, soot,
and other pollutants.
With all of the advantages of diesel engines and fuel, why are we searching for alternative fuels?
1. Diesel fuel is made from crude petroleum. At the end of 2010, the United States had proven
technically recoverable reserves of about 25.2 billion barrels of petroleum, up from 22.2
billion barrels in 2009 (Energy Information Administration [EIA] August 2, 2012). This increase was the result of crude oil discoveries associated with the recent major increases
in natural gas reserves, mainly in Texas and North Dakota. Total domestic crude petroleum
extraction in 2010 was 2.0 billion barrels (EIA August 2, 2012). At this rate of extraction,
the U.S. has about a 13-year supply of proven domestic crude petroleum reserves. Of
course, supplies in proven reserves change with discoveries, prices, and annual production.
Proven recoverable reserves do not include non-conventional supplies like shale and sand
oil and some off-shore deposits. The EIA (April 15, 2013) estimated that the total U.S.
proved and unproved petroleum reserves in 2011 were 219 billion barrels.2. The U.S. imported 40% of its 2012 petroleum usage (EIA April 15, 2013). A substantial
amount of those imports came from Middle East and African countries that are hostile to
the U.S.
3. The huge outflow of dollars to pay for petroleum imports increases our balance of payment deficits, and the cost of all imports, including oil.
4. Combustion of diesel fuel produces large amounts of carbon dioxide.
5. In 45 years, at current rates of extraction, conventional world petroleum prices will rise to
a level that will prohibit its use for many of its current purposes (Brown and Brown 2012).
ALTERNATIVES TO DIESEL FUEL
Biodiesel
The major commercially available biofuel substitute for diesel fuel in the United States is biodiesel.
A large amount of biodiesel is made from inedible fats and oils, waste restaurant oils, and byproducts
like inedible corn oil. Biodiesel is also made from virgin vegetable oils, including soybean and canola oil. However, soybean and canola oil prices are higher than those of used and inedible fats and oils. Therefore, virgin oils are typically used in biodiesel plants that are not designed to use
waste and inedible fats and oils, or if there are insufficient supplies of lower cost feedstocks.The December 2007 Energy Independence and Security Act mandated that biomass diesel be
blended into diesel fuel. Beginning in 2010, the Environmental Protection Agency (EPA) mandated that 800 million gallons of biomass diesel be blended into diesel fuels. This mandate could be
satisfied by biodiesel and/or biomass diesel. Thus far, biodiesel has been the dominate fuel to satisfy the EPA mandate. This mandate increased to one billion gallons in 2011 and to 1.28 billion
gallons in 2013 (Renewable Energy Group, Inc. [REG] 2012). This mandate insures that there will
be a market for biodiesel even if biodiesel costs more than petroleum-based diesel. Data from REG,
the producer of the largest number of gallons of biodiesel in 2012, illustrate this point. In 2012, this
company sold 188 million gallons of diesel fuel in the United States (Table 1). The feedstocks for
84% of that production were inedible animal fat, used cooking oil, and inedible corn oil extracted
47
JTRF Volume 52 No. 2, Summer 2013
from distillers’ grains, a byproduct of ethanol production. The use of these lower-cost fats and oils
helped make this company one of the low-cost biodiesel producers in the industry. Only 16% of its production came from higher-cost soybean oil.
Table 1 indicates that the average 2012 wholesale price of these 188 million gallons of biodiesel
produced by this low-cost biodiesel producer was $5.31 per gallon. The average 2012 U.S. retail price of petroleum diesel was $3.97 per gallon (EIA February 5, 2013). This indicates that the average 2012 wholesale price of biodiesel paid to this low-cost biodiesel producer was approximately $1.34 per gallon above the average U.S. retail price of petroleum diesel. Table 2 suggests that, with a diesel
price of $4.00 per gallon, the Btu value of 100% biodiesel is $3.64. There are four major reasons why this low-cost producer of biodiesel, with 9% fewer Btu than diesel, was able to sell its 2012 output at a price that was, on average, $1.34 above the average 2012 retail price of petroleum-based diesel. These reasons are:
1. The federal government mandated that one billion gallons of biodiesel be blended into
diesel fuel in 2012.
2. To track the sales of renewable fuel production, the EPA created the renewable identification number (RIN) system. All EPA registered producers of renewable fuels may create an RIN
for each gallon of renewable fuel produced (REG 2012). RINs have value to “obligated
parties” to satisfy their renewable volume obligation under the Renewable Fuel Standard
legislation. Most biodiesel is sold with its RIN attached. RINs may also be sold as a
separate commodity. The 2012 values of RINs ranged from $2.39 per gallon in January to a low of $0.63 per gallon of the average Jacobsen B100 Upper Midwest spot price of a gallon of biodiesel (REG 2012).
3. The blender’s tax credit provided a $1.00 excise tax credit per gallon of 100% biodiesel to the first person who blended biodiesel with petroleum-based diesel fuel (REG 2012). The tax credit could then be credited against the blender’s excise tax liability, or the blender
could obtain cash refunds from the U.S. Treasury for the value of the credits. This tax
credit expired on December 31, 2011, and was renewed on January 1, 2013.
4. Many states and cities offer various types of mandates and financial incentives to encourage the use of biodiesel over petroleum-based diesel (National Biodiesel Board 2012).
Table 1: REG Biodiesel Sales and Cost of Goods Sold, 2012
Biodiesel sales $1,006,471,000 Gallons sold 188,000,000
Sales per gallon $5.35
Less assumed byproduct sales per gallon $0.04
Net biodiesel sales per gallon $5.31 Cost of goods sold $956,448,000 Cost of goods sold per gallon $5.09
Source: REG 2012
Diesel Fuel Substitutes
48
Table 2: Btu Content and Diesel Equivalent Gallons of Alternative Fuels
Fuels Unit of Measure Btu Content Diesel Gallon
Equivalent
Diesel Gallon 128,7000*** 1
Gasoline Gallon 115,400*** 1.12
Biodiesel Gallon 117,093*** 1.1
Compressed Natural Gas 100 Cubic feet 96,000*** 1.34
Source:*KiOR (2013)**Wikipida (May, 2013)***U.S. Department of Energy (2011-2013)
The market value of the RINs, in combination with the blender’s tax credit, the Federally
mandated blending of biodiesel, and state and city incentives, enabled biodiesel producers to sell
biodiesel to obligated parties in a market in which the competitive product, petroleum-based diesel,
is sold at a substantially lower price.
Biodiesel sold for transportation purposes is blended with petroleum-based diesel. A common blend, B10, is 10% biodiesel and 90% petroleum diesel. Blends can range from B1 to B99. There are several reasons for blending these two fuels:
1. The federal government mandates blending of biodiesel with petroleum based diesel.
2. The higher cost of biodiesel is an incentive to spread its high cost over a large number of
gallons of a lower cost petroleum diesel fuel.
3. The blended biodiesel helps improve the lubricity of low sulfur petroleum-based diesel.
Lubricity is the capacity to reduce friction.4. Blending reduces the “cloud point” of biodiesel. The cloud point is the temperature below
which the appearance of a fuel becomes cloudy. Cloudiness indicates that the fuel is
likely to gel (REG 2012). This could lead to plugged fuel filters and other handling and performance problems. Biodiesel begins to gel at 30 to 60. The cloud point for diesel fuel is below 20o F. Blending reduces the cloud point for the blended biodiesel, but increases the cloud point of the blended petroleum diesel.
5. Diesel fuel contains 128,700 Btu. Biodiesel contains 117,093 Btu. Blending results in a weighted average of the two.
There are three other issues with biodiesel. First, biodiesel contains oxygen, while diesel
contains none. Oxygen makes the fuel unstable and tends to make it crystallize over time as well
as in cold temperatures. The crystals tend to clog engine fuel delivery systems. Therefore, a good
biodiesel management program is needed to prevent these problems (Ring 2011).
Second, there are limited supplies of low-cost feedstocks to produce biodiesel. Reidy (2012)
suggests that finding feedstocks to produce the mandated blending, 1.28 billion gallons of biodiesel in 2013, will be tricky. According to Reidy (2012), the supply of inedible corn oil will top out at 300
million gallons of biodiesel production. The meat packing industry, the source of most animal fats,
will supply enough animal fats to produce about 400 million gallons of biodiesel. The remaining
580 million gallons will need to come from used cooking oils and virgin soybean and/or canola
oil. Reidy (2012) indicates that the EPA and USDA believe the additional soybean oil will come
49
JTRF Volume 52 No. 2, Summer 2013
from reduced U.S. soybean exports; she also indicates that world demand for virgin vegetable oil
is increasing. Thus, if Reidy (2012) is right, biodiesel producers will be forced to compete with
international vegetable oil buyers for virgin vegetable oils. This suggests that biodiesel producers
could be forced to pay higher prices for virgin vegetable oils and for inedible feedstocks to meet the
2013 EPA mandate of 1.28 billion gallons of biodiesel. Potential shortages of biodiesel feedstocks
could increase the costs and/or slow the growth of biodiesel production above its current 3% of
diesel consumed on U.S. highways.
Third, a fundamental principle of economics is that a firm will not produce a product if the price it receives for that product is equal to or less than the variable cost of producing that product. The
logic of this principle is that a firm will continue to produce a product only if the price it receives covers its variable costs per unit of output and, at least, some of its fixed costs. Assuming that the REG (2012) variable cost of production was the $5.09 per gallon cost of goods sold (Table 2), it is likely that biodiesel producers would shut down some of their high-cost plants after the EPA
mandated blending of 1.28 billion of gallons is reached. This is because wholesale buyers would
no longer be forced to buy biodiesel when its price is substantially above the wholesale price of
petroleum diesel. Unless the EPA increases the biodiesel mandate above the one billion or 1.28
billion gallons, biodiesel firms are likely to first close those plants that must use higher cost vegetable oils as their only feedstocks. Then, if biodiesel prices continue to fall to the variable cost per unit of
plants that use lower-cost feedstocks, firms would then begin to close some of these plants as well.How will trucking firms respond to biodiesel fuels in the future? As long as the EPA continues
to mandate a minimal use of biodiesel fuel in transportation fuels, trucking firms have little choice but to buy biodiesel blended fuels. However, not all refueling stops sell biodiesel blended fuels. So, at least, truckers can avoid using some biodiesel blended fuels by their selection of where they
refuel. Once the mandated quantities are sold, truckers can seek biodiesel that is priced below the
cost of petroleum or avoid the use of biodiesel in states that do not mandate that all diesel fuel must
be blended with biodiesel. Moreover, truckers will especially attempt to avoid purchasing biodiesel
blended fuels in northern states during cold winter months to avoid fuel that becomes cloudy and
clogs their fuel distribution systems.
How will railroad companies respond to biodiesel fuels in the future? Numerous biodiesel performance tests have been made on medium-speed diesel engines in North American railroad
locomotives. These tests, including various blends of biodiesel and petroleum-based diesel, raised
concerns about the following issues (Majewski et al. 2011):
1. Compatibility between biodiesel fuel and medium-speed diesel locomotive engines. These
issues include material compatibility, fuel system compatibility including fuel leakage, and
engine oil dilution. These issues were more serious on heavy-duty, line-haul locomotives
than on lower power switch engine locomotives.
2. Higher NOx emission from biodiesel powered locomotives, particularly in heavy duty, line haul service.
3. Lower Btu content of biodiesel generally causing reduced locomotive power.4. Handling, storage and engine performance problems associated with gel forming in low
temperatures and oxidation of biodiesel.
5. Higher cost of biodiesel.6. Potential problems with manufacturer’s warranties on diesel engines and fuel injection
systems, particularly with higher amounts of biodiesel blended with petroleum-based
diesel fuel.
The general conclusion from the biodiesel tests on railroad locomotives is that railroads are
unlikely to use biodiesel beyond the federal, state, and city usage mandates. After the mandated
quantities are sold, railroads, like truckers, will likely try to purchase lower-cost petroleum in states
that do not mandate that all diesel fuel must be blended with biodiesel or seek biodiesel that is priced
below the cost of petroleum diesel.
Diesel Fuel Substitutes
50
Renewable Diesel
Renewable diesel usually refers to hydro-treated vegetable oils or animal fats (Majewski et al.
2011). The feedstocks for biodiesel are treated with hydrogen to remove their oxygen. This process
produces a diesel fuel with no stability or low temperature operability problems that have been
associated with biodiesel. The properties of renewable diesel are similar to gas-to-liquid (GTL) synthetic diesel fuels. The cetane number for renewable diesel, a measure of the fuel’s ability to self
ignite, is very high; the higher the better for diesel fuel. Renewable diesel has no sulfur, oxygen, or
nitrogen. Its clouding point is well below freezing and its heating value is similar to diesel. Also, its
storage stability is good (Majewski et al. 2011).
There are no published cost analyses of renewable diesel production costs, but they are believed
to be higher than the cost of producing biodiesel, which is currently higher than the wholesale price
of petroleum-based diesel. There are no commercial renewable diesel production plants in the
United States. There are, however, two production plants in Finland (Majewski et al. 2011).
Algae Biofuel
Algae biofuel is a popular potential alternative to diesel fuel. President Obama suggested “a plant-
like substance, algae” as a way of cutting dependence on oil by 17% (Gehrke 2012). Several companies, and some research institutions, predict that they will be capable of producing algae fuel
on a commercial scale at the same price as petroleum in the near future (Brown and Brown 2012).The algae that are proposed as a partial solution to our energy problem are not the algae plants
commonly found in ponds of water across the country. Rather, it is a group of single-cell micro-
organisms that produce large amounts of lipids. Lipids can be transformed into hydrocarbons that are essentially indistinguishable from gasoline or diesel fuels (Brown and Brown 2012). There are about 50,000 species of microalgae (Wen 2012). One of the major problems facing researchers
in the development of algae fuels is finding those species of microalgae that produce the most lipids. At the present time, the average lipid content of algae is 5%–10% of their liquid content
(Wen 2012). In theory, it is possible to genetically modify microalgae to contain in excess of 50%
of lipids (Wen 2012). Other major problems include designing the most productive methods of
growing the algae. Two methods of production currently getting the most research attention are
open ponds and enclosed plastic “photobioreactors” (Brown and Brown 2012). Open ponds cost $100,000 per acre and the photobioreactors cost $1 million per acre. Another major problem is the harvesting and extraction of the lipids on a daily basis. A Department of Energy study suggests that
it costs over $10 to produce a gallon of algae diesel from open ponds and about $20 per gallon from photobioreactors (Davis et al. 2011). The study suggests that the cost of algae diesel could fall to
about $4 per gallon with major improvements in algae lipid content and production, greatly reduced harvesting and extraction costs, and the sale of the spent biomass at $500 per ton (Davis et al. 2011). Some researchers suggest that they are three to five years from large-scale production (Herman 2010). Others indicate that there have been no major breakthroughs and that commercialization of
algae diesel is decades away (Wen 2012).
Algae fuels are sometimes referred to as third generation biofuels. Other potential sources of
lipids for diesel fuel are palm oil, jatropha, a hardy group of wild tropical plants, and salicornia,
a salt-tolerant plant that grows in marshes and beaches. Both jatropha and salicornia face several decades of development if they prove to be good sources of lipids (Brown and Brown 2012). There is substantial environmental resistance to the use of palm oil for fuels because of the destruction of
rainforests to produce palm oil (Brown and Brown 2012). Trucking and railroad firms will not need to decide if they should purchase algae fuels until it becomes available commercially, likely some
decades away.
51
JTRF Volume 52 No. 2, Summer 2013
Natural Gas
Natural gas (NG) consists of about 90% methane. It originated from the remains of historical plants and animals and was formed by the great pressure exerted over centuries by the thousands of feet
of rocks, sand, and debris covering the plant and animal remains. Small droplets of the odorless gas
accumulated into NG deposits and petroleum and coal deposits. Recently, large quantities of NG
have been found in shale formations.
In 2010, the United States had proven NG reserves of 317 trillion cubic feet (tcf). The 2012 production of NG was 23.2 tcf (EIA May 2013). At that level of production, the 317 tcf would only last 13 years. The good news is that the U.S. has huge quantities of unproven NG reserves locked
deep in shale formations. The EIA (June 2012) estimated that the total technically recoverable NG
reserves in the United States were 2,214 tcf. At the 2012 level of production, 2214 tcf would
be more than a 95-year supply. Other observers suggest that the EIA estimate of total technically recoverable reserves is too low (National Geographic News 2012).
A large portion of the huge unproven reserves of NG has been made available to U.S. markets
by hydraulic fracturing, commonly called fracking. Fracking pumps more than one million gallons
of water, chemicals, and sand under high pressure into each well. These wells vary in depth, but can
be as deep as 10,000 feet. After reaching the desired depth, the drilling extends horizontally across
the shale formation (EIA September 19, 2011). The high pressure of injected water, chemicals, and sand fractures the shale formations and allows the NG and other hydrocarbons that exist there to
escape the shale and flow up the well. The sand keeps the fractures open, allowing the gases to flow into the well over time.
NG has been used extensively to heat homes and buildings, in industrial production and
for generating electricity. Because of its gaseous nature, only about 3% of NG has been used in transportation, much of it to propel NG through pipelines. The huge quantity of NG now being
produced from shale formations has resulted in sharp declines in NG prices. In March 2008, the
NG futures price was above $13 per million Btu (MMBtu). By late November 2011, the price had declined to just over $2 MMBtu, a decline of 85% (Irwin 2012). During the same period, the NYMEX crude oil futures price declined from $140 per barrel to $98 per barrel, a decline of 30% (Irwin 2012). These sharply declining NG prices have made it a potential fuel for freight
transportation.
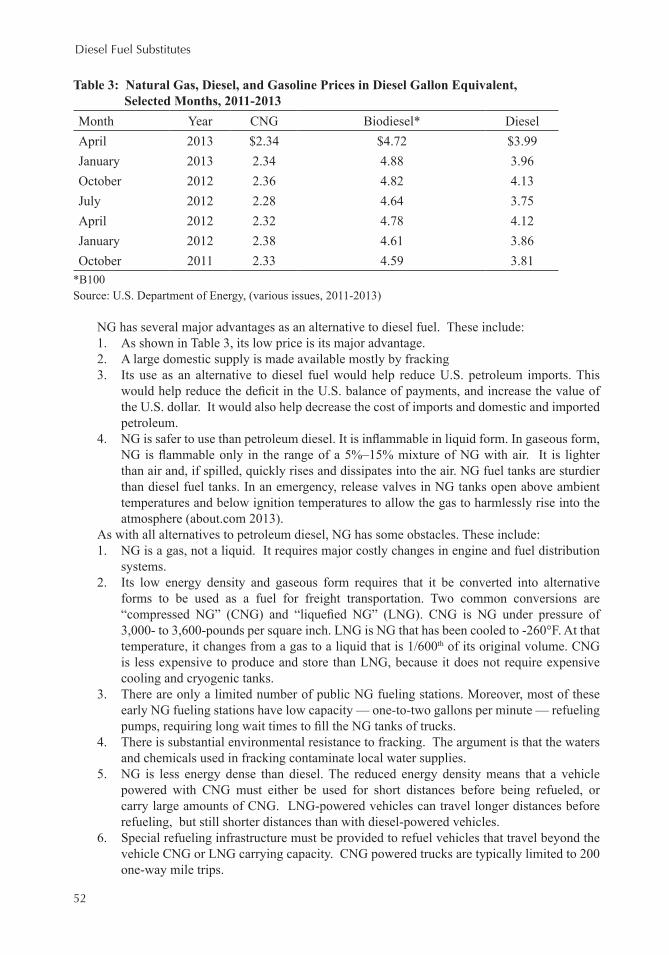
Table 3 shows the average national retail prices of diesel, CNG, and biodiesel prices on a diesel
equivalent basis for seven time periods from October 2011 to April 2013. These were retail pump
prices and included state and federal taxes. CNG prices averaged $1.61 per diesel gallon equivalent below diesel prices. B100 biodiesel prices averaged 77 cents per gallon higher than diesel prices. Table 2 suggests that the BTU value of a gallon of B100 biodiesel is about 9% below the Btu value of a gallon of petroleum-based diesel.
Diesel Fuel Substitutes
52
Table 3: Natural Gas, Diesel, and Gasoline Prices in Diesel Gallon Equivalent,
January 2012 2.38 4.61 3.86October 2011 2.33 4.59 3.81
*B100Source: U.S. Department of Energy, (various issues, 2011-2013)
NG has several major advantages as an alternative to diesel fuel. These include:
1. As shown in Table 3, its low price is its major advantage.
2. A large domestic supply is made available mostly by fracking
3. Its use as an alternative to diesel fuel would help reduce U.S. petroleum imports. This
would help reduce the deficit in the U.S. balance of payments, and increase the value of the U.S. dollar. It would also help decrease the cost of imports and domestic and imported
petroleum.
4. NG is safer to use than petroleum diesel. It is inflammable in liquid form. In gaseous form, NG is flammable only in the range of a 5%–15% mixture of NG with air. It is lighter than air and, if spilled, quickly rises and dissipates into the air. NG fuel tanks are sturdier
than diesel fuel tanks. In an emergency, release valves in NG tanks open above ambient
temperatures and below ignition temperatures to allow the gas to harmlessly rise into the
atmosphere (about.com 2013).
As with all alternatives to petroleum diesel, NG has some obstacles. These include:
1. NG is a gas, not a liquid. It requires major costly changes in engine and fuel distribution
systems.
2. Its low energy density and gaseous form requires that it be converted into alternative
forms to be used as a fuel for freight transportation. Two common conversions are
“compressed NG” (CNG) and “liquefied NG” (LNG). CNG is NG under pressure of 3,000- to 3,600-pounds per square inch. LNG is NG that has been cooled to -260°F. At that temperature, it changes from a gas to a liquid that is 1/600th of its original volume. CNG
is less expensive to produce and store than LNG, because it does not require expensive cooling and cryogenic tanks.
3. There are only a limited number of public NG fueling stations. Moreover, most of these
early NG fueling stations have low capacity — one-to-two gallons per minute — refueling
pumps, requiring long wait times to fill the NG tanks of trucks.4. There is substantial environmental resistance to fracking. The argument is that the waters
and chemicals used in fracking contaminate local water supplies.
5. NG is less energy dense than diesel. The reduced energy density means that a vehicle
powered with CNG must either be used for short distances before being refueled, or
carry large amounts of CNG. LNG-powered vehicles can travel longer distances before refueling, but still shorter distances than with diesel-powered vehicles.
6. Special refueling infrastructure must be provided to refuel vehicles that travel beyond the
vehicle CNG or LNG carrying capacity. CNG powered trucks are typically limited to 200 one-way mile trips.
53
JTRF Volume 52 No. 2, Summer 2013
7. It is not clear that natural gas emissions, particularly nitric oxide emissions, are always less
than those of diesel fuel (Majewski et al. 2011).
The recent availability of large supplies of NG, combined with its dramatic decline in price,
make NG a potential substitute for diesel fuel.
EIA (June 2012) estimates that only 1,000 (0.3%) of the 360,000 heavy-duty vehicles sold in the U.S. in 2010 were NG fueled. In 2012, approximately 1% of the heavy-duty trucks sold in the
U.S. were NG fueled (Carrick 2012). What is preventing NG from becoming a dominate fuel for the
heavy duty, long-distance trucking industry? The major reasons are:
1. Higher NG vehicle costs2. Reduced NG vehicle operating range
3. Insufficient number of refueling stations4. Inadequate fuel pumping capacities at some existing NG refueling stations
5. Inadequate size NG engines to pull full loads over hills and mountains at acceptable speeds
The major additional costs of heavy-duty NG-fueled trucks over diesel-fueled trucks are
fuel-storage and non-fuel-storage costs. The non-fuel-storage costs are the basically the costs of
modifying the diesel engine to burn CNG or LNG. To make the engine operate entirely on NG, the piston is replaced to reduce the compression ratio and a spark plug is installed to ignite the fuel
(Kong 2012). This modification makes the NG engine perform like a gasoline engine (Kong 2012). For new engines designed to operate on both NG and diesel, NG can be introduced into the intake
port or directly into the cylinder. Another option is to use a new fuel injector designed to inject
both NG and diesel into the cylinder (Kong 2012). EIA (June 2012) reports the cost of modifying
the diesel engine of a semi-tractor-trailer truck to use NG is $30,000. One firm, operating several NG-fueled semi-tractor-trailer trucks, reported non-fuel storage costs of less than $20,000 per truck.
The fuel-storage cost is to replace the diesel tanks with tanks to hold either CNG or LNG. CNG storage tanks are designed to withstand internal pressure of up to 3,600 pounds per square inch. The tanks can be mounted on the sides of the frame and/or on the back of the cab. EIA (June
2012) estimates the cost of CNG storage tanks at $350 per gallon of storage. The amount of storage needed depends on the miles per gallon, the length of the haul, and the
distance between NG refueling stations. The firm that operates several CNG semi-tractor trucks reported that its trucks each have four high pressure tanks, one on each side of the frame and two on
the back of the cab. Each tank costs $10,000 plus installation. Thus, the cost of the four CNG tanks was over $40,000. The total additional cost of converting these tractors to CNG was $60,000 each. EIA (June 2012) reports the incremental cost of NG class 8 (semi) trucks at $80,000.
The trucking firm reported the CNG tractors achieved 5.53 mpde (miles per diesel equivalent). A diesel equivalent gallon is the amount of alternative fuel required to equal the energy content of
one gallon of diesel fuel. Table 1 illustrates the diesel gallons equivalent of several alternatives to
diesel fuel. The round-trip distance for its NG trucks was a maximum of 400 miles. Therefore,
these trucks need enough fuel storage for the 400-mile round trip.
LNG is NG cooled to -260o F (Center for Liquefied Natural Gas 2012). At that temperature, the gas turns to a liquid that is 1/600th of its original volume. It is stored at this very cold temperature
but not under high pressure. LNG must be stored in cryogenic tanks to maintain the very low temperature. Therefore, LNG tanks are more expensive than CNG tanks. LNG tanks cost about $475 per gallon of capacity (EIA June 2012). The advantage of LNG over CNG as a transportation fuel is that it is more energy dense. It requires fewer gallons of tank storage for a given distance, or
it can power a truck for longer distances on the same tank storage. Some companies are developing
new materials that will likely allow more CNG or LNG to be stored in smaller containers (Carrick 2012). These developments offer the promise of longer lengths of haul per tank of NG and possibly
lower cost per gallon of NG storage.
A third problem hindering increased usage of NG by trucking firms is the lack of NG fueling stations. In May 2012, there were only 1,047 CNG fueling stations and 53 LNG fueling stations in
Diesel Fuel Substitutes
54
the United States (EIA June 2012). Only 47% of the CNG stations and 43% of the LNG stations were accessible for public purchase of NG fuels. This means that many CNG trucks are limited to
400 round-trip miles.
The fourth problem is that the NG refill pumps at many of the existing fueling stations have very low pumping capacities (one-to-two gallons per minute) (Carrick 2012). These low pumping
capacities require long refueling stops, adding to the cost of NG as a fuel. The longest refueling
times are for trucks waiting in line to be refueled. These refueling problems are in the process of
being solved. First, new fueling stations are coming on stream each month, most with refueling
capacities of up to 10 gallons per minute. Some observers are predicting that within three years,
there will be an additional 500 fueling stations, each with pumping capacities of 10 gallons per
minute (Carrick 2012). Moreover, existing fueling stations are upgrading their refueling capacity.
The fifth obstacle to increased purchases of NG-powered trucks is that, until recently, the maximum size NG engine available for heavy-duty trucks was nine liters with 320-hp and 1,000
foot-pounds of torque. Liter refers to the volume of the cylinder from the top of the piston stroke to the bottom. Thus, a nine-liter NG engine has six cylinders. Therefore, each cylinder has a volume
of 1.5 liters. One liter equals 1.0567 U.S. quarts. The relatively low Btu content of NG enables the nine-liter engine to generate adequate power for only local and regional service pulling 80,000
pound loads over level terrain (Carrick 2012).
Twelve-liter, six-cylinder engines (each cylinder having two liters of volume) with 400-hp and
1,450-foot pounds of torque are required for local and regional trucking service at acceptable speeds
(Carrick 2012). The first 12-liter NG engine (Cummins Westpoint ISX12G) with an automatic transmission became available in early 2013 (Carrick 2013). This engine, with sufficient power to pull a full 80,000-pound load, enables NG-fueled trucks to become more prevalent in local and
regional truck movements. Moreover, a 15-liter NG engine with 450-hp and 1,650-foot pounds of torque is under development for highway use. This engine will pull an 80,000-pound load at
acceptable speeds over all types of U.S. terrain. With the introduction of the 15-liter engine in four
to five years, and continued improvements in NG refueling infrastructure, trucking firms will likely be using NG as a fuel in coast-to-coast truck freight movements (Carrick 2012).
The question facing trucking companies is “What is the return on investment from NG fueled
trucks?” One study reports that when diesel fuel is $1.50 per gallon higher than CNG, and the trucks are driven at least 70,000 miles per year with a spark-ignited CNG engine, the return on investment from CNG will be about 20% per year. Romba (2012) suggests that NG can be a viable alternative
to diesel for relatively short line haul distances.
Carrick (2012) suggests that a good rule of thumb to evaluate the economic feasibility of
investing in NG trucks is that, with 80,000 miles per year, and the CNG price at 50% of the diesel
fuel price, the initial investment in an NG truck will be recovered in 18 months. The data in Table 3
indicate that CNG prices were 40% below diesel prices. However, these were retail pump prices. A trucking firm, with its own NG facilities and/or contracts with refueling companies, is likely to face CNG prices near a 50% discount to diesel prices. After the recovery of the initial investment, NG-
fueled trucks will save $25,000 in fuel cost per truck per year. Carrick (2012) also suggests that by 2020, 5% to 10% of all heavy duty trucks sold in the U.S. will be NG trucks.
Under the assumption of no change in government programs and business as usual, EIA (June
2012) projects that NG heavy-duty truck sales will be about 26,000 per year by 2035 and the total number of heavy-duty NG trucks in the fleet would be 275,000 units.
Under more optimistic assumptions, including:
1. The availability of NG fueling stations
2. NG priced on a cost basis rather than on competing fuel prices
3. Differential NG prices for fleet and non-fleet operators 4. Taxes remain at current levels
55
JTRF Volume 52 No. 2, Summer 2013
EIA (June 2012) projects that heavy duty NG truck sales will increase dramatically to 275,000 per year by 2035. Under the more optimistic assumptions, EIA (June 2012) projects that the number
of heavy duty NG trucks in the U.S. fleet would total 2,750,000 units or 21.8% of the fleet.Railroads have been experimenting with NG products as a fuel for locomotives for over 75 years
(AAR 2007). The first experiment took place in Missouri in 1936. The Joplin-Pittsburg Railroad placed a propane-fueled, 450-hp spark-ignited locomotive in service. This locomotive was later put
in local service by the Kansas City Public Service Company. Several experiments were conducted
from 1959-1980. One experiment, with a gas turbine locomotive, was abandoned because of low fuel efficiency; other experiments were conducted with locomotives using propane and CNG.
In 1992, the Burlington Northern Railway converted two diesel-electric SD-40 locomotives to run on a duel LNG-diesel mode. A 25,000-gallon fuel tender (LNG tank car) placed between the two locomotives, contained fuel for both locomotives. The two locomotives were then placed in unit
train coal service. They were converted back to diesel fuel and general service in 1995.In 1993, MK Rail Corporation introduced an LNG-fueled switch engine. Burlington Northern
and Union Pacific each purchased two of these new switch engines. All four switch engines are still in service in California. The LPG is hauled into California by truck from Arizona. The conversion from diesel to dual diesel-LNG fuels reduced the horsepower of the switch engines from 2,000 to 1,250. The fuel consumption of the converted diesel-LNG engines to do the same work increased by 33%.
The railroad industry reached the following conclusions from these early experiments:
1. NG is not likely to provide the needed power for heavy duty, long-distance unit train
service with the locomotive technology available at that time.
2. NG would require major investments in refueling facilities across the entire railroad
system. NG prices at that time would not generate the savings needed to finance these refueling investments.
3. There were no NOx benefits and all other pollutant emissions were much higher than from the clean-burning diesel electric locomotives.
4. There may be a niche market for NG in switch locomotives. Switch locomotives usually
remain in one location, thereby eliminating the refueling problem that NG would impose
on line-haul locomotives traveling throughout the entire United States.
These early experiments were conducted when diesel and NG prices were close to being equal.
Since then, NG prices have fallen dramatically relative to diesel fuel. These much lower NG prices
have motivated all Class I railroads to begin reevaluating the possibility of using NG to power both
long-haul, heavy-duty locomotives and switch locomotives (Fronczak 2013). Several railroads are
currently working with locomotive manufacturers to develop efficient, clean-burning, and powerful NG locomotives (Bloomberg 2013). NG engines will need to be at least as clean burning as today’s diesel engines to meet EPA emission standards. These reevaluations and actual experiments will
attempt to determine if NG technologies can provide the power and clean burning performance of
diesel-electric technologies at a lower cost. If the NG technologies can meet or exceed the diesel-
performance at lower costs, the railroad industry will likely invest in NG locomotives and fuel
tenders, and refueling, maintenance, and repair facilities. Other than biodiesel, NG is the only near-
term alternative to diesel fuel for trucks. Thus, it is the most likely candidate to be a major substitute
for diesel fuel for some decades until other alternatives are developed in laboratories and then take
the long journey to commercialization.
Synthetic Diesel Fuel
Diesel fuel can be produced synthetically from NG, coal, and biomass. Biomass includes crop residues, grasses, and wood products. The United States has huge quantities of biomass and coal.
The U.S. has the largest reserves of coal (27%) in the world (Brown and Brown 2012). The coal
Diesel Fuel Substitutes
56
industry points out that the U.S. has a 250-year supply of coal at current rates of consumption
(Brown and Brown 2012). The best known synthetic fuel technology is the Fisher Tropsch (FT) process (Brown and
Brown 2012). The FT process was developed in Germany during World War II when Germany was denied access to world petroleum supplies. South Africa also employed FT technology to produce
fuel during its apartheid period. FT fuels are synthetic hydrocarbons produced by the action of
metal catalysts at elevated pressures.
Another technology being developed to produce diesel fuel from biomass is fast pyrolysis.
Fast pyrolysis deconstructs the biomass at very high temperatures to produce a mixture of organic
compounds called bio-oil (Brown and Brown 2012). Hydro processing is then used to convert the bio-oil into renewable diesel.
There are several advantages of synthetic diesel fuels:
1. Synthetic diesel fuels require no modifications to existing engines.2. These fuels can be mixed with and actually improve the quality of petroleum diesel.
3. They are liquids and can be distributed within the existing diesel distribution system.
4. Their sulfur content is near zero.
5. The supply of feedstocks (NG, biomass, coal) for synthetic fuel production is large.
6. Synthetic fuels have very high cetane levels.
Their disadvantages include (Majewski et al. 2011):
1. Except for synthetic diesel made from biomass, they have little or no greenhouse benefit relative to petroleum.
2. They have poor lubricity and cold flow properties.3. Synthetic diesel made from coal has high carbon content, unless capture and sequestration
technologies are incorporated in the production process.
4. They are likely to cost more than petroleum.
Chevron is using NG as a feedstock to produce a “gas-to-liquid” (GTL) synthetic diesel fuel in a new plant being built in Escravos, Nigeria. When completed in 2013, the new plant will convert
325 million cubic feet of natural gas into 33,000 barrels (1,386,000 gallons) of low-sulfur, synthetic diesel fuel each day (Chevron 2012).
In April 2013, KiOR, a Texas company, completed construction of a synthetic fuel plant in
Columbus, Mississippi, that uses fast pyrolysis to produce cellulosic gasoline and diesel fuels from
biomass (KiOR 2013). This plant has an annual production capacity of 13 million gallons per
year. Its preferred feedstock is southern yellow pine wood chips. KiOR indicates that it will begin
construction of a second plant in Natchez, Mississippi, in late 2013 (KiOR 2013). This second
plant, also using yellow pine wood chips, will have an annual production capacity of 40 million
gallons per year.
KiOR’s revenues will come from the sale of gasoline and diesel fuels and from the sale of
RINs to customers who are not obligated parties under the Renewable Fuel Standards. The diesel
production from this plant will count toward the EPA-mandated 1.28 billion gallons of biofuels.
KiOR estimates that its cost of production of cellulosic gasoline and diesel will be about $1.80 per gallon plus financing and facility depreciation costs (KiOR 2013). This estimate is based on assumed input quantities and prices and excludes financing and depreciation costs. KiOR’s actual cost of production awaits production cost data from the operations of its two plants.
The demand for KiOR’s products, beyond the EPA, state, and city mandates, will depend on
their selling prices. If its diesel price exceeds the price of petroleum diesel, truckers and railroads
are unlikely to purchase quantities above the mandated amounts. The price of its non-mandated
synthetic diesel will need to be about the same as or less than the price of petroleum diesel, because
KiOR states that its fuels will be 1.7 GEE (gallons ethanol equivalent) (KiOR 2013). Assuming 75,670 Btu per gallon of ethanol, 1.7 GEE converts to 128,639 Btu per gallon for the KiOR diesel.
57
JTRF Volume 52 No. 2, Summer 2013
Petroleum-based diesel contains about 128,700 Btu per gallon, approximately the same as the 128,639 Btu in the KiOR synthetic diesel (Table 2).
When synthetic diesel becomes available commercially, it will likely become part of the EPA-
mandated biomass fuels that truckers and railroads will be required to purchase up to the mandated
quantities. Once the mandated quantities are sold, truckers and railroads will unlikely be willing to
pay more for KiOR and other synthetic diesel than for petroleum diesel. On the other hand, even if
the price of KiOR diesel is less than the price of petroleum diesel, KiOR will continue producing
synthetic diesel as long as the price they receive exceeds their actual variable cost of production.
Given the huge supplies of NG, coal, and biomass in the United States, it appears that substantial
research funds should be allocated to the Fisher Tropsch, fast pyrolysis, and other synthetic fuel
production processes; this research should focus on reducing production costs and making synthetic
diesel fuels more environmentally friendly.
Hydrogen
Fuel cells are self-contained devices that convert hydrogen directly into electricity. The electricity
then powers an electric motor to move the vehicle. Some experimental fuel cells have been installed
in small autos, trucks, and one railroad locomotive. Thus far, fuel cells have been unable to produce
adequate power for these vehicles and costs have been high. The conclusion from these tests is
that commercial use of fuel cells for freight transportation is decades away (Chevron 2012). Some
observers believe that fuel cells will one day replace diesel engines (Majewski et al. 2011)
A second hydrogen option is the hydrogen internal combustion engine. The hydrogen combustion
engine is closer to commercial deployment than the fuel cell and it can be manufactured at prices
costing 15% more than petroleum engines (Majewski et al. 2011). It can run on pure hydrogen or
on a combination of hydrogen and CNG.
Hydrogen, a tasteless, odorless, and colorless gas, is not found freely in nature. It must first be extracted from other substances such as coal and biomass. Fundamental problems with fuel cells
and hydrogen internal combustion engines include (Brown and Brown 2012):1. The extreme difficulty and cost of extracting and storing gaseous and liquid hydrogen2. The low energy density of hydrogen
3. High levels of emissions from extracting hydrogen from fossil fuelsIt is likely that fuel cells and hydrogen internal combustion engines are decades away from
commercialization.
ELECTRICITY
Almost all U.S. railroad freight locomotives use a diesel-electric drive system. The output from the
diesel combustion engine is used to generate electricity. This electricity drives the electric motor
on each of the six drive axles on most heavy-duty, long-distance locomotives, to provide the high
torque required to move the train (AAR 2007). This idea has been in existence for over a century. In the early 1900s, General Electric Company sold a gas-electric version of this idea to railroad companies (General Electric Company 1911).
The major benefit of the diesel-electric system is that it eliminates the need for mechanical transmissions. The issue being discussed in this section is not about the use of electricity to power
trains. Railroads already do that. The issue is whether the electricity should be generated on-
board the locomotive by a diesel engine, or generated elsewhere and transmitted to locomotives in
movement from one location to another.
In this paper, railroad electrification refers to generating the electric elsewhere and transmitting it to locomotives. There are numerous electrified transportation systems around the world. One
Diesel Fuel Substitutes
58
example is the Trans-Siberian railway that extends 9,880 km from Moscow to Nakhodka, Russia. Many U.S. railroad passenger systems are electrified.
Electricity is supplied to railroad locomotives by an overhead wire (catenary) system. The
technology for this system is well established and mature. Therefore, major innovations are unlikely.
The advantages of electrified rail systems include (Majewski et al. 2011):1. Zero emissions from the locomotives2. Reduced noise
3. High power-to-weight ratios in passenger trains allowing rapid acceleration and high speeds
4. Alternative fuels (fossil, nuclear, renewable) can be used to generate the electricity
5. The use of regenerative brakes, which put the electric motors in reverse to convert the
kinetic energy of a vehicle already in motion, into electricity. Reversing the electric motors
acts as a brake on the vehicle and, at the same time, the kinetic energy of the moving
vehicle powers the reversed electric motors to generate electricity that is fed into batteries
to be used as power at a later time (howstuffworks 2013 and Kinetic Energy 2013).
The disadvantages include:
1. There is an exceedingly high cost of infrastructure and locomotives.
2. The high infrastructure cost would be prohibitive on low-traffic main and branch rail lines. Therefore, an electrified rail system would require capital investments in the entire electrical transmission infrastructure, new electric locomotives and a completely new
electrical maintenance and support system. In addition, a complete duplicate diesel-electric
infrastructure system, including diesel-electric locomotives and a maintenance and support
system would be required to service the traffic to and from the lower traffic main and branch rail lines.
3. There are potentially high emissions from electrical generation.
4. Some tunnels may not be large enough to accommodate the centenary system.
5. A single infrastructure failure on the electrified system would close down the entire electrified system served by that infrastructure.
6. The maturity of the technology means that major innovations are unlikely.
Given the huge cost of electric infrastructure, the need for dual electric and diesel systems and
the lack of new technology, an electrified rail freight system is not likely to be economic under most short- and medium-term fuel price scenarios.
In the 1920s, the railroad system in the Northeast United States, called the Northeast Corridor, was converted from coal-fired steam engines to an electrified system. This electrified system was an improvement for both passenger and freight traffic over the steam engine system. During the 1950s and 60s, the remaining U.S. rail freight system was converted from the steam engine system to the diesel-electric system. By the 1970s, it became abundantly clear that the diesel-electric system was superior to the electrified system for freight traffic. In the 1980s, the Northeast Corridor rail freight system was converted from electricity to diesel-electric. The Northeast Corridor passenger rail
system remains electrified and 80% of that system is owned and operated by the government-owned Amtrak passenger service. In fact, the fast starts and high speeds of light weight passenger trains
are well served by electrified rail systems. Today’s highly efficient, powerful, clean burning diesel-electric system, however, is operationally and profitably preferred for heavy-duty freight traffic over an electrified system. Nevertheless, the question continues to be asked “Should the entire current rail system be electrified to reduce petroleum consumption and imports in the United States?”
The answer to the above question is that electrification of the U.S. rail freight system will not occur unless and until diesel and diesel substitute prices rise to a level that will economically
justify the huge expenditures needed to build and operate a new electrified system. Today, no one knows what those prices will need to be to economically justify the conversion of railroads to
electrification. Another alternative is that the government, in an effort to reduce petroleum imports,
59
JTRF Volume 52 No. 2, Summer 2013
politically mandates the electrification of the railroad system. If that happens, the government will need to determine where it will obtain the huge amounts of capital to finance the electrification and operation of the rail system.
FUEL EFFICIENCY
Freight transportation fuel efficiency is often defined as the number of miles one ton of product is moved per gallon of fuel. It is expressed as revenue ton-miles per gallon. Therefore, higher ton-
miles of revenue freight per gallon indicate higher fuel efficiency. There has been more discussion of finding substitute fuels for petroleum-based fuels than in identifying the role of fuel efficiency as a substitute for petroleum. This section will discuss the role of fuel efficiency as a partial substitute for diesel fuel in the railroad and trucking industries.
In 1975, Class 1 railroads used 3.7 billion gallons of diesel fuel to produce 754 billion revenue ton-miles of freight. In other words, in 1975, Class 1 railroads achieved 206 revenue ton-miles of freight per gallon of diesel fuel (AAR 2011). In 2011, the Class 1 railroads again used 3.7 billion gallons of diesel fuel to produce 1,729 billion revenue ton-miles of freight. This represents 469 revenue ton-miles per gallon of fuel, an increase of 128% over 1975. Thus, in 2010, the Class 1 railroads moved 128% more ton-miles of freight with the same amount of fuel that they used in
1975. This is a major improvement in fuel efficiency. In effect, the gains in railroad fuel efficiency saved 4.7 billion gallons of diesel fuel in 2011 compared wotj the 1975 revenue ton miles per gallon. These gains in fuel efficiency were achieved in several ways, including the following (National Petroleum Council 2012):
1. The tons of revenue freight per car were increased by reducing the tare weight of the empty
cars. In addition, improved wheel and truck design reduced rail car resistance.
2. Improved engine technology and shifting from direct current to alternating electric current
technology reduced the amount of power needed to move a given amount of freight.
3. Positioning locomotives throughout the train reduced the power requirements to start
moving the train, as well as to change speeds.
4. Infrastructure improvements reduced the number of slow speed operations, idle time,
and the number of speed changes. An illustration of this infrastructure improvement was
the rebuilding of the Kate Shelley Bridge, located on the heavily traveled Union Pacific Railroad mainline from Omaha to Chicago. This bridge is located three miles west of
Boone, Iowa. This double track bridge, built in 1901, was designed for the small trains in use at that time. By the year 2000, typical unit coal trains on this mainline consisted of 115 cars, each with gross loaded weights of 143 tons and pulled by three highly efficient, fast locomotives. The condition of the bridge had deteriorated to the extent that train speeds
were limited to a maximum of 25 mph and only one train could cross the bridge at a time.
Trains would often be backed up for miles waiting for their turn to snake across the bridge.
With their diesel engines idling as they waited for their turn, trains would cross the bridge
at slow speeds and then use more fuel to resume their assigned travel speeds. The Union
Pacific Railroad spent more than $50 million to build a new double track bridge that was opened in 2009. Now, two trains travel across this bridge simultaneously at speeds up to 70 mph with no slowdowns or waiting stops, thus saving substantial amounts of fuel compared with the old bridge.
5. Track technology, maintenance and control systems have been improved.
6. New GenSet switch locomotives have two or three 627 or 700 hp diesel engines rather than one 2,000+ hp diesel engine (AAR 2007). The purpose of GenSet locomotives is to match the engine power with the needed power to perform an assigned function. One engine is
used for light functions and the other(s) remain off. Two or three engines are used to move
Diesel Fuel Substitutes
60
heavier loads. So far, GenSet locomotives have been used mostly in switching duties and
have saved up to 37% of the fuel used by single engine switch engines.7. Lubrication of railheads and wheel flanges reduces train friction, and automatic sanding
reduces locomotive wheel slippage when starting train movement.
8. Electronic controls operate trains more efficiently, and engine shutdown policies and start-stop systems have been implemented.
9. Empty backhauls have been reduced and more efficient routing has been achieved.10. Aerodynamics have been improved.
11. Crew training, including reward programs for top fuel efficiency, have been implemented.Each of these developments contributed to the railroad’s 128% increase in revenue ton-miles
per gallon of fuel since 1975. Railroad fuel efficiency is expected to continue to increase as older rail cars and locomotives are replaced by new ones that have all of the current fuel efficient features in place. In addition, railroads will implement new efficiency developments as they become available.
Trucks have also achieved substantial gains in fuel efficiency. Many of these gains were obtained from the following developments:
1. Hybrid electric vehicles have generated a 14% improvement in fuel efficiency. Most of the gains in fuel efficiency from hybrid electric trucks occur in high density stop and start service (Walkowicz et al. 2012).
2. Diesel engine technology has been significantly improved to increase the fuel efficiency and to meet exhaust emissions mandates. The advancements in the combustion technology
include high fuel injection pressure to create better fuel-air mixture, multiple fuel injection
pulses in one engine cycle to facilitate combustion control, variable geometry turbo for
better air control, and exhaust gas recirculation to help control combustion phasing (Kong
2012).
3. Vehicle aerodynamics (including cab mounted deflector shields, trailer skirts, and wheel covers) have been improved.
4. Electronic control features, including road speed governors have been added.
5. Tire rolling resistance has been reduced.
6. Longer, wider, and higher trailers are being used.7. Operational improvements, including reducing the number of empty and partially loaded
miles, and driver training, have been implemented.
Each gallon of fuel saved through fuel efficiencies eliminates a gallon of petroleum imports. Moreover, a gallon of unused fuel emits zero pollutants. On a gallon-to-gallon basis, fuel efficiencies contribute more to clean air than replacing petroleum with lower pollutant emitting fuels.
CONCLUSIONS
1. The U.S. does not have a shortage of freight transportation fuels. It is developing a shortage
of low cost, liquid fuels for trucks and railroads that meet environmental standards.
2. The U.S. has an abundance of NG that can be used as CNG or LNG fuels. Currently, LNG and CNG prices are substantially below those of petroleum based diesel. In addition, CNG,
LNG, and natural gas can be converted into liquid synthetic diesel fuels. These fuels could power some freight transportation until fuel cells and environmentally friendly synthetic
biomass and coal-to-liquid diesel fuels are developed and commercialized at prices that are
competitive with petroleum based diesel.
3. In the short- or medium-term years ahead, the most likely commercially available
substitutes for petroleum-based diesel fuel for freight transportation will be biodiesel, NG,
electricity for railroads, and fuel efficiencies.
61
JTRF Volume 52 No. 2, Summer 2013
4. Motor carriers and railroads are unlikely to use more biodiesel and other mandated fuels
than government blending mandates require, unless their prices decline below those of
petroleum-based diesel,
5. Motor carriers will most likely increase their consumption of NG. Larger and more powerful NG engines, improved and lower cost per gallon NG storage tanks, and a
substantial increase in the number of NG fueling stations and refueling capacity will be
the major forces motivating trucking firms to purchase increasing numbers of NG-fueled trucks. Within the next five years, the major focus will be in using the new 12-liter NG engine in local and regional freight movements. The introduction of the 15-liter NG engine
in the next four to five years, will expand the use of NG into national coast-to-coast truck movements.
6. The dramatic decreases in NG prices has motivated all Class I railroads to reevaluate their
strategy of maintaining a completely diesel-electric system. Three railroads are now
testing LNG locomotives. These reevaluations and actual experiments will determine if NG technologies can provide the power and clean burning performance of diesel-electric
technologies at lower costs. If the NG technologies can meet or exceed the diesel-electric
power and clean burning performance at lower costs, the railroad industry will likely invest
in NG locomotives and fuel tenders, along with refueling and maintenance and repair
facilities.
7. Railroads will not convert their freight operations to an electrified rail system unless diesel and diesel substitute fuel prices rise to a level that justify the huge capital investments
needed for electrification. At the present time, no one knows how high diesel and diesel substitute fuel prices would need to rise to make the conversion to electricity economically
feasible.
8. Fuel efficiency technologies have resulted in major improvements in fuel efficiencies of railroad and truck freight operations. New and existing technologies have a high probability
of continuing to make large improvements in freight fuel efficiencies. In addition to developing alternative fuels, emphasis should continue to be placed on improving fuel
efficiency in freight transportation. Each gallon of fuel saved through increased fuel efficiency emits zero pollutants and helps make the U. S. economy more competitive in domestic and world trade.
9. If and as they are developed and commercialized, renewable biofuels, hydrogen-based fuel
cells and internal combustion engines, and environmentally friendly synthetic biomass and
coal-to-liquid diesel fuels will substitute for some petroleum diesel if mandated by the EPA
or if competitively priced with diesel.
There are numerous opportunities for research on alternative fuels for freight transportation.
Some that are suggested by this analysis include:
1. Investment and operating costs of alternative NG truck engine sizes and fuel storage tanks
and diesel powered trucks now and in the future. This is particularly needed for the new
12- and 15-liter NG engines.
2. Costs of producing alternative types of synthetic fuels now and in the future,
3. Diesel and diesel substitute fuel prices levels that will make an electrified railroad system economically feasible,
4. Return on investments in developing and commercializing alternative synthetic fuels,
5. Return on investments in developing alternative fuel efficiency options,6. Return on investment to shift alternative parts of the U.S. railroad system to NG and/or
other alternative fuels,
7. The impact of potential U.S. energy independence on the prices and quantities of diesel
fuel and alternative diesel substitute fuels for use in freight transportation,
Diesel Fuel Substitutes
62
8. The potential demand (prices and quantities) for synthetic diesel fuels and hydrogen to be
used in U.S. freight transportation, and
9. Available data on comparable retail prices of alternative fuels at refueling stations are
extremely limited. There is a need to generate retail price data on diesel, NG, and other
substitute fuels for freight transportation.
References
About.com. Hybrid Cars and Alternative Fuels. May 2013.
Association of American Railroads. RailroadFacts. Washington, D.C., 2011.
Association of American Railroads. “An Evaluation of Natural Gas-fueled Locomotives.” Prepared by BNSF Railway Company; Union Pacific Railroad Company; The Association of American Railroads and California Environmental Associates. November, 2007.
Bloomberg. “GE Races Caterpillar on LNG Trains.” April 29, 2013
Brown, Robert C. and Tristan R. Brown. “Why Are We Producing Biofuels? Shifting to the Ultimate Source of Energy.” Brownia LLC, Ames, Iowa, 2012.
Carrick, Robert. Personal communications. Sales Manager, Natural Gas for Freightliner Trucks,
Daimler Trucks North America LLC, Portland, Oregon, December 21, 2012 and May 5, 2013.
Center for Liquefied Natural Gas. LiquefiedNaturalGasFacts. 2012.
Chevron. DeliveringEnergy. April and May 2012.
Davis, R. et al. ”Techno-Economic Analysis of Autotrophic Microalgae for Fuel Production.”
AppliedEnergy 88, (2011): 3524-31.
Energy Information Administration. InternationalEnergyOutlook. September 19, 2011.
Energy Information Administration. AnnualEnergyOutlook2012. June 2012
Energy Information Administration. U.S.ProvedReservesIncreasedSharplyin2010. August 2,
2012.
Energy Information Administration. DieselFuelExplainedPricesandOutlook. February 5, 2013
Energy Information Administration. AnnualEnergyOutlook2013. April 15, 2013.
Energy Information Administration. U.S.Crude,NaturalGasandNGLiquidsProvedReserves. May, 2013.
Fronczak, Robert E. P.E. Personal communication. Assistant Vice President Environment and
Haz Mat, Association of American Railroads, Washington D.C. January 2013.
General Electric Company. “Gas-Electric Motor Car.” Bulletin No. 4855, Schenectady, N.Y., 1911.
Geherke, Joel. “Obama: Use ‘Algae’ as a Substitute for Oil.” TheWashingtonExaminer, February
2, 2012.
Herman, William. “Clean, Green Energy Source Could Replace Fossil Fuels.” The ArizonaRepublic, August 27, 2010.
Irwin, Scott. “The Amazing Continuing Story of Natural Gas Prices.” University News Release,
University of Illinois, Champaign, Illinois. February 16, 2012.
Kinetic Energy. http//hyperphysics.phy-astr.gsu.edu/ke.html. May 2013.
KiOR, Inc. “Form 10-K,” May 10, 2013. KiOR.com.
Kong, Song-Charng. Personal communication. Department of Mechanical Engineering, Iowa
State University, Ames, Iowa. August 28, 2012.
Majewski, Addy, Hannu Jääskelainen, Echopoint Inc., Steve G. Fritz, Southwest Research Institute and Brian Smith, TTCI. “Alternative Fuels Availability Make-up, and Potential Impact on Locomotive Engines.” Transportation Technology Center, Inc., a subsidiary of the Association of American Railroads, Pueblo, Colorado, 2011.
National Biodiesel Board (NBD) “History of Biodiesel and NBB.” Jefferson City, Missouri, 2012.
National Geographic Daily News. “EstimatesClash forHowMuchNaturalGas in theUnitedStates.” February 29, 2012.
National Petroleum Council (NPC). “Advancing Technology for America’s Transportation Future,
Topic #2, Rail Transportation Demand, Working Paper of the NPC Transportation Fuels Study.” An
Oil and Gas Advisory Committee to the Secretary of Energy, August 1, 2012.
Reidy, Susan. “Biodiesel Breaking Point.” WorldGrain’s Biofuels Business Quarterly, August
2012, www.World-Grain.com.
Renewable Energy Group, Inc. “Form 10-K.” United States Securities and Exchange Commission.
Washington, DC, December 31. 2012.
Ring, Beth. Personal communication. Missouri Department of Transportation, Jefferson City, Missouri, June, 2011.
Romba, Phil. “Studying ROI for Natural Gas.” Transport Topics, The Weekly Newspaper of
Trucking and Freight Transportation, July 9, 2012.
U.S. Department of Energy. TransportationEnergyBook Chapter2,Energy, July 31, 2012.
U.S. Department of Energy. Clean Energy Alternative Fuel Price Report, various issues, 2011-2013.
Walkowicz, K., M. Lammert, and P. Curren. “Coca Cola Refreshments Class 8 Diesel Electric Hybrid Tractor Evaluations.” Office of Energy Efficiency and Renewable Energy, National Renewable Energy Laboratory, August 12, 2012.
Wen, Zhiyou. Personal communication. Department of Food Science, Iowa State University, Ames, Iowa, 2012.
Wikipedia. “GGE-Gasoline Equivalent (US Gallons) Tables.” May 2013.
C. Phillip Baumel is a distinguished professor emeritus at IowaStateUniversity. He receivedtheTransportationResearchForum’sDistinguishedTransportationResearcherAwardin1993,theTransportationResearchForum’sOutstandingResearchPaperAwardsin1982,1989,and1999,andtheTransportationResearchForum’sAgriculturalandRuralTransportationAwardsin1989,1991,and1995.HeisafellowintheAmericanAgriculturalEconomicsAssociation.Baumelpioneeredtheuseofnetworkmodelsforanalyzingissuesinagriculturalproducttransportationbyrail,truck,andbarge.Heretiredin2003andcurrentlylivesinIowa(summer)andArizona(winter).