The Mississippi River System Shallow Draft Barge Market – Perfectly Competitive or Oligopolistic? Author(s): C. Phillip Baumel Source: Journal of the Transportation Research Forum, Vol. 47, No. 4 (Fall 2008), pp. 5-18 Published by: Transportation Research Forum Stable URL: http://www.trforum.org/journal The Transportation Research Forum, founded in 1958, is an independent, nonprofit organization of transportation professionals who conduct, use, and benefit from research. Its purpose is to provide an impartial meeting ground for carriers, shippers, government officials, consultants, university researchers, suppliers, and others seeking exchange of information and ideas related to both passenger and freight transportation. More information on the Transportation Research Forum can be found on the Web at www.trforum.org. Transportation Research Forum
Transcript
The Mississippi River System Shallow Draft Barge Market – Perfectly Competitive or Oligopolistic?
Author(s): C. Phillip Baumel Source: Journal of the Transportation Research Forum, Vol. 47, No. 4 (Fall 2008), pp. 5-18
Published by: Transportation Research Forum
Stable URL: http://www.trforum.org/journal
The Transportation Research Forum, founded in 1958, is an independent, nonprofit organization of transportation professionals who conduct, use, and benefit from research. Its purpose is to provide an impartial meeting ground for carriers, shippers, government officials, consultants, university researchers, suppliers, and others seeking exchange of information and ideas related to both passenger and freight transportation. More information on the Transportation Research Forum can be found on the Web at www.trforum.org.
The Mississippi River System Shallow Draft Barge Market – Perfectly Competitive or Oligopolistic?by C. Phillip Baumel
Most transportation textbooks and articles on inland waterway navigation assume a perfectlycompetitiveMississippiRiversystembarge industry. Onestudy found the1972and1977grainbargeindustrytobeoligopolistic.AsecondstudyoftheU.S.bargeindustryfound“intraindustrycompetition for the barge industry on a day-to-day basis with easy entry and exit.”Using theconcentrationratioandtheHerfindahlIndex,thisstudyfoundtheMississippiRiverbargeindustrytobeoligopolistic.Theseresultssuggest thatMississippiRivernavigation infrastructurestudiesshouldnotuselongrunmarginalbargecostsasaproxyforbargerates.
INTRODUCTION
Much has been written about the competitive nature of the Mississippi River system shallow draft barge industry. Early writers believed that the barge industry was very competitive relative to other modes. Pegrum (1973, p. 242) stated: “Barge costs are mostly variable and the industry is therefore highly competitive.”
Shabman (1976) implied perfect competition. He noted that the benefits of a policy of free use of public funded waterway navigation investments are apparently shifted forward to shippers and their customers. Sorenson (1973), examining rail-barge competition in wheat transportation, stated:
“The inland water-carrier industry is structurally competitive. Entry is relatively unrestricted and capacity for established firms can be expanded or reduced with relative ease. Costs are specific to traffic units and hence dominantly variable with traffic volume. Under these conditions, rates over a reasonable period of time would be expected to reflect carrier costs.”
Sorenson (1973) implicitly stated that the barge industry is perfectly competitive. MacDonald (1987, p 155) argued that barging is a highly competitive industry with low barriers to entry.
In its feasibility studies and papers, the U.S. Army Corps of Engineers assumes that the barge industry is perfectly competitive. For example, in the executive summary of a report describing the Corps of Engineers’ Tow Cost Model, Berry (1987) states: “It is assumed that any changes in the costs specified in the base year ... will induce proportional changes in the base year transportation rates.”
In U.S. Army Corps of Engineers (1997), the unidentified authors assume that barge rates are always “competitively priced at marginal costs.”
Two National Research Council reviews (2001 and 2004) were critical of the Corps of Engineers’ Upper Mississippi River-Illinois Waterway Feasibility study. Following these reviews, the Corps of Engineers commissioned several papers to develop alternative methods for their feasibility studies. Some of these papers assume the barge industry to be perfectly competitive. For example, Anderson and Wilson (2005, p.5), explicitly stated that,
“shipping by truck and by barge is perfectly competitive and constant per unit per distance shipped at rates t and b respectively.” None of the above references cite any empirical evidence to justify their explicit or implicit
assumption of a perfectly competitive barge industry. The first purpose of this paper is to review the
Mississippi River System Barge
6
available research on the market structure of the Mississippi River system barge sector. The secondpurpose is to update these analyses with current data to determine if the conclusions from earlierstudies remain valid.
STRUCTURE OF THE MISSISSIPPI RIVER SYSTEM BARGE SECTORS
A review of the literature found two studies that examined the market structure of the barge industry. Woolverton (1978) used the traditional “structure, conduct and performance” approach to evaluate the structure of the Mississippi River system grain barge sector. Using barge industry and Corps data on the number of covered dry cargo barges operated, Woolverton (1978) calculated the percent of covered dry cargo barges owned by the largest 4, 8 and 20 firms operating covered dry cargo barges on the Mississippi River system. Adding these percentages, he calculated the concentration ratios for the covered dry cargo barge sector on January 1, 1972 and 1977, shown in Table 1.
Woolverton (1978) concluded that: 1. The covered dry cargo sector of the Mississippi River system barge industry was
concentrated, but not highly concentrated. 2. Based on criteria by Caves (1972, p.7), the barge industry was classified as an oligopoly, in
which the largest eight firms owned at least 50% of the total number of covered dry cargo barges, and the largest 20 owned at least 75%. Woolverton (1978) concluded that the 1972 and 1977 grain barge sectors met the conditions of an oligopoly.
3. There was little basis that product differentiation would allow one firm to charge a substantially higher price for its services than other barge fir
4. Cost barriers may have prevented entry into the covered dry River barge industry during the period examined.
5. The estimated cost to barge grain was not significantly rTherefore, the null hypothesis that there was no relationestimated barge costs was accepted. This means that estaccurately be used as a proxy for barge rates.
ms. cargo sector of the Mississippi
elated to the negotiated rates. ship between barge rates and imated barge costs could not
Table 1: Percent of Total Covered Dry Cargo Barges Operated by Mississippi River Barge Firms, January 1, 1972 and 1977
Percent of barges operated by the largest: 1972 1977 4 firms 44.5 28.6 8 firms 57.7 45.6 20 firms 72.3 82.6
Data Source: Woolverton (1978)
Vachal et al. (2005) examined the market structure of the U.S. waterways domestic barge industry in 1995 and 2002. They defined the U.S. domestic barge industry to include barges operating on the Great Lakes; the Atlantic, Gulf and Pacific Coasts; and the Mississippi River and Gulf Intracoastal Water Way (GIWW). They calculated the Herfindahl-Hirschman Index (HHI), based on the 2002 ownership of the entire U.S. domestic barge industry, to be 0.03. Vachal et al. (p.15, Table 4) reported that the number of operators on the Mississippi River-GIWW increased from 835 in 1995 to 894 in 2002. Vachal et al. (pp.42-44) reached the following conclusions regarding the U.S. waterways barge market:
1. The 2002 HHI’s for the ownership of the entire U.S barge industry and for the ownership of all of the three types of barges on the Mississippi River-GIWW were low, indicating a low level of ownership concentration.
2. The number of barge operators is large and it is increasing.3. The services of barge companies are largely indistinguishable.
7
Mississippi River System Barge
4. Capital is not an inhibiting factor for entry.5. Barge company entry is fairly easy.6. The ease of entry and indistinguishable service make it difficult to raise prices above
marginal costs.7. Intra-industry competition appears to be highly competitive.8. The barge industry structure is similar to the trucking industry.Vachal et al. (2005) also calculated the HHI for covered dry cargo barges, open top dry cargo
barges and tank barges on the Mississippi River and GIWW. Their HHI calculations for 2002 ranged from 0.203 for covered dry cargo barges to 0.225 for tank barges. Three groups of loaded barge drafts were included in their Mississippi River-GIWW HHI calculations. These three loaded draft groups were nine feet or less, 10-14 feet and 14 feet or more. Vachal et al. (pp.9 and 23) acknowledged that vessels with loaded drafts greater than nine feet cannot traverse the nine-foot maximum draft locks on the Mississippi River and its tributaries, nor the nine-foot channel of the Missouri River. Including loaded draft barges greater than nine feet in the Vachal et al. analysis means that the Mississippi River system market, which accommodates only up to nine-foot loaded draft barges, was incorrectly defined. Therefore, the HHI calculations for the U.S. barge industry and the Mississippi River markets by Vachal et al. are inappropriate measures of the concentration of the Mississippi River system shallow draft barge market.
Vachal et al. (2005, p.24) did list the 1995 and 2002 top ten operators of nine-foot loaded draft Mississippi River-GIWW covered dry cargo barges. They also reported each of the top ten operators’ shares of the total capacity of the nine-foot loaded draft covered dry cargo barge fleet. These market shares were 69% for 1995 and 87% for 2002 (pp.24-25). Vachal et al. failed to present the HHI for the Mississippi River-GIWW nine-foot loaded draft covered dry cargo barge fleet market. However, they did present enough 1995 and 2002 data on this covered dry cargo barge sector (p. 24, Table 10) to calculate the HHI for the top five operators of nine-foot loaded draft covered dry cargo barges on the Mississippi River for 1995 and 2002. The HHI and concentration ratio for the 2002 data will be calculated and presented in this paper.
METHOD OF ANALYSIS
Economic theory tells us that the competitive structure of any industry is an important issue. A perfectly competitive industry maximizes producer and consumer surplus, and prices are set at long run marginal costs. Therefore, the benefits from any public investment in a perfectly competitive industry will be passed to the selling and/or buying public. A less competitive industry will attempt to restrict output and increase price to capture consumer surplus and economic profits. Firms in a less competitive industry will attempt to capture part of the benefits of any public investment in their industry. Therefore, barge industry market structure is crucial in any study estimating the public benefits from proposed public inland waterway infrastructure investments.
Oligopoly is a market structure in which a small number of firms compete (Parkin 2003). A general theory of oligopoly continues to elude economists. Several partial theories of oligopoly exist. However, there is no general oligopoly theory to provide guidance on the equilibrium price and output of an oligopoly firm or which industries are oligopolistic. Many factors determine the structure of a market (Parkin 2003). One of these factors is how many firms dominate a given market. Economists have traditionally relied on measures of concentration to determine the extent to which a particular market is dominated by a small number of firms.
Two commonly used measures used to evaluate market structure are the concentration ratio (CRx) and the Herfindahl-Hirschman index (HHI). The CRx is the percent of the market sector controlled by the largest x firms. CR4, the percent of the market sector controlled by the four largest firms, is commonly used to judge the level of concentration in an industry. A low concentration ratio indicates a high degree of competition, while a high concentration ratio indicates a market that is dominated by a few firms in an oligopoly (Parkin 2003, p. 202).
Mississippi River System Barge
8
The CRx is frequently criticized because it does not indicate the relative size of the x largest firms (Hannaford 2007). Other limitations of concentration measures are their failure to take into account barriers to entry, the geographical scope of the market, trends in the number of firms, product differentiation and vertical integration (Parkin 2003). These factors will be discussed in this paper with respect to the Mississippi River system shallow draft barge market.
The HHI takes into account the relative size and distribution of firms (U.S. Department of Justice 2007). It is calculated by squaring the percent of the sector controlled by each firm in the industry and summing over all firms. A full measure of the HHI requires data on the market shares of all firms in the market. However, the squared market shares for the top five firms provide a close approximation of the actual HHI. This is because the squares of small market shares add only small amounts to the HHI. This analysis calculates the HHI for the five largest firms in the Mississippi River-GIWW shallow draft dry cargo and liquid cargo barge markets. Because the HH5 excludes n-5 firms in the market, the calculated HH5’s in this paper slightly underestimate the HHI’s for the shallow draft Mississippi River system barge market.
An increase in market concentration raises concerns about its potential economic impact. This concern focuses on the trade-off between greater market efficiency and producer and consumer benefits from increased competition versus the benefits from economies of size from the increased concentration (Fernandez-Cornejo and Just 2007, p. 1272). This concern has led to the development of the New Empirical Industrial Organization (NEIO), now the cornerstone of industrial conduct analysis. Assuming firm behavior is interdependent, NEIO studies estimate conjectural variations in production choices. This approach has been extended to simultaneous estimation of price-taking behavior where firms have market power in both input and output markets and to estimate the market power and cost-efficiency effects of industry concentration (Fernandez-Cornejo and Just 2007). Fernandez-Cornejo and Just (2007) suggest that this type of analysis is limited by the absence of firm level data, including financial data. Vachal et al. (2005, p.30), confirm that little firm level financial and other data are available for the Mississippi River system barge sectors. Therefore, this paper will be limited to the traditional structure, conduct and performance analysis.
UPDATING THE WOOLVERTON AND VACHAL ET AL. STUDIES
Woolverton (1978) limited his analysis to barge firms that hauled grain. Therefore, he used the number of covered dry cargo barges operated by each firm to estimate the level of concentration in the barge industry. This update will expand the Woolverton (1978) analysis to include barge firms that operate both covered and/or open top dry cargo barges. The reason for this expanded analysis is that covered dry cargo barges can be converted to open top dry cargo barges by simply removing the covers. Therefore, limiting the analysis to covered dry cargo barges omits the impact of open top dry cargo barges on the structure of the dry cargo barge market.
Woolverton (1978) used the CRx as the main tool to evaluate the level of concentration in the grain barge market. This analysis will also use the CRx as well as the HHI to evaluate the level of concentration in the dry and liquid barge markets. This analysis will also examine other factors that determine barge market structure, including the geographic scope of the market, barriers to entry and exit, trends in the number of firms and vertical integration.
The U.S. Department of Justice (2007) uses the HHI to judge the level of concentration and the seriousness of mergers. Using percentages as whole numbers, the HHI, as used by the U.S. Department of Justice (2007), is a continuum from 0 to 10,000, where zero is a perfectly competitive market and 10,000 is a monopoly. The U.S. Department of Justice (2007) states:
“Markets in which the HHI is between 1,000 and 1,800 points are considered to be moderately concentrated and those in which the HHI is in excess of 1,800 points are considered to be concentrated. Transactions that increase the HHI by more than 100 points in concentrated markets presumptively raise antitrust concerns under the Horizontal Merger Guidelines issued by the U.S. Department of Justice and the Federal Trade Commission.”
9
Mississippi River System Barge
The CRx is a continuum up to 100%, where 100% means that one firm controls the market, i.e. a monopoly. Hannaford (2007) states that “CR4 is the most typical concentration ratio for judging what kind of an oligopoly it is. A CR4 greater than 50% is generally considered a tight oligopoly; a CR4 between 25 and 50% is generally considered a loose oligopoly. A CR4 less than 25% is no oligopoly at all.”
Parkin (2003 p.202) states:“A four-firm concentration ratio that exceeds 60% is regarded as an indication of a market that is highly concentrated and dominated by a few firms in an oligopoly. A ratio of less than 40% is regarded as an indication of a competitive market.”
Table 2 shows the CR4 and the HH5 for the 2002 shallow draft Mississippi River-GIWW covered dry cargo barge market. Table 2 is based on the capacity data for nine-foot loaded draft Mississippi River system barges presented by Vachal et al. (2005, Table 10, p. 24).
Table 2: Concentration of Nine-Foot Loaded Draft Covered Dry Cargo Barge Capacity on the Mississippi River and GIWW by the Five Largest Barge Companies, in Short Tons, 2002
The CR4 ratio, based on the Vachal et al. (2005) data for the shallow draft covered dry cargo Mississippi River and GIWW barge market, is 66.0. Using the Caves (1972), Parkin (2003) and Hannaford (2007) guidelines, a CR4 of 66.0 indicates that the 2002 covered dry cargo barge market was an oligopoly. The 2002 CR4, based on Vachal et al. (2005) barge capacity data, is 48% higher than Woolverton’s (1978) 1972 CR4 and 131% higher than Woolverton’s 1977 CR4.
The HH5, based on the 2002 Vachal et al. (2005) nine-foot loaded draft Mississippi River system covered dry cargo barge capacity data, was 1,411; this is slightly above the midpoint of the Department of Justice (2007) HHI guideline for a moderately concentrated market. Thus, the Vachal et al. data for the 2002 nine-foot loaded draft covered dry cargo Mississippi River/GIWW barge market indicate that this market was an oligopoly.
Table 3 shows the CR4 and HH5 for the 2006 Mississippi River system, based on barge firm data published in the U.S. Security Exchange Commission (2008, p. 11) 10-K Report from the American Commercial Lines.
Mississippi River System Barge
10
Table 3: Number and Concentration of Dry Cargo Barges Operated on the Mississippi River System by the Five Largest Barge Companies, December 31, 2006
Number of Cumulative Cumulative Company Barges CR HHIIngram Barge Co. 3,633 20.3 412American Commercial Lines 2,639 35.1 631AEP/MEMCO Barge Line Inc. 2,628 49.8 847American River Transportation Co. 2,061 61.3 979Cargo Carriers 958 - 1,009Other 5,966 - -Total 17,885
Data Source: U.S. Security Exchange Commission (2008) - -
Based on the U.S. Security Exchange Commission (2008) data, the CR4 for the 2006 dry cargo Mississippi River System barge market is 61.3. This is slightly lower than the CR4 calculated from the Vachal et al. (2005) 2002 data in Table 2. Using the Caves (1972), Parkin (2003) and Hannaford (2007) guidelines, the CR4 of 61.3 indicates that the 2006 covered and open top dry cargo barge market was an oligopoly. Using the U.S. Department of Justice (2007) guidelines, the HH5 of 1,009 in Table 3 also indicates that the 2006 Mississippi River dry cargo barge market was an oligopoly.
The Barge Fleet Profile (Informa Economics 2008) indicates that 38 firms operated line haul dry cargo barges on the Mississippi River system in 2007. Adding each of the 33 remaining barge operators’ squared shares of the total dry cargo barge fleet would increase the HHI for the entire 2006 dry cargo barge market above 1,009. In summary, the U.S. Department of Justice (2007), Hannaford (2007), Parkin (2003) and Caves (1972) guidelines, and the data from Woolverton (1978), Vachal et al. (2005) and U.S. Security Exchange Commission (2008) indicate that the Mississippi River system dry cargo barge market is an oligopoly.
Table 4 shows the level of concentration in the 2006 liquid cargo barge market on the Mississippi River system. These data were also taken from the U.S. Security Exchange Commission (2008) 10-K report from American Commercial Lines. The CR4 ratio for the 2006 liquid cargo barge market on the Mississippi River system is 58.2. The Caves (1972) and Hannaford (2007) guidelines indicate that the liquid cargo barge market with a CR4 of 58.2 is an oligopoly. The Parkin (2003) guideline of a CR4 of 60 is slightly above the calculated CR4 of 58.2.
Table 4: Number and Concentration of Liquid Cargo Barges Operated on the Mississippi River System by the Five Largest Barge Companies, December 31, 2006Company Number of Barges Cumulative CR Cumulative HHI
Data Source: U.S. Security Exchange Commission (2008) -
The HH5 for the five largest liquid cargo barge firms is 1,343. Using the U.S Department of Justice (2007) guidelines, a HH5 of 1,343 also indicates that the liquid cargo barge market is an oligopoly. The HH1 for the Kirby Corporation alone exceeds the U.S. Department of Justice
11
Mississippi River System Barge
(2007) minimum of 1,000 to make the Mississippi River system liquid barge market an oligopoly. This illustrates how the HHI takes into account the relative size of firms. The Barge Fleet Profile (Informa Economics 2008) indicates that there were 33 firms operating liquid cargo barges on the Mississippi River system in 2007. Therefore, the HHI for the entire 2006 liquid cargo barge market will be higher than 1,343.
In summary, the data on nine-foot draft loaded barges from Woolverton (1978), Vachal et al. (2005), and U.S. Security Exchange Commission (2008) indicate that the Mississippi River system dry and liquid cargo barge markets are oligopolies.
NUMBER OF SHALLOW DRAFT BARGE OPERATING FIRMS
Table 5 shows the number of dry cargo barge operators reported by Informa Economics (various issues). Informa Economics (2008) surveys include:
“Operators actively engaged in the movement of cargo including carriers for hire and private carriers. Informa Economics does not survey owners of record nor lessors because of the probability of duplication. The survey also attempts to verify those barges that are cross-chartered between carriers in a further attempt to avoid double counting. Operators of chartered equipment list those barges with their active fleet.”
Informa Economics (2008) further states that the equipment included in the survey are shallow draft barges, representing the most commonly employed in the movement of dry and liquid bulk commodities. It excludes those barges that have been removed from line haul trade and not likely to return: these exclusions are barges in construction, dredging, rock or aggregate trade and mooring. The survey also excludes deck or bin barges, dump scows, and deep draft barges. By avoiding duplication among operators, owners of record and lessors, and eliminating deep draft barges and barges not in line haul trade, the Informa Economics Barge Fleet Survey provides the most accurate data available on the number of Mississippi River line haul shallow draft barge numbers and operators.
Table 5: History of Ingram Barge Company Mergers and Acquisitions of Competing Companies
Date Mergers and Acquisitions1946 Ingram Barge Company (IBC) formed1960s Purchased Barrett Lines1978 Became part of Ingram Industries1984 Purchased Ohio Barge Line including 15 boats and 365 barges
Purchased: four barges from Oil Transport
1980s 27 barges from Chotin Transport23 barges and five boats from System Fuels15 barges and seven boats from Arthur Smith and Georgia Transporters
1989 Purchased American Barge and Towing, including eight boats and 365 barges1994 Purchased M/B Transport including eight boats and 354 barges1997 Purchased the marine business of Occidental Chemical Corporation2002 Purchased Midland Enterprises, including The Ohio River Company and Orgulf
Transport Company2005 Purchased Riverway Company, including seven boats, 430 barges, four tug
boats Data Source: www.ingrambarge.com/barge_history.asp
Mississippi River System Barge
12
Figure 1 shows that the number of Mississippi River line haul shallow draft barge operators declined 50% during the 18-year period from 1990-2007. Most of this decline was the result of mergers and acquisitions (Informa Economics 2001). For example, Tables 5 and 6 outline how Ingram Barge Company and American Commercial Lines, the two largest barge firms on the Mississippi River system, used mergers and acquisitions of competing firms to increase their size.
0
20
40
60
80
100
120
140
1990 1992 1994 1996 1998 2000 2002 2004 2006 2008
Figure 1: Number of Mississippi River System Shallow Draft Barge Operators, 1990-2007
Data Source: Informa Economics (Various issues)
Since 1960, Ingram Barge Company merged with or purchased 10 competing barge firms and purchased the assets of four additional barge companies. American Commercial Lines merged with or purchased nine competing barge firms and purchased the assets of one firm. Thus, Ingram Barge Company and American Commercial Lines growth eliminated 19 barge firms and purchased the barge assets of five additional firms.
While Informa Economics (various issues) reported that the number of barge operators on the Mississippi River system declined from 132 in 1990 to 66 in 2007, Vachal et al. (2005, p.15, Table 4) reported that the number of operators on the Mississippi River and GIWW increased from 835 in 1995 to 894 in 2002. It appears that the data used by Vachal et al. included operators, owners, leasers and rock, aggregate, construction and service firms that were not actively engaged in the line haul movement of bulk commodities.
As the number of barge firms declined and the concentration of the five largest barge firms increased, the size of the total barge fleet declined. U.S. Security Exchange Commission (2008, p. 45) states:
“According to Informa, from 1998 to 2006, the industry fleet size was reduced by 2,395 dry cargo barges and 99 liquid barges, for a total reduction of 2,494 barges, or 10.8%.” “Industry data for 2006 indicates that 2006 was the first year in eight years that more barges were built than scrapped, with net additions of 15 liquid barges and 12 dry cargo barges. This level represents the second lowest number of barges in operation within our industry since 1992.”
13
Mississippi River System Barge
Table 6: History of American Commercial Lines, Inc. Mergers and Acquisitions of Competing Barge Companies
Date Mergers and Acquisitions1927 Inland Waterway Company merged with W.C. Kelly Barge Line to form
American Barge Line Company (ABLC)1938 Purchased Sweeny Shipyard, later renamed Jeffboat, Inc. 1957 Merged with Commercial Transport Company 1991 Purchased Hines Corporation1993 Purchased ContiCarriers, a subsidiary of Continental Grain Company1996 Merged with Valley Lines1998 Purchased Southern Marine Service LLC and NMI Holdings2000 Purchased Peavy Barge Line and the inland marine transport division of
ConAgra, Inc.2007 Purchased 20 boats from McKinney Group
Data Source: www.aclines.com/main/ACL_history.asp
Further reductions in the size of the dry cargo barge fleet are possible as the large number of dry cargo barges purchased in 1978-1981 reach the end of their economic life. U.S. Security Exchange Commission (2008, p. 22) states that “the average life expectancy of a dry cargo barge is 25 to 30 years.”
During the late 1970s, it was widely believed that the United States would feed the world (Wisner et al. 2004). Forecasts of continuously increasing exports, combined with investment tax credits, motivated barge companies to purchase 6,050 dry cargo barges during the three years of 1979-1981 (Informa Economics 1998). However, grain exports declined sharply from 1980-1985 (Wisner et al. 2004). This sharp decline in grain exports resulted in an over capacity barge fleet. Many of the Ingram Barge Company mergers occurred during the 1980s and early 1990s as smaller barge companies elected to exit the industry during this period of low farm product exports.
During the mid-1990s, increased grain exports to China generated optimistic forecasts that China would continue to buy increasing amounts of U.S. grains (Wisner et al. 2004). The dry cargo barge sector responded again by buying over 4,280 new dry cargo barges from 1996-1999 (Informa Economics 2008). As in the early 1980’s, the expected increases in grain exports did not materialize (Wisner et al. 2004). Firms wishing to exit the barge industry found few, if any new operating entrants into the industry to buy their barges. Therefore, the declining number of operating barge firms was basically the only potential buyers of excess capacity barges. Many American Commercial Lines acquisitions and mergers occurred during this period. This suggests that Sorenson’s (1973) statement that “entry is relatively unrestricted and capacity for established firms can be expanded or reduced with relative ease” no longer holds.
BARRIERS TO ENTRY
American Commercial Lines (2005, p.30) states: “Since 1980, the industry has experienced consolidation as the acquiring companies have moved toward attaining the widespread geographic reach necessary to support major national customers.” This “widespread geographic reach necessary to support national customers” requires investments to provide the transfer, fleeting, cleaning, construction, repair, maintenance, and logistics services demanded by national customers. This suggests that one reason why Ingram Barge Company and American Commercial Lines purchased or merged with 19 companies was to spread the cost of these services over a larger volume of traffic.
Mississippi River System Barge
14
To accommodate their large customers, American Commercial Lines’ December 31, 2007 investment in barges, tow boats and other equipment, land, and buildings alone totaled $512 million (U.S. Security Exchange Commission 2008). This suggests that it is no longer possible to buy a used dry cargo barge, and with free access to the river, compete successfully with the large barge firms dealing with large integrated customers. Indeed, the five largest dry cargo barge companies are owned by large integrated companies that generate the large amounts of capital that barge companies need to finance the large investments needed to provide the services demanded by large national shippers.
Table 7 shows the ownership of the five largest barge companies along with the 2007 revenues and other businesses of the owning firms. Cargill and ADM, the two largest grain firms in the world, with combined 2007 revenues exceeding $132 billion, own two of the top five barge firms. The third largest barge firm, AEP MEMCO, is owned by American Electric Power, the largest generator of electricity in the United States, with 2007 revenues of $13.4 billion. This suggests that availability of capital may be a major determinant of barge company growth.
Table 7: Revenues and Other Businesses Operated by Companies Owning the Five Largest Barge Companies on the Mississippi River System
Barge Company Owning Company 2007 Revenues in $ Billions Other Major Businesses
Cargo Carriers Cargill $88.3 Grain, other agricultural and industrial
American River Transportation Co.
ADM $44.0 Grain and other agricultural
AEP MEMCO American Electric Power $13.4 Electrical power generationWholesale book sales
Ingram Barge Co. Ingram Industries, Inc. $1.8 (2006) and high risk driver insurance
American Commercial Lines
American Commercial Lines, Inc. $0.8 Barge, tow boat and ship
The second largest barge firm, American Commercial Lines, owns Jeffboat, Inc., the second largest builder of barges in the United States (American Commercial Lines 2005, p. 31). Jeffboat, Inc. also builds towboats (American Commercial Lines 2005, p. 20).
American Commercial Lines (2005, p.7), states: “We believe the synergy created by our transportation operation and Jeffboat’s manufacturing and repair capabilities is a competitive advantage. Our vertical integration permits optimization of manufacturing schedules and asset utilization between internal requirements and sales to third party customers and gives Jeffboat engineers an opportunity to collaborate with our barge operations on innovations that enhance towboat performance and barge life.”
Thus, American Commercial Lines is integrated backwards into the barge manufacturing industry. Vertical integration can be used, and is used, to control raw material supplies and to coordinate
shipping to optimize prices and profits in the marketing chain (Breimyer 1976, p.81). The grain industry is a classic example of using barges to optimize prices and profits. Table 8 shows the concentration of the grain export industry in the New Orleans area which is served primarily by the
15
Mississippi River System Barge
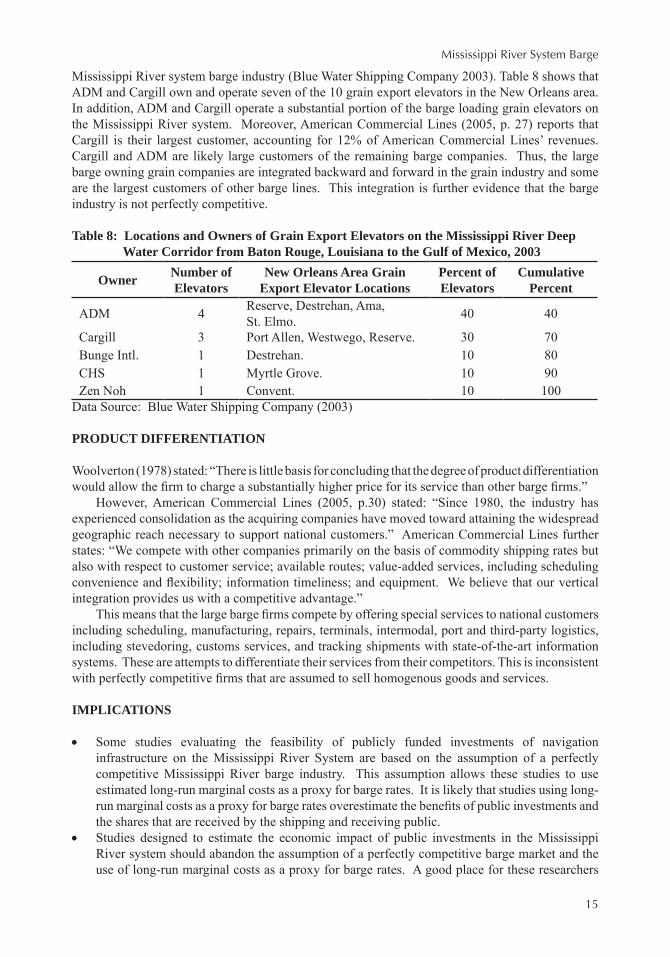
Mississippi River system barge industry (Blue Water Shipping Company 2003). Table 8 shows that ADM and Cargill own and operate seven of the 10 grain export elevators in the New Orleans area. In addition, ADM and Cargill operate a substantial portion of the barge loading grain elevators on the Mississippi River system. Moreover, American Commercial Lines (2005, p. 27) reports that Cargill is their largest customer, accounting for 12% of American Commercial Lines’ revenues. Cargill and ADM are likely large customers of the remaining barge companies. Thus, the large barge owning grain companies are integrated backward and forward in the grain industry and some are the largest customers of other barge lines. This integration is further evidence that the barge industry is not perfectly competitive.
Table 8: Locations and Owners of Grain Export Elevators on the Mississippi River Deep Water Corridor from Baton Rouge, Louisiana to the Gulf of Mexico, 2003
Woolverton (1978) stated: “There is little basis for concluding that the degree of product differentiation would allow the firm to charge a substantially higher price for its service than other barge firms.”
However, American Commercial Lines (2005, p.30) stated: “Since 1980, the industry has experienced consolidation as the acquiring companies have moved toward attaining the widespread geographic reach necessary to support national customers.” American Commercial Lines further states: “We compete with other companies primarily on the basis of commodity shipping rates but also with respect to customer service; available routes; value-added services, including scheduling convenience and flexibility; information timeliness; and equipment. We believe that our vertical integration provides us with a competitive advantage.”
This means that the large barge firms compete by offering special services to national customers including scheduling, manufacturing, repairs, terminals, intermodal, port and third-party logistics, including stevedoring, customs services, and tracking shipments with state-of-the-art information systems. These are attempts to differentiate their services from their competitors. This is inconsistent with perfectly competitive firms that are assumed to sell homogenous goods and services.
IMPLICATIONS
Some studies evaluating the feasibility of publicly funded investments of navigation •infrastructure on the Mississippi River System are based on the assumption of a perfectly competitive Mississippi River barge industry. This assumption allows these studies to use estimated long-run marginal costs as a proxy for barge rates. It is likely that studies using long-run marginal costs as a proxy for barge rates overestimate the benefits of public investments and the shares that are received by the shipping and receiving public. Studies designed to estimate the economic impact of public investments in the Mississippi •River system should abandon the assumption of a perfectly competitive barge market and the use of long-run marginal costs as a proxy for barge rates. A good place for these researchers
Mississippi River System Barge
16
to start modifying their assumptions, models and data is the recommendations in the National Research Council’s reviews (2001 and 2004) of the Corps of Engineers’ Upper Mississippi River Waterway Feasibility study.Transportation researchers should focus on the Fernandez-Cornejo and Just (2007, p. 1272) •suggestion to examine the tradeoff between greater market efficiency and producer and consumer benefits from increased competition, versus the benefits from economies of size from the increased concentration in the Mississippi River system shallow draft barge sectors.
CONCLUSIONS
Some economics textbooks and research papers have explicitly or implicitly assumed that •Mississippi River system barge markets are purely competitive. Under this assumption, the benefits of publicly funded waterway investments are shifted forward to shippers and receivers. Woolverton (1978, p.151-152) stated: •
“Concentration ratios based on the number of covered grain barges owned by each firm indicated that market concentration in the industry has declined slightly in the past five years but still is high enough to classify the industry as oligopolistic rather than purely competitive.”
This paper expands the Woolverton study by including both open top and covered dry cargo •barges and by using the HHI to evaluate the structure of the Mississippi River system shallow draft barge markets. It also computes the CR4 and HH5 using data on the Mississippi River-GIWW nine-foot loaded draft covered dry cargo barge capacities presented in the Vachal et al. (2005) report. The conclusions from this updated study are: •
The CR4 and HH5 measures computed in this study suggest that the Mississippi River o system shallow draft barge markets are concentrated and oligopolistic. The 2006 CR4 for dry cargo barges was 38% higher than Woolverton’s (1978) CR4 and 114% higher than his 1977 CR4. The CR4 and HH5, calculated in this paper from the nine-foot loaded draft Mississippi o River-GIWW barge capacity data contained in the Vachal et al. (2005) report, were higher than those calculated from the U.S. Security Exchange Commission 10-K report (2008) data.Barriers to entry into the Mississippi River system barge market include the increasing size o and declining number of barge firms, large capital requirements of existing barge firms, and vertical integration of the largest barge owning firms.
References
American Commercial Lines,2005AnnualReport. Jeffersonville, IN, 2006.
Andersen, Simon P., and Wesley W. Wilson. “Spatial Modeling in Transportation II: Railroad Pricing, Alternative Markets and Capacity Constraints.” Navigation Economics TechnologiesProgram, U.S. Army Corps of Engineers Institute of Water Resources, February, 2005: p. 4. www.nets.iwr.usace.army.mil/docs/CongestionSpatialEquil/SpatialModelinginTransII.pdf.
Berry, C.A. “Executive Summary, Description and Comparison of the Tow Cost Model (TCM) The General Equilibrium Model (GEM).” U.S. Army Corps of Engineers Humphreys Engineer Center Support Authority, Fort Belvoir, VA 22060-5580, 1987.
Blue Water Shipping Company. “Blue Water Shipping-Mississippi River Deep Water Corridor.” Metairie, LA, 2003.
17
Mississippi River System Barge
Breimyer, Harold F.EconomicsoftheProductMarketsofAgriculture. Iowa State University Press, Ames, IA, 1976.
Caves, Richard. American Industry: Structure, Conduct, Performance. Prentice-Hall, Inc., New York, NY,1972.
Ferrnandez-Cornejo, Jorge, and Richard E. Just. “Researchability of Modern Agricultural Input Markets and Growing Concentration.” American Journal of Agricultural Economics 89 (5), (2007):1269-1275.
Hannaford, Steve. “Oligopoly Watch. The Latest Maneuvers of the New Oligopolies and What They Mean,” http://oligopolywatch.com/2003/08/15.html. March 27, 2007.
Informa Economics. “BargeFleetProfile.” Memphis, TN, various issues.
MacDonald, James M. “Competition and Rail Rates for the Shipment of Corn, Soybeans, and Wheat.” RandJournalofEconomics Spring, (1987):155.
National Research Council. Review of the U.S. Army Corps of Engineers Restructured UpperMississippi– IllinoisRiverWaterwayFeasibilityStudy. National Academics Press, Washington D.C., 2004.
National Research Council. InlandNavigationSystemPlanning.TheUpperMississippiRiver–IllinoisWaterway. National Academy Press, Washington, D.C., 2001.
Pegrum, Dudley F. Transportation: Economics and Public Policy. Richard D. Irwin, Inc., Homewood, IL, 1973.
Sorenson, L. Orlo. “Rail-barge Competition in Transporting Winter Wheat.” American JournalofAgriculturalEconomics December, (1973): 814-819.
Shabman, Leonard A. User Charges for Inland Waterways: A Review of Issues in Policy andEconomicImpact. Virginia Water Resources Center, Blacksburg, VA, 1976.
U.S. Army Corps of Engineers. Rail RatesandtheAvailabilityofWaterTransportation:TheUpperMississippiRiverBasinInterimReport. Rock Island District, St. Louis District, St. Paul District, (no authors listed), September, 1997.
U.S. Department of Justice. “The Herfindahl-Hirschman Index.” http:/usdoj.gov/atr/public/testimony/hhi.htm. July 7, 2007.
U.S. Securities Exchange Commission. “Form 10-K, Annual Report Pursuant to Section 13 or 15(d) of the Securities Exchange Act of 1933 for the Fiscal Year ended December 31, 2007, American Commercial Lines Inc.” File number 000-51562. Washington, D.C. February 27, 2008.
Vachal, Kim, Jill Hough and Gene Griffin. “U.S. Waterway–A Barge Sector Industrial Organization Analysis.” http://www nets.iwr.usace.army mil/docs/IndOrgStudyInlandWaterways/BargeSectorIndusOrg.pdf. March 15, 2005.
Wisner, Robert N., C. Phillip Baumel, Marty McVey and Paul Lasley. “Export History Shows U.S. Viewed as Residual Supplier.” Feedstuffs76(23), January 19, 2004.
Mississippi River System Barge
18
Woolverton, Michael W. “Analysis of Grain Barging Rates and Costs on the Mississippi River.” Dissertation (Ph.D). University of Missouri-Columbia, 1978.
Acknowledgements
The author greatly appreciates the comments and suggestions of two anonymous reviewers and the General Editor, Michael Babcock. Their comments and suggestions vastly improved the quality of this paper. The author also greatly appreciates the data and editing assistance of his wife, Rita, and the editing of Michael Babcock.
C. Phillip Baumel retired from Iowa StateUniversity in 2003.He received the TransportationResearchForum’sDistinguishedTransportationResearcherAwardin1993.HealsoreceivedtheTransportationResearchForum’sOutstandingResearchPaperAwardsin1982,1989and1999,andtheTransportationResearchForum’sBestAgriculturalandRuralTransportationPaperAwardsin 1989, 1991and1995. He is aFellow in theAmericanAgriculturalEconomicsAssociation.Baumelpioneeredtheuseofeconomicnetworkmodelsforanalyzingissuesofagriculturalproducttransportationbyrail,truckandbarge.HecurrentlylivesinIowa(summer)andArizona(winter).