61
Trauma, Natural Disaster, and the Transition to Adulthood
| Date post: | 15-Dec-2015 |
| Category: |
Documents |
| Upload: | savion-athearn |
| View: | 218 times |
| Download: | 1 times |
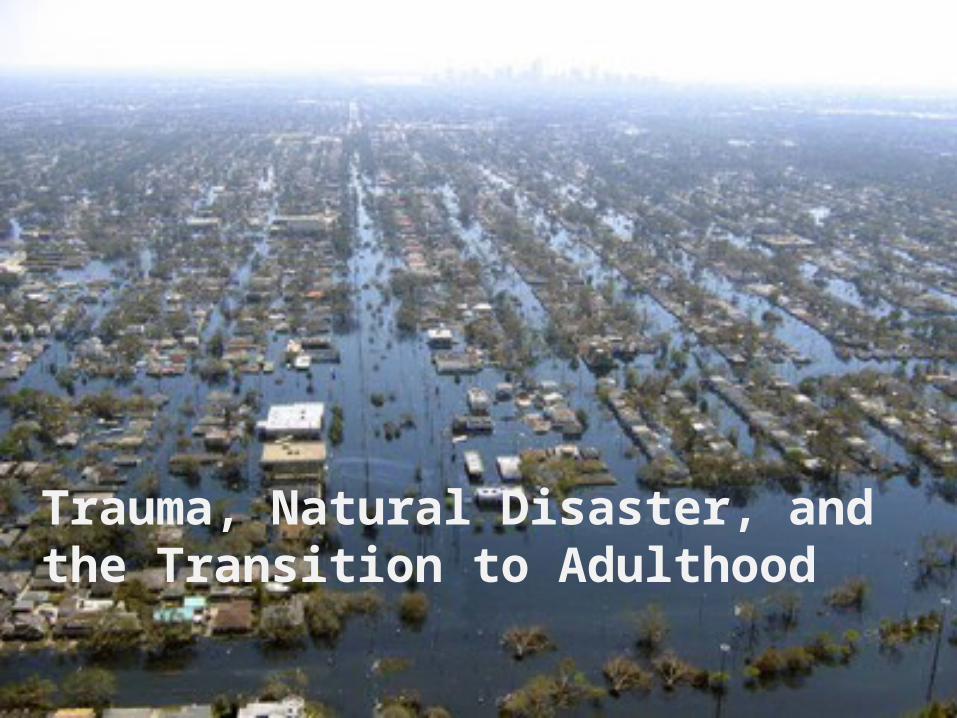
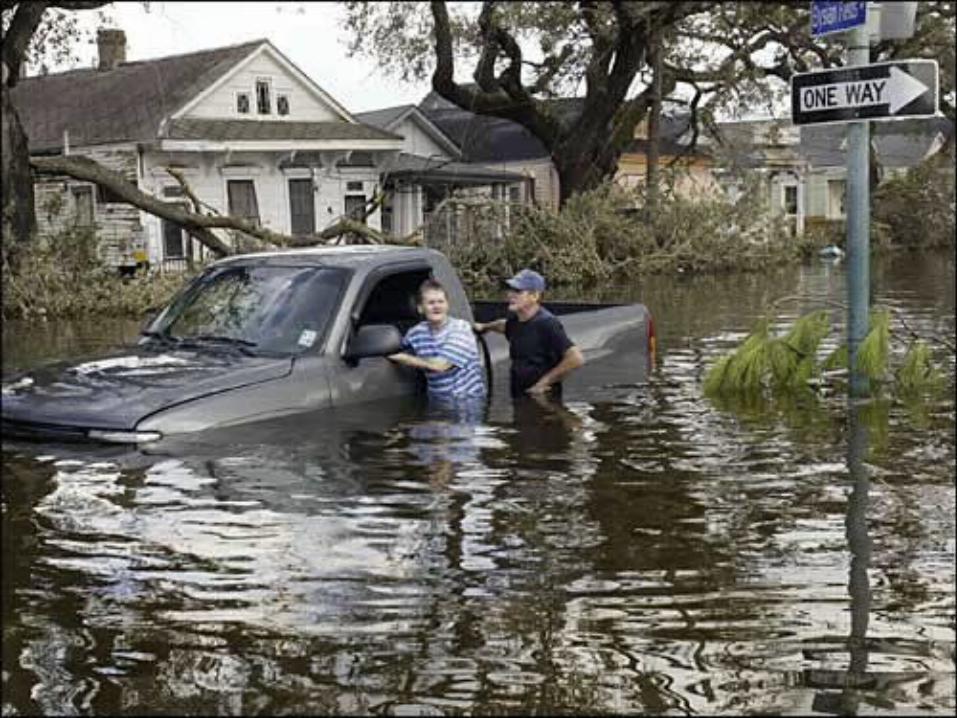
Trauma, Natural Disaster, and the Transition to Adulthood
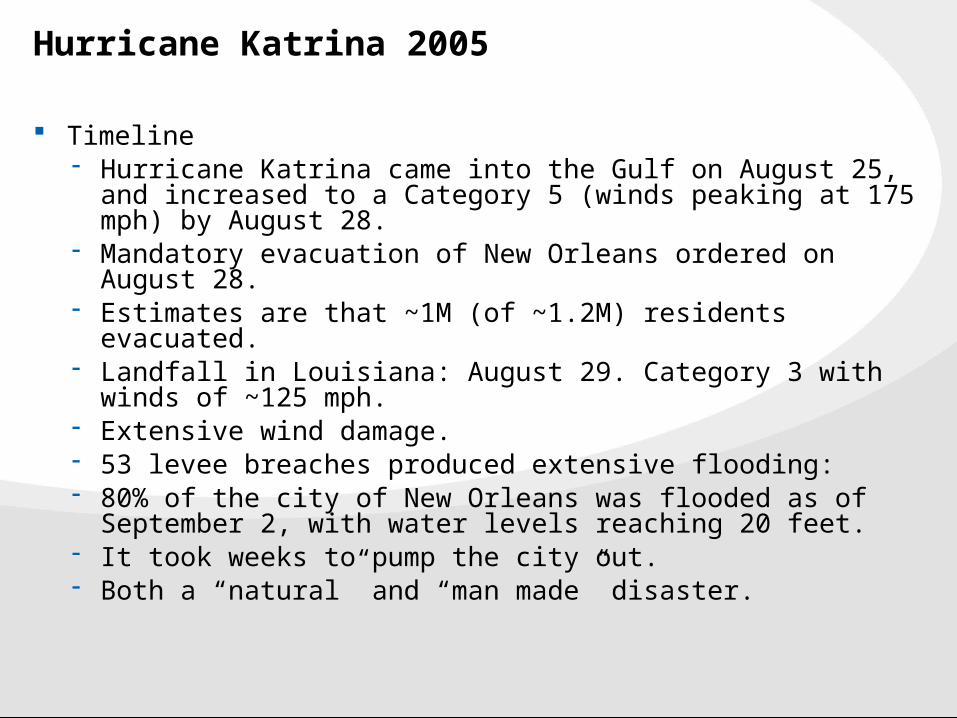
Hurricane Katrina 2005
Timeline- Hurricane Katrina came into the Gulf on August 25, and increased to
a Category 5 (winds peaking at 175 mph) by August 28.- Mandatory evacuation of New Orleans ordered on August 28. - Estimates are that ~1M (of ~1.2M) residents evacuated.- Landfall in Louisiana: August 29. Category 3 with winds of ~125 mph.- Extensive wind damage.- 53 levee breaches produced extensive flooding: - 80% of the city of New Orleans was flooded as of September 2, with
water levels reaching 20 feet.- It took weeks to pump the city out. - Both a “natural” and “man made” disaster.
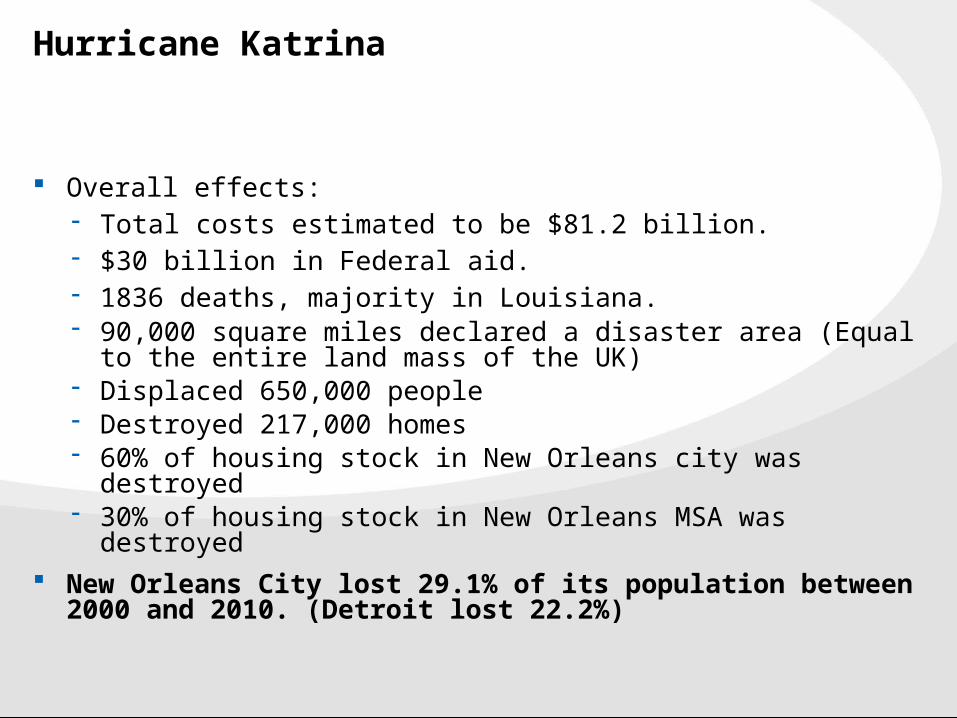
Hurricane Katrina
Overall effects:- Total costs estimated to be $81.2 billion.- $30 billion in Federal aid.- 1836 deaths, majority in Louisiana.- 90,000 square miles declared a disaster area (Equal to the entire land
mass of the UK)- Displaced 650,000 people- Destroyed 217,000 homes- 60% of housing stock in New Orleans city was destroyed- 30% of housing stock in New Orleans MSA was destroyed
New Orleans City lost 29.1% of its population between 2000 and 2010. (Detroit lost 22.2%)
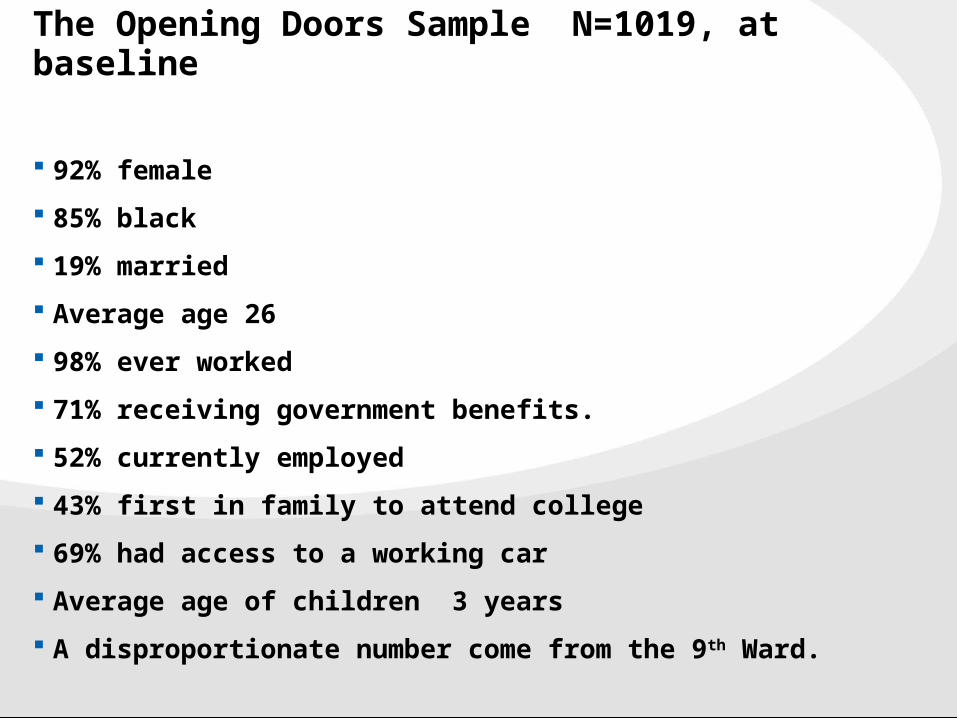
The Opening Doors Sample N=1019, at baseline
92% female
85% black
19% married
Average age 26
98% ever worked
71% receiving government benefits.
52% currently employed
43% first in family to attend college
69% had access to a working car
Average age of children 3 years
A disproportionate number come from the 9th Ward.
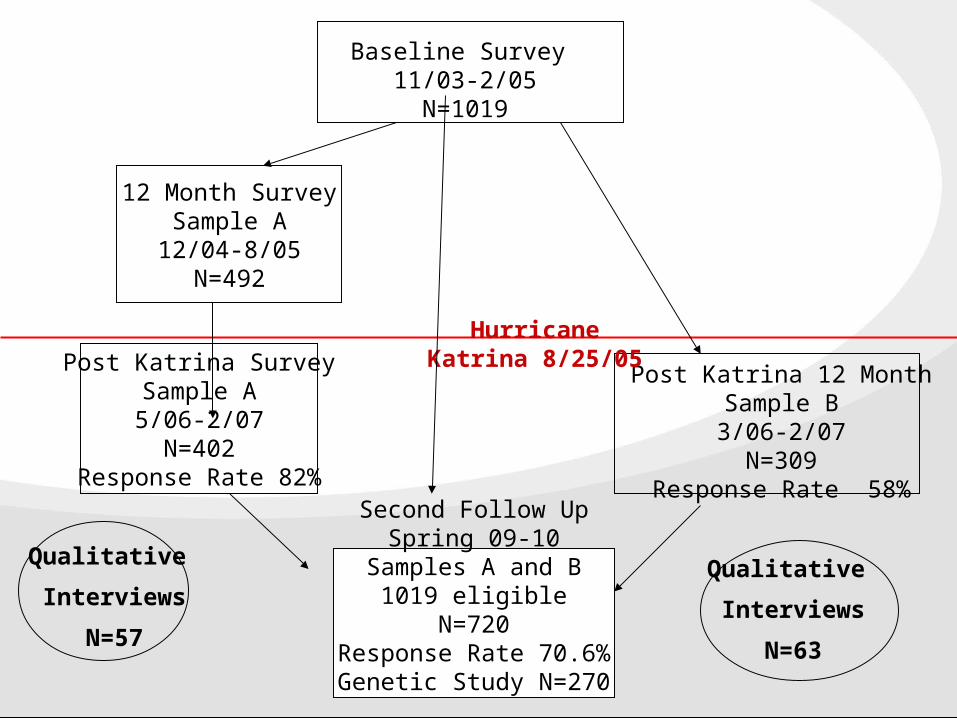
12 Month SurveySample A12/04-8/05
N=492
Baseline Survey 11/03-2/05
N=1019
Post Katrina SurveySample A5/06-2/07
N=402Response Rate 82%
Post Katrina 12 MonthSample B3/06-2/07
N=309Response Rate 58%
Hurricane Katrina 8/25/05
Second Follow UpSpring 09-10
Samples A and B1019 eligible
N=720Response Rate 70.6%Genetic Study N=270
Qualitative
Interviews
N=57
Qualitative
Interviews
N=63
Qualitative Interviews N=120
First Wave Conducted after the 2006-2007 survey and linked to survey responses (57 interviews)
Second Wave Conducted after the 2009-2010 survey and linked to survey and previous qualitative responses. (63 interviews)
Equal number of people who were back in New Orleans, and who had relocated to Texas.
Covered Hurricane Experiences, life history, politics, intergroup relations, experiences of young adulthood, and questions about how their children are doing.
Transcribed and coded using Atlas Ti.
Interviews were linked to the longitudinal survey data to contextualize the interviews and to give a rich understanding of the trajectories of individuals.
Advantages of Our Sample
Most studies of disasters do not have data on people before the disaster. We had two waves of data on Sample A and one wave on Sample B before the hurricane. Our data included - physical and mental health- economic resources - social support- social trust- future aspirations and expectations- measures such as optimism, self esteem, confidence
Disasters have unequal impacts, generally exacerbating inequality and differentially affecting women, the poor, and racial minorities
The scope of Katrina makes it a very unusual and important disaster
Disasters are seldom studied longitudinally. We really do not know a lot about long term recovery.
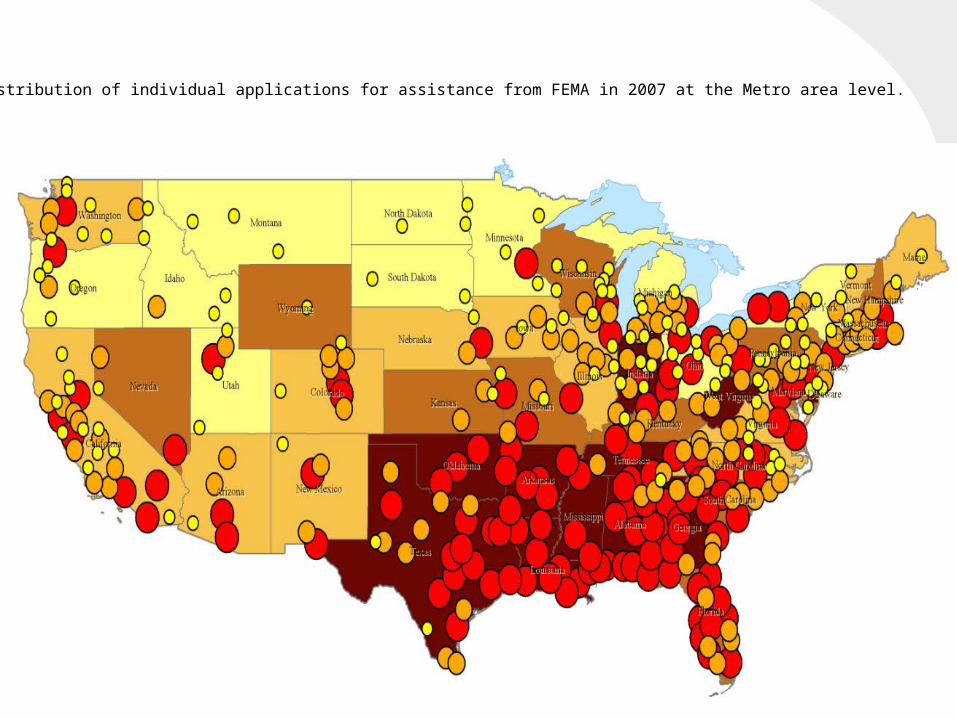
Distribution of individual applications for assistance from FEMA in 2007 at the Metro area level.
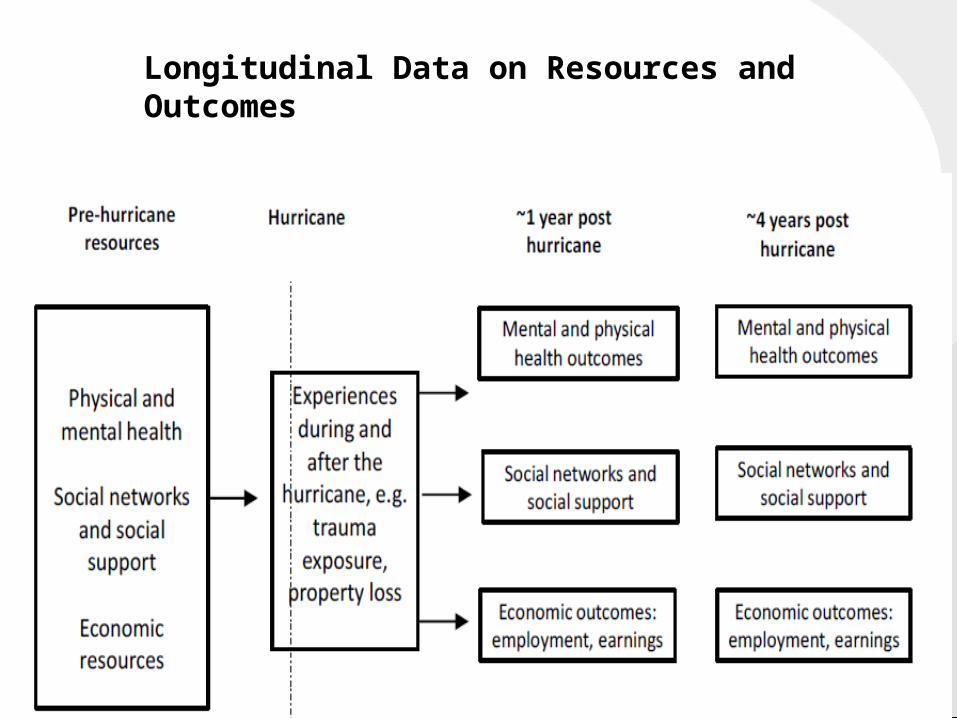
Longitudinal Data on Resources and Outcomes
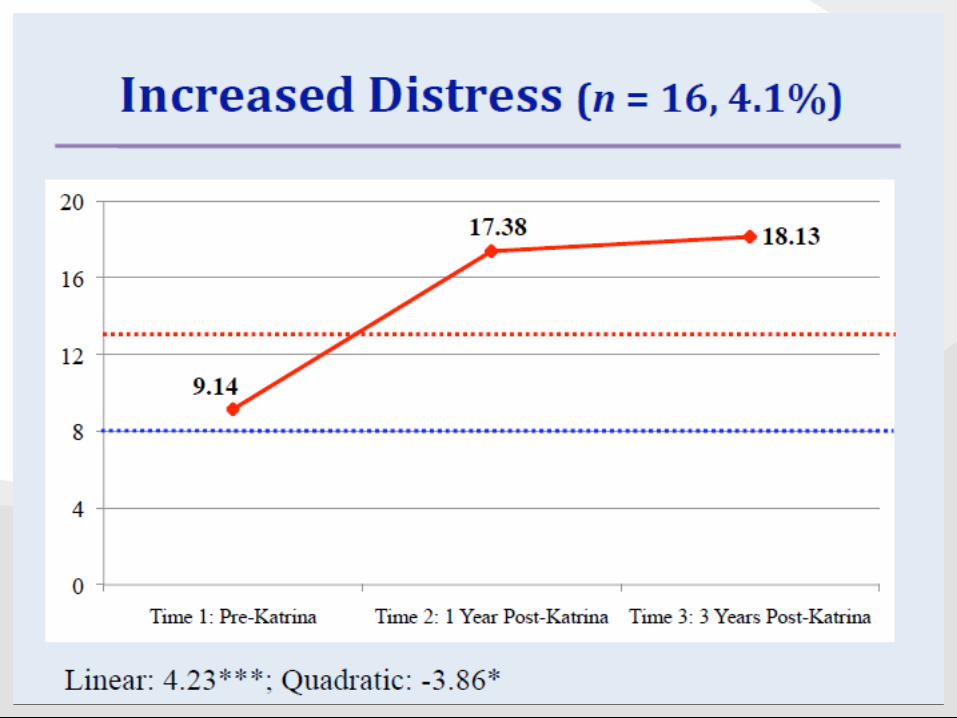
The Overall Picture
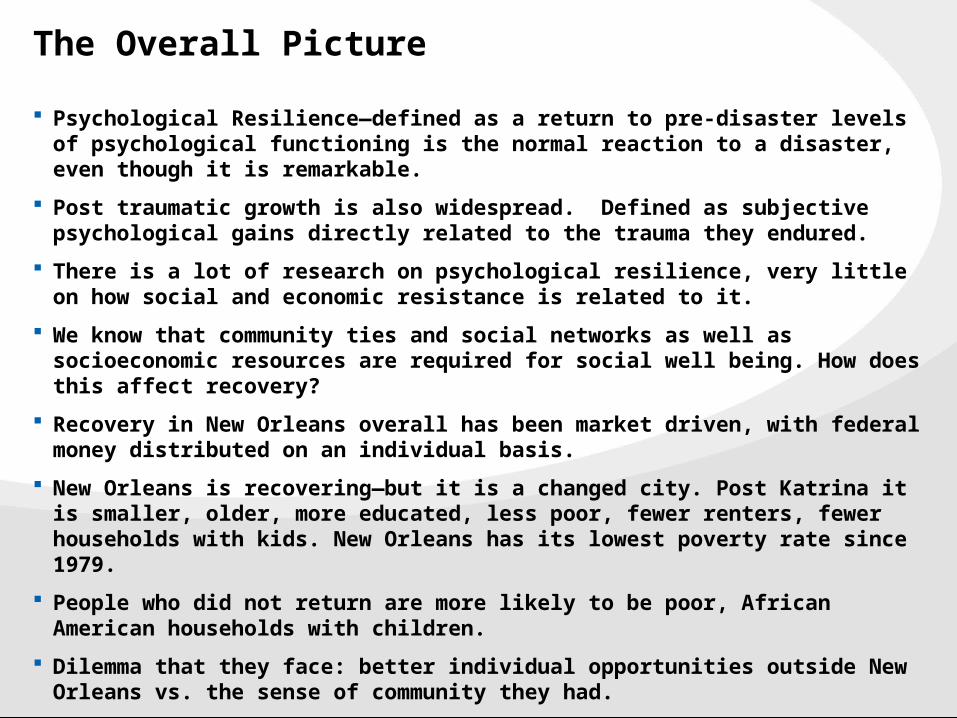
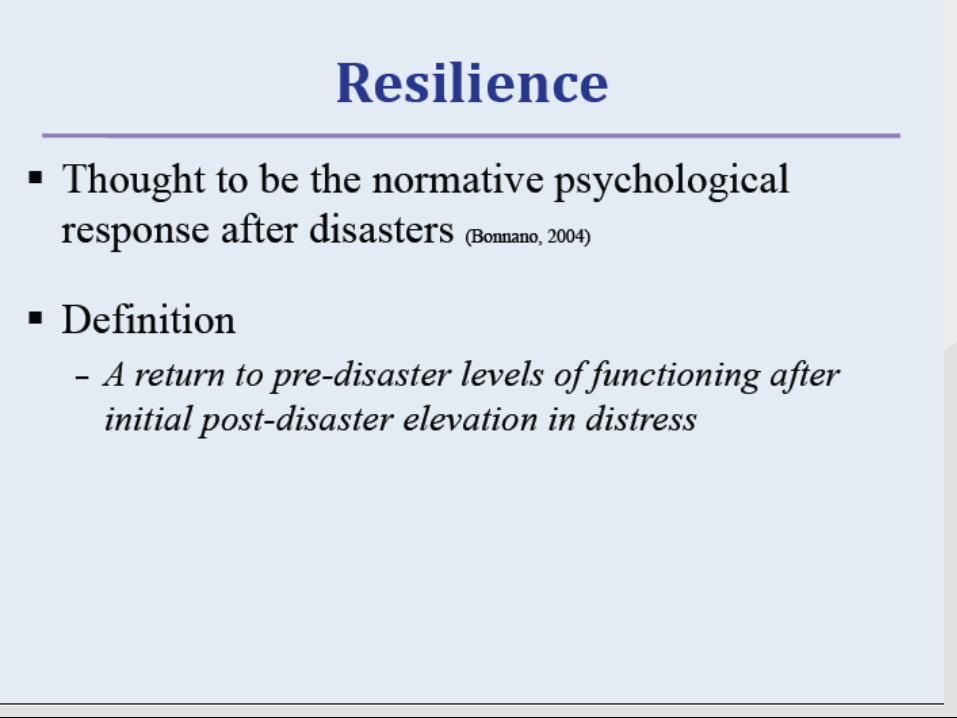
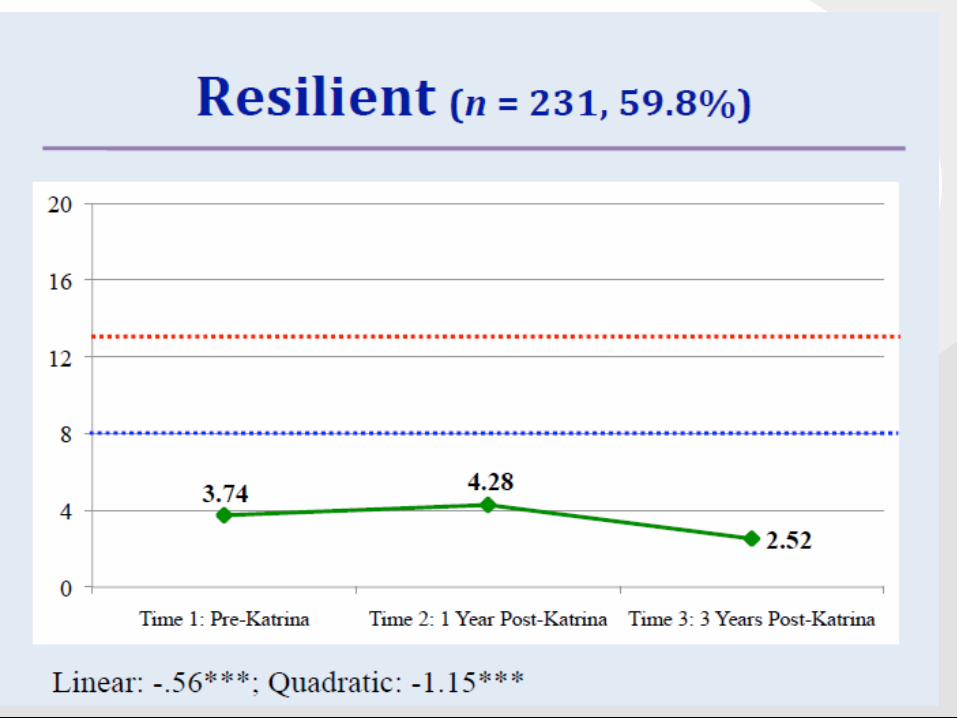
Psychological Resilience—defined as a return to pre-disaster levels of psychological functioning is the normal reaction to a disaster, even though it is remarkable.
Post traumatic growth is also widespread. Defined as subjective psychological gains directly related to the trauma they endured.
There is a lot of research on psychological resilience, very little on how social and economic resistance is related to it.
We know that community ties and social networks as well as socioeconomic resources are required for social well being. How does this affect recovery?
Recovery in New Orleans overall has been market driven, with federal money distributed on an individual basis.
New Orleans is recovering—but it is a changed city. Post Katrina it is smaller, older, more educated, less poor, fewer renters, fewer households with kids. New Orleans has its lowest poverty rate since 1979.
People who did not return are more likely to be poor, African American households with children.
Dilemma that they face: better individual opportunities outside New Orleans vs. the sense of community they had.
A false dilemma?
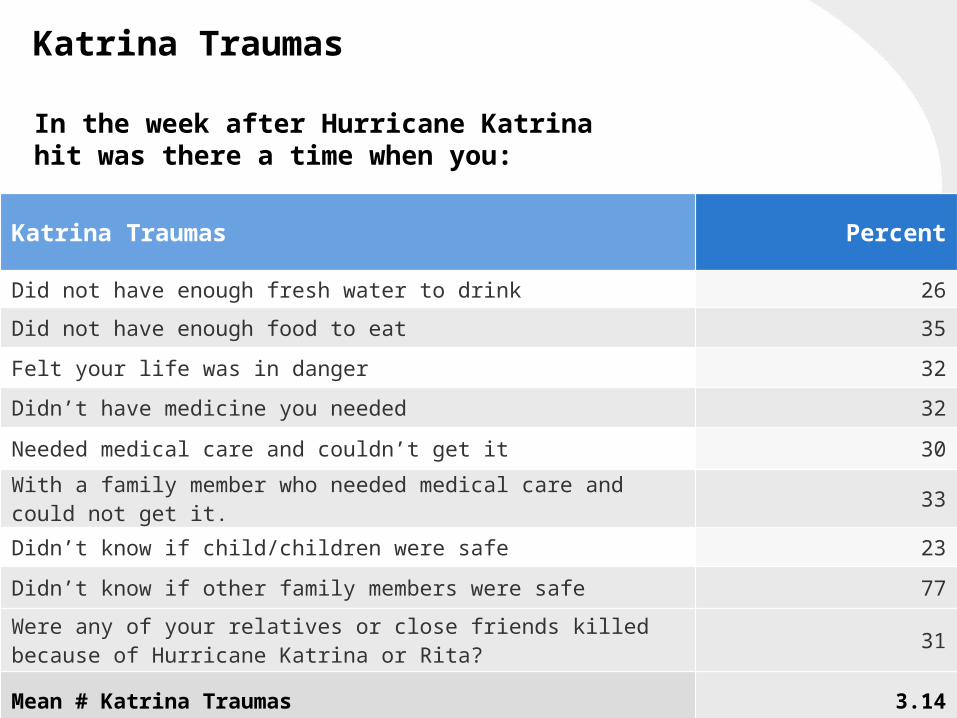
Katrina Traumas
In the week after Hurricane Katrina hit was there a time when you:
Katrina Traumas Percent
Did not have enough fresh water to drink 26
Did not have enough food to eat 35
Felt your life was in danger 32
Didn’t have medicine you needed 32
Needed medical care and couldn’t get it 30
With a family member who needed medical care and could not get it. 33
Didn’t know if child/children were safe 23
Didn’t know if other family members were safe 77
Were any of your relatives or close friends killed because of Hurricane Katrina or Rita? 31
Mean # Katrina Traumas 3.14
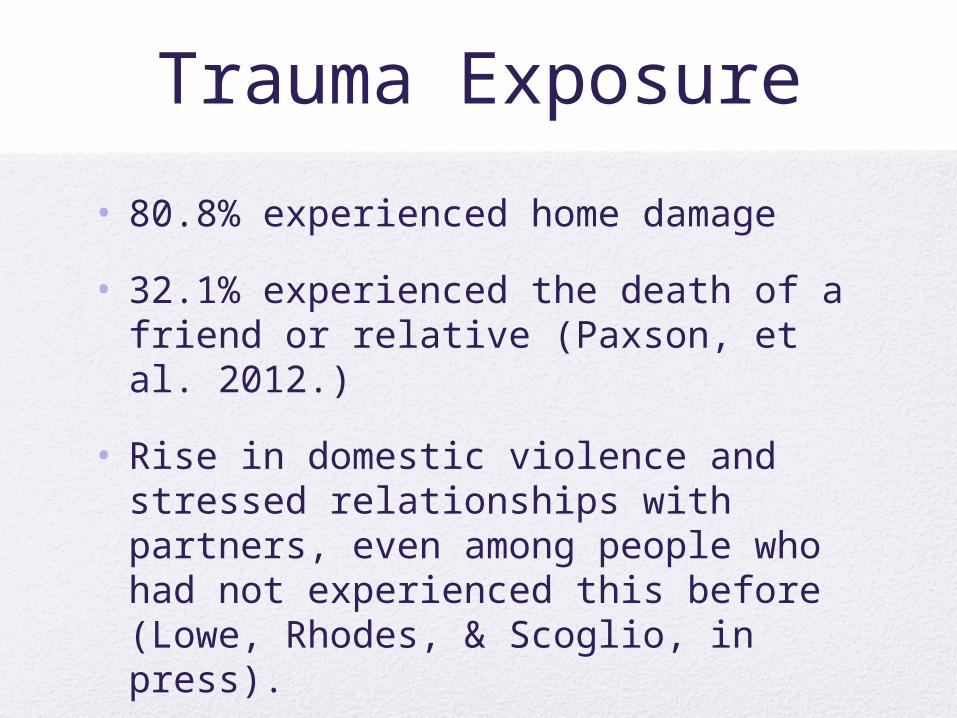
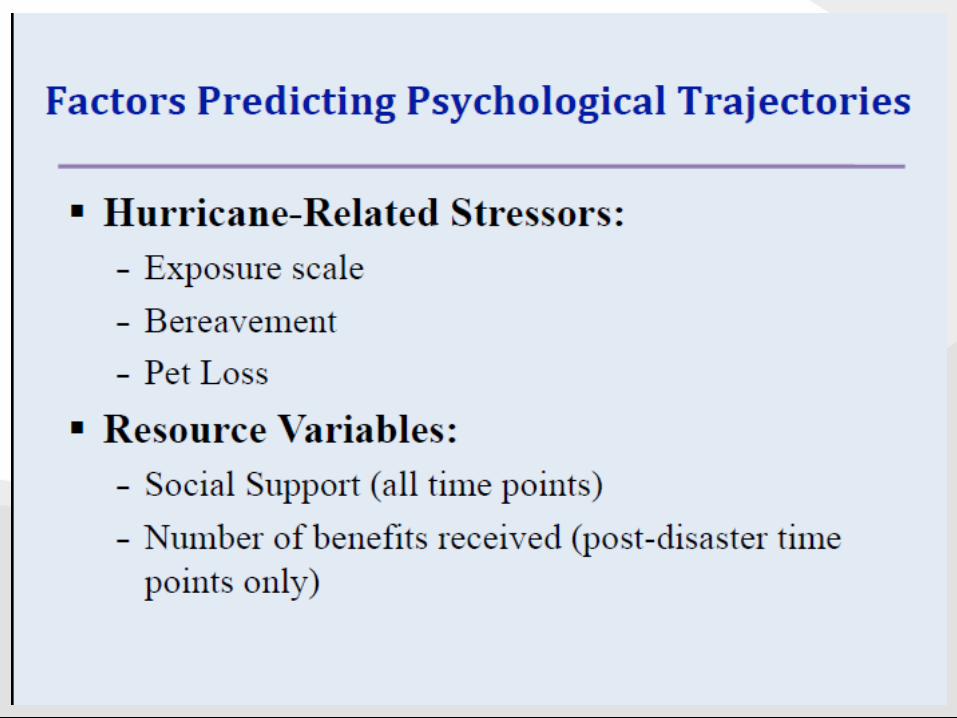
Trauma Exposure
• 80.8% experienced home damage
• 32.1% experienced the death of a friend or relative (Paxson, et al. 2012.)
• Rise in domestic violence and stressed relationships with partners, even among people who had not experienced this before (Lowe, Rhodes, & Scoglio, in press).
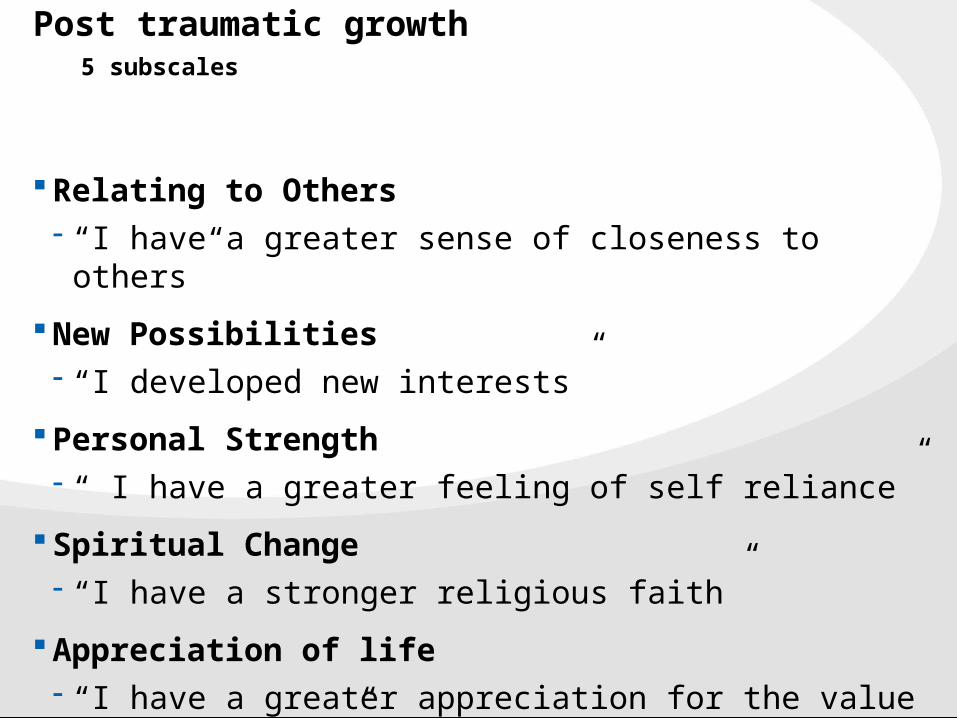
Post traumatic growth5 subscales
Relating to Others- “I have a greater sense of closeness to others”
New Possibilities- “I developed new interests”
Personal Strength- “ I have a greater feeling of self reliance”
Spiritual Change- “I have a stronger religious faith”
Appreciation of life- “I have a greater appreciation for the value of my own life”
Post-traumatic growth
• PTG was found to be strongly positively associated with symptoms of PTSD • Only those participants with high levels
of PTSD at both time points maintained high levels of PTG over time (Lowe, Manove, & Rhodes, 2012).
Religion and PTG
• Pre-disaster religious involvement and faith were predictive of better post-disaster social resources which, in turn, were associated with lower levels of psychological distress (Chan, Perez, & Rhodes, 2010).
• Religious coping affected post-hurricane outcomes (Chan, Perez, & Rhodes, 2012).
Child Functioning
• Concerns about child welfare affected maternal mental health (Lowe, Chan, & Rhodes 2011).
• There were strong associations between child externalizing and internalizing symptoms and maternal psychological functioning (Lowe, Godoy, Carter, & Rhodes, 2012).

Post traumatic growth5 subscales
Relating to Others- “I have a greater sense of closeness to others”
New Possibilities- “I developed new interests”
Personal Strength- “ I have a greater feeling of self reliance”
Spiritual Change- “I have a stronger religious faith”
Appreciation of life- “I have a greater appreciation for the value of my own life”
Post-traumatic growth
PTG was found to be strongly positively associated with symptoms of PTSD - Only those participants with high levels of PTSD at both time points maintained
high levels of PTG over time (Lowe, Manove, & Rhodes, 2012).
Other Findings
Most people report personal and spiritual growth from the experience. Those who blamed God or who thought that God was punishing them were the most psychologically distressed four years later.
For people with low social support at baseline, pet loss was the most significant predictor of psychological distress, and for many it was long lasting.
People who had high Psychological Distress at baseline significantly overestimated flood depths, relative to geocoded data.
Optimism was one of the best predictors of who did not evacuate.

Studies to Date
College Re-enrollment
Pet Loss
Pre-disaster social support
Child-related stressors
Natural mentors
Intimate relationships
Interviewer race
Decisions to evacuate
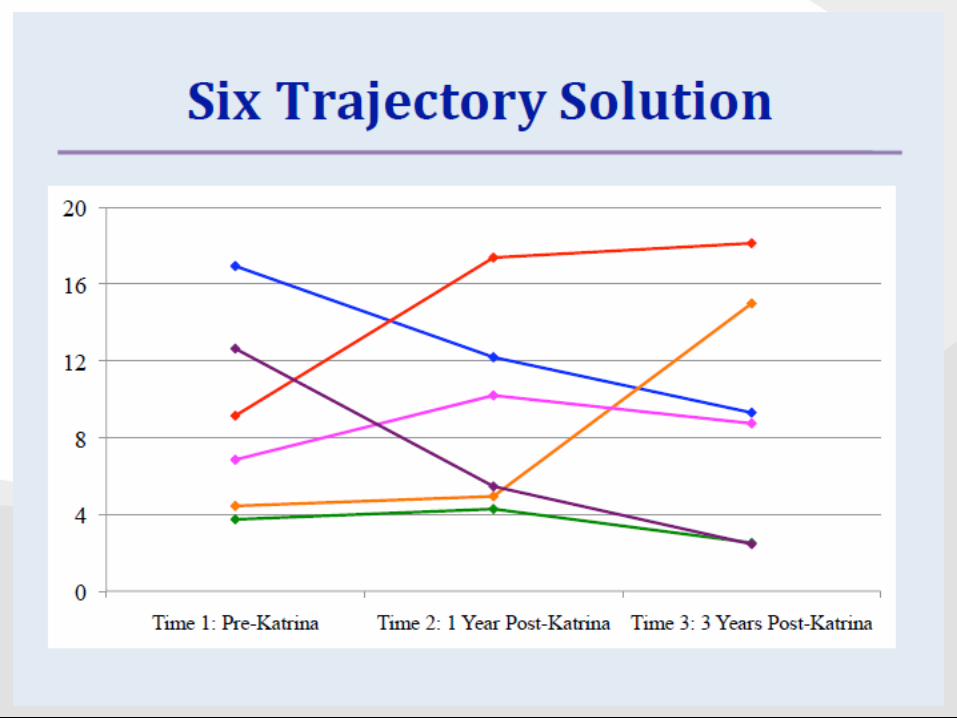
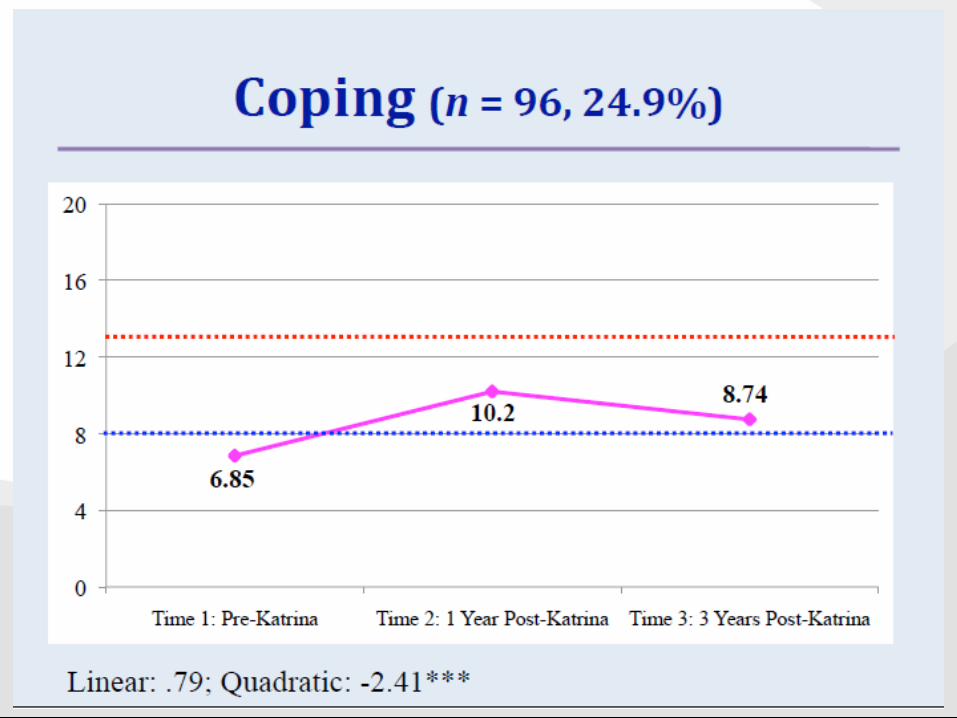
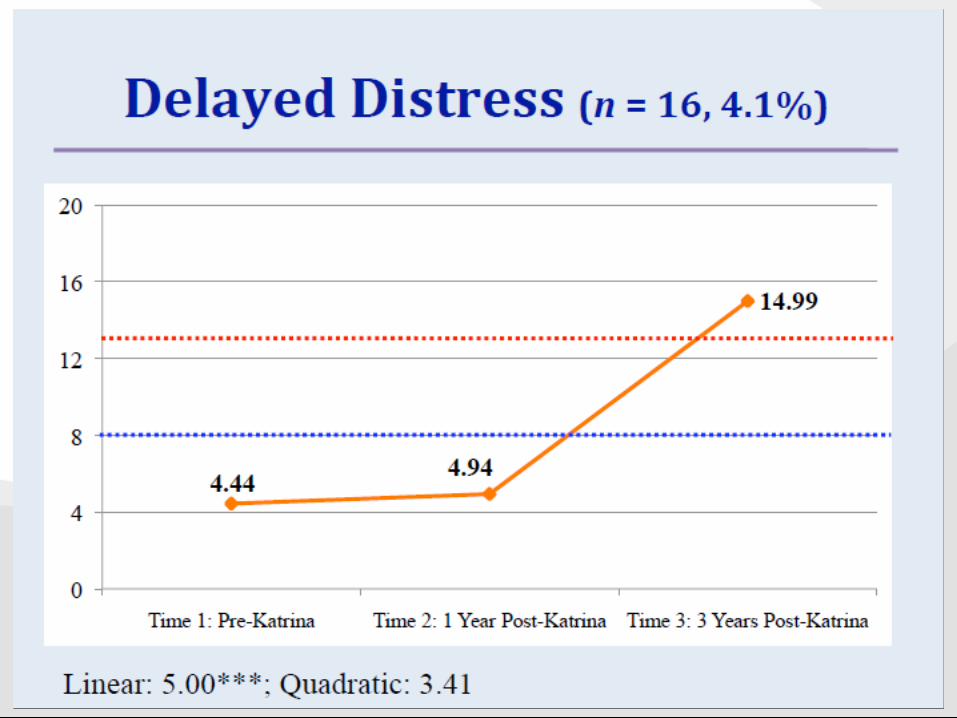
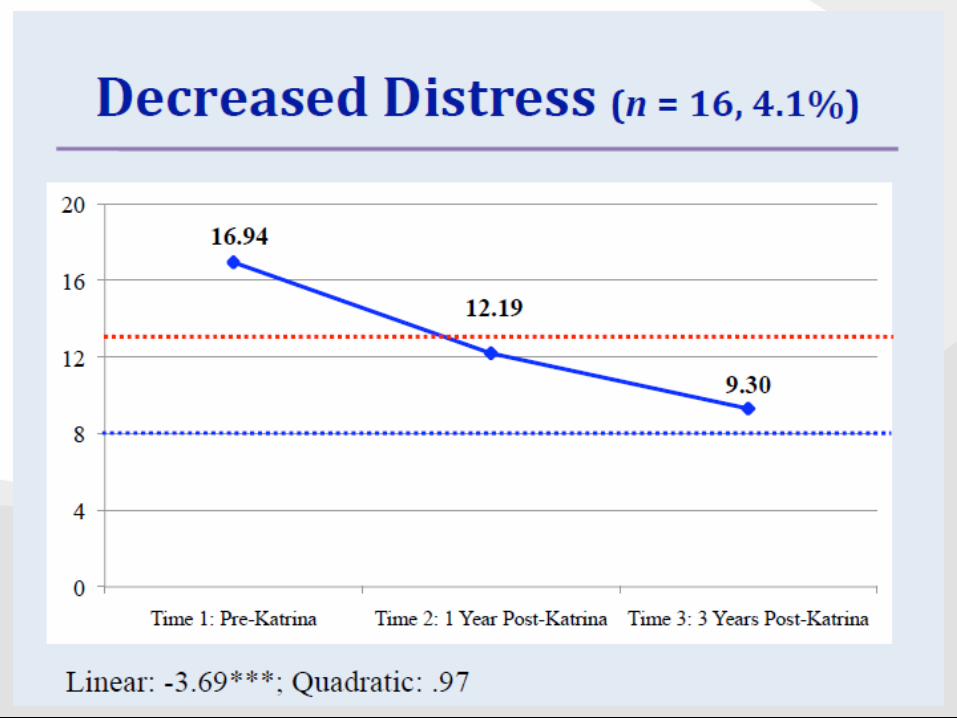
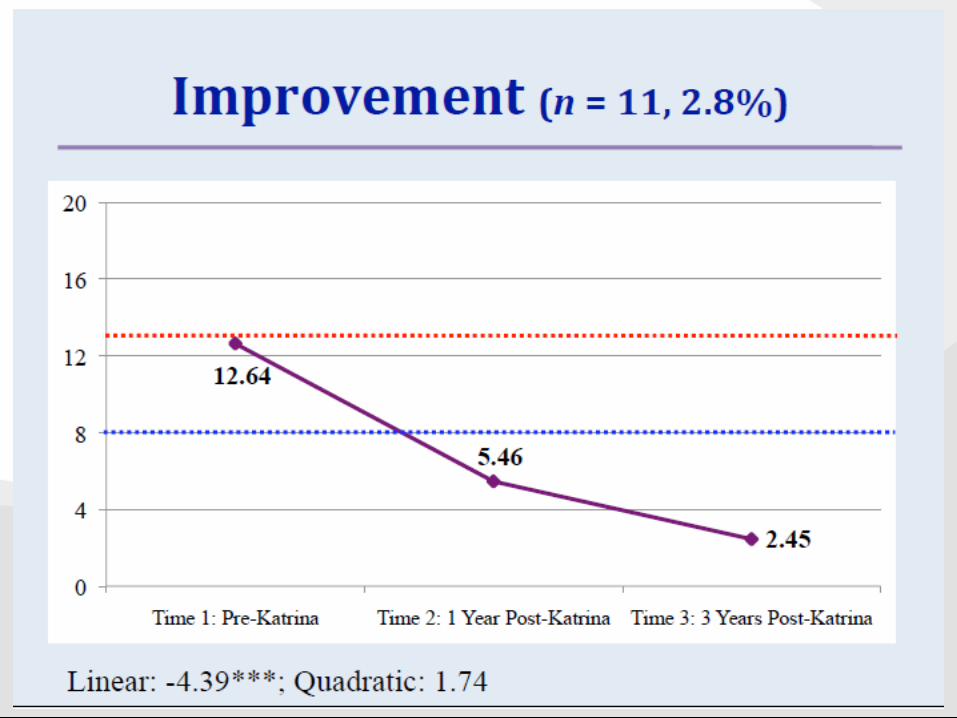
Resilience Trajectories
Children’s Functioning
Combining Quantitative and Qualitative Methods
Religion
Barriers to Community College Completion
Geographic Mobility
Relocation Decision Making
Neighborhood Attainment
Employment Trajectories
Changes in BMI
Post Traumatic Growth
Conservation of Resources Theory
Transition to Adulthood
Current studies
• Exposure meta-analysis
• PTG as a personality construct
• Disaster and Health (BMI)
• Legal issues, housing, etc.
• Community College students
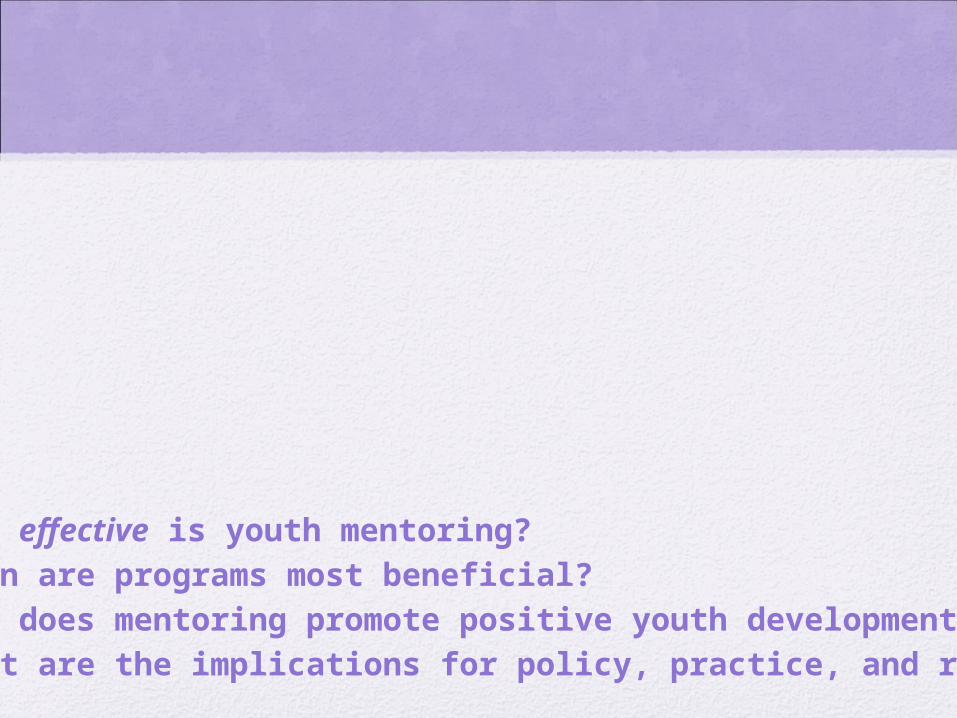
How effective is youth mentoring? When are programs most beneficial? How does mentoring promote positive youth
development? What are the implications for policy, practice, and
research?
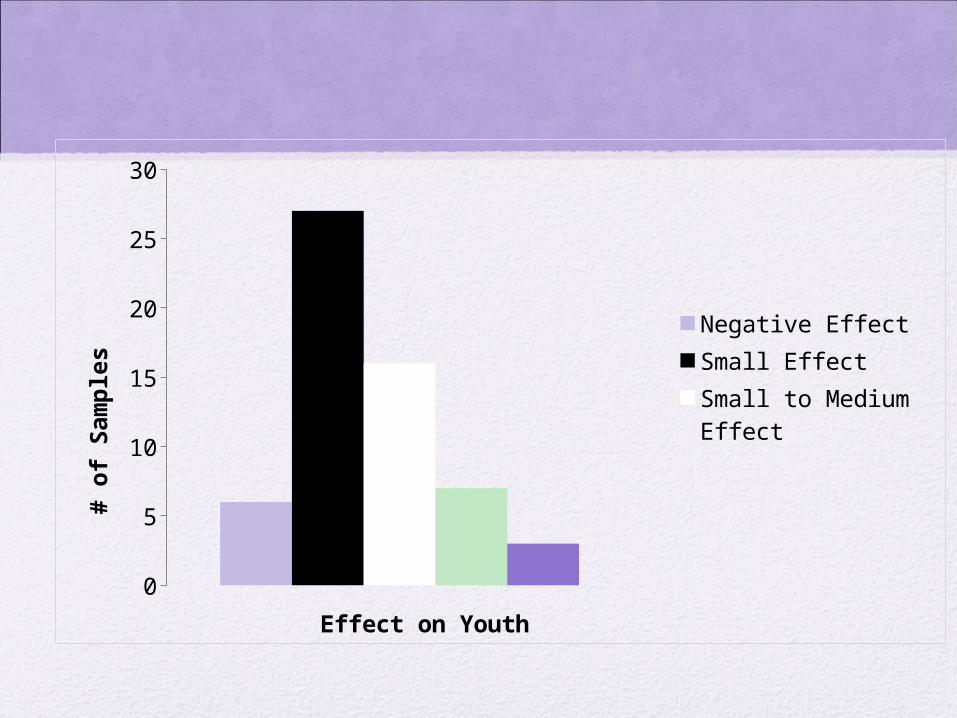
0
5
10
15
20
25
30
Negative Effect
Small Effect
Small to Medium Ef-fect
Effect on Youth
# o
f S
am
ple
s
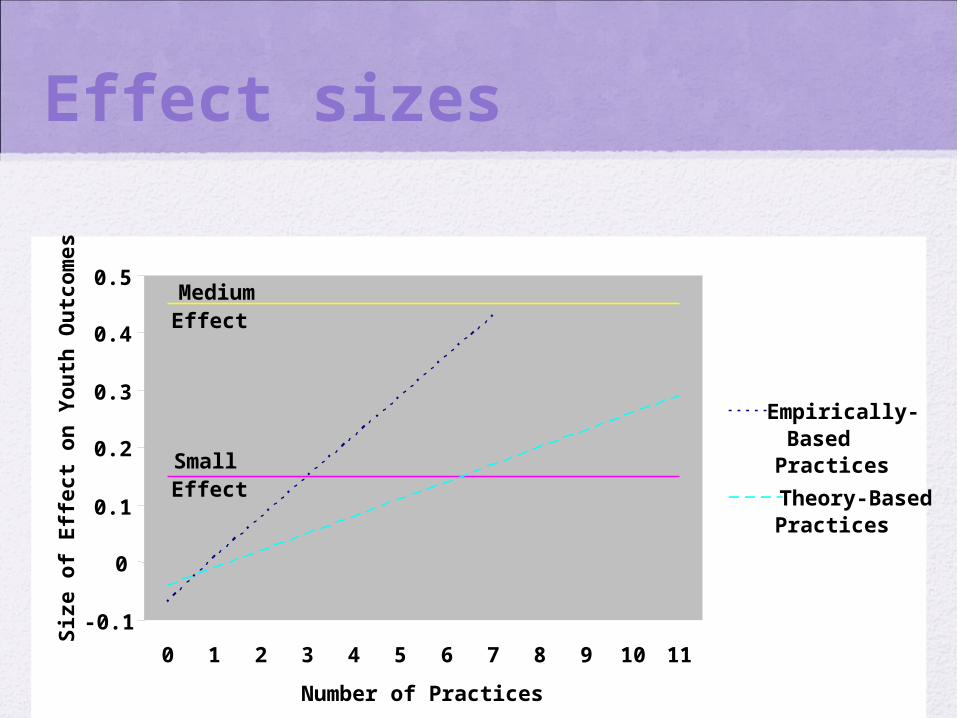
-0.1
0
0.1
0.2
0.3
0.4
0.5
0 1 2 3 4 5 6 7 8 9 10 11
Number of Practices
Siz
e o
f Eff
ect
on
You
th O
utc
om
es
Empirically-BasedPractices
Theory-BasedPractices
Small Effect
Medium Effect
Effect sizes
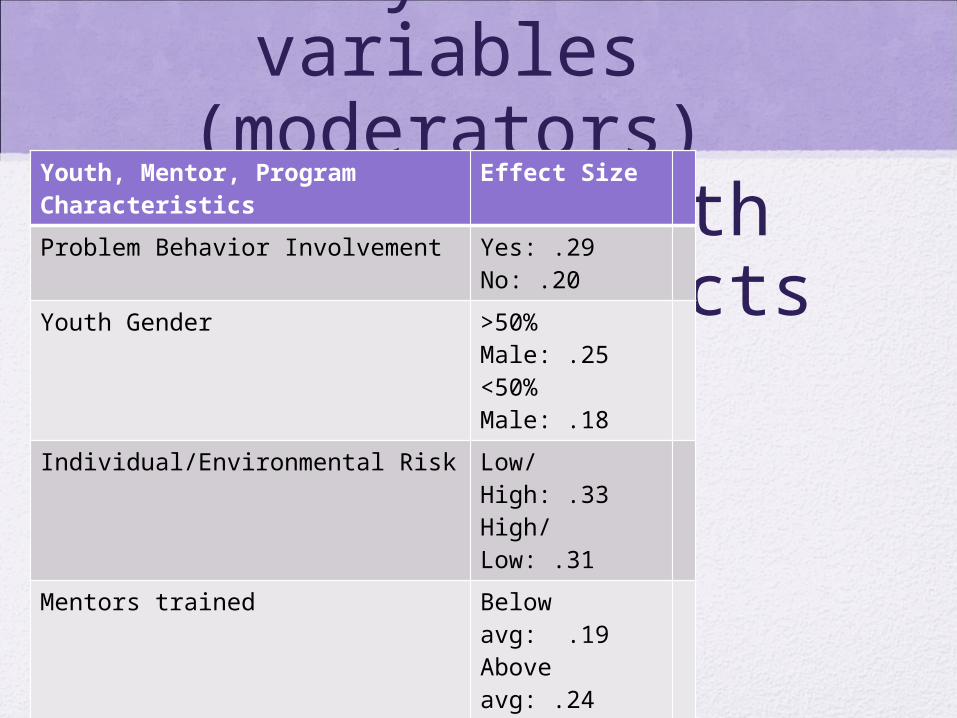
Study level variables (moderators)
associated with different effects
Youth, Mentor, Program Characteristics
Effect Size
Problem Behavior Involvement Yes: .29No: .20
Youth Gender >50% Male: .25<50% Male: .18
Individual/Environmental Risk Low/High: .33High/Low: .31
Mentors trained Below avg: .19Above avg: .24
Mentor role function: Advocacy Yes: .26No: .20
Matching based on shared interests
Yes: .44!!!No: .21
How effective is youth mentoring? When are programs most beneficial? How does mentoring promote positive youth development? What are the implications for policy, practice, and research?
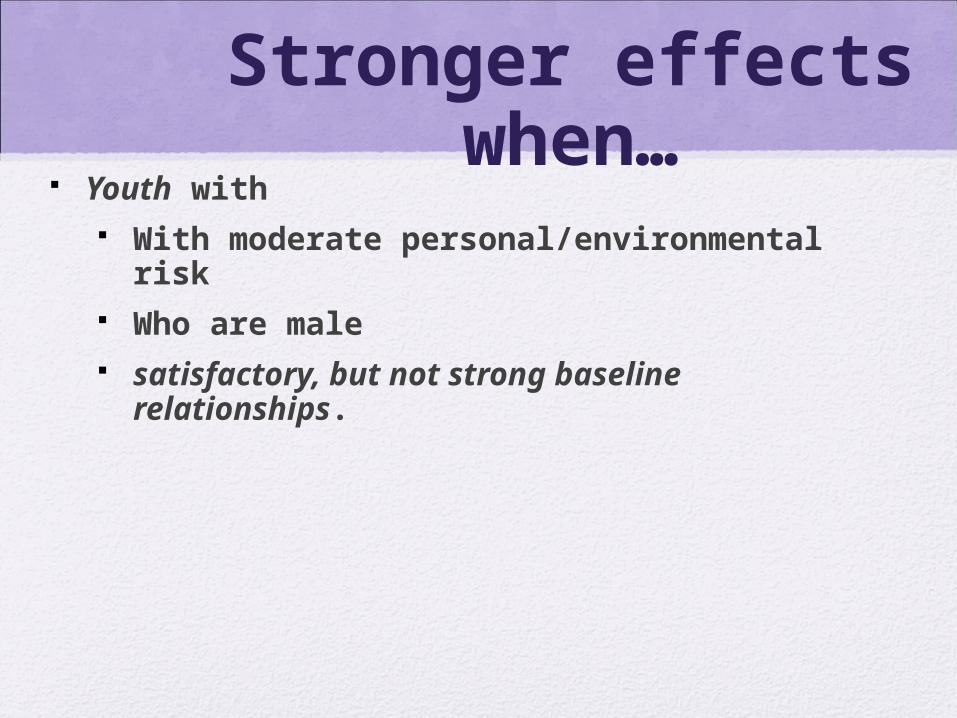
Stronger effects when…
Youth with With moderate
personal/environmental risk Who are male satisfactory, but not strong baseline
relationships.
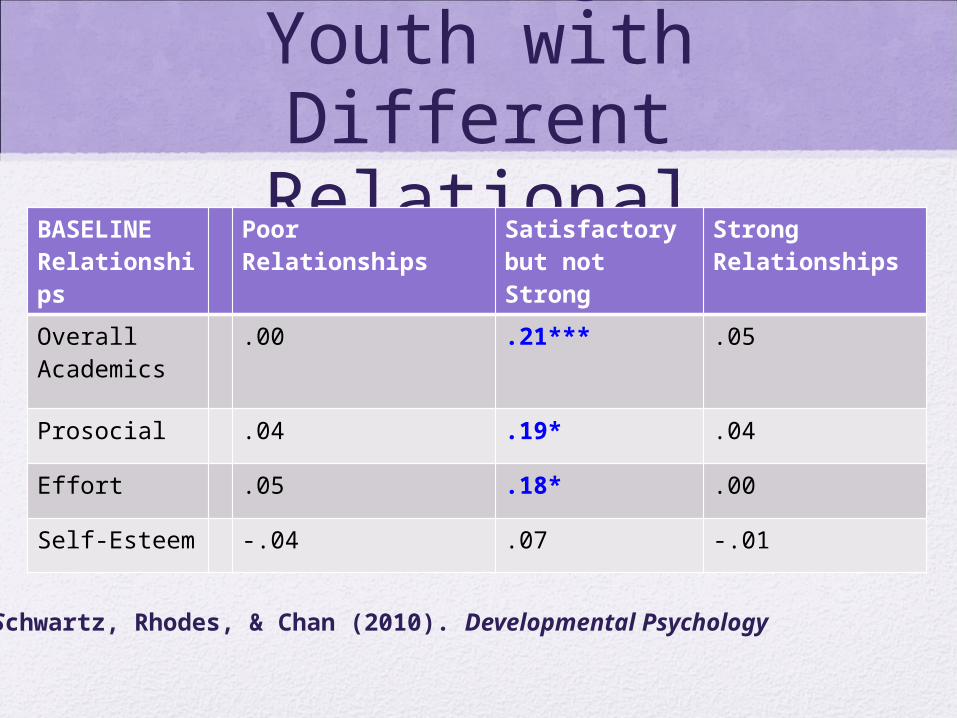
Effects of Mentoring on Youth with
Different Relational ProfilesBASELINE
Relationships
Poor Relationships
Satisfactory but not Strong
Strong Relationships
Overall Academics
.00 .21*** .05
Prosocial .04 .19* .04
Effort .05 .18* .00
Self-Esteem -.04 .07 -.01
(Schwartz, Rhodes, & Chan (2010). Developmental Psychology
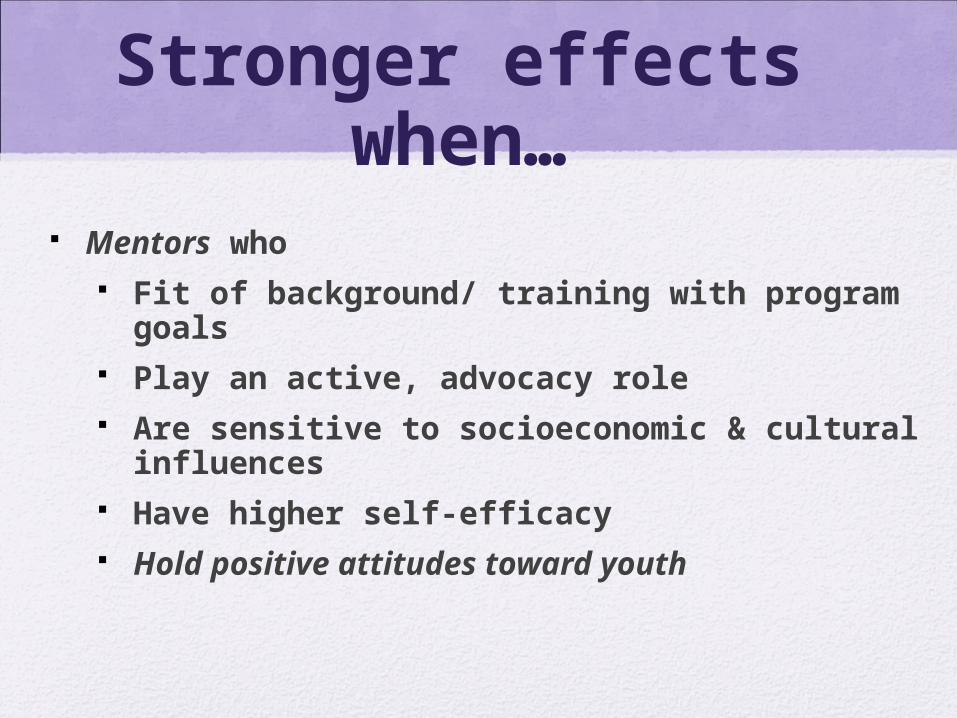
Stronger effects when…
Mentors who Fit of background/ training with program
goals Play an active, advocacy role Are sensitive to socioeconomic & cultural
influences Have higher self-efficacy Hold positive attitudes toward youth
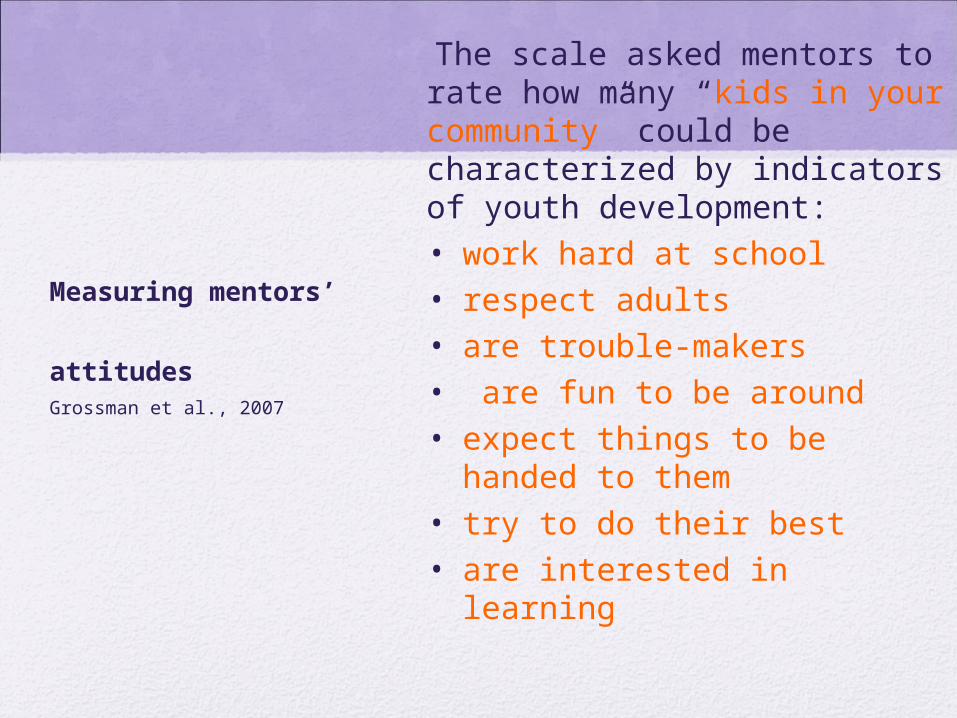
Measuring mentors’
attitudes
• The scale asked mentors to rate how many “kids in your community” could be characterized by indicators of youth development: • work hard at school• respect adults • are trouble-makers• are fun to be around• expect things to be handed to
them• try to do their best• are interested in learning
Grossman et al., 2007
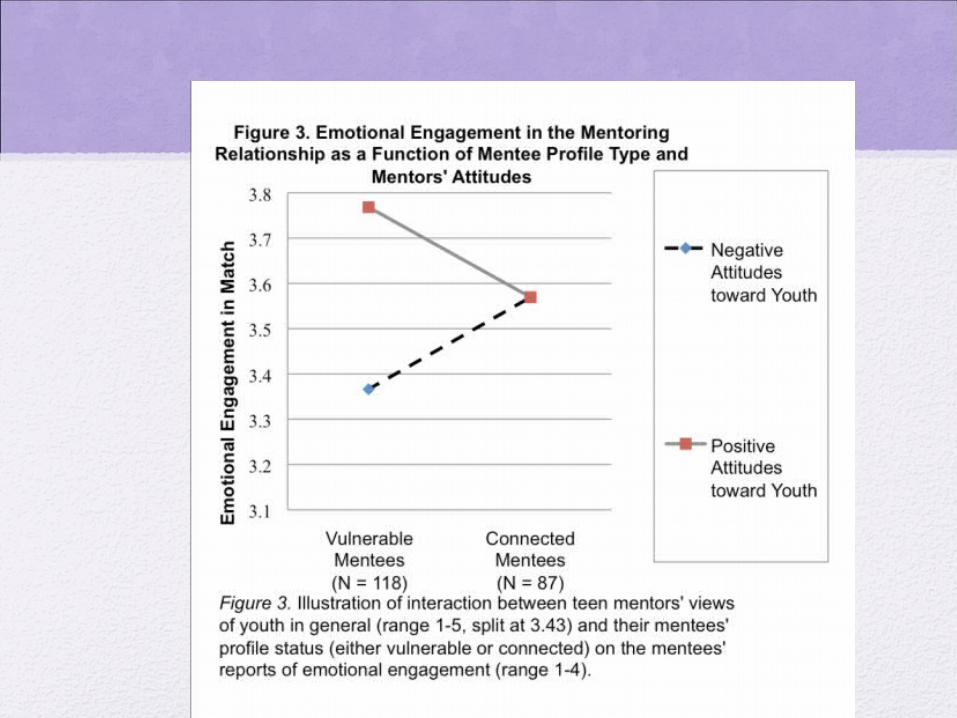
Mentor attitudes and
youth outcomes
• Mentees who were paired with high school mentors with positive attitudes about youth were more emotionally engaged with mentor than those paired with more negative mentors
• Those who were paired with mentors with negative attitudes about youth were less emotionally engaged with and showed some negative outcomes.
Karcher, Rhodes, Herrera, & Davidson (2010). Applied Developmental Science
Stronger effects when… Relationships characterized by
consistency closeness structure appropriate meeting times duration
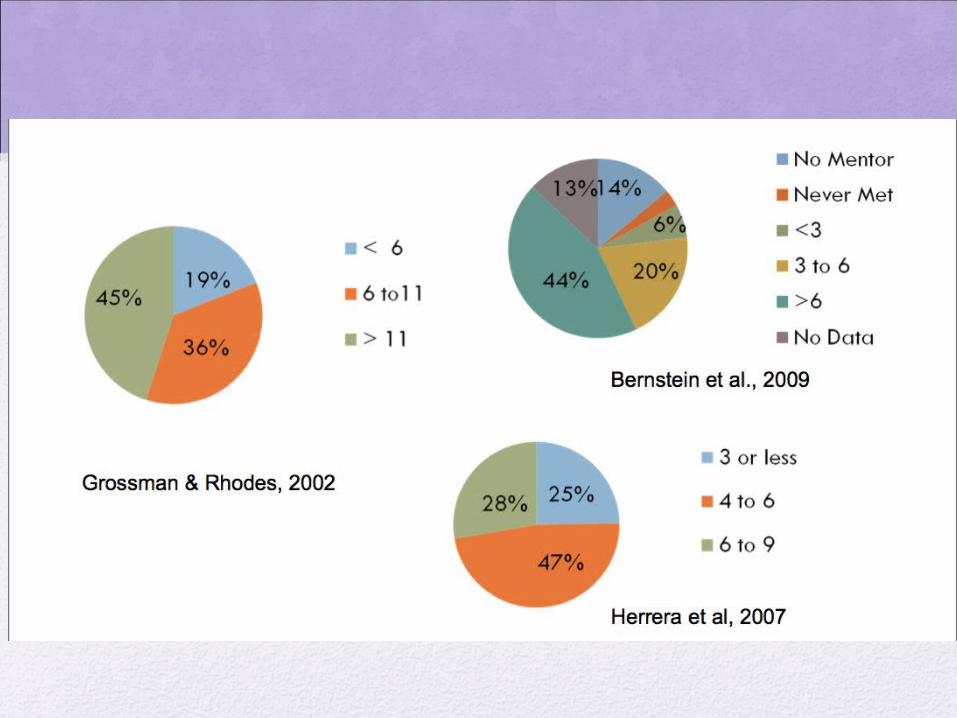
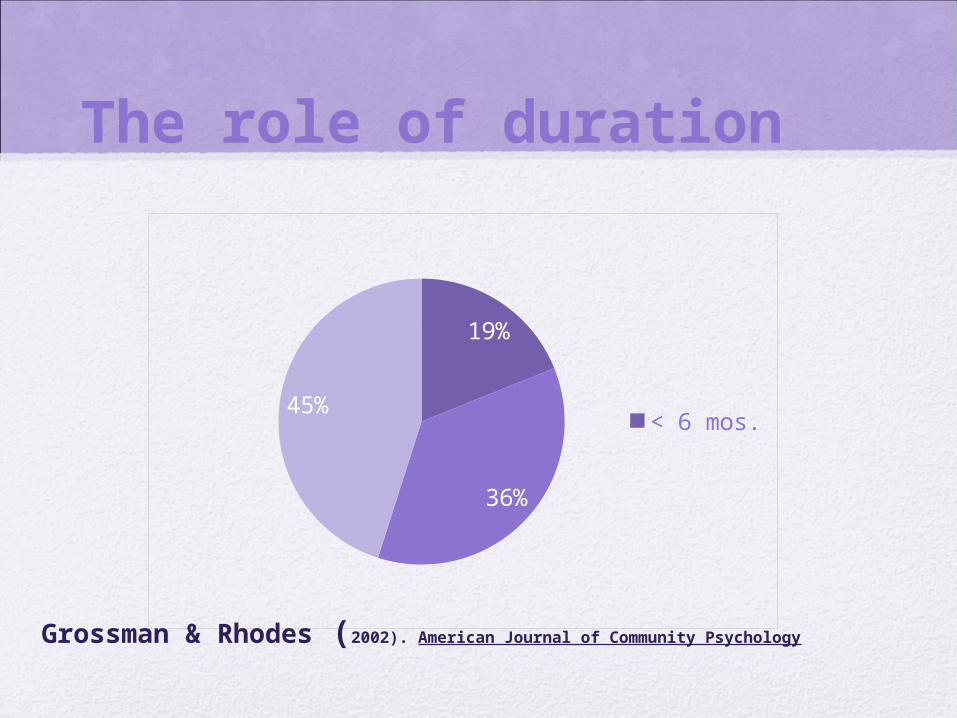
19%
36%
45%< 6 mos.
The role of duration
Grossman & Rhodes (2002). American Journal of Community Psychology
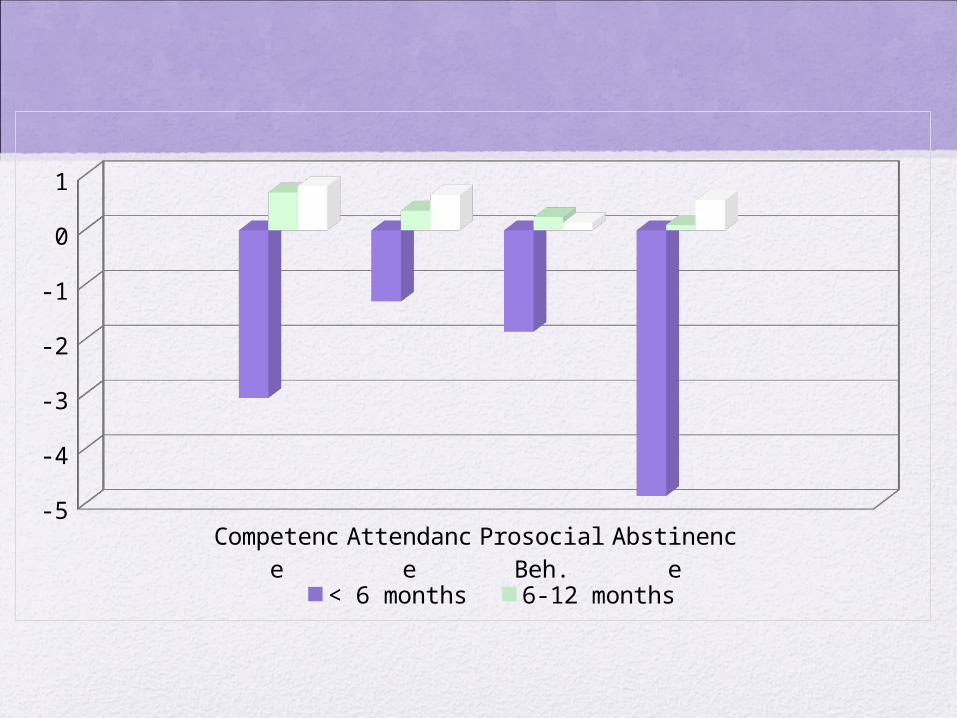
Compe-tence
At-ten-
dance
Prosocial Beh.
Ab-sti-
nence
-5
-4
-3
-2
-1
0
1
< 6 months 6-12 months
Re-matching?
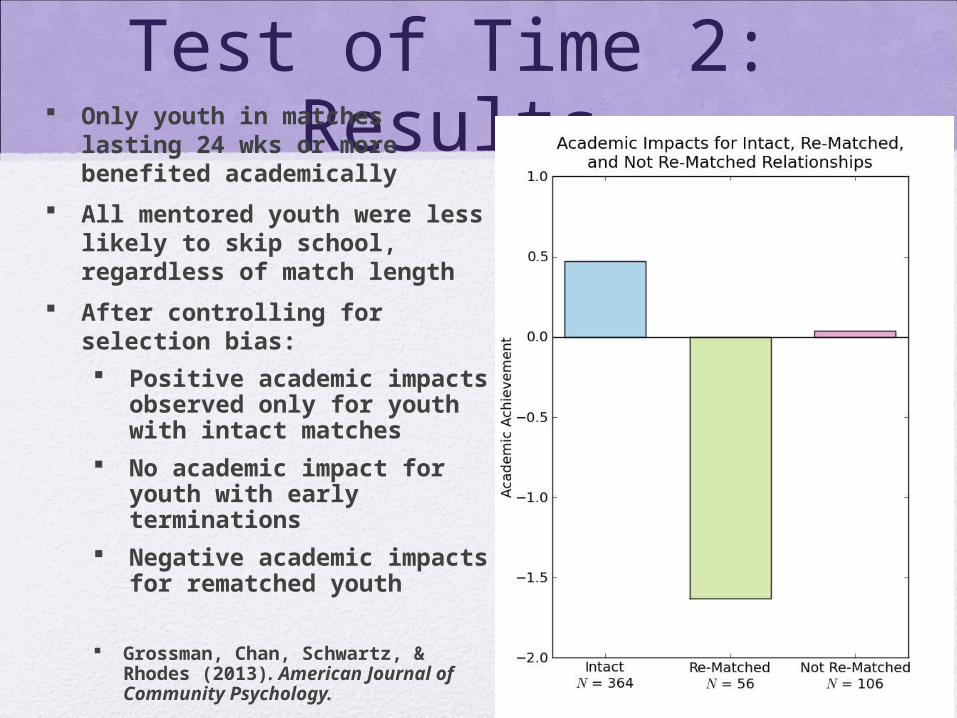
Test of Time 2: Results Only youth in matches lasting
24 wks or more benefited academically
All mentored youth were less likely to skip school, regardless of match length
After controlling for selection bias: Positive academic impacts
observed only for youth with intact matches
No academic impact for youth with early terminations
Negative academic impacts for rematched youth
Grossman, Chan, Schwartz, & Rhodes (2013). American Journal of Community Psychology.
What about gender?
• Across two data sets, only a few differences-• In Ed Study—boys in same gender
matches showed lower rates of truancy• In BBBSA study-youth in cross-gender
matches met more frequently and for a longer duration
• Kanchewa, S. & Rhodes, J. (2014). Applied Developmental Science
Stronger effects when…
Programs characterized by careful recruitment training monitoring multi-modal matching on interest

When we choose a goal and invest ourselves in it to the limits of concentration, whatever we do will be enjoyable. And once we have tasted this joy, we will redouble our efforts to taste it again.
This is the way the self grows.”
― Mihaly Csikszentmihalyi, Flow: The Psychology of Optimal Experience
How effective is youth mentoring? When are programs most beneficial? How does mentoring promote positive youth
development? What are the implications for policy, practice,
and research?
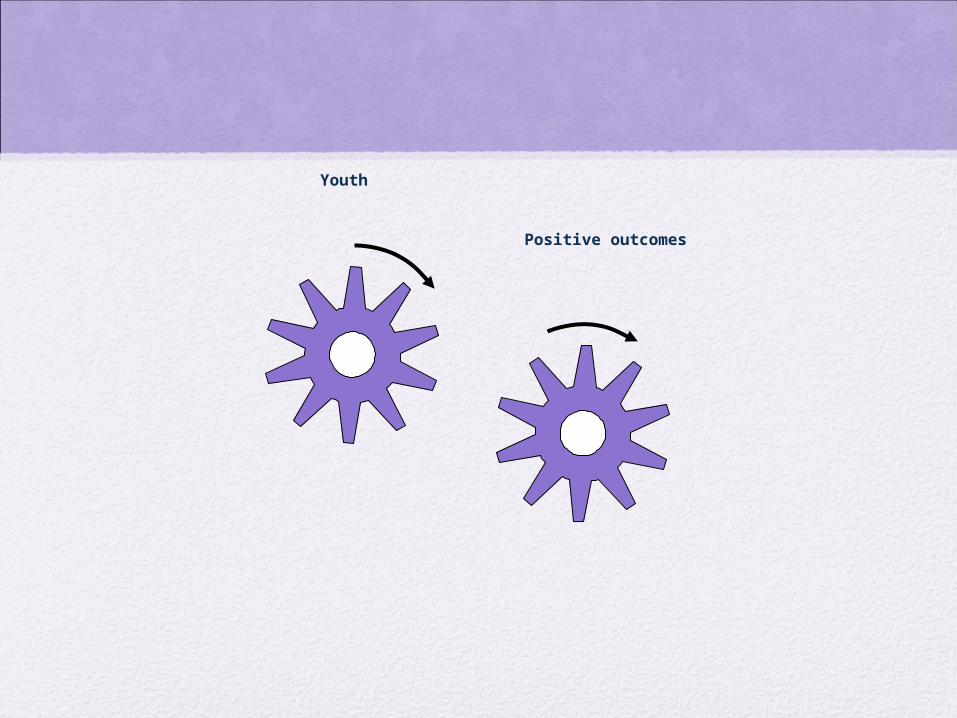
Youth
Positive outcomes
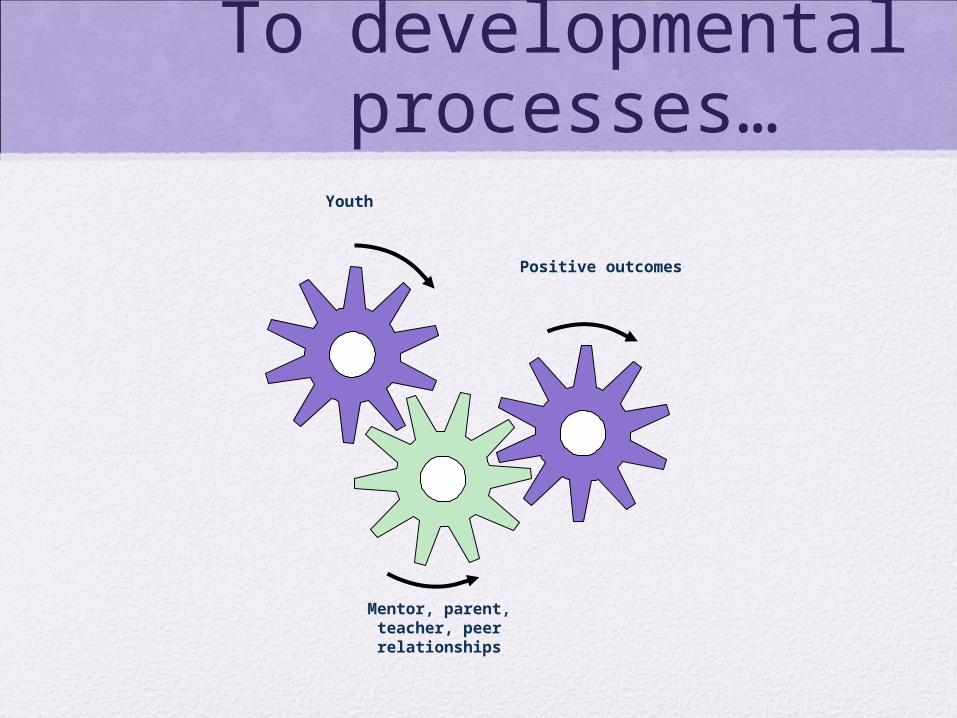
To developmental processes…
Mentor, parent, teacher, peer relationships
Youth
Positive outcomes
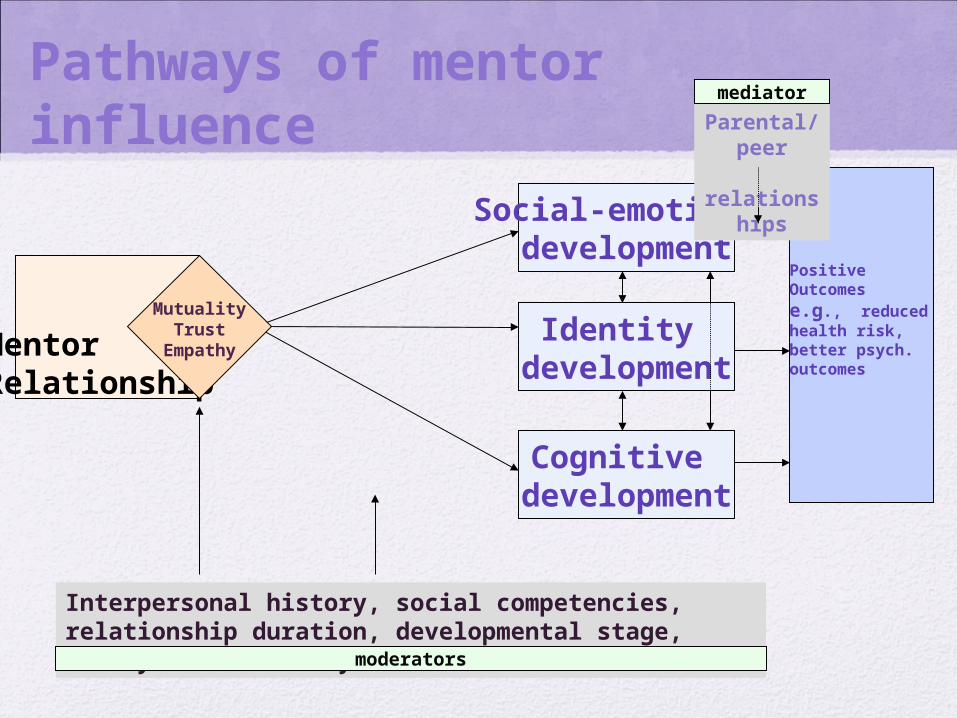
MentorRelationship
Interpersonal history, social competencies, relationship duration, developmental stage, family and community contextmoderatorsmoderators
Positive Outcomese.g., reduced health risk,better psych.outcomes
Cognitive development
Identity development
Social-emotionaldevelopment
Parental/peer
relationships
mediator
MutualityTrust
Empathy
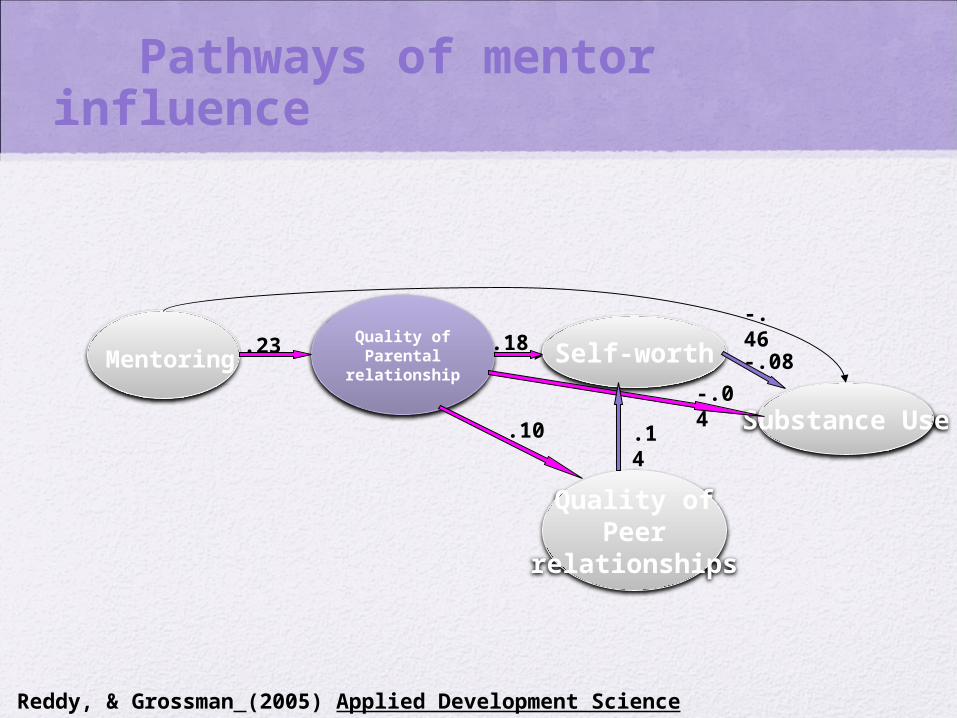
Pathways of mentor influence
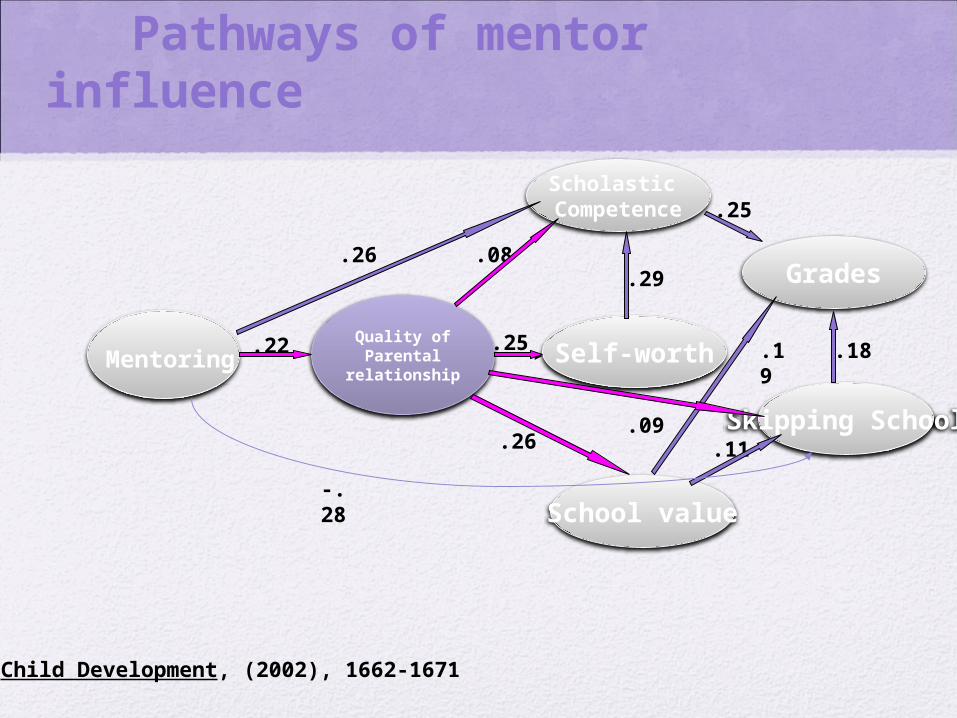
Pathways of mentor influence
Child Development, (2002), 1662-1671
Quality ofParental
relationship
Skipping School
Grades
Self-worth
School value
Scholastic Competence
.26 .08
-.28
.25
.26
.25
.18.19
.09
.29
.11
.22Mentoring
Pathways of mentor influence
Rhodes, Reddy, & Grossman (2005) Applied Development Science
Quality ofParental
relationship
Substance Use
Self-worth
-.46.18
.10 .14
.23Mentoring
Quality ofPeer
relationships
-.04
-.08
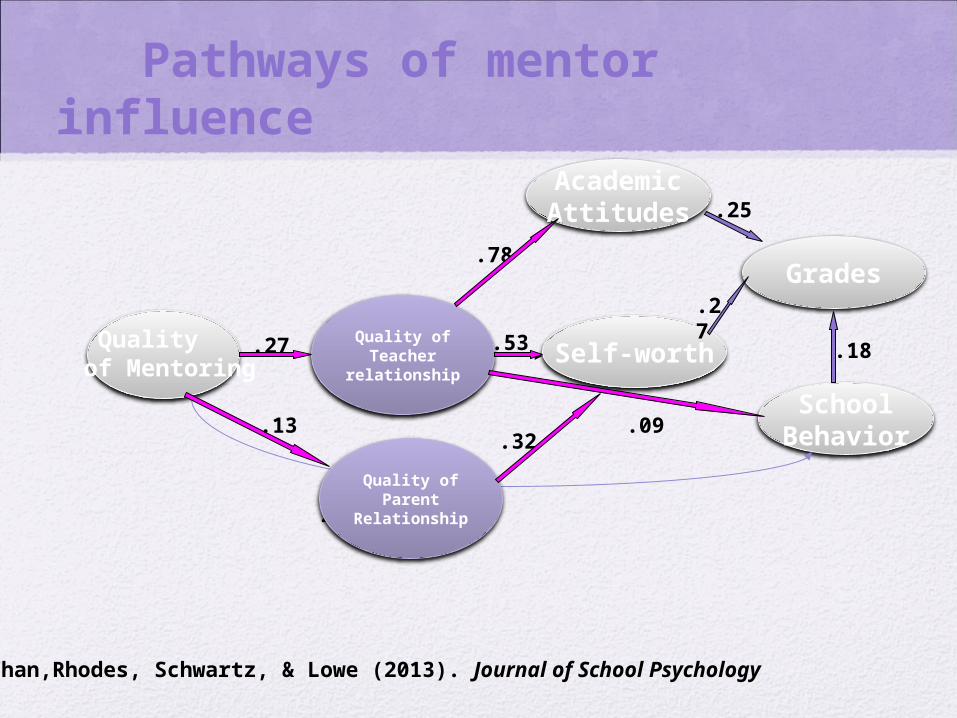
Pathways of mentor influence
Chan,Rhodes, Schwartz, & Lowe (2013). Journal of School Psychology
Quality ofTeacher
relationship
SchoolBehavior
Grades
Self-worth
Academic Attitudes
.78
-.28
.53
.32
.25
.18
.27
.09
.27 Quality of Mentoring
Quality ofParent
Relationship
.13