Page 1
Page 1 of 47
Travel Behavior of U.S. Domestic Airline Passengers and Its Impacts on Infrastructure Utilization
Final report
By
Bhuiyan M. Alam Assistant Professor
Department of Geography & Planning College of Arts & Sciences
Prepared for The University of Toledo University Transportation Center and the U.S. Department of Transportation
Date: 30 September 2009
DISCLAIMER The contents of this report reflect the views of the authors, who are responsible for the facts and the accuracy of the information presented herein. This document is disseminated under the sponsorship of the Department of Transportation University Transportation Centers Program, in the interest of information exchange. The U.S. Government assumes no liability for the contents or use thereof.
Page 2
Page 2 of 47
Executive Summary
Unexpected and unannounced delays and cancellations of flights have emerged as a quasi-
normal phenomenon in recent months and years. The airline unreliability has become
unbearable day by day. The volume of airline passengers on domestic routes in the United States
has risen despite the devastating terrorist acts of September 11, 2001 while the level of service
has gone down in recent years. Some speculate that this increased ridership has caused extra
pressure on available infrastructure such as airports. This study investigates the nature of
domestic air passenger travel demand at the airports. It also investigates the level of service
provided at the airports that are explained by different measuring units. The study includes five
regional airports: Chicago’s O’Hare International Airport (ORD), Detroit Metropolitan Wayne
County International Airport (DTW), Cincinnati-Covington International Airport (CVG),
Cleveland Hopkins International Airport (CLE), and Toledo Express Airport (TOL). It finds that
ORD, as it stands for the last decade, has been consistently providing unsatisfactory services to
the passengers in terms of flight delays (both departure and arrival), luggage handling, passenger
complaints, involuntary denial of boarding, etc. However, four other regional airports are doing
better than ORD in providing services to the passengers. The report recommends that ORD
expand its infrastructure including adding runways, increasing gates, and increasing number of
seats for passengers waiting for flights.
Keywords: Air Travel; Travel Behavior; Passenger Volume; Infrastructure Subject Category: Function(s): Research; Education & Training. Mode(s): Aviation
Page 3
Page 3 of 47
1 Introduction
It is evident from the Bureau of Transportation Statistics (BTS) that there has been a steady
increase in the number of flight operations in the last decade, from over 5 million in 1995 to
almost 7.5 million in 2007 (see Table 1: Summary of Airline On-Time Performance through
December, 2007) (BTS, 2008). As there has been a continuous rise in operations, there has also
been a decline in the percent of on-time arrivals. Curiously, in the year following the attacks on
September 11th, 2001, the airline industry had its best performance, albeit with its lowest number
of operations prior to 1995. Furthermore, the table indicates an overall and general increase in
the following performance categories with the exception of 2002: late arrivals, late departures,
cancelled flights, diverted flights, percent of late arrivals, percent of late departures, percent
cancelled, and percent diverted. With a few minor exceptions, the trend is obvious: flights and
volume are on the rise, while performance and efficiency of the industry is struggling to keep
pace.
Some industry experts and analysts have discussed the divergent perceptions of the two
main aircraft manufacturers, U.S. made Boeing and European consortium Airbus (Wei &
Hansen, 2007). In formulating their business plan and strategic approach toward future industry
trends, Boeing has indicated that in order to accommodate the projected air travel growth,
airlines will likely be offering more frequent flights. Thus, according to Boeing’s forecasts
(2005), smaller, more fuel efficient, single-aisle aircrafts will dominate the world air travel
market. It has responded accordingly with the introduction of its 7E7 Dreamliner aircraft line, a
family of 200- to 300-passenger planes intended for
Page 4
Page 4 of 47
Table 1: Summary of Airline On-Time Performance Year-to-date through December 2007
Year-to-date numbers for all years
Year Operations Late
Arrivals Late
Departures Cancelled Diverted
% On-time
Arrivals
% Late Arrivals
% Late Departures
% Cancelled
% Diverted
1995 5,327,435 1,039,250 827,934 91,905 10,492 78.57 19.51 15.54 1.73 0.20 1996 5,351,983 1,220,045 973,948 128,536 14,121 74.54 22.80 18.20 2.40 0.26 1997 5,411,843 1,083,834 846,870 97,763 12,081 77.94 20.03 15.65 1.81 0.22 1998 5,384,721 1,070,071 870,395 144,509 13,161 77.20 19.87 16.16 2.68 0.24 1999 5,527,884 1,152,725 937,273 154,311 13,555 76.11 20.85 16.96 2.79 0.25 2000 5,683,047 1,356,040 1,131,663 187,490 14,254 72.59 23.86 19.91 3.30 0.25 2001 5,967,780 1,104,439 953,808 231,198 12,909 77.40 18.51 15.98 3.87 0.22 2002 5,271,359 868,225 717,368 65,143 8,356 82.14 16.47 13.61 1.24 0.16 2003 6,488,540 1,057,804 834,390 101,469 11,381 81.96 16.30 12.86 1.56 0.18 2004 7,129,270 1,421,391 1,187,594 127,757 13,784 78.08 19.94 16.66 1.79 0.19 2005 7,140,596 1,466,065 1,279,404 133,730 14,028 77.40 20.53 17.92 1.87 0.20 2006 7,141,922 1,615,537 1,424,777 121,934 16,186 75.45 22.62 19.95 1.71 0.23 2007 7,453,215 1,803,320 1,572,335 160,748 17,179 73.42 24.20 21.10 2.16 0.23
SOURCE: Bureau of Transportation Statistics, Airline On-Time Data
routes ranging from 3,500 to 8,500 nautical miles and reportedly 20% more fuel efficient than
comparable sized airplanes. Moreover, Boeing discarded its 2002 plans for the introduction of
the 747X, a bulked up version of its large 747 jumbo jet line. Conversely, Airbus’s (2005)
equivalent market forecast report suggests that the future of air travel will be lead by much larger
aircraft. It too has responded with the introduction of its A380, a 525-seat, twin-aisle aircraft.
Obviously, both airplane manufacturers see an increase in future world wide air travel demand,
but are taking markedly different business approaches and attitudes toward travelers’ and
airports’ expectations and capabilities.
The aviation industry was devastated by the terrorist acts of September 11th, 2001, and
the safety precautions of airport administrations have changed significantly since then (Bhadra &
Texter, 2004; Wei & Hansen, 2007). While this is a certainty, the future of the industry as a
whole looks rather uncertain for various reasons. Recently, fuel costs had hit an all-time record
high, which has cut into the profit margins of airlines. Also, while airport capacity is fixed,
Page 5
Page 5 of 47
domestic passenger travel demand is at its highest level ever, according to recent reports out of
the Bureau of Transportation Statistics. Likewise, US carriers transported 3.1% more domestic
passengers (677 million passengers on 10,317 departures) and 4.6% more international
passengers during the first 11 months of 2007 than the same period for 2006 (BTS, 2008). Low-
fare carrier Southwest Airlines was the biggest domestic transporter, while American Airlines
carried more international passengers than any other domestic airline. This increased passenger
travel demand trend is expected to continue for several years.
On another note, airlines have been demanding airport runway expansion in order to off-
set the rise in passenger demand and reduce congestion and flight delays. This is often a tricky
demand, as runway improvements and expansions are costly and typically encounter NIMBY-
like resistance from environmentalists and local land and homeowners who already bear the
burden of noisy jets landing and taking off just above their homes. Currently, though, as Wei
and Hansen (2007) note, most airline operations at some major airports utilize low capacity
planes, i.e., fewer than 150 seats. The prevalence and duration of flight delays are significantly
greater on routes where only one airline provides direct service, and that additional competition
is correlated with better on-time performance (Mazzeo, 2003).
Obviously, the airline industry is facing numerous challenges and will continue to
regroup and reorganize in the post-9/11 world. Barring any future terrorist activity or major
airplane disaster, the air passenger travel demand should continue to grow (Mazzeo, 2003;
Bhadra & Texter, 2004; Wei & Hansen, 2007; BTS, 2008); however, rising fuel costs, a sluggish
economy, airport capacity and runway congestion, along with cost and service cutting measures
and labor/union struggles will also plague this industry. An important but untested area of
research involves airline level of service (LOS) at specific airports and in the largest US markets.
Page 6
Page 6 of 47
In brief, the above explanation reveals that the volume of airline passengers has risen
despite the reduction in LOS provided by the commercial airlines on domestic US routes.
Unexpected and unannounced delays and cancellations of flights have emerged as a more
frequent phenomenon in recent years than in the past. The airline unreliability is becoming
unbearable day by day. The friendly skies are rather bumpy these days. Interestingly, this poorer
service has not reduced the demand by the air passengers. Even the September 11, 2001 incident
did not have any apparent negative effects on the air travel demand. This study focuses on the in-
and out-bound domestic flights in the airports of this region (see Map 1): Chicago O’Hare
International Airport (ORD), Detroit Metropolitan Wayne County International Airport (DTW),
Cincinnati-Covington International Airport (CVG), Cleveland Hopkins International Airport
(CLE), and Toledo Express Airport (TOL).
2 Objectives of the Study
The objectives of the study were as below:
i) To investigate the nature and causes of travel demand increase/change by the airline
passengers on the domestic routes in last decade.
ii) To develop time series trend lines (longitudinal trends) that represent the travel demand
in last decade.
iii) To investigate and explore whether the travel demand by the airline passengers has
crossed the threshold air infrastructure utilization level.
Page 7
Page 7 of 47
Map 1: Geographic Locations of Five Regional Airports
Page 8
Page 8 of 47
3 Review of Literature
In this brief literature review, several articles are cited; however, it is important to note that much
of this topic is largely uncharted territory. Most of the data consulted in this review originated
from the Bureau of Transportation Statistics (BTS, 2008). Other important studies to date
include an analysis of flight delays on specific routes served only by one airline carrier (Mazzeo,
2003), selection of aircraft size and service frequency in select markets (Wei & Hansen, 2007),
and an econometric framework analysis of domestic airline networks from 1995 – 2003 (Bhadra
& Texter, 2004). Adrangi, et. al., (2001) attempted to provide a measurement model in their
examination of the time series structure of air transportation demand. Finally, two other studies
worth mentioning for their possible replication in the US involve LOS measurements at airport
passenger terminals/departure lounges in Rio de Janeiro, Brazil, (Correia & Wirasinghe, 2008;
Correia, et. al., 2008).
Correia, et. al. (2008) and Correia and Wirasinghe (2008) are concerned with LOS
measurements at Sao Paulo’s Guarulhos International Airport in Brazil. Both studies utilized a
survey instrument and conducted passenger interviews inside the aforementioned airport. Both
papers incorporate psychometric scaling techniques pioneered by Bock and Jones (1968) and
their results and findings could prove useful to other large, international airports.
In Correia, et. al. (2008), the authors focus on LOS measures and objective variables and
how they can be applied to the planning and design stages of airport terminals. This study asked
questions relating to the following measures: curbside components; check-in counter
experiences; security screening processes; and departure lounge facilities and experiences. In a
second survey at the same airport the study conducted pilot surveys on: walking distance, total
service time, actual walking (minimum) distance, and tardity-differential or facility orientation.
Page 9
Page 9 of 47
While the authors acknowledged the complexity of this type of research, they suggested that
these LOS measurements could be applied to other Brazilian or international airport facilities.
In Correia and Wirasinghe (2008), however, the main focus was not on the greater airport
experiences as in the previous study, but rather on the specific analysis of LOS measures at
airport departure lounges inside the Guarulhos International Airport. As the departure lounge is
one of the most important features to air travelers, this study emphasizes the following kinds of
attribute measurements: availability of seats; space available for circulation; and waiting time.
Unlike the above-mentioned Brazilian studies, two articles from China examine the
broader scope of air passenger travel behavior and patterns in that booming Asian market. Loo
(2008) provides insight into the stated preferences (SP) of air travelers departing from Hong
Kong International Airport (HKIA) while Jin, et. al. (2004) provide a longitudinal analysis of
Chinese air passenger transportation patterns from 1980–1998. The former utilizes a multi-
lingual survey instrument issued at HKIA in March, 2003, while the latter gathered data from the
Yearbook House of China Transportation and Communication and disregarded cargo data over
the same period. Furthermore, Loo’s (2008) study found differences in the preferences of short-,
medium-, and long-haul HKIA travelers, while Jin, et. al. (2004) discovered interesting patterns
in the evolution of China’s expanding air travel industry and airport volume and location. Both
are regarded as important steps in furthering the geographic understanding of the growing air
passenger transportation industry in China.
Gardiner and Ison (2008) identify the primary factors influencing the airport choice of
non-integrated cargo airlines within regions. They add to the survey information gathered by
Gardiner, et. al. (2005), by interviewing three airlines and three airports. Obviously, this paper’s
main concern is cargo-related; however, it does provide important insight into the airport
Page 10
Page 10 of 47
selection of non-integrated air carriers. They mention 15 factors that influence an airline’s
decision to locate at a certain airport.
Vowles (2006) pays tribute to the work of geographers who have published research on
the air transportation industry. He uses several databases and search engines to obtain a list of
176 air transportation-related works written by geographers. Moreover, he divides the
publications using three approaches: “historical, publication outlets, and topic focus” (p. 12). He
suggests that geographers will continue to make important contributions to the industry and
encourages attention to the exploding Asian markets of China, India, and certain Middle Eastern
countries.
Wei and Hansen (2005, 2007) contribute two separate but equally important papers. The
first is constructed around a nested logit model used to analyze “… the role of aircraft size on
airlines’ demand and market share in a duopoly competitive environment at the market level,
with one major airport in origin and one major airport in destination” (p. 317). After applying
filters to air carrier flight data from 1989 to 1998, thirteen specific routes were selected for
evaluation. They found that airlines can profit more in the form of market share by service
frequency increase compared to aircraft size increase. Furthermore, they conclude that because
increased frequency attracts more passengers, airlines are tempted to use smaller aircraft than the
least-cost aircrafts. Wei and Hansen (2007) further add to our understanding of airline
competition. Specifically, they investigate the decisions on aircraft size and service frequency by
applying three game-theoretic models and a sensitivity analysis. Obtaining data from the same
source as their previous study, they apply the information to two hypothetical markets: a short-
haul market and a long-haul market. Their findings were not surprising to them as they noted in
Page 11
Page 11 of 47
their aforementioned study how airlines have little to no incentive to use larger planes than the
least-cost ones.
Another study that looked at competitiveness is Mazzeo’s (2003) review of airlines’ on-
time performance. Unlike Wei and Hansen (2005, 2007), Mazzeo (2003) makes use of the
Airline Information Database provided by the BTS. He then takes into consideration data
gathered by the National Weather Service as a measure of control, as airlines frequently cite
Mother Nature as a reason for poor on-time performances. After a thorough regression analysis,
Mazzeo finds that “… flight delays are more common and longer in duration on routes where
only one airline provides direct service and through airports where the carrier represents a larger
share of total flights” (p. 276). Essentially, he suggests that lack of competition can lead to lower
quality of service and vice versa.
Tierney and Kuby (2008) examine the competitive environment of airline choice by air
travelers in multi-airport regions in the US. Unlike other domestic articles, this one gathered
data through the use of a survey at Phoenix’s Sky Harbor International Airport and collected
information from passengers holding tickets on Southwest Airlines and America West Airlines
during the spring of 2004. The two multi-airport destination-regions selected were Boston-
Providence and Baltimore-Washington, DC. The authors discovered that airfare played a major
role (58%) in passengers’ decision to use a less convenient (secondary) airport facility; however,
other factors related to the secondary airport were also found to be important to consumers, i.e.,
fewer flight delays, easier ground transportation, and better flight times.
Adrangi et. al. (2001) examine chaos and non-linearity in the demand for US airline
industry’s services. Using data acquired from Database Products, the authors disaggregated the
information into monthly sets of over two decades of air transportation service statistics. Then,
Page 12
Page 12 of 47
various Generalized Autoregressive Conditional Heteroscdeastic (GARCH) models were applied
to three main categories of data: revenue passenger miles, mail revenue ton miles, and freight
revenue ton miles. Adrangi et. al. (2001) did find evidence of non-linear dependence through
their analysis; however, they could not find consistent results in regard to chaos.
Obviously, the domestic-based research relies on a wide-range of methodologies and
sources of data. Only one made use of a survey instrument, while the others collected statistics
from an outside (third-party) agency or directly from the FAA or BTS. This seems to indicate
how diverse and increasingly important the field of research devoted to this industry can be.
Recently, it has become even more important to investigate various LOS and airline/air travel-
related topics, as the continual increase in jet fuel price has caused several major (and smaller
regional) airlines to revise their services and consider cost cutting measures, i.e., layoffs,
reduction of flights and routes, and decreases in airport facility/departure lounge services. The
industry is facing unusually expensive operating costs while attempting to remain competitive
and profitable.
Three other studies are worth mentioning at this point. The first, by Wei and Hansen
(2005), is an off-shoot of their efforts in the realm of aircraft size and seat availability and market
share regarding specific routes and markets. Second, Suzuki (2000) investigated, through the use
of a new modeling method, the relationship between airline carriers’ on-time performance and
market share. Lastly, but perhaps most important, is the most recent edition of the Federal
Aviation Administration’s (FAA) analysis of domestic airports and their forecast for future
operating capacity.
Wei and Hansen (2005) laid the foundation for their other study mentioned previously
(Wei & Hansen, 2007). Here, they review prior studies and applications of commercial carriers’
Page 13
Page 13 of 47
Quality of Service Index (QSI). Their focus utilizes the analysis of actual aircraft size on the
demand and market share in a duopoly competitive environment at the market level. Unlike
previous research, however, they take into account seat availability within these markets, and
limit their study to only include jet aircraft and not smaller, regional planes with less than 60
seats. After constructing a nested logit model, Wei and Hansen (2005) concluded that there is an
economic advantage for passenger carriers to utilize planes smaller than the “least-cost” aircraft.
Furthermore, an increase in flight frequency is more attractive to passengers, while providing
higher returns in the airline’s market share, since increasing aircraft size is less attractive to
flyers. In other words, more flights using smaller planes is better for increasing an airline’s
market share since larger planes with less frequent flights is an economic disadvantage.
Proposing the use of a new modeling method, Suzuki (2000) essentially analyzes airline
performance measures and the likelihood of passengers to switch airlines after experiencing
delays. Utilizing Department of Transportation (DOT) data, the author explores the performance
of three major carriers – American, Delta, and United Airlines between 1990–1997 from
Atlanta’s Hartsfield Airport (ATL) to Chicago’s O’Hare Airport (ORD), as this is one of the
nation’s most competitive and voluminous routes. While other airlines served this route
periodically during that time frame, Suzuki notes that only the three airlines mentioned above
were consistent service providers throughout the study period. In summary, Suzuki concludes
that air passengers are more likely to switch carriers after experiencing flight delay(s) than those
passengers not experiencing delay.
Finally, the FAA (2007) sponsors an annual review of the nation’s busiest airports and
attempts to forecast future capacity and issues relating to congestion through to the year 2025.
Currently, the study includes 56 domestic airports and their surrounding metropolitan areas. The
Page 14
Page 14 of 47
study identifies several major airports (and metropolitan areas) in need of short-term capacity
additions and suggests future capacity needs at others. Between 2007 and 2015, the FAA has
earmarked six major airports to monitor in terms of capacity and future needs: Baltimore-
Washington (BWI), Atlanta Hartsfield (ATL), McCarran International (LAS – Las Vegas),
Chicago Midway (MDW), San Antonio International (SAT), and San Diego International (SAN).
Moreover, the FAA claims that New York City (specifically, LaGuardia [LGA] and Newark
International [EWR]) already suffers from a lack of capacity, while Chicago O’Hare (ORD) and
Fort Lauderdale-Hollywood International (FLL) were listed in this category as well.
Furthermore, the FAA notes that after planned improvements to existing infrastructure, a few
airports and metropolitan areas will still need additional capacity; however, the list expands
greatly if those capacity needs are not met by 2015. The list swells for the same projections to
the year 2025. Put another way, many of the nation’s busiest airports (and largest metropolitan
areas) will be virtually crippled by a lack of capacity if planned improvements are not met. This
survey of the nation’s 56 busiest airports is current and suggests quick action for much needed
airport infrastructure improvements.
4 Methodology
There are important studies to date that include analysis of flight delays on specific routes served
only by one airline carrier (Mazzeo, 2003), selection of aircraft size and service frequency in
select markets (Wei & Hansen, 2007), and an econometric framework analysis of domestic
airline networks from 1995 – 2003 (Bhadra & Texter, 2004). Also, Adrangi et. al. (2001)
attempted to provide a measurement model in their examination of the time series structure of air
transportation demand. Two other studies worth mentioning for their possible replication in the
Page 15
Page 15 of 47
US involve LOS measurements at airport passenger terminals/departure lounges in Rio de
Janeiro, Brazil. (Correia & Wirasinghe, 2008; Correia, et. al., 2008).
The studies cited above have followed different technical approaches and methodologies.
Among these and other studies, relatively few have researched the nature of air travel demand
data. While Adrangi, et. al. (2001) uses GARCH model to explain the behavior of US airline
industry’s service demand, Mazzeo (2003) uses descriptive statistics and Ordinary Least Squares
(OLS) regression models to explain the competition and service quality in US airline industry.
Others use survey-based descriptive statistics to analyze overall LOS measures for airport
passenger terminals (Correia, et. al., 2008; Correia and Wirasinghe, 2008) and game theories to
investigate airlines’ competition in aircraft size and service frequency in duopoly markets (Wei
and Hansen, 2007)
This study uses descriptive and quantitative statistics to address the objectives. These
methodologies help analyze and explain such factors as flight delays and cancellations, capacity
of the current airline/airport infrastructure, LOS quality, and such. The study also conducts a
longitudinal analysis of the last decade using the BTS dataset.
5 Data Sources
The study uses data mostly from the BTS and The US DOT. The U.S. DOT issues a monthly Air
Travel Consumer Report that includes data on the following sub-sections: flight delays,
mishandled baggage, oversales, and consumer complaints. However, more recent reports
include additional information regarding the following two sub-sections: customer service
reports to the Transportation Security Administration, and airline reports of the loss, injury, or
death of animals during air transportation. The latter two additional sub-sections were included
Page 16
Page 16 of 47
in monthly reports starting with the July 2005 edition. It is designed to assist air travelers by
providing information on the quality of service (QOS) of domestic air carriers. Each table of
statistical information begins with a brief explanation of how to read and understand the tables
within each sub-section. Lastly, the information in each monthly report is a collection of data
from two months prior to the publication date except for oversells data which is calculated and
reported on a quarterly basis.
Flight delay information is divided into the following sub-categories:
• Overall Percentage of Reported Flight Operations Arriving On Time, by Carrier;
• Overall Percentage of Reported Flight Operations Arriving On Time and Carrier Rank,
by Month, Quarter, and Data Base to Date;
• Number of Reported Flight Arrivals and Percentage Arriving On Time, by Carrier and
Airport;
• Percentage of All Carriers' Reported Flight Operations Arriving On Time, by Airport and
Time of Day;
• Percentage of All Carriers' Reported Flight Operations Departing On Time, by Airport
and Time of Day;
• List of Regularly Scheduled Flights Arriving Late 80% of the Time or More;
• Number and Percentage of Regularly Scheduled Flights Arriving Late 70% of the Time
or More; and
• On-Time Arrival and Departure Percentage, by Airport.
Mishandled baggage information is provided in terms of the rate of mishandled-baggage
reports per 1,000 passengers by carrier and for the industry.
Page 17
Page 17 of 47
Oversells information is presented to include only passengers whose oversold flight
departs without them; they do not include passengers affected by cancelled, delayed or diverted
flights. These tables give information by carriers on the number of passengers bumped
involuntarily and on the number who voluntarily gave up their seats on an oversold flight in
exchange for compensation. Also shown in the report is the rate of involuntary denied boardings
per 10,000 passengers.
Consumer complaints information is a summary of aviation consumer complaints filed
with the DOT in writing, by telephone or in person. The report does not, however, include safety
complaints.
Data on departures were obtained from the BTS web-page and the US air carrier traffic
statistics section. The information can be gathered in monthly or 12-month tables including the
following sub-categories: Revenue Passenger Enplanements, Revenue Passenger Miles,
Available Seat Miles, Passenger Load Factor, Revenue Freight Ton Miles, Total Revenue Ton
Miles, Available Ton Miles, Ton Mile Load Factor, Revenue Departures Performed, Revenue
Aircraft Miles Flown, and Revenue Aircraft Hours (Airborne). Furthermore, each table can be
customized according the following filters: Geographic Area (domestic/international/system-
wide), Schedule Type (scheduled/non-scheduled/total), Service Class (passenger/cargo), and
Date (month/year).
The number of gates, runways, baggage handling carousels, public parking spaces, and
airline lounges were gathered from respective airport facility websites. Other information
pertaining to individual airlines’ maintenance expenditures were obtained from their quarterly
financial statements.
Page 18
Page 18 of 47
6 Results
The results section is divided in two parts. First part portrays a generalized trend of travel
behavior and infrastructure utilization for domestic airports and airlines in last decade while
second part discusses these issues for five regional airports that are of interests to this study.
6.1 Travel Demand Trend of Passengers and LOS Provided by Domestic Airports and Airlines
The study analyses several variables to get a clear picture of travel demand trend of passengers
and LOS provided by the airports and airlines. Those are enplaned passengers, passengers
boarded by major airlines, voluntary denied boardings, involuntary denied boardings, mishandles
baggage reports, and consumer complaints. Some of these are standardized by certain numbers
of passengers like 10,000 or 100,000. These factors are discussed below with the help of tables
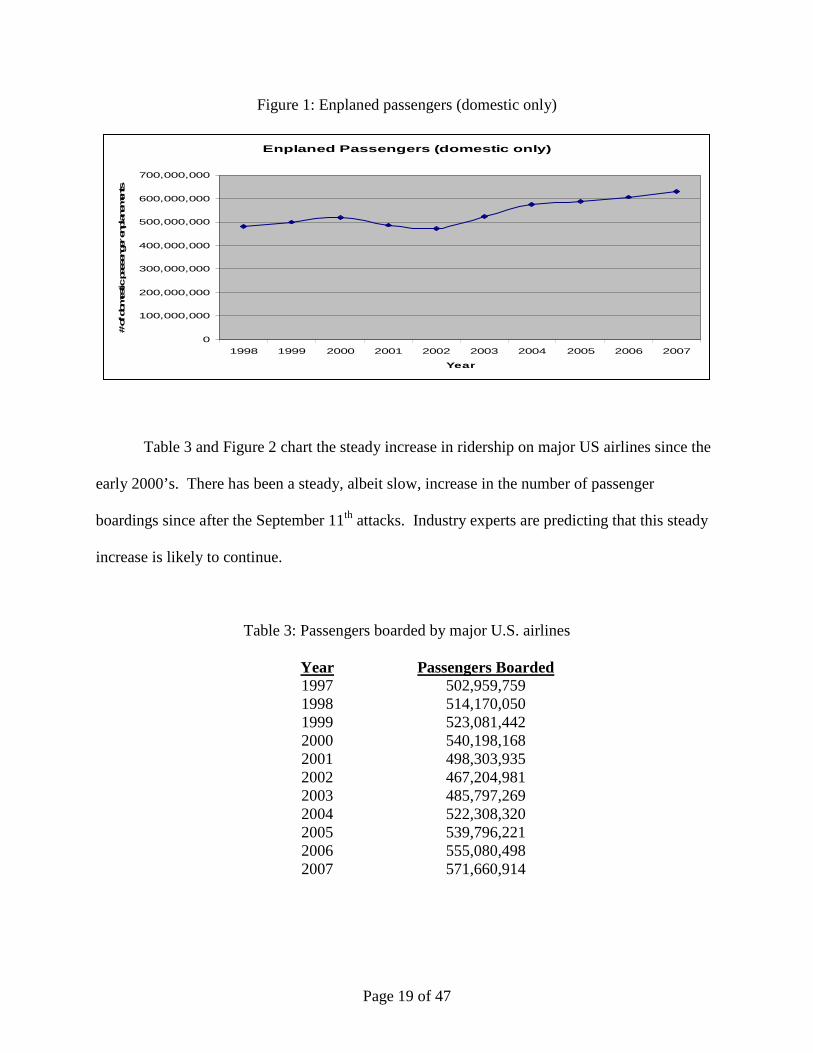
and figures. The total number of enplaned (domestic only) passengers is listed below in Table 2
and Figure 1.
Table 2: Enplaned passengers (domestic only)
Year Enplaned Passengers
1998 481,746,769 1999 499,103,518 2000 517,466,576 2001 488,375,272 2002 471,351,588 2003 524,515,038 2004 575,364,288 2005 589,674,652 2006 606,604,432 2007 628,799,697
Page 19
Page 19 of 47
Figure 1: Enplaned passengers (domestic only)
Enplaned Passengers (domestic only)
0
100,000,000
200,000,000
300,000,000
400,000,000
500,000,000
600,000,000
700,000,000
1998 1999 2000 2001 2002 2003 2004 2005 2006 2007
Year
# of dom
estic pas
seng
er enp
lane
men
ts
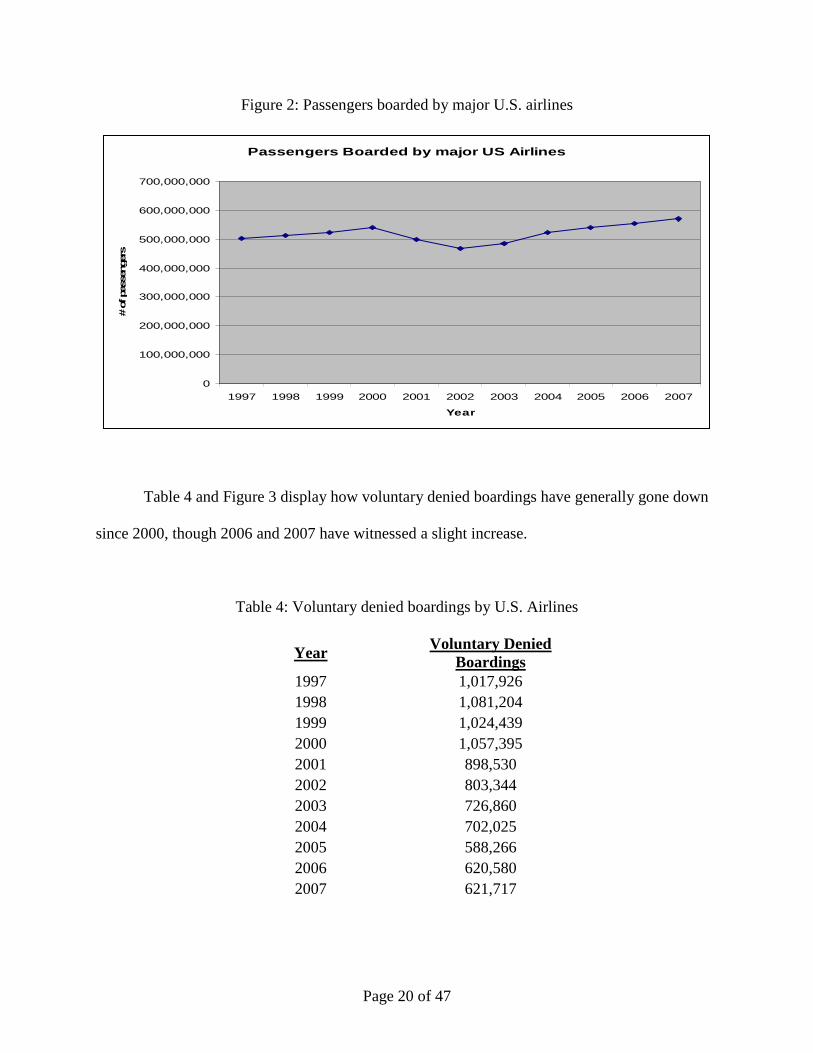
Table 3 and Figure 2 chart the steady increase in ridership on major US airlines since the
early 2000’s. There has been a steady, albeit slow, increase in the number of passenger
boardings since after the September 11th attacks. Industry experts are predicting that this steady
increase is likely to continue.
Table 3: Passengers boarded by major U.S. airlines
Year Passengers Boarded 1997 502,959,759 1998 514,170,050 1999 523,081,442 2000 540,198,168 2001 498,303,935 2002 467,204,981 2003 485,797,269 2004 522,308,320 2005 539,796,221 2006 555,080,498 2007 571,660,914
Page 20
Page 20 of 47
Figure 2: Passengers boarded by major U.S. airlines
Passengers Boarded by major US Airlines
0
100,000,000
200,000,000
300,000,000
400,000,000
500,000,000
600,000,000
700,000,000
1997 1998 1999 2000 2001 2002 2003 2004 2005 2006 2007
Year
# of p
asse
nger
s
Table 4 and Figure 3 display how voluntary denied boardings have generally gone down
since 2000, though 2006 and 2007 have witnessed a slight increase.
Table 4: Voluntary denied boardings by U.S. Airlines
Year Voluntary Denied Boardings
1997 1,017,926 1998 1,081,204 1999 1,024,439 2000 1,057,395 2001 898,530 2002 803,344 2003 726,860 2004 702,025 2005 588,266 2006 620,580 2007 621,717
Page 21
Page 21 of 47
Figure 3: Voluntary denied boardings by U.S. Airlines
Voluntary Denied Boardings by US Airlines
0
200,000
400,000
600,000
800,000
1,000,000
1,200,000
1997 1998 1999 2000 2001 2002 2003 2004 2005 2006 2007
Year
# of p
asse
nger
s
Unlike voluntary denied boardings, involuntary denied boardings have skyrocketed in
recent years. The lowest recorded number of involuntary denied boardings occurred in 2002;
however, as Table 5 and Figure 4 point out, domestic airlines have increased the amount of over-
booked flights every year since 2002.
Table 5: Involuntary denied boardings by U.S. airlines
Year Involuntary Denied Boardings 1997 53,546 1998 44,797 1999 45,774 2000 56,022 2001 43,000 2002 33,642 2003 41,932 2004 44,900 2005 47,774 2006 55,828 2007 63,878
Page 22
Page 22 of 47
Figure 4: Involuntary denied boardings by U.S. airlines
Involuntary Denied Boardings by US Airlines
0
10,000
20,000
30,000
40,000
50,000
60,000
70,000
1997 1998 1999 2000 2001 2002 2003 2004 2005 2006 2007
Year
# of p
asse
nger
s
Similar to Table 5 and Figure 4, Table 6 and Figure 5 show the number of denied
boardings per 10,000 passengers. There has been an increase in this category since 2002.
Table 6: Involuntary denied boardings per 10,000 passengers
Year Involuntary Denied Boardings
1997 1.06 1998 0.87 1999 0.88 2000 1.04 2001 0.86 2002 0.72 2003 0.86 2004 0.86 2005 0.89 2006 1.01 2007 1.12
Page 23
Page 23 of 47
Figure 5: Involuntary denied boardings per 10,000 passengers
Involuntary Denied Boardings per 10,000 Passengers
0
0.2
0.4
0.6
0.8
1
1.2
1997 1998 1999 2000 2001 2002 2003 2004 2005 2006 2007
Year
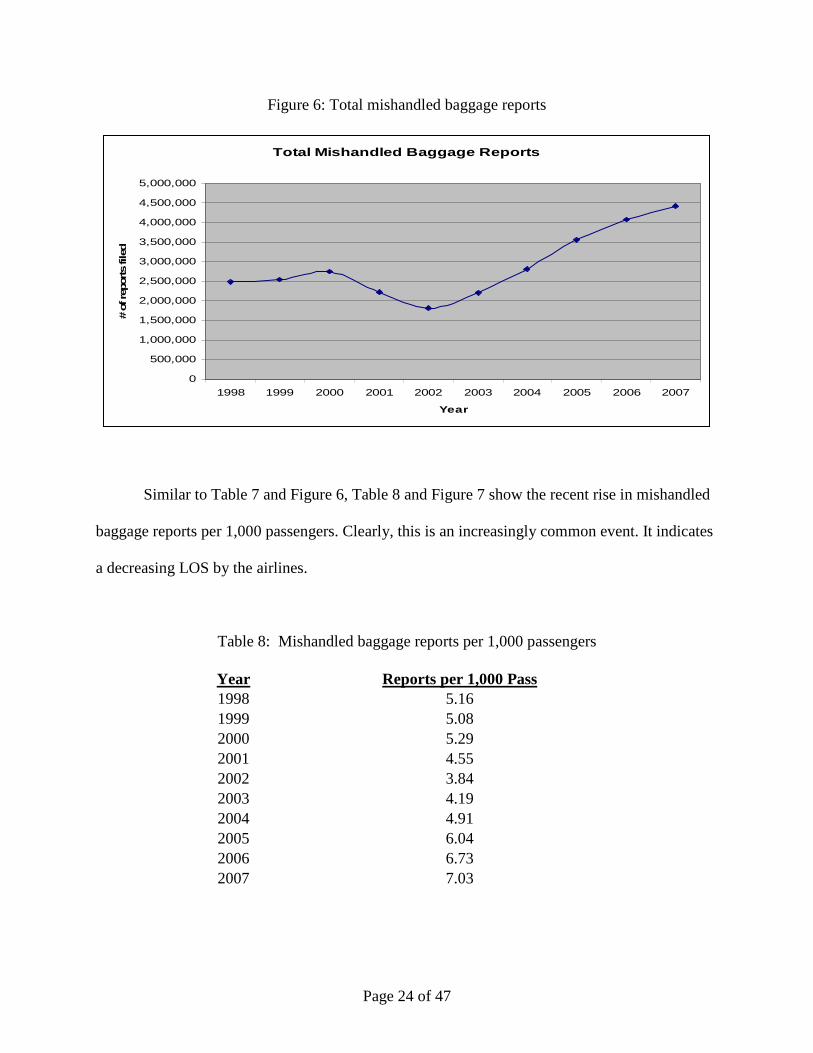
An all too common travel nightmare, ‘mishandled baggage’ reports have been kept by the
FAA since 1998. Like involuntary denied boardings, this trend has been on the rise since its
lowest point in 2002. The number of reports filed from 1998 to 2007 is shown in Table 7 and
Figure 6.
Table 7: Total mishandled baggage reports
Year Total Mishandled Baggage Reports
1998 2,484,841 1999 2,537,018 2000 2,738,463 2001 2,221,303 2002 1,808,977 2003 2,198,934 2004 2,822,206 2005 3,562,132 2006 4,083,054 2007 4,419,654
Page 24
Page 24 of 47
Figure 6: Total mishandled baggage reports
Total Mishandled Baggage Reports
0
500,000
1,000,000
1,500,000
2,000,000
2,500,000
3,000,000
3,500,000
4,000,000
4,500,000
5,000,000
1998 1999 2000 2001 2002 2003 2004 2005 2006 2007
Year
# of rep
orts file
d
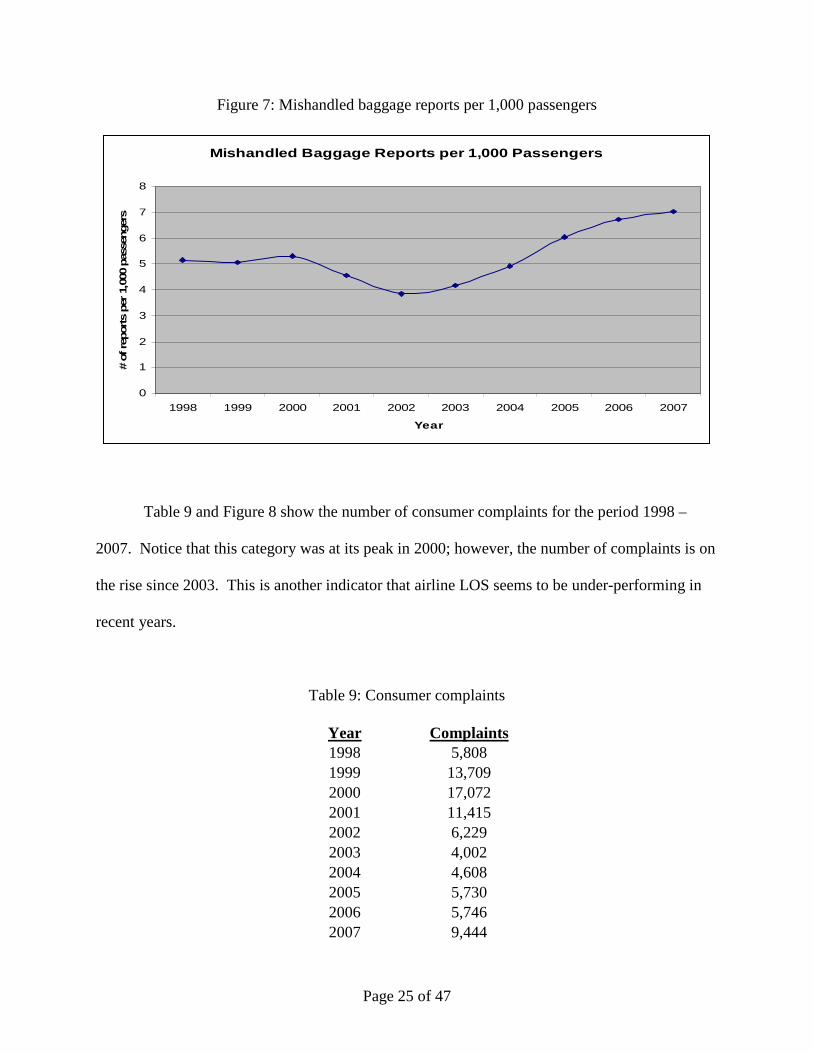
Similar to Table 7 and Figure 6, Table 8 and Figure 7 show the recent rise in mishandled
baggage reports per 1,000 passengers. Clearly, this is an increasingly common event. It indicates
a decreasing LOS by the airlines.
Table 8: Mishandled baggage reports per 1,000 passengers
Year Reports per 1,000 Pass 1998 5.16 1999 5.08 2000 5.29 2001 4.55 2002 3.84 2003 4.19 2004 4.91 2005 6.04 2006 6.73 2007 7.03
Page 25
Page 25 of 47
Figure 7: Mishandled baggage reports per 1,000 passengers
Mishandled Baggage Reports per 1,000 Passengers
0
1
2
3
4
5
6
7
8
1998 1999 2000 2001 2002 2003 2004 2005 2006 2007
Year
# of
rep
orts p
er 1
,000
pas
seng
ers
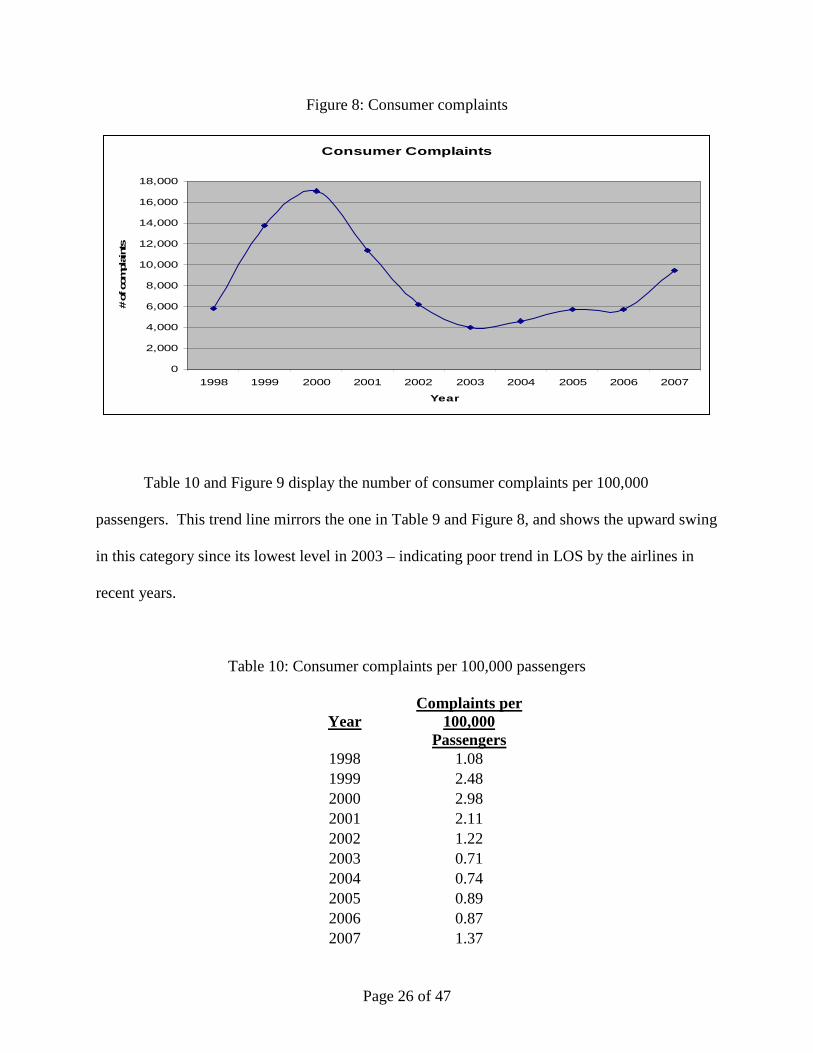
Table 9 and Figure 8 show the number of consumer complaints for the period 1998 –
2007. Notice that this category was at its peak in 2000; however, the number of complaints is on
the rise since 2003. This is another indicator that airline LOS seems to be under-performing in
recent years.
Table 9: Consumer complaints
Year Complaints 1998 5,808 1999 13,709 2000 17,072 2001 11,415 2002 6,229 2003 4,002 2004 4,608 2005 5,730 2006 5,746 2007 9,444
Page 26
Page 26 of 47
Figure 8: Consumer complaints
Consumer Complaints
0
2,000
4,000
6,000
8,000
10,000
12,000
14,000
16,000
18,000
1998 1999 2000 2001 2002 2003 2004 2005 2006 2007
Year
# of com
plaints
Table 10 and Figure 9 display the number of consumer complaints per 100,000
passengers. This trend line mirrors the one in Table 9 and Figure 8, and shows the upward swing
in this category since its lowest level in 2003 – indicating poor trend in LOS by the airlines in
recent years.
Table 10: Consumer complaints per 100,000 passengers
Year Complaints per
100,000 Passengers
1998 1.08 1999 2.48 2000 2.98 2001 2.11 2002 1.22 2003 0.71 2004 0.74 2005 0.89 2006 0.87 2007 1.37
Page 27
Page 27 of 47
Figure 9: Consumer complaints per 100,000 passengers
Consumer Complaints per 100,000 Passengers
0
0.5
1
1.5
2
2.5
3
3.5
1998 1999 2000 2001 2002 2003 2004 2005 2006 2007
Year
# of
com
plai
nts/
100,
000
pass
enge
rs
6.2 LOS Provided by Regional Airports
According to recently published BTS figures (2008), of this project’s list of five domestic
airports, only Chicago O’Hare International Airport (ORD) ranked among the top ten for
domestic enplanements (see Table 11); however, when international passenger enplanements
were added, Detroit’s Metropolitan Wayne County International Airport (DTW) was ranked at
number nine (see Table 12). Of the other airports listed for this study and among the 854 total
US airports, CVG, CLE, and TOL were ranked 30, 35, and 188, respectively, in terms of
passenger departures. Similarly, CVG’s on-time performance rank in 2007 was #5 for
departures and #2 for arrivals; neither CLE, nor TOL were given a rank based on on-time
performance as the BTS only ranks major US airports.
Page 28
Page 28 of 47
Table 11: Top 10 U.S. Airports, ranked by January-November 2007 domestic scheduled enplanements
Passenger numbers in millions (000,000)
Jan-Nov 2007 Rank
Airport
Jan-Nov 2007
Enplaned Passengers
Jan-Nov 2006 Rank
Jan-Nov 2006
Enplaned Passengers
Percent Change 2006-
2007
1 Atlanta 32.399 1 30.969 4.6 2 Chicago O'Hare 26.158 2 26.244 -0.3 3 Dallas-Ft. Worth 21.670 3 21.750 -0.4 4 Denver 19.499 4 18.580 4.9 5 Los Angeles 18.242 5 17.810 2.4 6 Las Vegas 17.776 6 17.349 2.5 7 Phoenix 16.764 7 16.490 1.7 8 Houston Bush 14.163 8 14.059 0.7 9 Orlando 13.813 10 13.222 4.5
10 Minneapolis-St.
Paul 13.149 9 13.315 -1.2
Source: Bureau of Transportation Statistics, T-100 Domestic Market
Table 12: Top 10 U.S. Airports, ranked by January-November 2007 System* Scheduled Enplanements
Passenger numbers in millions (000,000)
Jan-Nov 2007 Rank
Airport
Jan-Nov 2007
Enplaned Passengers
Jan-Nov 2006 Rank
Jan-Nov 2006
Enplaned Passengers
Percent Change
2006-2007
1 Atlanta 39.091 1 37.305 4.8 2 Chicago O'Hare 31.573 2 31.783 -0.7 3 Dallas-Ft. Worth 25.732 3 25.842 -0.4 4 Denver 21.859 5 20.825 5.0 5 Los Angeles 21.840 4 21.145 3.3 6 Las Vegas 19.539 6 19.199 1.8 7 Phoenix 18.915 7 18.694 1.2 8 Houston Bush 18.271 8 18.152 0.7 9 Detroit Metro 15.860 9 15.793 0.4 10 Minneapolis-St. Paul 15.438 10 15.587 -1.0
Source: Bureau of Transportation Statistics, T-100 Market * System equals domestic plus international
Page 29
Page 29 of 47
Table 13: LOS variables of the Five Regional Airports in this study
5 Study Airports Gates Runways FAA
Check Points*
Airline Lounges**
Baggage Carousels
Parking Spaces
**Lounge Operators
ORD Chicago 178 6 13 23 NA
22,730
United (2), Cont., NW,
Delta, AA(2), Aer Lingus, Air France, Alitalia,
All Nippon, Australian, BA,
JAL, KLM, Korean, Kuwait,
Lufthansa, Mexicana,
Scandinavian, Turkish, Virgin
Atlantic, SwissAir
CVG Cinci/NKY 136 4 2 3 NA NA Delta (3)
DTW Detroit 145 6 7 2 NA
20,000 Northwest (2) – now merged with Delta
CLE Cleveland,
OH 92 4 3 2
11
7,000
Continental, United
TOL Toledo,
OH 7 2 1 -
2
1,200
* The number of FAA Check points varies by day and time of day. For this metric column,
Monday from 6 AM to 7 AM was chosen.
** The number of airline lounges is listed in this column while lounge operators are shown in the
last column on the right.
Page 30
Page 30 of 47
Table 13 displays the most recent available datum for the LOS variables of the five
airports included in this project. The ORD, being one of the largest and busiest facilities in the
world, is equipped with the largest number of gates; however, it is followed closely by the next
two largest airports in the region - Detroit (DTW) and Cincinnati (CVG), respectively. Detroit’s
terminal recently received a much needed facelift and is now better able to handle large volumes
of passengers and flights. It also increased its number of runways to six which is equal to the
number at ORD, a facility that handled almost double the volume of enplaned passengers from
January to November of 2007 (see Table 13). This capacity limitation has caused countless
delays at ORD in recent years. CVG and CLE both have four runways and TOL is limited to just
two. The number of FAA Security Check Points listed is for Monday from 6 to 7 AM only, and
seems to be commensurate with the level of passengers at each airport at that particular time.
A major international destination, ORD operates 23 airline lounges. An important
operations hub for American and United Airlines, they both maintain two separate lounges for
their customers, while several international airlines operate lounges there. Surprisingly, DTW is
not as heavily filled with airline lounges even though it is an important international
departure/destination. It does, however, serve as one of Northwest Airline’s (now merged with
Delta) major hubs and they maintain two lounges there. Until recently, CVG was a Delta hub
and hosted three of their lounges, while CLE is a hub for Continental Airlines. CLE has one
Continental lounge and one United Airlines lounge. TOL has no airline lounges.
At the time of this research, information regarding the number of operational baggage
handling carousels was unavailable for the three largest airports involved in this region. CLE
and TOL listed eleven and two carousels, respectively.
Page 31
Page 31 of 47
Four of the five regional airports provided information regarding the number of available
public parking spaces at their facilities, while CVG did not supply any information. Curiously,
ORD only lists 22,730 spaces while DTW boasts 20,000. An important caveat, ORD does offer
service to/from downtown and stops along the way via its world-famous “L” train. CLE and
TOL offer 7,000 and 1,200 spaces, respectively.
Several tables are presented below and demonstrate the increased demand for domestic
air travel and the poor LOS from airlines in recent years.
Page 32
Page 32 of 47
Figure 10: Percent on-time arrivals performance for ORD
% on-time (arrivals) performance for Chicago's O'Ha re International Airport (ORD)
0
10
20
30
40
50
60
70
80
90
100
Sep-0
2Nov-0
2Ja
n-03
Mar
-03
May
-03
Jul-0
3Sep
-03
Nov-03
Jan-
04M
ar-0
4M
ay-0
4Ju
l-04
Sep-0
4Nov-0
4Ja
n-05
Mar
-05
May
-05
Jul-0
5Sep
-05
Nov-05
Jan-
06M
ar-0
6M
ay-0
6Ju
l-06
Sep-0
6Nov-0
6Ja
n-07
Mar
-07
May
-07
Jul-0
7Sep
-07
Nov-07
Jan-
08M
ar-0
8M
ay-0
8
Month
One of the nation’s consistently poorest performers according to percentage of on-time arrivals, ORD regularly ranks toward
the bottom of this FAA category. The Federal Aviation Administration keeps tabs on arrival and departure performance for the
country’s top 32 airports. As one of the busiest facilities not only in the US but also the world, ORD suffers from some of the nation’s
worst monthly arrival performances. Notice that ORD recorded its lowest ratings over the winter months of 2007 – 2008. During this
study period, ORD averaged 71.04% on-time arrival performance.
Page 33
Page 33 of 47
Map 2: Geographic Locations of Top 32 Airports of the Country
Page 34
Page 34 of 47
Figure 11: Percent on-time arrivals performance for DTW
% on-time (arrivals) performance for Detroit Metrop olitan Wayne County International Airport (DTW)
0
10
20
30
40
50
60
70
80
90
100
Sep-0
2Nov-0
2Ja
n-03
Mar
-03
May
-03
Jul-0
3Sep
-03
Nov-03
Jan-
04M
ar-0
4M
ay-0
4Ju
l-04
Sep-0
4Nov-0
4Ja
n-05
Mar
-05
May
-05
Jul-0
5Sep
-05
Nov-05
Jan-
06M
ar-0
6M
ay-0
6Ju
l-06
Sep-0
6Nov-0
6Ja
n-07
Mar
-07
May
-07
Jul-0
7Sep
-07
Nov-07
Jan-
08M
ar-0
8M
ay-0
8
month
Also a busy facility, DTW typically performs slightly better than ORD on a regular monthly basis; however, it is still not
uncommon for this airport to see its percentages in the 60 – 70% range. Although DTW does not handle the volume of traffic that
ORD does, it still manages to perform better in this category. The mean percent on-time (arrivals) performance of DTW over this
time period is 79.17%.
Page 35
Page 35 of 47
Figure 12: Percent on-time arrivals performance for CVG
% on-time (arrivals) performance for Cincinnati Int ernational Airport (CVG)
0
10
20
30
40
50
60
70
80
90
100
Sep-0
2Nov-0
2Ja
n-03
Mar
-03
May
-03
Jul-0
3Sep
-03
Nov-03
Jan-
04M
ar-0
4M
ay-0
4Ju
l-04
Sep-0
4Nov-0
4Ja
n-05
Mar
-05
May
-05
Jul-0
5Sep
-05
Nov-05
Jan-
06M
ar-0
6M
ay-0
6Ju
l-06
Sep-0
6Nov-0
6Ja
n-07
Mar
-07
May
-07
Jul-0
7Sep
-07
Nov-07
Jan-
08M
ar-0
8M
ay-0
8
month
Cincinnati International Airport (CVG) regularly scores better than both DTW and ORD in percent on-time arrival
performance. It is not unusual for CVG to be ranked among the top five airports for this performance metric. CVG’s average percent
on-time arrival performance from September 2002 to May 2008 was 80.8%.
Page 36
Page 36 of 47
Figure 13: Composite of percent on-time arrivals performance for CVG, DTW, and ORD
Composite of % on-time (arrivals) performance for C VG, DTW, and ORD
0
10
20
30
40
50
60
70
80
90
100
Sep
-02
Oct
-02
Nov
-02
Dec
-02
Jan-
03F
eb-0
3M
ar-0
3A
pr-0
3M
ay-0
3Ju
n-03
Jul-0
3A
ug-0
3S
ep-0
3O
ct-0
3N
ov-0
3D
ec-0
3Ja
n-04
Feb
-04
Mar
-04
Apr
-04
May
-04
Jun-
04Ju
l-04
Aug
-04
Sep
-04
Oct
-04
Nov
-04
Dec
-04
Jan-
05F
eb-0
5M
ar-0
5A
pr-0
5M
ay-0
5Ju
n-05
Jul-0
5A
ug-0
5S
ep-0
5O
ct-0
5N
ov-0
5D
ec-0
5Ja
n-06
Feb
-06
Mar
-06
Apr
-06
May
-06
Jun-
06Ju
l-06
Aug
-06
Sep
-06
Oct
-06
Nov
-06
Dec
-06
Jan-
07F
eb-0
7M
ar-0
7A
pr-0
7M
ay-0
7Ju
n-07
Jul-0
7A
ug-0
7S
ep-0
7O
ct-0
7N
ov-0
7D
ec-0
7Ja
n-08
Feb
-08
Mar
-08
Apr
-08
May
-08
month
DTW
ORD
CVG
Figure 13 combines the single trend lines of the previous three figures. It reinforces the aforementioned fact that ORD
typically performs worst among these three facilities, while CVG is most often the best of these regional airports. As mentioned
above, the average percent on-time (arrival) performance for ORD, DTW, and CVG during this period was 71.04%, 79.17%, and
80.8%, respectively. ORD’s performance were worst in the winter of 2003-2004 and again in the winter of 2007-2008 indicating that
the airport facilities cannot provide good service to the passengers in inclement weather that may lead to closure of a runway or any
other facilities.
Page 37
Page 37 of 47
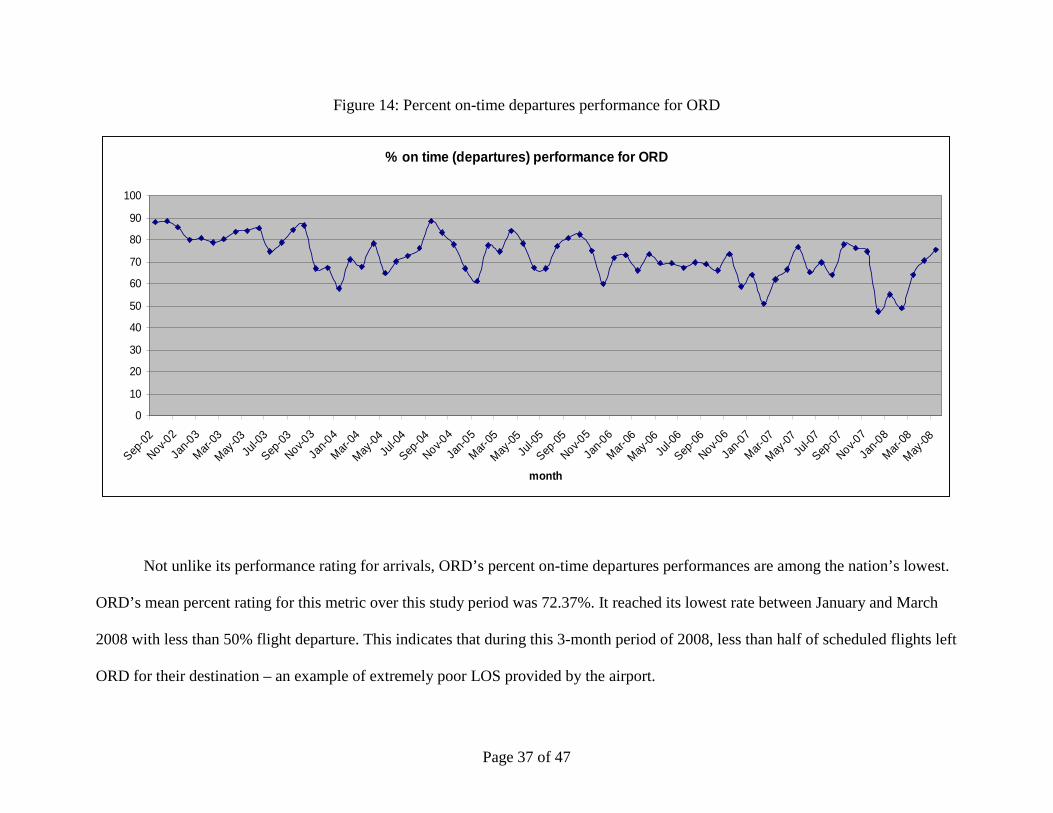
Figure 14: Percent on-time departures performance for ORD
% on time (departures) performance for ORD
0
10
20
30
40
50
60
70
80
90
100
Sep-0
2Nov-0
2Ja
n-03
Mar-03
May-03
Jul-0
3Sep
-03
Nov-03
Jan-
04Mar-
04May
-04Ju
l-04
Sep-0
4Nov-0
4Ja
n-05
Mar-05
May-05
Jul-0
5Sep
-05
Nov-05
Jan-
06Mar-
06May
-06Ju
l-06
Sep-0
6Nov-0
6Ja
n-07
Mar-07
May-07
Jul-0
7Sep
-07
Nov-07
Jan-
08Mar-
08May
-08
month
Not unlike its performance rating for arrivals, ORD’s percent on-time departures performances are among the nation’s lowest.
ORD’s mean percent rating for this metric over this study period was 72.37%. It reached its lowest rate between January and March
2008 with less than 50% flight departure. This indicates that during this 3-month period of 2008, less than half of scheduled flights left
ORD for their destination – an example of extremely poor LOS provided by the airport.
Page 38
Page 38 of 47
Figure 15: Percent on-time departures performance for DTW
% on time (departures) performance for DTW
0
10
20
30
40
50
60
70
80
90
100
Sep-0
2Nov-0
2Ja
n-03
Mar
-03
May
-03
Jul-0
3Sep
-03
Nov-03
Jan-
04M
ar-0
4M
ay-0
4Ju
l-04
Sep-0
4Nov-0
4Ja
n-05
Mar
-05
May
-05
Jul-0
5Sep
-05
Nov-05
Jan-
06M
ar-0
6M
ay-0
6Ju
l-06
Sep-0
6Nov-0
6Ja
n-07
Mar
-07
May
-07
Jul-0
7Sep
-07
Nov-07
Jan-
08M
ar-0
8M
ay-0
8
month
Figure 15 shows DTW’s on-time departures performances based on percentage. It closely mirrors its arrivals performance
rating. DTW typically holds a monthly ranking somewhere near the middle of the top 32 airports, according to the FAA. The mean
percent on-time departures performance for DTW from September 2002 to May 2008 was 80.27%. The lowest rate of departure was
between 60% and 70% in January 2008.
Page 39
Page 39 of 47
Figure 16: Percent on-time departures performance for CVG
% on time (departures) performance for CVG
0
10
20
30
40
50
60
70
80
90
100
Sep-0
2Nov-0
2Ja
n-03
Mar-03
May-03
Jul-0
3Sep
-03
Nov-03
Jan-0
4Mar-
04May
-04Ju
l-04
Sep-0
4Nov-0
4Ja
n-05
Mar-05
May-05
Jul-0
5Sep
-05
Nov-05
Jan-0
6Mar-
06May
-06Ju
l-06
Sep-0
6Nov-0
6Ja
n-07
Mar-07
May-07
Jul-0
7Sep
-07
Nov-07
Jan-0
8Mar-
08May
-08
month
Like its arrivals performance, CVG’s departures performances are among the highest of the nation’s top 32 airports with a
mean of 82.34% on-time departures. CVD reached it lowest rate of departure with a value of over 60% in May 2007. Otherwise,
CVG’s performance is much better than ORD and DTW.
Page 40
Page 40 of 47
Figure 17: Composite of percent on-time departures performance for CVG, DTW, and ORD
Composite of % on-time (departures) performance for CVG, DTW, and ORD
0
10
20
30
40
50
60
70
80
90
100
Sep
-02
Oct
-02
Nov
-02
Dec
-02
Jan-
03F
eb-0
3M
ar-0
3A
pr-0
3M
ay-0
3Ju
n-03
Jul-0
3A
ug-0
3S
ep-0
3O
ct-0
3N
ov-0
3D
ec-0
3Ja
n-04
Feb
-04
Mar
-04
Apr
-04
May
-04
Jun-
04Ju
l-04
Aug
-04
Sep
-04
Oct
-04
Nov
-04
Dec
-04
Jan-
05F
eb-0
5M
ar-0
5A
pr-0
5M
ay-0
5Ju
n-05
Jul-0
5A
ug-0
5S
ep-0
5O
ct-0
5N
ov-0
5D
ec-0
5Ja
n-06
Feb
-06
Mar
-06
Apr
-06
May
-06
Jun-
06Ju
l-06
Aug
-06
Sep
-06
Oct
-06
Nov
-06
Dec
-06
Jan-
07F
eb-0
7M
ar-0
7A
pr-0
7M
ay-0
7Ju
n-07
Jul-0
7A
ug-0
7S
ep-0
7O
ct-0
7N
ov-0
7D
ec-0
7Ja
n-08
Feb
-08
Mar
-08
Apr
-08
May
-08
month
DTW
CVG
ORD
Figure 17 displays all three facilities’ percent on-time departure performance rating from September 2002 to May 2008. The
trend lines closely mimic the arrival performance percentages. The performances of CVG, DTW and ORD in terms of on-time
departures performance were 82.34%, 80.27%, and 72.37%, respectively during the same period. The researcher could not obtain the
same data for CLE and TOL. However, the study assumes that the departure rates of these two airports would be better than CVG,
DTW and ORD since there is considerably less air traffic in these two small airports than CVG, DTW and ORD.
Page 41
Page 41 of 47
Figure 18: Number of NTSB ‘Events’ at ORD in the past 10 years
number of NTSB Events at ORD in the past decade
Feb
-98
Apr
-98
Jun-
99
Feb
-00
Apr
-00
Aug
-00
Dec
-00
Dec
-01
Nov
-02
Apr
-03
Jul-0
3
Jul-0
4S
ep-0
4
Jun-
06Ju
l-06
Nov
-06
Feb
-07
Dec
-07
0
1
2
3
Mar-97 Jul-98 Dec-99 Apr-01 Sep-02 Jan-04 May-05 Oct-06 Feb-08 Jul-09
month
num
ber
of N
TS
B A
ccid
ents
/Inc
iden
ts
Rep
orts
As one of the nation’s busiest facilities, it is not surprising that there have been 21 NTSB
Accident/Incident ‘Events’ at ORD in the past decade. It is also not surprising that American
Airlines and United Airlines have recorded more ‘Event’ reports at ORD than other major
airlines, as these two carriers account for a large percentage of ORD’s flight traffic.
Figure 19: Number of NTSB ‘Events’ at DTW in the past 10 years
number of NTSB Events at DTW in the past decade
Jan-
01M
ar-0
1
Jul-0
1
Jan-
08
0
1
2
Dec-99 Apr-01 Sep-02 Jan-04 May-05 Oct-06 Feb-08 Jul-09
month
num
ber of
NTS
B A
ccid
ent/I
ncid
ent
Rep
orts
Page 42
Page 42 of 47
Only four Accident/Incident ‘Event’ reports have been filed by the NTSB at DTW in the
past ten years, with three of those occurring in 2001. Its most recent safety blemish happened in
January, 2008. As a hub for Northwest Airlines (now merged with Delta), it is not surprising
that this carrier has recorded the largest number of ‘Event’ reports at DTW.
Figure 20: Number of NTSB ‘Events’ at CVG in the past 10 years
number of NTSB Events at CVG in the past decade
Mar
-98
Sep
-98
Nov
-98
Feb
-99
Jan-
05
Oct
-05
0
1
2
Mar-97 Jul-98 Dec-99 Apr-01 Sep-02 Jan-04 May-05 Oct-06
month
num
ber
of N
TS
B A
ccid
ent/I
ncid
ent
Rep
orts
Six NTSB Accident/Incident ‘Event’ reports have been recorded at CVG over the past
decade. The dominant airlines at CVG, Delta and its partner, Comair, have recorded the most
‘Event’ reports of any airline at that facility by far.
Page 43
Page 43 of 47
Figure 21: Number of NTSB ‘Events’ at CLE in the past 10 years
number of NTSB Events at CLE in the last decade
Apr
-01
0
1
2
month
num
ber of N
TSB A
cciden
t/Inc
iden
t
Rep
orts
Figure 21 shows the one NTSB Accident/Incident ‘Event’ report that was reported at
CLE in April, 2001. An American Eagle Airlines flight was responsible for this ‘Event’.
7 Conclusions
The study reveals that despite the devastating act of 11 September 2001 the domestic air travel
demand has gone up while the LOS measures for most of the indicators have fallen during the
last decade. The specific causes for such increase in air travel demand could not be determined
from the BTS and DOT datasets. Another study is needed to find out such causes, which will be
based on surveys of departing and arriving passengers at the airport gates, and surveys of airport
and airlines administrators. Conducting such surveys was beyond the scope of this study.
Therefore, this study could not determine the causes of air travel demand based on fact; however,
the lower air fare due to more competition among many airlines could be attributed to such
demand increase.
Page 44
Page 44 of 47
It is apparent from the study that air travel demand at ORD has crossed the threshold air
infrastructure utilization level while the situation is still under control in four other regional
airports that were considered for this study. Given its huge volume of air traffic, it is not
surprising to see ORD’s performance records among the lowest of the nation’s top 32 airport
facilities and five regional airports of this study. The FAA (2007) has rightly recognized ORD’s
need for upgrades and infrastructure improvements. This study supports the idea that ORD will
need better facilities in the near future. Interestingly, Chicago’s bid to host the 2016 Summer
Olympics may bolster ORD’s upgrade forecast. Of the facilities examined in this report, it
appears that DTW, CVG, and to a lesser extent CLE and TOL are performing well with the
infrastructure already in place. Therefore, this report does not suggest DTW, CVG, CLE, or
TOL as needing immediate expansions or improvements of their infrastructure facilities. The
datum, however, points to the growing concern for ORD and its low LOS.
8 Recommendations
The study finds that ORD is failing to provide satisfactory LOS to its passengers while other
regional airports – DTW, CVG, CLE, and TOL are doing better. The study also finds that DTW
and ORD have same number of runways while ORD is the busiest airport in the nation and one
of the busiest in the world. It appears that ORD is not capable of serving all flights and
passengers with current number of runways and other infrastructure like number of seat space
per passenger and number of gates. It has been consistently providing unsatisfactory LOS in
other aspects like luggage handling, involuntary denial of boarding, passenger complaints, etc.
Therefore, the study recommends that ORD expand its runways by adding few more. It also
recommends that ORD expand its other infrastructure like number of gates and number of seats
Page 45
Page 45 of 47
for passengers. Alternatively, ORD could think of reducing its daily toll of arrival and departure
flights by diverting some to other airports like DTW and Chicago Midway Airport (MDW). The
study does not recommend any further expansion of infrastructure in DTW, CVG, CLE, and
TOL as it stands now. However, these airports may need to add additional infrastructure facilities
in future if the air travel demand further increases in the region.
Page 46
Page 46 of 47
Bibliography
Adrangi, Bahram, Arjun Chatrath, and Kambiz Raffiee. (2001) “The demand for US air transport service: a chaos and non-linearity investigation.” Transportation Research Part E, 27: p. 337 – 353.
Bhadra, Dipasis, and Pamela Texter. (2004) “Airline networks: An econometric framework to
analyze domestic US air travel.” Journal of Transportation and Statistics: 7, 1, 87 – 110. Bureau of Transportation Statistics. (2008) Correia, Anderson R., and S.C. Wirasinghe. (2008) “Analysis of level of service at airport
departure lounges: user perception approach.” Journal of Transportation Engineering, February, p. 105 – 109.
Correia, Anderson R., S.C. Wirasinghe, and Alexandre G. de Barros. (2008) “Overall level of
service measures for airport passenger terminals.” Transportation Research Part A, 42, p. 330 – 346.
Federal Aviation Administration (Marion C. Blakey, Administrator). (2007) “Capacity needs in
the national airspace system 2007 - 2025: an analysis of airports and metropolitan area demand and operational capacity in the future.” FAA.
Gardiner, John, and Stephen Ison. (2008) “The geography of non-integrated cargo airlines: an
international study.” Journal of Transport Geography, 16, p. 55 - 62. Jin, Fengjun, Fahui Wang, and Yu Liu. (2004) “Geographic patterns of air passenger transport
in China 1980-1998: imprints of economic growth, regional inequality, and network development.” The Professional Geographer, 56:4, p. 471 - 487.
Loo, Becky P.Y. (2008) “Passengers' airport choice within multi-airport regions (MARs): some
insights from a stated preference survey at Hong Kong International Airport.” Journal of Transport Geography, 16, p. 117 - 125.
Mazzeo, Michael J. (2003) “Competition and service quality in the US airline industry.” Review
of Industrial Organization, 22, p. 275 – 296. Suzuki, Yoshinori. (2000). “The relationship between on-time performance and airline market
share: a new approach.” Transportation Research Part E: 36, 139 – 154. Tierney, Sean, and Michael Kuby. (2008) “Airline and airport choice by passengers in multi-
airport regions: the effect of Southwest Airlines.” The Professional Geographer, 60:1, p. 15 - 32.
Vowles, Timothy M. (2006) “Geographic perspectives of air transportation.” The Professional
Geographer, 58:1, p. 12 - 19.
Page 47
Page 47 of 47
Wei, Wenbin, and Mark Hansen. (2007) “Airlines' competition in aircraft size and service
frequency in duopoly markets.” Transportation Research Part E, 43, p. 409 – 424. Wei, Wenbin, and Mark Hansen. (2005) “Impact of aircraft size and seat availability on airlines'
demand and market share in duopoly markets.” Transportation Research Part E, 41, p. 315 - 327.