1 TRB 2007 Lianyu Chu * , K S Nesamani + , Hamed Benouar* Priority Based High Occupancy Vehicle Lanes Operation * California Center for Innovative Transportation (CCIT), University of California, Berkeley + Institute of Transportation Studies (ITS), University of California, Irvine TRB 2007
Transcript
1
TRB 2007
Lianyu Chu*, K S Nesamani+, Hamed Benouar*
Priority Based HighOccupancy Vehicle
Lanes Operation
* California Center for Innovative Transportation (CCIT), University of California, Berkeley+ Institute of Transportation Studies (ITS), University of California, Irvine
TRB 2007
2
TRB 2007
Current HOV lane Operation in Southern California
• HOV operations– HOV lane operates 24
hours a day• HOV lane restrictions
– HOV 2+, Buses & Car pools
• HOV lane type– Barrier-separated
• Criticism– Congested during peak
period & underutilize the roadway capacity during off-peak
– Limited ability to shift SOV to transits & Car pools
3
TRB 2007
Alternative Strategies
• Allowing Single occupant Hybrid vehicles in HOV lanes– e.g. California, Virginia
• Part-time HOV operation– e.g. Northern California
• High Occupancy Toll Lanes– Solo drivers can use by
paying toll– e.g. SR-91, I-15, I-10
4
TRB 2007
Priority Based HOV Lane Concept
• Proposed HOV lane operation:– Vehicles are prioritized
based on occupancy, emissions & toll;
– Allows vehicles with a certain priority level based on dynamic traffic conditions
• Purpose:– To optimally utilize the
current HOV lane facility
Priority Level Vehicle Type
6 Bus
5 HOV 4+
4 HOV 3+
3 HOV 2+
2 Hybrids, LEV
1 SOV with toll
0 SOV
• Suggested priority levels
5
TRB 2007
Implementation Strategy
• Operational objective: – Maintain the traveling speed > 45mph (defined by SAFETEA-LU)
• System requirements– Reliable vehicle detection system– Variable message signs– User identification– Automatic payment system– Enforcement
• Determine priority levels based on – Dynamic traffic condition, which is measured by
• Level of service (LOS)• Speed• Throughput
6
TRB 2007
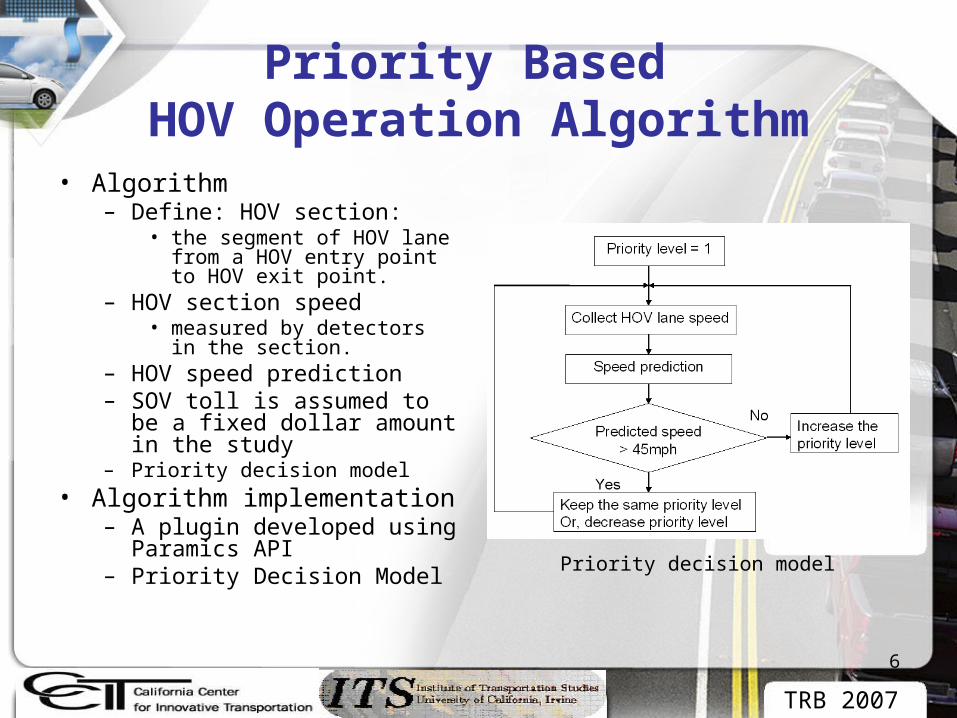
Priority Based HOV Operation Algorithm
• Algorithm– Define: HOV section:
• the segment of HOV lane from a HOV entry point to HOV exit point.
– HOV section speed• measured by detectors in the
section.– HOV speed prediction – SOV toll is assumed to be a
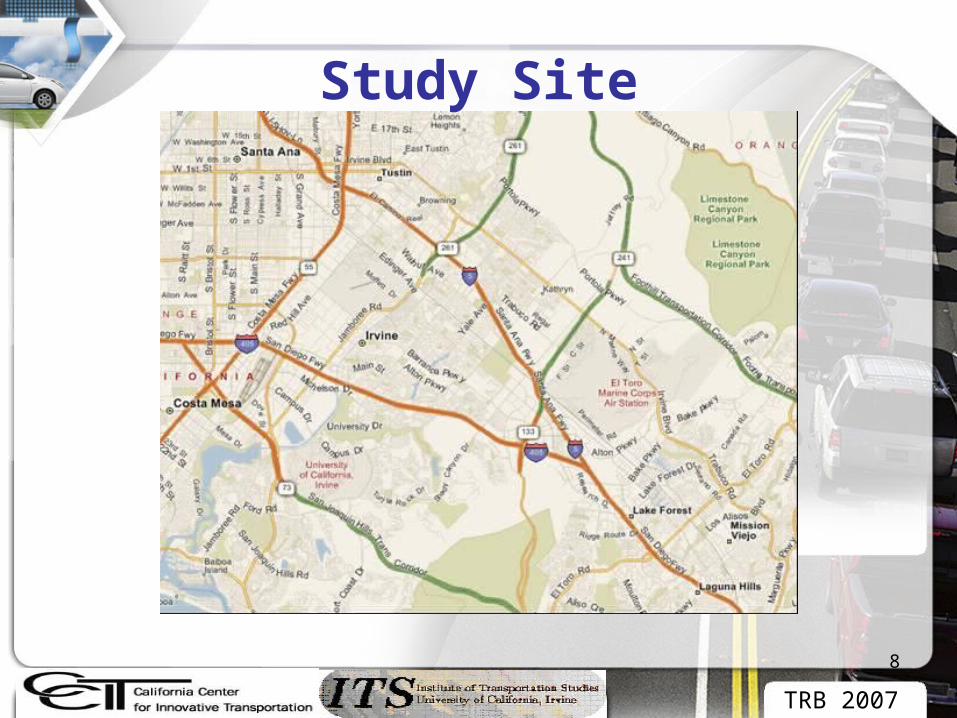
– Located in Orange county, California (freeways)– Including 18-mile I-5, 12-mile I-405, and 10-mile SR-55 freeways
• Simulation model:– Paramics, developed by Quadstone– Model inputs:
• network geometry, • driver behavior, • vehicle characteristics, • demand and • zones
• Simulation model calibration:– Based on a previous study
• Simulation Period:– Morning peak period (6:00 – 8:00)
10
TRB 2007
Simulation Network
11
TRB 2007
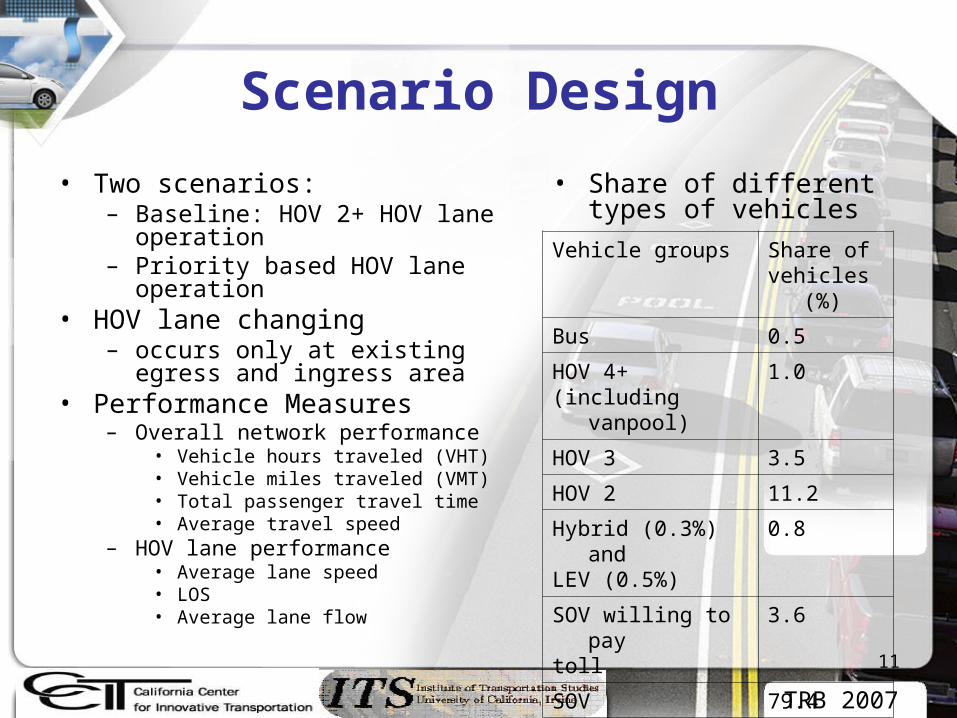
Scenario Design
• Two scenarios:– Baseline: HOV 2+ HOV lane
operation– Priority based HOV lane operation
• HOV lane changing – occurs only at existing egress and
ingress area• Performance Measures
– Overall network performance• Vehicle hours traveled (VHT)• Vehicle miles traveled (VMT)• Total passenger travel time • Average travel speed
– HOV lane performance• Average lane speed• LOS• Average lane flow
Vehicle groups Share of vehicles (%)
Bus 0.5
HOV 4+ (including vanpool)
1.0
HOV 3 3.5
HOV 2 11.2
Hybrid (0.3%) andLEV (0.5%)
0.8
SOV willing to pay toll
3.6
SOV 79.4
• Share of different types of vehicles
12
TRB 2007
Overall Network Performance
0
10
20
30
40
50
60
70
80
Total Passengertravel time (hrs)*10^3
Average TravelSpeed (mph)
Vehicle-milestraveled (VMT)*10^4
Vehicle-hourstraveled (VHT)*10^3
Base Scenario Priority-based Scenario
- Priority based scenario performs better in-terms of speed & travel time
13
TRB 2007
HOV Lane Speeds on Different Corridors
46
48
50
52
54
56
58
60
62
64
I-405N I-405S I-5N I-5S I-55N I-55S
Freeways
Sp
eed
(m
ph
)
Base Scenario Priority-based Scenario
- HOV lane speed in priority based scenario has reduced marginally due to increase in flow
14
TRB 2007
Mainline Speeds on Different Corridors
0
10
20
30
40
50
60
70
I-405N I-405S I-5N I-5S I-55N I-55S
Freeways
Sp
eed
(m
ph
)
Base Scenario Priority-based Scenario
- Mainline speed has increased in priority-based scenarios due to shift of SOV demand to HOV lanes
15
TRB 2007
HOV Flows on Different Corridors
0
200
400
600
800
1000
1200
1400
1600
I-405N I-405S I-5N I-5S I-55N I-55S
Freeways
Vo
lum
e
Base Scenario Priority-based Scenario
- HOV flow throughput has increased in priority-based scenarios
16
TRB 2007
Level of Service on HOV Lanes
0
10
20
30
40
50
60
70
LOS A LOS B LOS C LOS D
Perc
en
tag
e
Base Scenario Priority-based Scenario
- Priority based operation has reduced LOS since it has moved more vehicles to HOV lanes
17
TRB 2007
Time Spent in Different Priority Levels
Freeways
Prioritylevel 1
(%)
Prioritylevel 2
(%)
Prioritylevel 3
(%)
Prioritylevel 4
(%)
Prioritylevel 5
(%)
Prioritylevel 6
(%)
I-405N 79 11 7 2 1 0
I-405S 74 13 5 5 3 0
I-5N 74 12 8 4 2 0
I-5S 78 9 6 4 3 0
SR-55N 99 1 0 0 0 0
SR-55S 76 9 6 5 4 0
Total 80 9.2 5.3 3.3 2.2 0
18
TRB 2007
Findings
• The proposed priority based HOV lane operation performs better:
– Total passenger travel time is improved by 10.3%– Travel speed is improved by 6.78%– HOV lane speed reduces marginally due to increase in flow– Mainline speed increases due to shift of SOV demand to HOV
lanes– HOV flow throughput increases– LOS is improved since more vehicles are moved to HOV lanes
19
TRB 2007
Possible System Solution• Possible system components
– FasTrack • Electronic toll collection system used in California• Each vehicle has a transponder for user identification and payment
– CMS • Placed at proper locations• Showing current priority levels
– Algorithm for determining priority levels• Tradeoff between HOV lane performance & throughput
– Easy to be implemented in a barrier-separate HOV system• e.g. in Southern California
– Enforcement• Camera to identify priority evaders
• Keys to success – Technology– System reliability– Enforcement– Education