Goulias, Kim, and Pribyl 1 A LONGITUDINAL ANALYSIS OF AWARENESS AND USE FOR ADVANCED TRAVELER INFORMATION SYSTEMS Konstadinos G. Goulias * Professor Department of Civil and Environmental Engineering and Director Mid Atlantic Universities Transportation Center The Pennsylvania Transportation Institute The Pennsylvania State University 201 Transportation Research Building University Park, PA 16802 Voice: (814) 863-7053, Fax: (814) 865-3039, E-mail: [email protected]Tae-Gyu Kim Ph.D. Candidate Department of Civil and Environmental Engineering and The Pennsylvania Transportation Institute The Pennsylvania State University 201 Transportation Research Building University Park, PA 16802 Voice: (814) 863-1897, Fax: (814) 865-3039, E-mail:[email protected]Ondrej Pribyl Ph.D. Candidate Department of Civil and Environmental Engineering and The Pennsylvania Transportation Institute The Pennsylvania State University 201 Transportation Research Building University Park, PA 16802 Voice: (814) 863-5493, Fax: (814) 865-3039, E-mail:[email protected]* Corresponding author TRB 2004 Annual Meeting CD-ROM Paper revised from original submittal.
Transcript
Goulias, Kim, and Pribyl
1
A LONGITUDINAL ANALYSIS OF AWARENESS
AND USE FOR ADVANCED TRAVELER
INFORMATION SYSTEMS
Konstadinos G. Goulias*
Professor Department of Civil and Environmental Engineering
and Director
Mid Atlantic Universities Transportation Center The Pennsylvania Transportation Institute
The Pennsylvania State University 201 Transportation Research Building
University Park, PA 16802 Voice: (814) 863-7053, Fax: (814) 865-3039, E-mail: [email protected]
Tae-Gyu Kim Ph.D. Candidate
Department of Civil and Environmental Engineering and The Pennsylvania Transportation Institute
The Pennsylvania State University 201 Transportation Research Building
University Park, PA 16802 Voice: (814) 863-1897, Fax: (814) 865-3039, E-mail:[email protected]
Ondrej Pribyl Ph.D. Candidate
Department of Civil and Environmental Engineering and The Pennsylvania Transportation Institute
The Pennsylvania State University 201 Transportation Research Building
University Park, PA 16802 Voice: (814) 863-5493, Fax: (814) 865-3039, E-mail:[email protected]
* Corresponding author
TRB 2004 Annual Meeting CD-ROM Paper revised from original submittal.
Goulias, Kim, and Pribyl
2
Abstract
In this paper the relationships among technology ownership and availability, Advanced
Traveler Information Systems (ATIS) awareness, and ATIS frequency of use are examined.
The four main media considered are the Internet, television, radio, and telephone/other.
Awareness and use of ATIS through the four media considered here are different for
different users. They also change as household and person characteristics change over
time. Since Information and (tele)Communication Technology (ICT) adoption is changing
rapidly, this has a significant positive effect on Internet based ATIS but not a clearly
negative effect on all other media. The relationship between awareness and use appears to
be non-linear and dependent on the medium considered. Evidence of substitution between
television and Internet and enhancement among other media were also found in this study.
Paper accepted for presentation at the 83rd Annual Transportation Research Board Meeting, January 2004,
and submitted for publication in the Transportation Research Record
TRB 2004 Annual Meeting CD-ROM Paper revised from original submittal.
Goulias, Kim, and Pribyl
3
1. Introduction
Advanced travel information systems (ATIS) are components of a much larger system of
services and technologies that are named “information and (tele)communication
technologies” (ICT). In this paper we adopt the definition provided by Cohen et al. (2002)
which is: “(ICT is) a family of electronic technologies and services used to process, store
and disseminate information, facilitating the performance of information-related human
activities, provided by, and serving the institutional and business sectors as well as the
public-at-large.”
Past research on the relationship between ICT and transportation has moved in two
directions. First, building theoretical frameworks about the relationship between
transportation and ICT. As a result, a variety of interactions between ICT and
transportation systems have been identified and a series of hypotheses have been proposed
(Salomon, 1986, Mokhtarian, 1990 and 2000, Marker and Goulias, 2000, Golledge and
Garling, 2003, Southworth, 2003). Second, motivated by funding for Intelligent
Transportation Systems (ITS) for surface transportation a substantial amount of research
work spanned a wide spectrum of technology assessments. These include economic
valuations (Levinson, 2003), society-wide and industry-wide studies of technology
penetration and mechanisms of adoption (Golob, 2001, Golob and Regan, 2002), and more
focused analyses of behavioral responses to either static or dynamic information (see the
reviews by Golledge, 2002, Cascetta and Kaysi, 2002, and Golledge and Garling, 2003).
However, a gap exists in the literature on a specific aspect of ATIS and its
relationship to travelers: information awareness and use. Before a travel information
benefit on the network can be observed, a traveler needs to: a) own and/or have available
information carrying technologies; b) be aware that travel information is available and it is
useful; c) use this information; and d) change travel behavior in a way that benefits network
flow. In parallel to this traveler stream of actions, we also need to have agencies and
private entities providing information technologies and services. This is a very simplified
view of the ATIS. It is however the basis of this preliminary analysis and it is sketched in
Figure 1.
TRB 2004 Annual Meeting CD-ROM Paper revised from original submittal.
Goulias, Kim, and Pribyl
4
More specifically, in this paper, an analysis of the relationship among ownership of
telecommunications technologies, awareness of travel information, and use of travel
information is presented. The relationship is complex and for this reason, we have
identified a few aspects that are of interest as a starting point and that can be analyzed with
an existing longitudinal database giving us the opportunity to also explore the potential
effect of information technology market penetration. The more specific questions we aim
to answer in this paper are:
What are the patterns of awareness of ATIS services among the four groups of
media/technologies such as television, radio, Internet, and telephone/others?
Are there systematic differences in awareness of ATIS services among population
segments and is awareness changing with technology ownership and availability
change?
What are the patterns of use of ATIS services among the four groups of
media/technologies such as television, radio, Internet, and telephone/others?
Are there systematic differences in the use of ATIS services among population
segments and is the use of ATIS changing when technology ownership and
availability change?
What is the relationship between awareness of services and use of services?
To answer these questions we use a database that was designed to track travel
behavior changes in the Puget Sound region, Seattle and its surroundings, aiming to
represent approximately 3.3 million residents (US Census of 2000). The survey, called the
Puget Sound Transportation Panel (PSTP), started in 1989 and continues today in the four
counties (King, Kitsap, Pierce, and Snohomish) in the Northwest corner of the continental
United States. The data used here are from the period 1997 to 2000 in an initiative to use
PSTP as a “before and after” evaluation tool for new ICT. In this context, the United States
TRB 2004 Annual Meeting CD-ROM Paper revised from original submittal.
Goulias, Kim, and Pribyl
5
Department of Transportation (USDOT) is using PSTP to evaluate the effectiveness of
ATIS as part of its Metropolitan Model Deployment Initiative evaluation program for
SmartTrek, which is a comprehensive traveler information program (see
http://www.smarttrek.org - accessed June 2003). Peirce and Lappin, 2003, were among the
first teams to report data description and first order data analysis about commuters.
In the remainder of the paper we first provide an overview section with background
information about ICT and transportation. Then, the data used here are described. This is
followed by a set of regression models and the findings for each. The paper concludes with
a summary.
2. Background
Advanced traveler information systems (ATIS) are one technology in a very broad
spectrum of ICT that may affect many aspects of daily life including time allocation and
related decisions by a household and its members and the type of goods a household
considers and acquires. ATIS started as one of the many services offered by ITS and over
time expanded beyond the roadside moving into vehicles, offices, and homes (Weilland
and Purser, 2000). This movement took place in all four main media of television, radio,
Internet, and telephone expanding the interaction between transportation and
telecommunications. For this reason, we need a wider and more comprehensive
framework, than the single trip information acquisition and information use framework
adopted by traffic simulation applications (for an overview of these applications see
Mahmassani and Jou, 1998) or the frameworks used in typical ITS deployment plans and
evaluations (JHK et al., 1996, Patten and Goulias, 2001).
Salomon (1986) sketched one such framework where he recognized four possible
effects of ICT on travel and they are: substitution, modification, enhancement, and
neutrality. Substitution means that ICT can actually eliminate trips. Telecommuting,
teleshopping, and teleconferencing, are some examples. Modification indicates ICT can
alter the travel behavior of individuals changing the order of trips (sequencing), the travel
mode, or the timing of the trip (e.g., departure time). From an operations standpoint, this is
particularly important when a shift of commute trips to off-peak hours occurs or a
switching to public transportation and/or car-pooling happens because of ICT use. The
TRB 2004 Annual Meeting CD-ROM Paper revised from original submittal.
Goulias, Kim, and Pribyl
6
third category, enhancement, reflects those trips that would not have been generated
without ICT. For example, when there is more information available for particular
activities, one would expect an increase in the desire to travel and participate in those
activities. Also people are able to save time by better planning of their schedules (thanks to
ICT) and by communicating while traveling. The saved time is often used to make other
trips. The last category, neutrality, reflects those instances of ICT that have no remarkable
effect on travel behavior. There are, however, many gaps in our knowledge about ICT and
transportation interactions that require additional research before policies can be defined in
such a way that ICT can play a significant role in changing travel behavior. Ultimately,
these changes should also benefit the level of service offered by the transportation system.
Mokhtarian (1990) expanded the telecommunications-transportation framework
further and the ideas of substitution, modification, enhancement, and neutrality, served as
the basis for identifying new relationships. Her conceptual framework reflects the impacts
of ICT on travel and contains the reverse causality of the effect of travel on ICT. In one of
the most recent summaries about this interaction, Krizek and Johnson, (2003), map the
terrain of research recognizing the many complexities of interaction. In fact, they agree
with Mokhtarian (1990) that the four relationships discussed in Salomon (1986) are only a
simplification. Krizek and Johnson (2003) expand the Salomon-Mokhtarian framework
one step further considering a triad of dimensions that are: a) nature of the activity pursued
using ICT (borrowing the categorization of subsistence, maintenance, and leisure from
activity analysis in travel behavior); b) the effect of ICT on travel (using the four Salomon
effects); and c) the effect of “subtasks” when pursuing an ICT action. This latter aspect of
multiple activities at a specific destination is also becoming particularly interesting for
research. For example, in many travel diaries we record only one purpose of a trip (e.g.,
shopping) giving, for example, the impression that when we consider a person going
shopping we also expect he/she a) purchased an article at the end of that specific trip; and
b) the reason for traveling is to purchase the article. This may not be true at all or it may be
only partially true. When a person travels to a destination to become aware of a product,
gather information about products, search and browse through a variety of items, and even
socialize with other persons at the shopping center, classifying a trip as just shopping is an
oversimplification. The same happens when one engages in an ICT activity such as
TRB 2004 Annual Meeting CD-ROM Paper revised from original submittal.
Goulias, Kim, and Pribyl
7
searching the Internet. ICT travel aids would then need to be designed in such a way that
they facilitate all these “other tasks” in addition to the purchase of a good or the
identification of a suitable destination. Examples like this expand considerably the aim of
ATIS and go beyond its original design that was for information about travel from an origin
to a destination. In fact, ATIS can now be considered as a set of devices and services that
can affect every aspect of travel and activity participation (see the listing of these aspects in
Arentze and Timmermans, 2000). It is under this conceptual umbrella that ATIS serves as
an additional source of information that can be integrated into the decision-making process
(Golledge and G@rling, 2003) and extends beyond travel to cover all the decisions of
scheduling activities and allocating time to activities and persons. For this reason using
measures of technology ownership as explanatory variables of travel behavior equations as
in Viswanathan and Goulias (2001), may not be sufficient. For example, owners of
personal computers that have also access to the Internet may not know that travel
information is available on the Internet. It is imperative, then, to gain additional
understanding about information technology ownership-availability and ATIS awareness.
It is also important to understand the correlation between experience with these
technologies and changes in awareness about ATIS.
Key in understanding the interaction between telecommunications and
transportation is also understanding the evolution of the technology as discussed for
example in Golob (2001), where evidence concerning the usage of personal computers, the
Internet, mobile phones and other new technologies may indicate there are generational
differences among the users. This can be expanded to include awareness of ATIS in which
different segments of the population may approach the services in different ways. This
may be either due to the time needed to gain familiarity with the new technology or
dismissal of usefulness due to generational and cohort effects. Previous research has
shown that differences in technology ownership affect the perception of ATIS as well as
travel behavior (Golledge 2002). In fact, two of the aspects requiring additional scrutiny
are: a) the relationship between technology ownership and awareness of travel information
that can be reached using this technology; and b) the frequency of information use as a
function of awareness of information availability. Both aspects are central to the paper
here.
TRB 2004 Annual Meeting CD-ROM Paper revised from original submittal.
Goulias, Kim, and Pribyl
8
3. Data Used
PSTP is a “general-purpose” household panel survey in the four-county region that
includes Seattle in the Northwest corner of the United States with approximately 3.3
million residents in the year 2000. In PSTP a household questionnaire and a two-day travel
diary are administered on essentially the same households and their members repeatedly
over time – this regular repetition of observations in a panel is called a wave. PSTP started
in the fall of 1989, it continues until today and averages approximately 1700 households
per year. Each survey contact includes three groups of data that are household
demographics, persons’ social and economic information, and reported travel behavior. In
the travel diary each driving age person reports every trip made during two consecutive
weekdays, which remained approximately the same throughout the panel years. Each trip
contains information about trip purpose, type, mode, starting and ending time, origin and
destination, and distance (the panel’s origin and first analysis are described in Murakami
and Ulberg, 1997, the entire panel has been documented in Goulias and Kim, 2003). For
the analysis in this paper, we used data from waves 7 and 9 containing detailed information
about ICT ownership and use of participants in both waves that provided complete
information for all the variables used in this analysis.
Table 1 shows the number of persons, households, and a few social and
demographic characteristics of the sample. Peirce and Lappin (2003) used a commuter
subsample and they report similar statistics. It also shows travel behavior during the two
interview days in wave 7 (1997) and wave 9 (2000), which are similar to the day-to-day
fluctuations we observed in other PSTP waves (Kim and Goulias, 2003). The bottom third
of Table 1 contains information about technology ownership and use with focus on the
more “modern” technologies. Computer and Internet availability at home are the two
fastest growing technologies. Computers at work appear to be “stabilizing” at 50% of the
sample and Internet at work is increasing but did not reach the ceiling defined by computer
availability at work (today if you do not have a computer you cannot have reliable access to
the Internet – although this is changing rapidly with mobile phone Internet access). Mobile
phone ownership is increasing even faster than computers and the Internet with a possible
impact on pagers. Laptop computers are still reserved for a small sample segment.
TRB 2004 Annual Meeting CD-ROM Paper revised from original submittal.
Goulias, Kim, and Pribyl
9
Table 2 provides an overview of the dependent variables used in the analysis here.
In the year 2000 the first portion of ATIS awareness shows that television and radio are the
two ATIS sources with the highest awareness in the sample with 69.4% and 58.7%
respondents saying they are aware of the possibility to receive travel information using TV
and radio respectively. These are followed by the Internet at 47.2% and the other sources
(14.3%) that include a telephone service by the State’s Department of Transportation. The
frequency of ATIS use reflects this awareness but in a different way within each medium as
the distribution of responses to the frequency of usage questions shows. In fact, the
distribution of respondents as we move to the more frequent use categories is different for
each of the four media with again the television and the radio as the most popular means
for ATIS.
Tables 3 and 4 provide additional information for awareness and use of ATIS by
each medium considered and in combination. Table 3 shows that only 11.9% of the sample
is not aware (or does not consider) at all the availability of travel information and only
6.2% is aware of all four sources. Table 4, however, shows that the non-users of any
medium are 24.5% of the sample and the users of all media constitute a miniscule 2.3% of
the sample. The relationship between the distributions in Tables 3 and 4 is considered in
the next section.
4. Models and Findings
The system of models depicted in figure 1 contains four conditional probability models
representing the degree of awareness for a specific medium as a carrier of ATIS. The
probability that a person is aware that information is available can be written as:
( )ijjij xFyP 1'
11 )1( β== (1)
P is the probability that a person, i, will know that medium j provides travel information
(where j=1 for TV, j=2 for radio, j=3 for Internet, and j=4 for DOT phone & others). The
characteristics of each person such as age, gender, and change in availability and ownership
of technologies are contained in the matrix of values x. In this paper we assume F is the
cumulative normal distribution. The regression coefficients, β1, can be estimated using the
TRB 2004 Annual Meeting CD-ROM Paper revised from original submittal.
Goulias, Kim, and Pribyl
10
typical non-linear regression methods in LIMDEP (or any other software that can estimate
a Probit regression model). Awareness in the data is coded as a 0-1 variable but in real life
individuals are not always perfectly aware or unaware about the availability of information.
To reflect this after estimating the four equations represented by equation 1 we compute the
probability of awareness for each medium and store their values for each observation to be
used as independent variables in the next set of equations.
The models for frequency of information use for each of the four media groups are
based on the assumption that there exists a continuous latent variable *2y representing the
propensity to use a specific medium j to access travel information by a person i:
ijijjij xy 22'2
*2 εβ += (2)
In this case *2y , 2β , and 2ε are not observed. In the data we observe categories of stated
frequency in using travel information (Figure 3). Variable 2y contains these categories. If
we also assume that ε is normally distributed across the observations we obtain the familiar
ordered Probit model.
*2 2
*2 2 1
*2 1 2 2
*2 2 2 3
*2 3 2 4
*2 4 2
0 0
1 02
3
4
5
y if yy if yy if yy if yy if yy if y
µµ µµ µµ µµ
= ≤
= ≤
= ≤
= ≤
= ≤
=
≺
≺
≺
≺
≺
(3)
It is then possible to estimate the probability of answering each of these categories as
functions of explanatory variables such as age, education, employment, income at the
person and household levels but also as functions of the probability of media awareness
from the estimates in equation 1. This can be written as:
TRB 2004 Annual Meeting CD-ROM Paper revised from original submittal.
Goulias, Kim, and Pribyl
11
2 2
2 1 2 2
( 0) 1 ( ' )( 1) ( ' ) ( ' )
...
P y xP y x x
βµ β β
= = − Φ= = Φ − − Φ − (4)
the βs, and µs are estimated by a regression software together with estimates of their
standard errors. One or more of the xs in equation 4 can be the estimated probability
functions from equation 1. In this way by taking the partial derivative of each probability
in equation 4 with respect to the predicted probability of awareness (these derivatives are
called marginal effects – Greene, 2000) we can obtain an estimate of possible increase in
using information as a function of the probability of awareness about a medium.
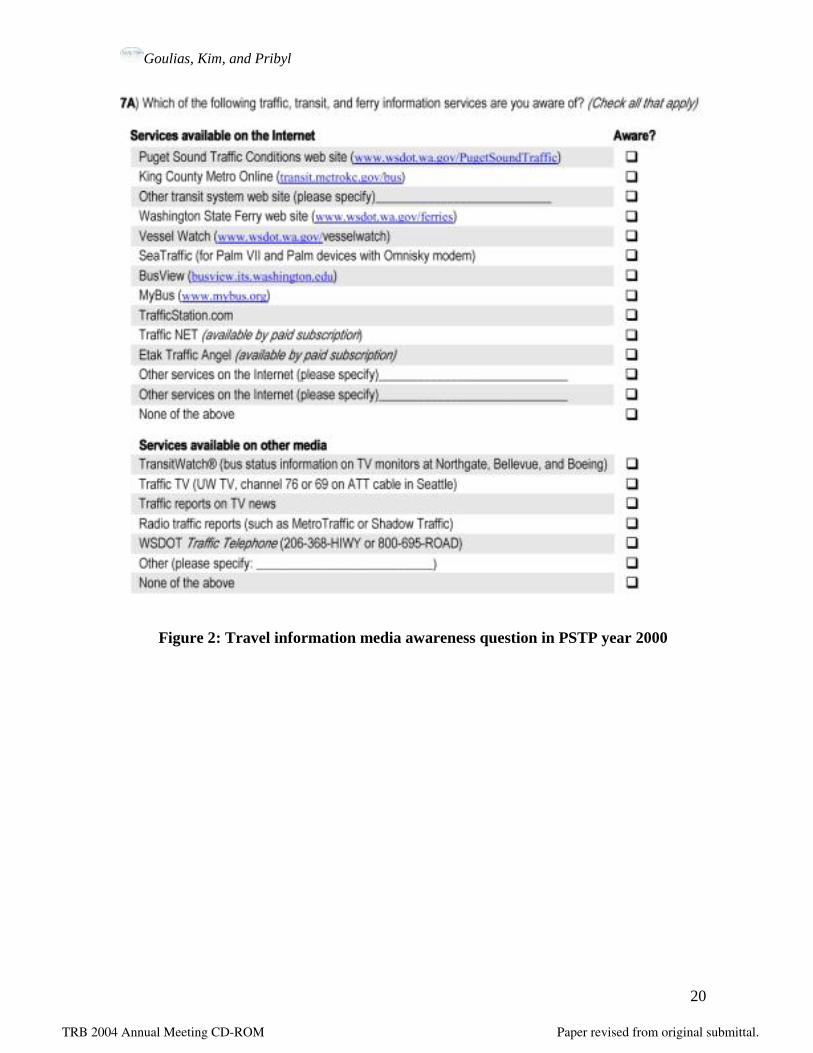
4.1. Awareness models The dependent variable in these models was built from the answers to the awareness
question in the personal “attitudes” component of the PSTP questionnaire. Figure 2 shows
the question format. Each respondent selected multiple items and the answers were
recorded in a series of variables in the database that were then post-processed to yield the
four dependent variables used here. Table 5 contains a list of the independent variables
used in the model specification and Table 6 contains the four awareness models estimated
for this paper.
One of the most interesting of the four models based on equation 1 is the awareness
about Internet services for travel information. In PSTP household selection for inclusion
attempted to over-sample the households with a somewhat higher frequency in using transit
and as the model indicates that portion of the sample is also more likely to know there is
travel information on the Internet. The negative and significantly different than zero
coefficients for Pierce and Snohomish counties indicate there are different patterns of
knowledge about information availability among the residents of the four counties in the
Puget Sound region. In addition, income does not seem to play a significant role in
awareness although the dummy variable for medium income is included in this model and
it is positive demonstrating a higher propensity to know about Internet services for this
group of persons. As expected older individuals are less likely to be aware of travel
information availability on the Internet and persons employed as professionals are more
likely to be aware than their counterparts that are employed in other occupations.
TRB 2004 Annual Meeting CD-ROM Paper revised from original submittal.
Goulias, Kim, and Pribyl
12
The next block of explanatory variables in this model examines the effect of social
and demographic changes in the household. A decrease in the number of children (e.g., by
leaving the nest) and a decrease in car ownership also show a lower likelihood of
awareness. One explanation for this could be the roles younger individuals play in the
household as carriers of information and when they leave the nest awareness of information
decreases. A change in occupation appears to increase the probability of awareness.
Similarly, a decrease in the driver’s licenses in the household is also more likely to increase
the probability of awareness. This is presumably due to an increase in the need to seek
information. All these changes, however, may be indicative of other more complex
rearrangements of information exchange within a household but also of changes in activity
tasks within the household and changes in the role played by each person in contributing to
other persons’ awareness.
Another block of variables examines the effect of changes in ICT
ownership/availability. Persons that either had access to the Internet and/or continue to
have access in 2000 are also the persons with the highest probability of awareness.
Interestingly, persons that did not have access to the Internet at home in 1997 but they have
access in 2000 are also more likely to be aware of the information but at lower levels than
their more experienced counterparts that had access in both interview occasions. Overall,
ownership and availability of computers at home and work and availability of Internet at
home and work have a strong positive effect on information awareness and this effect is
expected to spread in the population mainly because of the increases in computer
ownership at home and Internet availability at home and work. Mobile communication
technologies have a similar effect on awareness as the positive and large coefficients show.
In fact, new users of wireless telephony seem to also be the persons with elevated
awareness. However, the very small segment of pager users appear to also be more likely
to have high awareness of information availability on Internet.
The other three awareness models do not fit the data as well as the Internet model
and this may be due to three possible reasons: a) awareness is randomly distributed in the
population with no clear systematic tendencies; b) the explanatory variables in these model
specifications may not be sufficient in explaining the awareness variation; and c) the
question in Figure 2 should have been more detailed to function as a memory trigger.
TRB 2004 Annual Meeting CD-ROM Paper revised from original submittal.
Goulias, Kim, and Pribyl
13
However, the explanatory variables used in these three models appear to have reasonable
signs and provide similar insights to the Internet model.
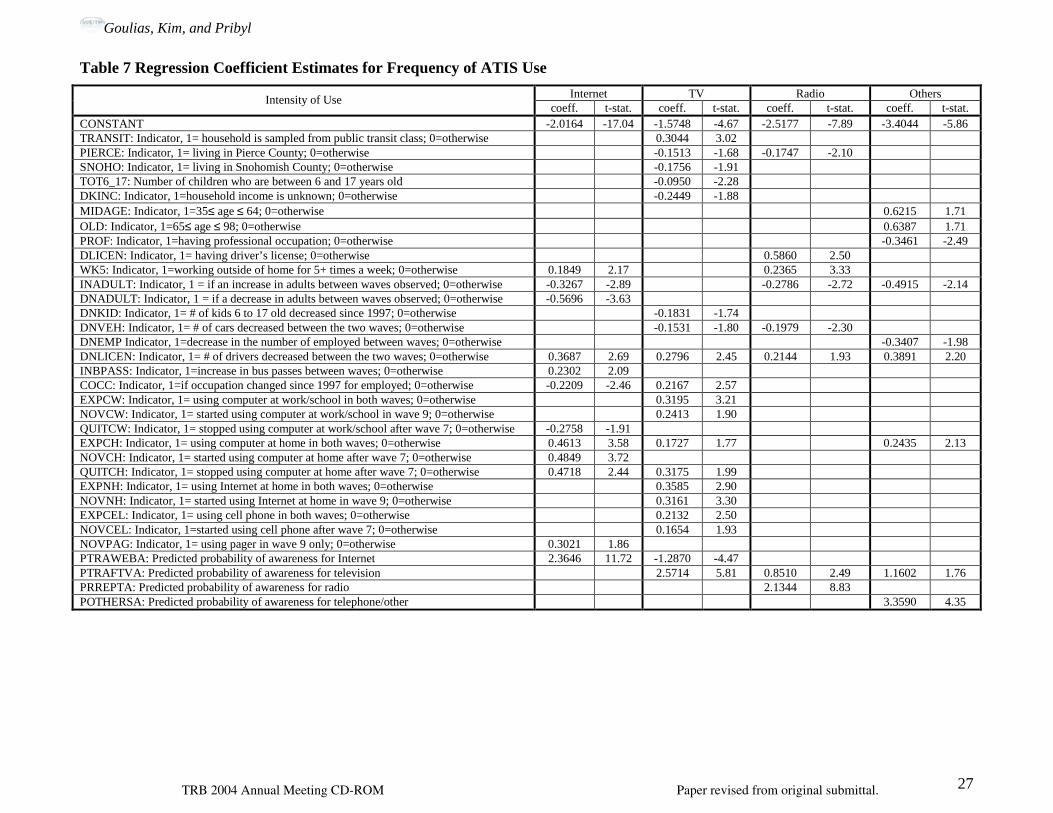
4.2. Frequency of information use models The dependent variables in this section are the summaries of the answers in the questions
displayed by Figure 3. They are organized in the four groups of media as explained in the
previous sections. Tables 7 and 8 contain the estimation results of the four ordered Probit
models. The frequency of using the Internet is characterized by a substantial number of
occasional users. In fact 19.1% accessed ATIS once or twice and never again. As the
regression coefficients show, however, persons working five days a week are more likely to
use the service (both the Internet and radio) more frequently. In addition, a change in the
number of adults (an increase or a decrease for the Internet and increases for radio and
telephone/other) and a change in occupation (for telephone/other) have an inhibiting effect
on the frequency of ATIS use. In contrast, a decrease in the number of drivers (for all
media) in the household has the opposite effect. Similarly, an increase in the number of
bus passes (for the Internet) is also increasing the use of information. In summary, changes
in social, economic, and demographic characteristics of a household have significant
influence on the use of information in different ways among the four media considered
here.
In terms of availability and ownership of computers, a loss of computer access
shows opposite effects for home and work. Recalling that technology ownership is also an
explanatory variable in the awareness equations, this may be also due to correlation with
the awareness probability, which has a very strong (β=2.365) positive and significant
effect. As mentioned earlier the marginal effects (partial differential of the probability to
use a service with a given amount of frequency with respect to the probability of being
aware of ATIS’ existence in a given medium) were also computed here and presented in
Tables 9 and 10. As expected and shown by the marginal effects, a large decrease for the
probability of not using Internet for ATIS is expected for a unit increase in the awareness
probability (the derivative is –0.8042). For the probability associated with using the
service rarely, awareness has a strong positive effect, which is attenuating as we move to
TRB 2004 Annual Meeting CD-ROM Paper revised from original submittal.
Goulias, Kim, and Pribyl
14
more frequent use. The positive values of the derivative appear to follow the frequency of
response but in a non-linear fashion.
An interesting indication is also provided by the fourth column of Table 7
containing the regression coefficients for the frequency of ATIS use by TV. In that model
as the probability of awareness for TV-based ATIS services increases the probability of
using the service also increases as expected. However, as the awareness of ATIS services
on the Internet increases the frequency of using TV decreases. This is an indication of
potential substitution between the Internet and television as a travel information service.
Comparing this to the sixth column of the same table in which the two positive coefficients
in correspondence of PTRAFTVA and PRREPTA indicate that radio and TV have a
complementary mutual strengthening effect (enhancement). As awareness of both
increases, the use of radio as an ATIS source also increases. The same happens for the
“other” category (telephone by DOT and all other). Most likely the TV is also a medium
that helps the use of all other media except the Internet, which appears to be in direct
competition with a TV based ATIS.
5. Summary
In this paper using panel data we have performed a preliminary analysis of patterns of ICT
adoption by the panel participants, awareness of ATIS services on television, radio, the
Internet, and telephone/other media, and frequency of using these sources as ATIS.
The fastest growing ICT are the home-based that have a practical ceiling equal to
the number of computer users in the household. Wireless telephony use is also on the rise
in this sample during the period 1997 to 2000. A small portion of the entire sample
(11.9%) is not aware at all that travel information is available in the communication media
and an even smaller portion is aware that information is available in all of the four groups
considered here (6.2%). In contrast, the non-users of any medium are 24.5% of the sample
and the users of all the media is a very small portion (2.3%) of the sample.
There are significant differences among the four groups of media with a clearly
strong potential for Internet awareness increasing over time driven by increases in Internet
access at home and work and increases in personal computer availability at home. In
addition changes in the social and demographic situations of households have significant
TRB 2004 Annual Meeting CD-ROM Paper revised from original submittal.
Goulias, Kim, and Pribyl
15
effects on awareness about ATIS on the Internet. Less clear, however, is the potential for
change in awareness about other media. The increase of technology availability sometimes
has a positive effect on awareness about ATIS in other media and sometimes negative.
Overall, however, it appears we have groups of persons that are systematically more aware
about ATIS in all the media and these segments appear to be growing.
The frequency of information use is clearly influenced by awareness with a notable
indication of competition (substitution) between television and the Internet and a
complementary relationship between television and the other two media (radio and
telephone) and neutrality among all others. Ownership of Internet at home and wireless
telephony are also two technological “species” that contribute positively to using TV for its
ATIS services.
The effect of increases (positive change) and decreases (negative change) of a
variety of household and personal variables is not symmetrical and not consistently the
same among the four media studied here. Similar indications are also offered by the
technology ownership and availability changes between 1997 and 2000.
Acknowledgments
The authors are grateful to Neil Kilgren at the Puget Sound Regional Council for his
ongoing support with the data in the Puget Sound Transportation Panel. Funding was
provided by the Mid-Atlantic Universities Transportation Center, the region III US DOT
University Transportation Center at the Pennsylvania State University. An earlier version
of this paper was presented at the Euroworkshop on “Behavioural Responses to ITS”
organized by the European Institute of Retailing and Services Studies (EIRASS) and
sponsored by the European Community. Valuable comments and suggestions for
improvements that were provided by three anonymous reviewers of TRB committee
A3B08 are also gratefully acknowledged.
TRB 2004 Annual Meeting CD-ROM Paper revised from original submittal.
Goulias, Kim, and Pribyl
16
References
Arentze, T.A., and H.J.P. Timmermans (2000) Albatross: A Learning-Based Transportation Oriented Simulation System. European Institute of Retailing and Services Studies. Eindhoven, The Netherlands. Cascetta E. and I. A. Kaysi (2002) Research into ATIS Behavioral Response: Areas of Interest and Future Perspectives. In In Perpetual Motion, Travel Behavior Research Opportunities and Application Challenges (editor by H. Mahmassani). Pergamon, Amsterdam, NL, pp. 127-140. Cohen, G., I. Salomon, and P. Nijkamp (2002) Information-communications technologies (ICT) and transport: does knowledge underpin policy? Telecommunications Policy 26, pp 31-52. Golledge R. (2002) Dynamics and ITS: Behavioral Responses to Information Available from ATIS. In In Perpetual Motion, Travel Behavior Research Opportunities and Application Challenges (editor by H. Mahmassani). Pergamon, Amsterdam, NL, pp 81-126. Golledge, R.G., and T. Garling (2003) spatial Behavior in Transportation Modeling and Planning. In Transportation Systems Planning: Methods and Applications. (editor Goulias, K.G). CRC Press, Boca Raton, FL, pp 3.1-3.27. Golob, T.F. (2001), Travelbehaviour.com: Activity Approaches to Modeling the Effects of Information Technology on Personal Travel Behaviour, in Travel Behavior Research, The Leading Edge, D. Hensher, Editor. 2001, Elsevier Science/ Pergamon: Kidlington, Oxford, pp 145-184. Golob T.F. and A. C. Regan (2002) Trucking industry adoption of information technology: a multivariate discrete choice model, Transportation Research C, 10(3), pp 205-228. Goulias K.G. and T. Kim (2003) Analysis of the Puget Sound Transportation Panel Survey Database in Waves 1-9 Draft Final Report. Submitted to the Puget Sound Regional Council. Seattle, WA. Greene W. H. (2000) Econometric Analysis, Fourth Edition. Prentice Hall, Upper Saddle River, NJ. JHK & Associates, Clough, Harbour & Associates, Pennsylvania Transportation Institute, and Bogart Engineering (1996) Scranton/Wilkes-Barre Area Strategic Deployment Plan. Final Report. Prepared for Pennsylvania Department of Transportation District 4-0. August 1996, Berlin, CT. pages 143.
TRB 2004 Annual Meeting CD-ROM Paper revised from original submittal.
Goulias, Kim, and Pribyl
17
Kim T. and K. G. Goulias (2003) Travel behavior changes: Evidence from a longitudinal travel survey. Paper to be presented at the Urban Transport 2003 International Conference and accepted for inclusion in the conference proceedings, March 2003, Crete, Greece. Krizek, K.J., and A. Johnson.(2003) Mapping of the terrain of information and communications technology (ICT and household travel, Transportation Research Board annual meeting CD-ROM, Washington, DC., January 2003. Levinson D. (2003) The value of advanced traveler information systems for route choice, Transportation Research C, 11(1), pp 75-87. Mahmassani H. and R. Jou (1998) Bounded rationality in commuter decision dynamics: Incorporating trip chaining in departure time and route switching decisions. In Theoretical foundations of travel choice modeling (eds Garling, Laitila, and Westin). Pergamon, Amsterdam, pp. 201-229. Marker J. T. and Goulias K.G. (2000) Framework for the analysis of grocery teleshopping. Transportation Research Record, 1725, pp.1-8. Mokhtarian, P.L. (2000) Telecommunications and Travel, in Transportation and the New Millenium. Transportation Research Board: Washington DC. Mokhtarian, P.L. (1990) A Typology of Relationships Between Telecommunications and Transportation. Transportation Research A. 24(3): pp 231-242. Peirce S. and J. Lappin (2003) Evolving awareness, use, and opinions of Seattle region commuters concerning traveler information: Findings from the Puget Sound Transportation Panel survey, 1997 and 2000. Paper included in the 2003 TRB Annual Meeting CD ROM proceedings, Washington D.C. Patten, M. L. and K. G. Goulias (2001) Test Plan: Motorist Survey - Evaluation of the Pennsylvania Turnpike Advanced Travelers Information System (ATIS) Project, Phase III PTI-2001-23-I. April 2001. University Park, PA. Salomon, I. (1986) Telecommunication and travel relationships: A review. Transportation Research, Part A, 20(3), pp 223-238. Southworth F. (2003) Freight transportation planning: Models and methods. In Transportation Systems Planning: Methods and Applications. (editor Goulias, K.G). CRC Press, Boca Raton, FL, pp 4.1-4.29. Viswanathan K. and K. G. Goulias (2001) Travel behavior implications of information and communications technology (ICT) in Puget Sound region. Transportation Research Record, 1752, pp. 157-165.
TRB 2004 Annual Meeting CD-ROM Paper revised from original submittal.
Goulias, Kim, and Pribyl
18
Weiland R.J. and L.B. Purser (2000) Intelligent Transportation Systems. In Transportation in the New Millennium. State of the Art and Future Directions. Perspectives from Transportation Research Board Standing Committees. Transportation Research Board. National Research Council. The National Academies, Washington, D.C. Pages 6. (Also in http://nationalacademies.org/trb/).
TRB 2004 Annual Meeting CD-ROM Paper revised from original submittal.
Goulias, Kim, and Pribyl
19
Predicted probabilities as explanatory variables
Frequency of Usage of ATIS
RadioTV Internet DOTphone
Awareness of ATIS
RadioTV Internet DOTphone
Changes in socio-demographic
characteristics
Exogenous factorsSocio-
demographic characteristics
Technology ownership
Changes in technology ownership
Predicted probabilities as explanatory variables
Frequency of Usage of ATIS
RadioTV Internet DOTphoneDOTphone
Awareness of ATIS
RadioTV Internet DOTphoneDOTphone
Changes in socio-demographic
characteristics
Exogenous factorsSocio-
demographic characteristics
Technology ownership
Changes in technology ownership
Figure 1: The principle relationships we are trying to reflect in the model
TRB 2004 Annual Meeting CD-ROM Paper revised from original submittal.
Goulias, Kim, and Pribyl
20
Figure 2: Travel information media awareness question in PSTP year 2000
TRB 2004 Annual Meeting CD-ROM Paper revised from original submittal.
Goulias, Kim, and Pribyl
21
Figure 3: Stated use of travel information and media question in PSTP year 2000
TRB 2004 Annual Meeting CD-ROM Paper revised from original submittal.
Goulias, Kim, and Pribyl
22
Table 1 A selection of sample characteristics
Characteristics Wave 7 (1997)
Wave 9 (2000)
Number of persons in the sample 1283 1283 Number of households in the sample 804 804 Percent of males in the sample 46.3 46.3 Number of persons in household 2.6 2.5 Number of cars per household 2.2 2.2 Number of employed persons in the sample 755 782
Day 1 4.6 4.1 Number of trips per day Day 2 4.3 4.0 Day 1 2.5 (58.3) 2.3 (60.6) Number of trips driving
alone per person (%) Day 2 2.4 (58.4) 2.3 (59.8) Day 1 2.0 (41.7) 1.8 (39.4) Number of trips by all other
modes per person (%) Day 2 1.9 (41.6) 1.7 (40.2) Day 1 432.4 382.3 Total amount of time in
activities (min.) Day 2 416.7 373.1 Day 1 85.2 74.6 Total amount of time
traveling (min.) Day 2 79.4 75.4 At home 662 868 Computer availability At work 623 642 At home 414 792 Internet availability At work 386 493
Laptop ownership 60 72 * % over total number of trips per person
TRB 2004 Annual Meeting CD-ROM Paper revised from original submittal.
Goulias, Kim, and Pribyl
23
Table 2 Frequencies of the dependent variables in wave 9 (sample size=1283)
Variable TV (%) Radio(%) Internet(%) DOT phone
& others(%)
Awareness of ATIS (yes=1) 891 (69.4) 753 (58.7) 606 (47.2) 183 (14.3) Never used 586 (45.7) 682 (53.2) 847 (66.0) 1188 (92.6)
Only once or twice 178 (13.9) 101 (7.9) 246 (19.2) 59(4.6) 1 to 3 times per month 151 (11.8) 140 (10.9) 105 (8.2) 15 (1.2) 1 to 2 times per week 87 (6.8) 98 (7.6) 47 (3.7) 7 (0.5) 3 to 5 times per week 124 (9.7) 117 (9.1) 22 (1.7) 3 (0.2)
Frequency of ATIS use
5+ times per week 157 (12.2) 145 (11.3) 16 (1.2) 11 (0.9)
Table 3 Awareness of ATIS service for each medium considered
TRB 2004 Annual Meeting CD-ROM Paper revised from original submittal.
Goulias, Kim, and Pribyl
24
Table 4 Use of ATIS service for each medium considered
Television No Yes
DOT phone & Others DOT phone & Others Use of ATIS Services
By medium No Yes No Yes
Total
No 314 (24.5%)
8 (0.6%)
169 (13.2%)
18 (1.4%)
509 (39.7%) No Radio
Yes 85 (6.6%)
4 (0.3%)
229 (17.8%)
20 (1.6%)
338 (26.3%)
847 (66.0%)
No 99 (7.7%)
3 (0.2%)
66 (5.1%)
5 (0.4%)
173 (13.5%)
Internet
Yes Radio Yes 65
(5.1%) 8
(0.6%) 161
(12.5%) 29
(2.3%) 263
(20.5%)
436 (34.0%)
563 (43.9%)
23 (1.8%)
625 (48.7%)
72 (5.6%) Total 586
(45.7%) 697
(54.3%)
1283 (100.0%)
TRB 2004 Annual Meeting CD-ROM Paper revised from original submittal.
Goulias, Kim, and Pribyl
25
Table 5 Variables used in this study TRANSIT Indicator, 1= household is sampled from public transit class; 0=otherwise CAR1 Indicator, 1= one car household; 0=otherwise CAR2 Indicator, 1= two car household; 0=otherwise KING Indicator, 1= living in King County; 0=otherwise KITSAP Indicator, 1= living in Kitsap County; 0=otherwise PIERCE Indicator, 1= living in Pierce County; 0=otherwise SNOHO Indicator, 1= living in Snohomish County; 0=otherwise TOT1_5 Number of children who are less than 6 years old TOT6_17 Number of children who are between 6 and 17 years old DNKID Indicator, 1= the number of kids 6 and 17 old decreased between the two
waves; 0=otherwise DNLICEN Indicator, 1= the number of drivers decreased between the two waves;
0=otherwise INADULT Indicator, 1 = if an increase in adults between waves observed; 0=otherwise DNADULT Indicator, 1 = if a decrease in adults between waves observed; 0=otherwise INBABY Indicator, 1=household with more children < 6 years in wave 9; 0=otherwise INBPASS Indicator, 1=increase in bus passes between waves; 0=otherwise MIDINC Indicator, 1= $35,000 ≤ household income < $75,000; 0=otherwise DKINC Indicator, 1=household income is unknown; 0=otherwise DNVEH Indicator, 1= the number of cars decreased between the two waves; 0=otherwise
Hou
seho
ld le
vel
DNEMP Indicator, 1=decrease in the number of employed between waves; 0=otherwise MALE Indicator, 1=male; 0=female YOUNG Indicator, 1=18≤ age ≤ 34; 0=otherwise MIDAGE Indicator, 1=35≤ age ≤ 64; 0=otherwise OLD Indicator, 1=65≤ age ≤ 98; 0=otherwise DLICEN Indicator, 1= having driver’s license; 0=otherwise WK5 Indicator, 1=working outside of home for 5+ times a week; 0=otherwise SECRE Indicator, 1=having secretarial occupation; 0=otherwise PROF Indicator, 1=having professional occupation; 0=otherwise EXPEMP Indicator, 1=if employed outside home in both waves; 0=otherwise NOVEMP Indicator, 1= if employed outside home in wave 9 only; 0=otherwise QUITEMP Indicator, 1= if employed outside home in wave 7 but not wave 9;0=otherwise COCC Indicator, 1=if occupation changed between the two waves for employed;
0=otherwise PTRAWEBA Predicted probability of awareness for Internet PTRAFTVA Predicted probability of awareness for television PRREPTA Predicted probability of awareness for radio
Pers
on le
vel
POTHERSA Predicted probability of awareness for telephone/other EXPCW Indicator, 1= using computer at work/school in both waves; 0=otherwise NOVCW Indicator, 1= started using computer at work/school in wave 9; 0=otherwise QUITCW Indicator, 1= stopped using computer at work/school after wave 7; 0=otherwise EXPCH Indicator, 1= using computer at home in both waves; 0=otherwise NOVCH Indicator, 1= started using computer at home after wave 7; 0=otherwise QUITCH Indicator, 1= stopped using computer at home after wave 7; 0=otherwise EXPNW Indicator, 1= using Internet at work/school in both waves; 0=otherwise NOVNW Indicator, 1= started Internet at work/school in wave 9; 0=otherwise QUITNW Indicator, 1= stopped Internet at work/school after wave 7; 0=otherwise EXPNH Indicator, 1= using Internet at home in both waves; 0=otherwise NOVNH Indicator, 1= started using Internet at home in wave 9; 0=otherwise QUITNH Indicator, 1= stopped using Internet at home after wave 7; 0=otherwise QUITLAP Indicator, 1= using laptop computer in wave 7 only; 0=otherwise EXPCEL Indicator, 1= using cell phone in both waves; 0=otherwise NOVCEL Indicator, 1=started using cell phone after wave 7; 0=otherwise QUITCEL Indicator, 1= using cell phone in wave 7 only; 0=otherwise EXPPAG Indicator, 1= using pager in both waves; 0=otherwise NOVPAG Indicator, 1= using pager in wave 9 only; 0=otherwise
Info
rmat
ion
and
Com
mun
icat
ion
Tech
nolo
gy
QUITPAG Indicator, 1= using pager in wave 7 only; 0=otherwise
TRB 2004 Annual Meeting CD-ROM Paper revised from original submittal.
Goulias, Kim, and Pribyl
26
Table 6 Model Estimates for Awareness of ATIS Internet TV Radio Others Awareness
Coeff. t-stat. Coeff. t-stat. Coeff. t-stat. coeff. t-stat. CONSTANT -0.9774 -8.10 0.4073 2.02 -0.1937 -2.57 -1.1800 -11.73 TRANSIT: Indicator, 1= household is sampled from public transit class; 0=otherwise 0.4339 4.12 -0.2152 -2.29 KITSAP: Indicator, 1= living in Kitsap County; 0=otherwise -0.3442 -3.05 -0.3498 -3.07 -0.6380 -3.45 PIERCE: Indicator, 1= living in Pierce County; 0=otherwise -0.3682 -3.56 SNOHO: Indicator, 1= living in Snohomish County; 0=otherwise -0.4032 -3.81 TOT1_5: Number of children who are less than 6 years old 0.3866 3.75 TOT6_17: Number of children who are between 6 and 17 years old -0.0937 -2.16 -0.1271 -2.21 CAR1: Indicator, 1= one car household; 0=otherwise -0.2441 -2.40 CAR2: Indicator, 1= two car household; 0=otherwise 0.2094 2.32 MIDINC: Indicator, 1= $35,000 ≤ household income < $75,000; 0=otherwise 0.1552 1.89 MIDAGE: Indicator, 1=35≤ age ≤ 64; 0=otherwise 0.3399 3.97 0.2483 2.43 OLD: Indicator, 1=65≤ age ≤ 98; 0=otherwise -0.3315 -2.95 PROF: Indicator, 1=having professional occupation; 0=otherwise 0.3169 3.17 SECRE: Indicator, 1=having secretarial occupation; 0=otherwise -0.2845 -1.92 DLICEN: Indicator, 1= having driver’s license; 0=otherwise 0.3407 1.68 DNADULT Indicator, 1 = if a decrease in adults between waves observed; 0=otherwise -0.4273 -3.54 DNKID Indicator, 1= # of kids 6 to 17 old decreased since 1997; 0=otherwise -0.3527 -2.80 INBABY: Indicator, 1=household with more children < 6 years in wave 9; 0=otherwise 0.4567 2.07 DNVEH: Indicator, 1= # of cars decreased between the two waves; 0=otherwise -0.2406 -2.28 INBPASS: Indicator, 1=increase in bus passes between waves; 0=otherwise -0.3848 -2.41 COCC: Indicator, 1=if occupation changed since 1997 for employed; 0=otherwise 0.2717 2.71 DNLICEN: Indicator, 1= # of drivers decreased between the two waves; 0=otherwise 0.3025 2.36 EXPCW: Indicator, 1= using computer at work/school in both waves; 0=otherwise 0.2471 2.06 0.3585 4.05 NOVCW: Indicator, 1= started using computer at work/school in wave 9; 0=otherwise 0.3991 2.77 0.2450 1.81 QUITCW: Indicator, 1= stopped using computer at work/school after wave 7; 0=otherwise 0.3341 2.18 0.3318 2.22 EXPCH: Indicator, 1= using computer at home in both waves; 0=otherwise 0.2663 2.46 QUITCH: Indicator, 1= stopped using computer at home after wave 7; 0=otherwise -0.3673 -2.21 EXPNW: Indicator, 1= using Internet at work/school in both waves; 0=otherwise 0.4700 3.84 QUITNW: Indicator, 1= stopped Internet at work/school after wave 7; 0=otherwise 0.3401 1.97 EXPNH: Indicator, 1= using Internet at home in both waves; 0=otherwise 0.5588 4.04 NOVNH: Indicator, 1= started using Internet at home in wave 9; 0=otherwise 0.4519 4.29 -0.1493 -1.85 -0.2296 -2.30 QUITNH: Indicator, 1= stopped using Internet at home after wave 7; 0=otherwise 0.7924 3.00 -0.8631 -3.36 -0.7690 -1.71 EXPCEL: Indicator, 1= using cell phone in both waves; 0=otherwise 0.1971 1.96 0.2484 2.72 0.2614 2.97 NOVCEL: Indicator, 1=started using cell phone after wave 7; 0=otherwise 0.3104 3.07 QUITCEL: Indicator, 1= using cell phone in wave 7 only; 0=otherwise 0.3490 1.86 EXPPAG: Indicator, 1= using pager in both waves; 0=otherwise 0.5424 2.65 0.3441 1.84 QUITPAG: Indicator, 1= using pager in wave 7 only; 0=otherwise -0.4259 -2.67 QUITLAP: Indicator, 1= using laptop computer in wave 7 only; 0=otherwise -0.4221 -1.84
TRB 2004 Annual Meeting CD-ROM Paper revised from original submittal.
Goulias, Kim, and Pribyl
27
Table 7 Regression Coefficient Estimates for Frequency of ATIS Use Internet TV Radio Others Intensity of Use
coeff. t-stat. coeff. t-stat. coeff. t-stat. coeff. t-stat. CONSTANT -2.0164 -17.04 -1.5748 -4.67 -2.5177 -7.89 -3.4044 -5.86 TRANSIT: Indicator, 1= household is sampled from public transit class; 0=otherwise 0.3044 3.02 PIERCE: Indicator, 1= living in Pierce County; 0=otherwise -0.1513 -1.68 -0.1747 -2.10 SNOHO: Indicator, 1= living in Snohomish County; 0=otherwise -0.1756 -1.91 TOT6_17: Number of children who are between 6 and 17 years old -0.0950 -2.28 DKINC: Indicator, 1=household income is unknown; 0=otherwise -0.2449 -1.88 MIDAGE: Indicator, 1=35≤ age ≤ 64; 0=otherwise 0.6215 1.71 OLD: Indicator, 1=65≤ age ≤ 98; 0=otherwise 0.6387 1.71 PROF: Indicator, 1=having professional occupation; 0=otherwise -0.3461 -2.49 DLICEN: Indicator, 1= having driver’s license; 0=otherwise 0.5860 2.50 WK5: Indicator, 1=working outside of home for 5+ times a week; 0=otherwise 0.1849 2.17 0.2365 3.33 INADULT: Indicator, 1 = if an increase in adults between waves observed; 0=otherwise -0.3267 -2.89 -0.2786 -2.72 -0.4915 -2.14 DNADULT: Indicator, 1 = if a decrease in adults between waves observed; 0=otherwise -0.5696 -3.63 DNKID: Indicator, 1= # of kids 6 to 17 old decreased since 1997; 0=otherwise -0.1831 -1.74 DNVEH: Indicator, 1= # of cars decreased between the two waves; 0=otherwise -0.1531 -1.80 -0.1979 -2.30 DNEMP Indicator, 1=decrease in the number of employed between waves; 0=otherwise -0.3407 -1.98 DNLICEN: Indicator, 1= # of drivers decreased between the two waves; 0=otherwise 0.3687 2.69 0.2796 2.45 0.2144 1.93 0.3891 2.20 INBPASS: Indicator, 1=increase in bus passes between waves; 0=otherwise 0.2302 2.09 COCC: Indicator, 1=if occupation changed since 1997 for employed; 0=otherwise -0.2209 -2.46 0.2167 2.57 EXPCW: Indicator, 1= using computer at work/school in both waves; 0=otherwise 0.3195 3.21 NOVCW: Indicator, 1= started using computer at work/school in wave 9; 0=otherwise 0.2413 1.90 QUITCW: Indicator, 1= stopped using computer at work/school after wave 7; 0=otherwise -0.2758 -1.91 EXPCH: Indicator, 1= using computer at home in both waves; 0=otherwise 0.4613 3.58 0.1727 1.77 0.2435 2.13 NOVCH: Indicator, 1= started using computer at home after wave 7; 0=otherwise 0.4849 3.72 QUITCH: Indicator, 1= stopped using computer at home after wave 7; 0=otherwise 0.4718 2.44 0.3175 1.99 EXPNH: Indicator, 1= using Internet at home in both waves; 0=otherwise 0.3585 2.90 NOVNH: Indicator, 1= started using Internet at home in wave 9; 0=otherwise 0.3161 3.30 EXPCEL: Indicator, 1= using cell phone in both waves; 0=otherwise 0.2132 2.50 NOVCEL: Indicator, 1=started using cell phone after wave 7; 0=otherwise 0.1654 1.93 NOVPAG: Indicator, 1= using pager in wave 9 only; 0=otherwise 0.3021 1.86 PTRAWEBA: Predicted probability of awareness for Internet 2.3646 11.72 -1.2870 -4.47 PTRAFTVA: Predicted probability of awareness for television 2.5714 5.81 0.8510 2.49 1.1602 1.76 PRREPTA: Predicted probability of awareness for radio 2.1344 8.83 POTHERSA: Predicted probability of awareness for telephone/other 3.3590 4.35
TRB 2004 Annual Meeting CD-ROM Paper revised from original submittal.
Goulias, Kim, and Pribyl
28
Table 8 Threshold Model Estimates and Diagnostic Statistics for Frequency of ATIS Use Threshold Parameters
Observed frequency Marginal for Internet Awareness
Marginal for television Awareness
Never 847 (66.0%) -0.80 586 (45.6%) 0.51 -1.02 Once or twice 246 (19.1%) 0.44 178 (13.8%) -0.01 0.03 1 to 3 times per month 105 (8.1%) 0.22 151 (11.7%) -0.07 0.13 1 to 2 times per week 47 (3.6%) 0.09 87 (6.7%) -0.06 0.12 3 to 5 times per week 22 (1.7%) 0.04 124 (99.6) -0.13 0.25 5 or more times per week 16 (1.2%) 0.02 157 (12.2%) -0.24 0.49 Regression coefficient (standard error) From Table 7
2.365 (0.202)
-1.287 (0.288)
2.571 (0.443)
Table 10 Marginal effects for other and Radio
DOT phone & others Radio Response Observed frequency (%) Marginal for
Other Awareness Observed frequency Marginal for Radio
Awareness Marginal for Television Awareness
Never 1188 (92.5%) -0.38 682 (53.1%) -0.85 -0.34 Once or twice 59 (4.5%) 0.23 101 (7.8%) 0.04 0.01 1 to 3 times per month 15 (1.1%) 0.06 140 (10.9%) 0.12 0.05 1 to 2 times per week 7 (0.5%) 0.03 97 (7.6%) 0.13 0.05 3 to 5 times per week 3 (0.2%) 0.01 117 (9.1%) 0.21 0.09 5 or more times per week 11 (0.8%) 0.05 145 (11.3%) 0.35 0.14 Regression coefficient (standard error) From Table 7
3.359 (0.773)
2.134 (0.242)
0.851 (0.342)
TRB 2004 Annual Meeting CD-ROM Paper revised from original submittal.