23
1 Treasury China Trust Q3 2012 Results 29 October 2012

1
Treasury China TrustQ3 2012 Results
29 October 2012

2
Important NoticeThis document does not constitute an offer to sell or the solicitation of an offer to purchase any interest in or related to any real estate, securities, or other investment products or assets. This document is provided for informational purposes only and is intended solely for the person to whom it is delivered. Information contained in this document is accurate only as of its date, regardless of the time of delivery or of any investment, and does not purport to be complete. This document may contain material non-public information.
This document is confidential and may not be reproduced or distributed without the express written consent of Treasury Holdings Real Estate Pte. Ltd. (“Trustee-Manager”). Any offer to sell or the solicitation of an offer to purchase any interest in or related to any real estate, securities, or other investment products or assets may only be made by means of delivery of an offering memorandum which will contain material information not included herein and shall supersede, amend and supplement this document in its entirety.
Certain statements in this document constitute “forward-looking statements”. Such forward-looking statements and financial information are based on numerous assumptions regarding the TCT’s present and future business, and its strategies and the environment in which TCT will operate in the future. Such forward-looking statements and financial information involve known and unknown risks, uncertainties and other factors which may cause the actual results, performance or achievements of TCT, or industry results, to be materially different from any future results, performance or achievements expressed or implied by such forward-looking statements and financial information.
These forward-looking statements and financial information speak only as at the date of this announcement. TCT expressly disclaims any obligation or undertaking to release publicly any updates of or revisions to any forward-looking statement or financial information contained herein to reflect any change in TCT’s expectations with regard thereto or any change in events, conditions or circumstances on which any such statement or information is based, subject to compliance with all applicable laws and regulations and/or the rules of the SGX-ST and/or any other relevant regulatory or supervisory body or agency.

3
Portfolio Overview� Listed on SGX, TCT is a leading owner, manager and developer of commercial real estate in China with A UM in excess of RMB 13.3 billion
and a quality portfolio of more than 800,000sqm of office and retail properties comprising 5 income pr oducing assets and 2 development assets,administered by an on-the-ground team of 80 dedicat ed professionals
� Uniquely positioned as a “Total Return Vehicle”, TC T is committed to deliver comprehensive value to un itholders through a distinctive business model that functionally integrates all fac ets of the real estate cycle of acquisition, owners hip, development/redevelopment and management
� Logistics warehouse facilities � GFA: 75,028 sqm
Beijing Logistics Park, Beijing
� Existing 45,178 sqm mall � 3 separate but contiguous retail
development sites totaling 335,000sqm GFA
Central Avenue, Qingdao
� 12 storey office tower � GFA: 19,643 sqm
Treasury Building, Shanghai
� Mixed use office tower over 7 level retail podium
� Completion scheduled for 2013
The HQ Extension, Shanghai
Income producing assets Development assets Combination of income-producing assets and land ban k
Huai Hai Mall, Shanghai
� Street front four storey retail podium � GFA: 7,620 sqm
Beijing
Shanghai
Qingdao
� 25 storey office building and 3 level retail podium
� GFA: 47,247 sqm
Central Plaza, Shanghai
� Twin 25 storey office towers and a 7 level retail podium
� GFA: 176,070 sqm
The HQ Existing, Shanghai

4
4
3
2
1
Market Outlook
Portfolio Update
Financial Results
Highlights Q3 2012

5
� Agreement reached with Parkson Department Stores for the termination of their lease 5 months prior to its expiry in Dec 2012, as a result:
� As at 30 Sept 2012 committed occupancy of the existing retail podium of The HQ stood at 26.6% with the balance expected to exit the property by Nov 2012
� The refurbishment program for the existing retail podium is well ahead of schedule and will lead to its re-opening by mid 2013
� Pre-leasing program at The HQ as at 30 Sept 2012 represented 37.84% up from 33% as at 30 June 2012:
� However economic tension between China and Japan has caused a delay in a number of other lease agreements being finalized
� Management remains confident that the strong progress will continue to be made in the months ahead
� A number of key cost components of The HQ retail podium refurbishment finalized at pricing significantly below that outlined in the updated budget released earlier this February
� The HQ continued to draw funds during Q3 from the approved development finance facility as required to meet the development cost program
Q3 2012 Highlights

6
5
3
2
1
Market Outlook
Portfolio Update
Financial Results
Highlights Q3 2012

7
242,251
(143,988)
(83,279)
(13,257)
(47,452)
386,239
YTD Sept 2012
346,705127,322125,475Gross Revenue
79,997
(47,325)
(27,878)
(4,197)
(15,250)
3rd Qtr 2011 Actual
217,004
(129,701)
(74,340)
(11,669)
(43,692)
YTD Sept 2011
78,268
(47,207)
(27,173)
(4,342)
(15,692)
3rd Qtr 2012 Actual
Total Property Operating Expenditure
(RMB’000)
Other Property Operating Expenses
Net Property Income (NPI)
Property Management Fees
Business and Property related Taxes
13.3
33,630
48,248
76,924
YTD Sept 2012
(11.7)
(29,787)
15,412
24,511
3rd Qtr 2011Actual
45.2
115,474
42,207
67,179
YTD Sept 2011
3.5
8,849
15,292
24,519
3rd Qtr 2012 Actual (S$’000)
Basic Earnings/Unit (EPU) (cents)
Total Profit After Tax Attributable to Trust Unitholders
Net Property Income
Gross Revenue
NPI & EPU Analysis
1. S$ 1 = RMB 5.133 as at 30 September 2012

8
Gross Revenue – Q3 2012 vs Q3 2011
1. Core stabilized portfolio reflects The HQ, Central Plaza and Treasury Building 2. Beijing Logistics Park was completed and 100% occupied as at July 2012.
66.8
26.3
8.2
14.2
5.3
4
73.9
25.4
9.4
12.8
5.8
1 2 5 . 51 2 5 . 51 2 5 . 51 2 5 . 5
1 0 1 . 31 0 1 . 31 0 1 . 31 0 1 . 3
1 2 7 . 31 2 7 . 31 2 7 . 31 2 7 . 3
1 0 8 . 71 0 8 . 71 0 8 . 71 0 8 . 7
n.a
- 20 40 60 80 100 120 140
Q3 2012
Q3 2011
Core Stabilized Portfolio¹
The HQ
Central Plaza
Treasury Building
Central Avenue Mall
Huai Hai Mall
(RMB million)
Gross Revenue
Beijing Logistics Park2

9
4.09
4.35
253,619,717
1,231
1,515
340
91
357
70
657
2,746
432
1
35
96
2,182
As at 30 Sep 2012
-Liabilities held for sale
4.31Diluted NAV per unit (S$)
1,302Net Assets
253,619,717Units in Issue
1Other Assets
-Assets held for Sale
68Convertible Bonds
1,458Total Liabilities
As at 31 Dec 2011
112Trade Payables and Other Liabilities
4.62Basic NAV per Unit (S$)
435Deferred Tax Liabilities
843Bank Loans
2,760Total Assets
46Cash & Cash Equivalents
44Trade and Other Receivables
2,669Investment Properties
(S$ million)
Consolidated Balance Sheet of TCT
10
0.0
100.0
200.0
300.0
400.0
500.0
600.0
700.0
800.0
900.0
2013Total Borrowings for Stabilized Assets
S$ M
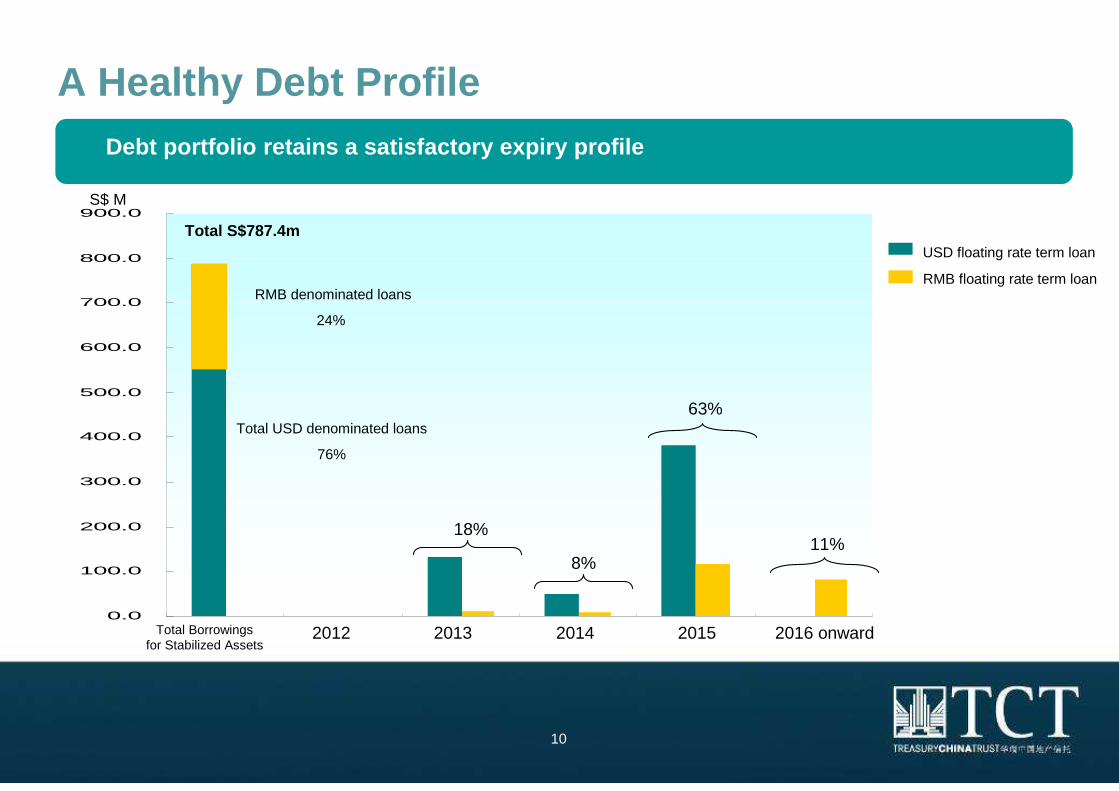
Total S$787.4m
Total USD denominated loans
76%
18%
63%
11%8%
2014 2015 2016 onward 2012
RMB denominated loans
24%
USD floating rate term loan
RMB floating rate term loan
A Healthy Debt ProfileDebt portfolio retains a satisfactory expiry profil e
11
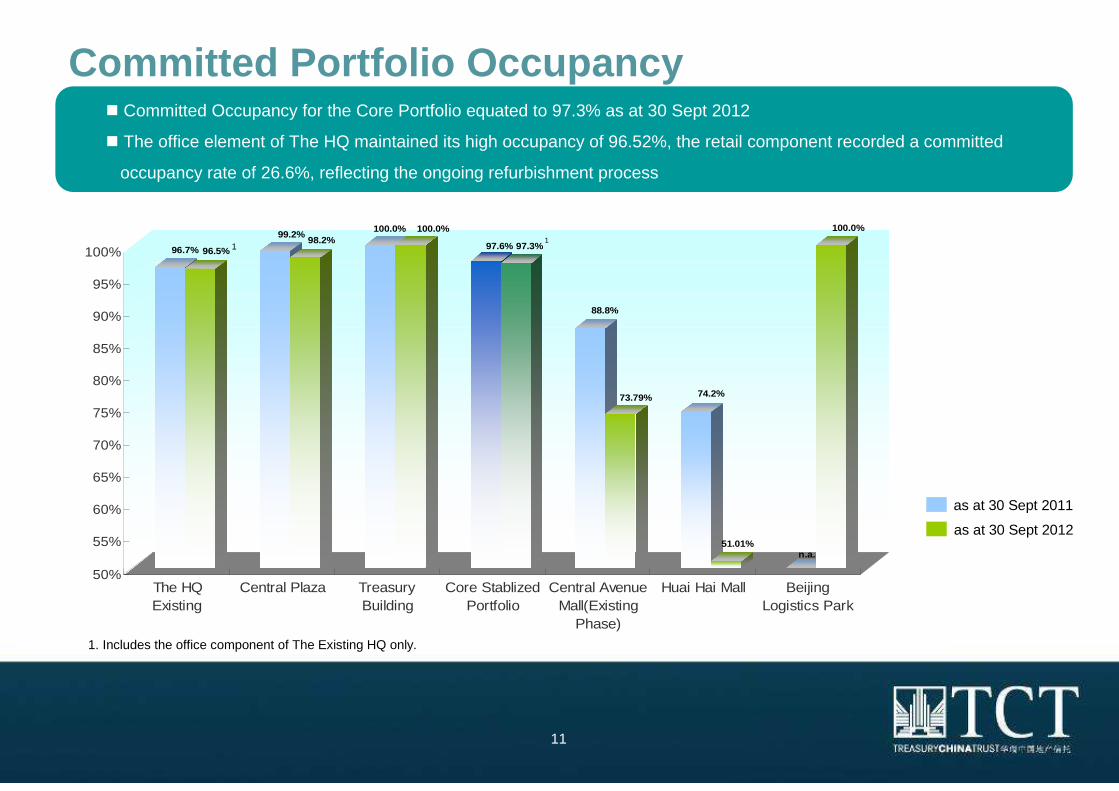
� Committed Occupancy for the Core Portfolio equated to 97.3% as at 30 Sept 2012
� The office element of The HQ maintained its high occupancy of 96.52%, the retail component recorded a committed
occupancy rate of 26.6%, reflecting the ongoing refurbishment process
Committed Portfolio Occupancy
96.7% 96.5%
99.2%98.2%
100.0% 100.0%
97.6% 97.3%
88.8%
73.79% 74.2%
51.01%n.a.
100.0%
50%
55%
60%
65%
70%
75%
80%
85%
90%
95%
100%
The HQExisting
Central Plaza TreasuryBuilding
Core StablizedPortfolio
Central AvenueMall(Existing
Phase)
Huai Hai Mall BeijingLogistics Park
as at 30 Sept 2012
as at 30 Sept 2011
1. Includes the office component of The Existing HQ only.
11
12
4
3
2
1
Market Outlook
Portfolio Update
Financial Results
Highlights Q3 2012

13
Local Company21%
Other ForeignCompany
23%
MNC56%
Strong Leasing Momentum Continues
305NewBeiten BurkhardtLaw Firm
213ExpansionHennes & Mauritz
358RenewVarian Medical ServicesCentral Plaza
3,093RenewMetLife InsuranceCentral Plaza
458RenewShen Ma Power Technology
The HQ
Major Transactions
589Renew/Expansion
Alcon Medical ServicesCentral Plaza
602RenewSOS Vertical Supply-Chain Management
The HQ
Gross Area(sqm)
Lease TypeTenantProperty
15 new lettings/renewals negotiated for Q3 2012, producing an aggregate per square metre rental which represents a 26.13% increase over the expiring leases on a net effective basis.
Tenant Composition
� more than 79% of TCT’s tenants are international and multinational companies
� 23% of TCT’s client portfolio is represented by Fortune 500 companies across a broad spectrum of industry sectors

14
� Metlife Insurance, as Central Plaza’s major tenant, renewed 45% of their office accommodation until Aug 2015 at a net effective rental increase of 39% (remaining 55% due for expiry in March 2014).
� The expansion of the H&M administrative headquarters was completed at an increase of 18% over the current office space at Central Plaza.
� Negotiations have concluded with SPX, the anchor tenant at Treasury Buildings resulting in a 3 year extension of the lease due to expire in March of next year. The new lease represents a 21% increase in net effective rent.
Strong Office Leasing Momentum Continues

15
Lease Expiry Profile Negotiations concluded with SPX, the anchor tenant at Treasury Building, resulting in a 3 yr extension of the lease due to expire in April 2012
Leasing Expiring Portfolio 2012-2014 (as % of Net L ettable Area)
10.74%18.53%
46.06%
17.25%
29.51%
9.28%
48.18%
31.81%
10.95%
0.00%
20.00%
40.00%
60.00%
80.00%
100.00%
2012 2013 2014
Income Producing Assets Office Retail

16
� The development of The HQ Extension is progressing
� The agreement with Parkson to bring their tenancy to an early conclusion facilitates an earlier than expected commencement of the podium refurbishment
� A number of key cost components of The HQ retail podium refurbishment finalized at pricing significantly below that outlined in the updated budget released earlier this February
� TCT will be issuing a detailed announcement on The HQ prior to the end of the year
Development Progress of The HQ
A Note of Caution
There is likely to be a delay in the completion of the new podium and office tower due predominantly to the significant additional regulations imposed by the Shanghai municipal and district governments in regard to basement construction reinforcement, fire services and infrastructure including the Tunnel connections between The HQ and the projects immediately to the south and north.

17
4
3
2
1
Market Outlook
Portfolio Update
Financial Results
Highlights Q3 2012
18
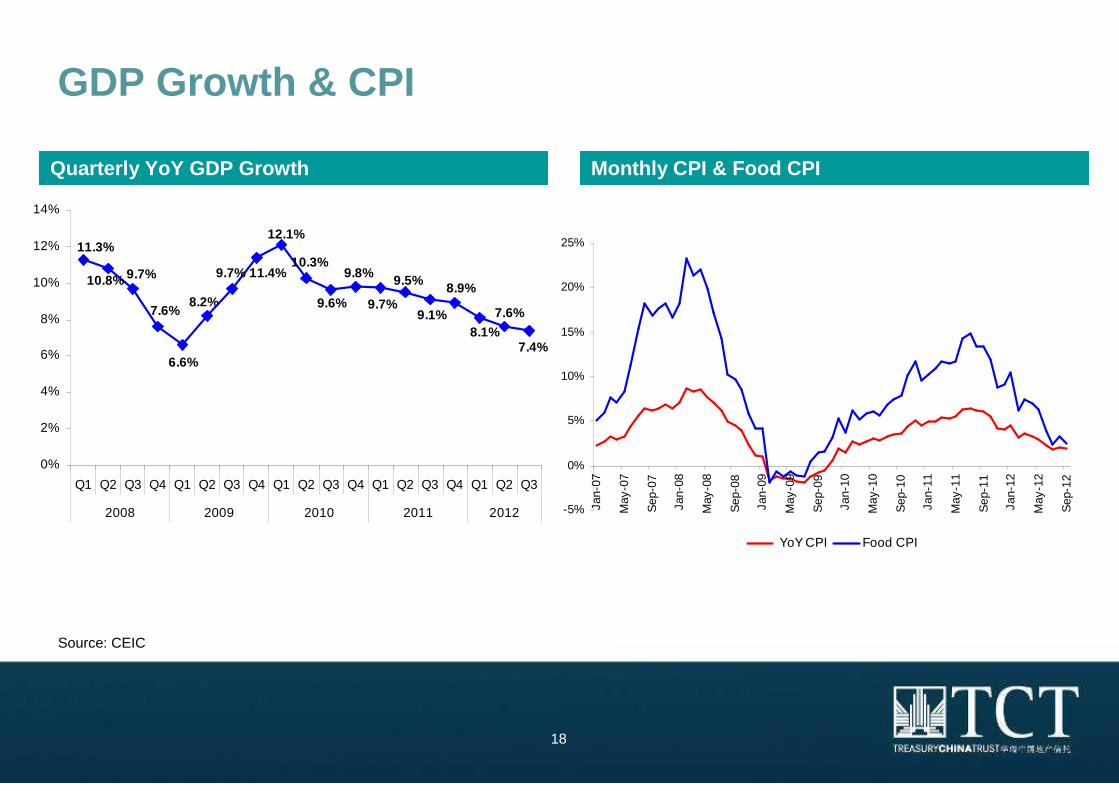
Source: CEIC
Quarterly YoY GDP Growth
GDP Growth & CPI
Monthly CPI & Food CPI
7.4%
7.6%
11.3%
10.8% 9.7%
7.6%
6.6%
8.2%
9.7% 11.4%
12.1%
10.3%
9.6%
9.8%
9.7%
9.5%
9.1%
8.9%
8.1%
0%
2%
4%
6%
8%
10%
12%
14%
Q1 Q2 Q3 Q4 Q1 Q2 Q3 Q4 Q1 Q2 Q3 Q4 Q1 Q2 Q3 Q4 Q1 Q2 Q3
2008 2009 2010 2011 2012 -5%
0%
5%
10%
15%
20%
25%
Jan-
07
May
-07
Sep
-07
Jan-
08
May
-08
Sep
-08
Jan-
09
May
-09
Sep
-09
Jan-
10
May
-10
Sep
-10
Jan-
11
May
-11
Sep
-11
Jan-
12
May
-12
Sep
-12
YoY CPI Food CPI

19
-500
0
500
1,000
1,500
2,000
2,500
Jan
-09
Ma
y-0
9
Se
p-0
9
Jan
-10
Ma
y-1
0
Se
p-1
0
Jan
-11
Ma
y-1
1
Se
p-1
1
Jan
-12
Ma
y-1
2
Se
p-1
2
RM
B B
illio
nNew RMB Loan Trust Loan Corporate Bond Equity Financing Others
Source: CEIC
Total Retail Sales & Monthly Total Social Financing
Monthly Total Retail Sales (Nominal vs. Real Growth ) Monthly Total Social Financing
0%
5%
10%
15%
20%
25%
Fe
b-0
8
Ma
y-0
8
Au
g-0
8
No
v-0
8
Ma
r-0
9
Jun
-09
Se
p-0
9
De
c-0
9
Ap
r-1
0
Jul-
10
Oct
-10
Fe
b-1
1
Ma
y-1
1
Au
g-1
1
No
v-1
1
Ma
r-1
2
Jun
-12
Se
p-1
2Nominal YoY growth Real YoY Growth

20
Source: CEIC
Disposable Income Per Capita
Urban Disposable Income Per Capita Rural Disposable Income Per Capita
0
5,000
10,000
15,000
20,000
25,000
Q1
Q2
Q3
Q4
Q1
Q2
Q3
Q4
Q1
Q2
Q3
Q4
Q1
Q2
Q3
Q4
Q1
Q2
Q3
Q4
Q1
Q2
Q3
2007 2008 2009 2010 2011 2012
RM
B
0%
4%
8%
12%
16%
20%
Urban Disposable Income per capita Nominal Income YoY Growth
0
2,000
4,000
6,000
8,000
10,000
Q1
Q2
Q3
Q4
Q1
Q2
Q3
Q4
Q1
Q2
Q3
Q4
Q1
Q2
Q3
Q4
Q1
Q2
Q3
Q4
Q1
Q2
Q3
2007 2008 2009 2010 2011 2012
RM
B
0%
5%
10%
15%
20%
25%
Rurual Cash Income per capita Nominal Income YoY Growth

21
Source: JLL
Shanghai Office Market
Office Rents – Puxi vs. Pudong Vacancy – Puxi vs. Pudong
0
2
4
6
8
10
12
Q1
Q2
Q3
Q4
Q1
Q2
Q3
Q4
Q1
Q2
Q3
Q4
Q1
Q2
Q3
Q4
Q1
Q2
Q3
Q4
Q1
Q2
Q3
Q4
Q1
Q2
Q3
2006 2007 2008 2009 2010 2011 2012
RM
B/s
qm
/da
y
Puxi Pudong
0%
5%
10%
15%
20%
25%
Q1
Q2
Q3
Q4
Q1
Q2
Q3
Q4
Q1
Q2
Q3
Q4
Q1
Q2
Q3
Q4
Q1
Q2
Q3
Q4
Q1
Q2
Q3
Q4
Q1
Q2
Q3
2006 2007 2008 2009 2010 2011 2012
Puxi Pudong

22
0%
1%
2%
3%
4%
5%
6%
7%
8%
9%
10%
Q1
Q2
Q3
Q4
Q1
Q2
Q3
Q4
Q1
Q2
Q3
Q4
Q1
Q2
Q3
Q4
Q1
Q2
Q3
Q4
Q1
Q2
Q3
Q4
Q1
Q2
Q3
2006 2007 2008 2009 2010 2011 2012
0
20
40
60
80
100
120
140
160
20
06
=1
00
Vacancy (RHS) Prime Retail Rental Index (LHS)
Source: JLL, Savills
� The average rental by the end of Q3, 2012 stood at RMB 47.9/sqm/day
Average Rents at Q3 12 RMB47.9/sqm/day
Prime Retail Rents Rental Index and Vacancy
Shanghai Retail Market – Rents Firming Up
23
Thank you !
For More Information About TCT, Please Visit
http://www.treasurychinatrust.com


