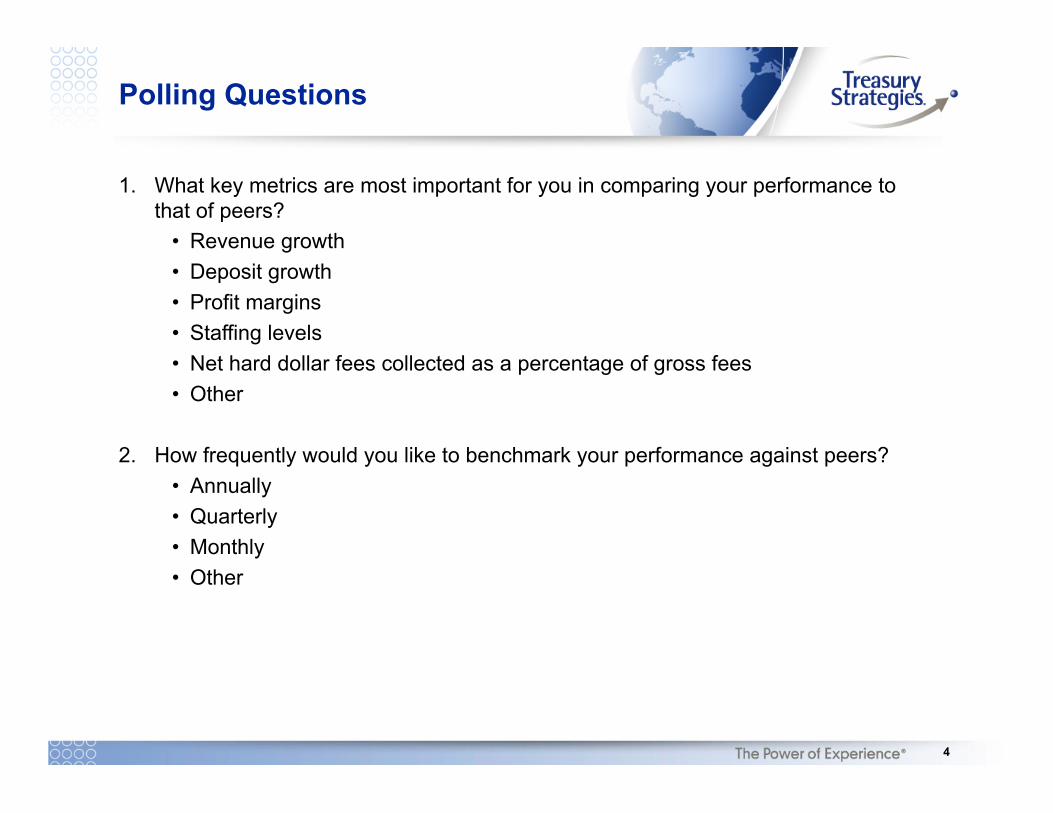
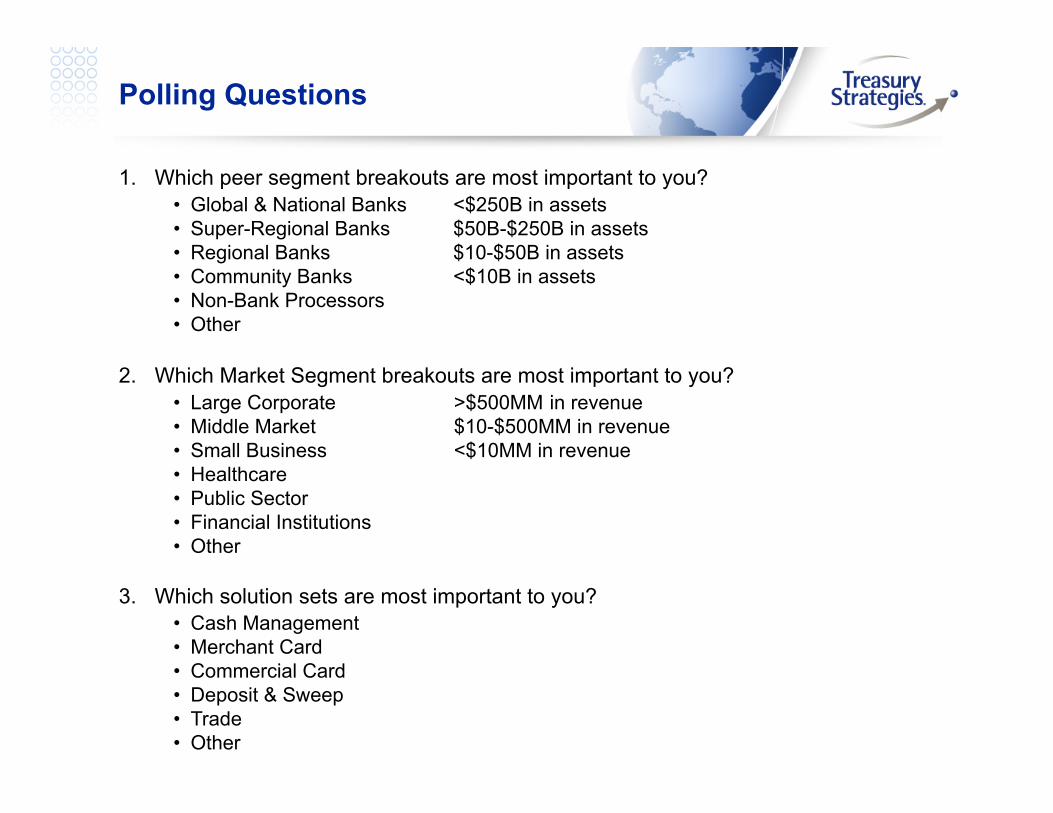
1. Which peer segment breakouts are most important to you? • Global & National Banks <$250B in assets • Super-Regional Banks $50B-$250B in assets • Regional Banks $10-$50B in assets • Community Banks <$10B in assets • Non-Bank Processors • Other
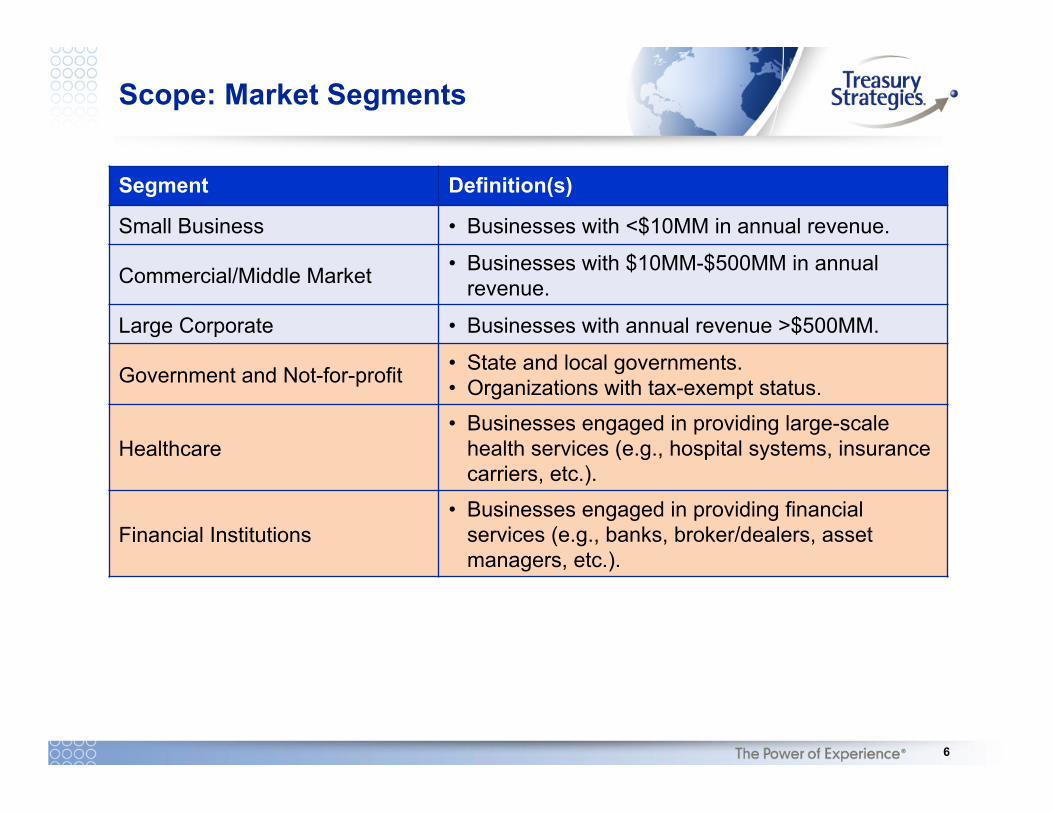
2. Which Market Segment breakouts are most important to you? • Large Corporate >$500MM in revenue • Middle Market $10-$500MM in revenue • Small Business <$10MM in revenue • Healthcare • Public Sector • Financial Institutions • Other
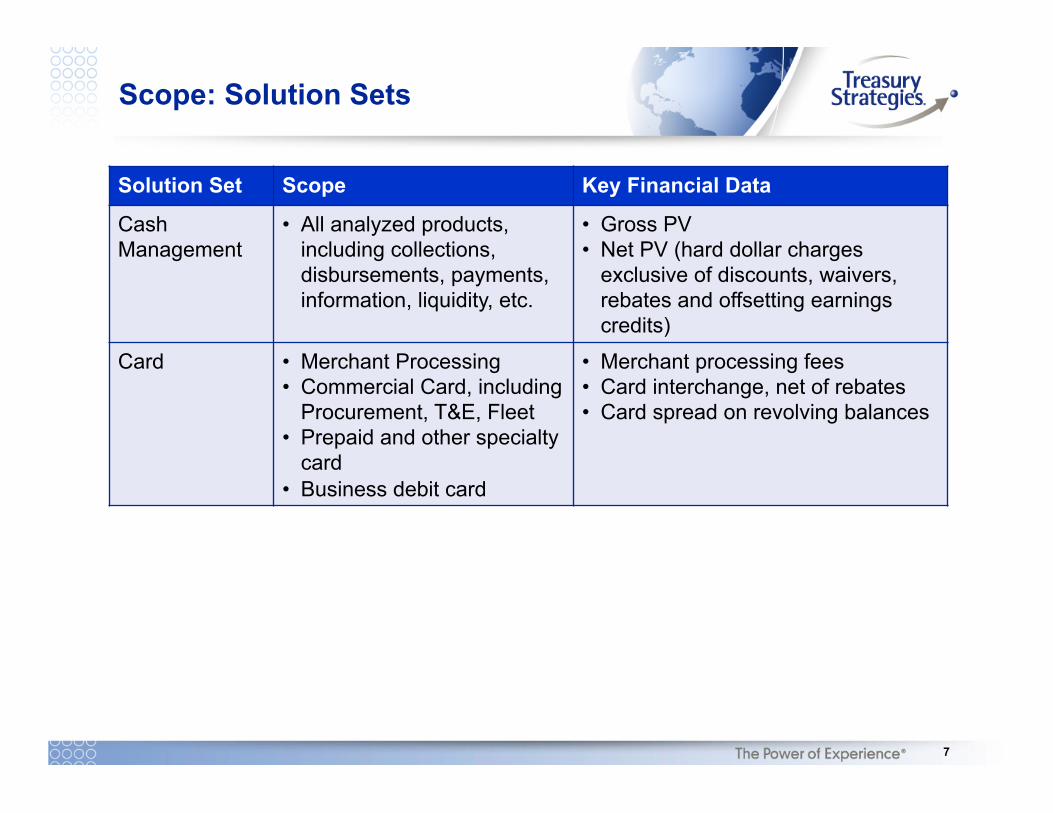
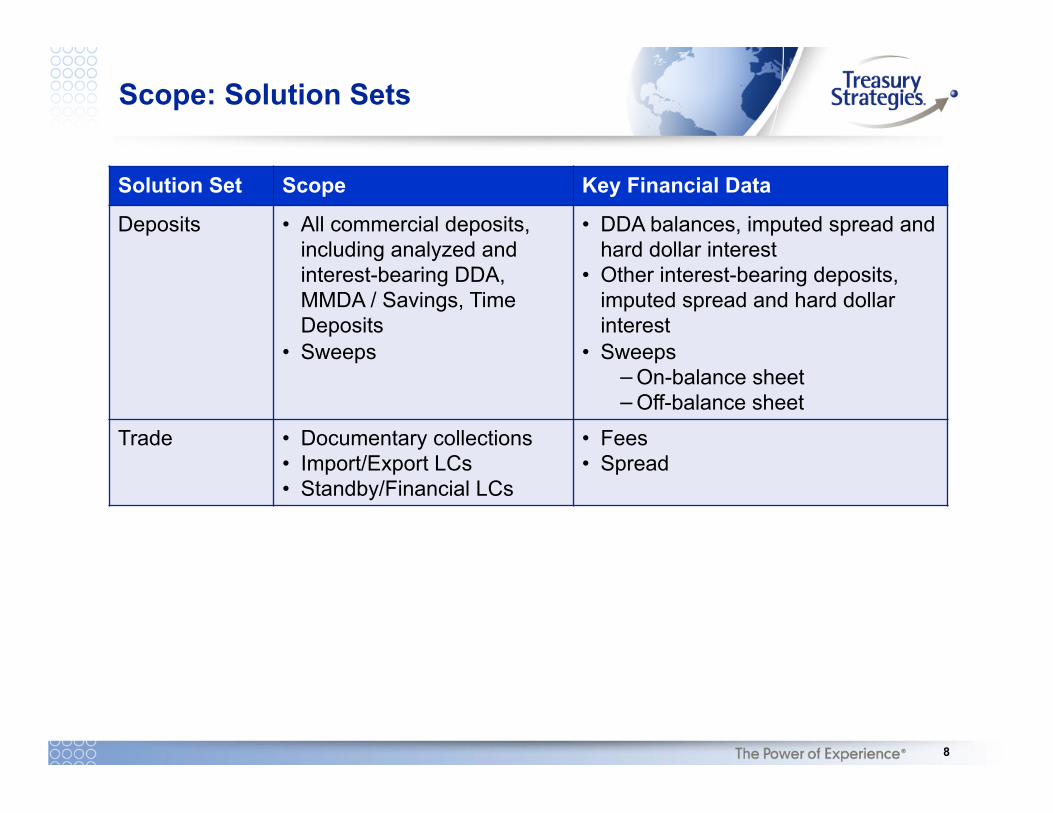
3. Which solution sets are most important to you? • Cash Management • Merchant Card • Commercial Card • Deposit & Sweep • Trade • Other
10!
Benchmarks
We propose a comprehensive battery of benchmarks: • Quarter over quarter • Year-to-date over Year-to-date • Rolling 4-quarter average versus prior rolling 4-quarter average
Where feasible, trends will be broken out by peer group, market segment and solution set.
11!
Benchmarks
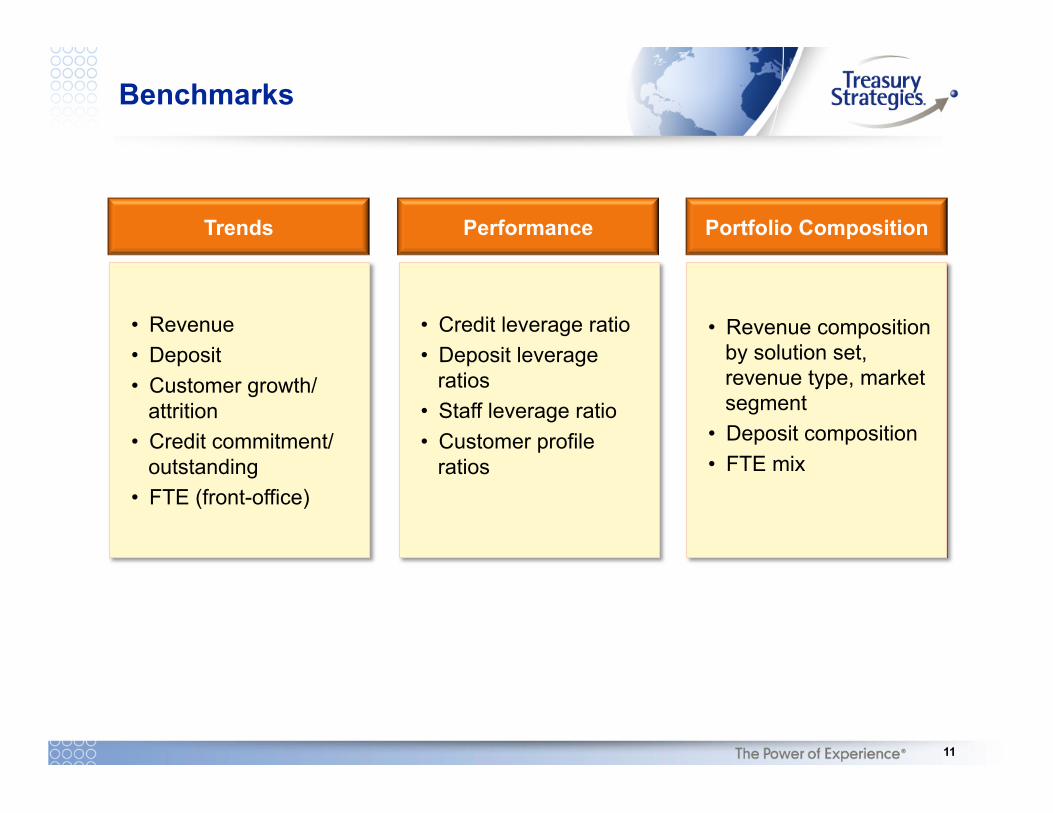
Trends Performance Portfolio Composition
• Revenue • Deposit • Customer growth/
attrition • Credit commitment/
outstanding • FTE (front-office)
• Credit leverage ratio • Deposit leverage
ratios • Staff leverage ratio • Customer profile
ratios
• Revenue composition by solution set, revenue type, market segment
• Deposit composition • FTE mix
12!
!6.0%&
!4.0%&
!2.0%&
0.0%&
2.0%&
4.0%&
6.0%&
8.0%&
10.0%&
%"Cha
nge"in"Fee"In
come"
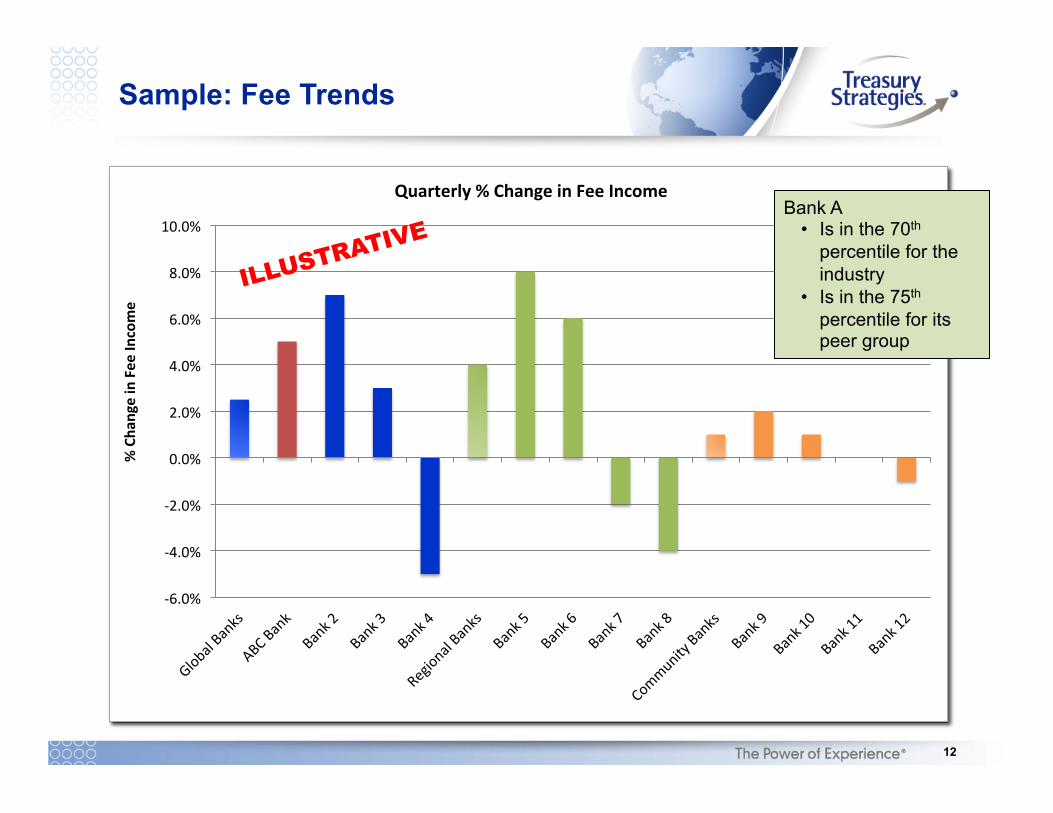
Quarterly"%"Change"in"Fee"Income""
Sample: Fee Trends
ILLUSTRATIVE Bank A
• Is in the 70th percentile for the industry
• Is in the 75th percentile for its peer group
13!
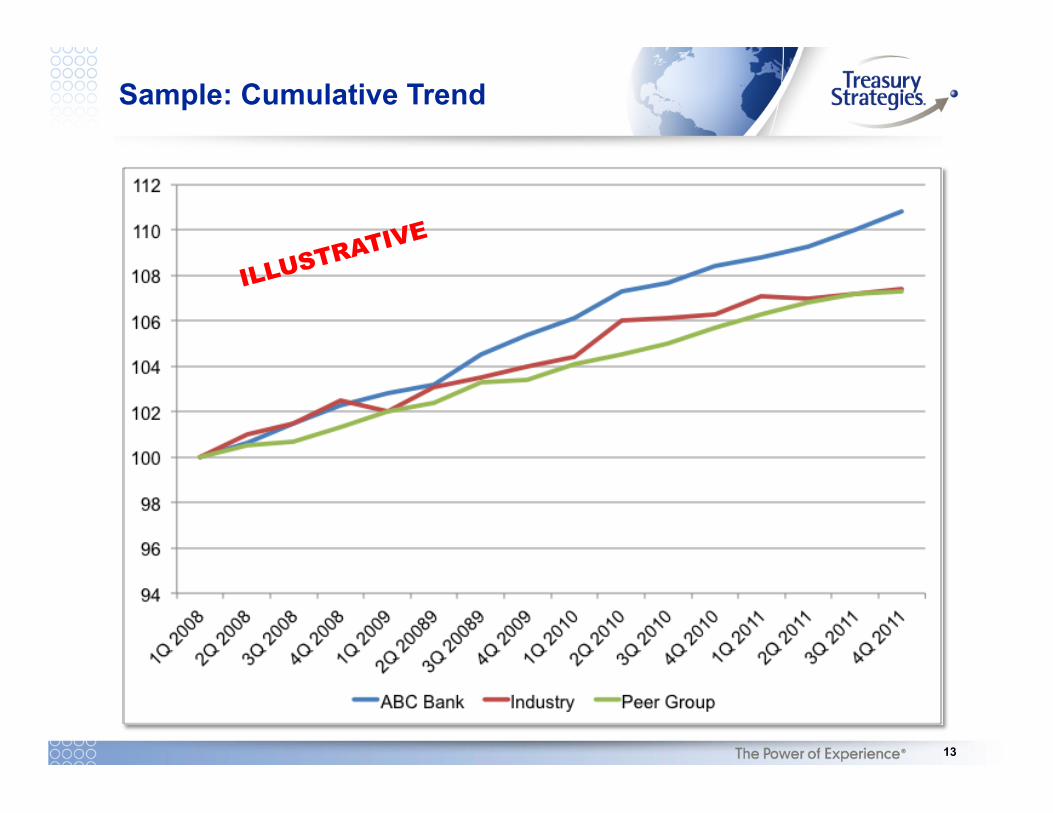
Sample: Cumulative Trend
ILLUSTRATIVE
14!
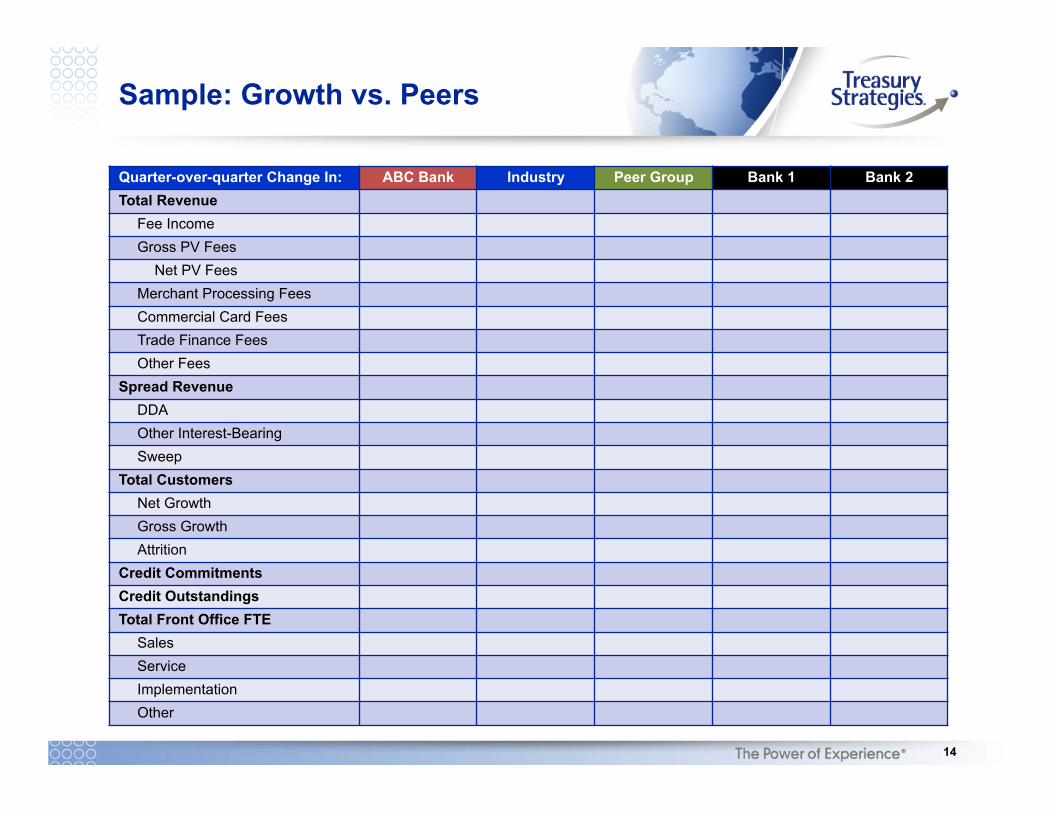
Sample: Growth vs. Peers
Quarter-over-quarter Change In: ABC Bank Industry Peer Group Bank 1 Bank 2 Total Revenue
Fee Income Gross PV Fees
Net PV Fees Merchant Processing Fees Commercial Card Fees Trade Finance Fees Other Fees
Spread Revenue DDA Other Interest-Bearing Sweep
Total Customers Net Growth Gross Growth Attrition
Credit Commitments Credit Outstandings Total Front Office FTE
Sales Service Implementation Other
15!
0.00%
0.50%
1.00%
1.50%
2.00%
2.50%
3.00%
3.50%
4.00%
4.50%
Small Business Commercial Middle Market
Rate of Customer Acquisition 3Q 2011
ABC Bank Industry Average Peer Group Average
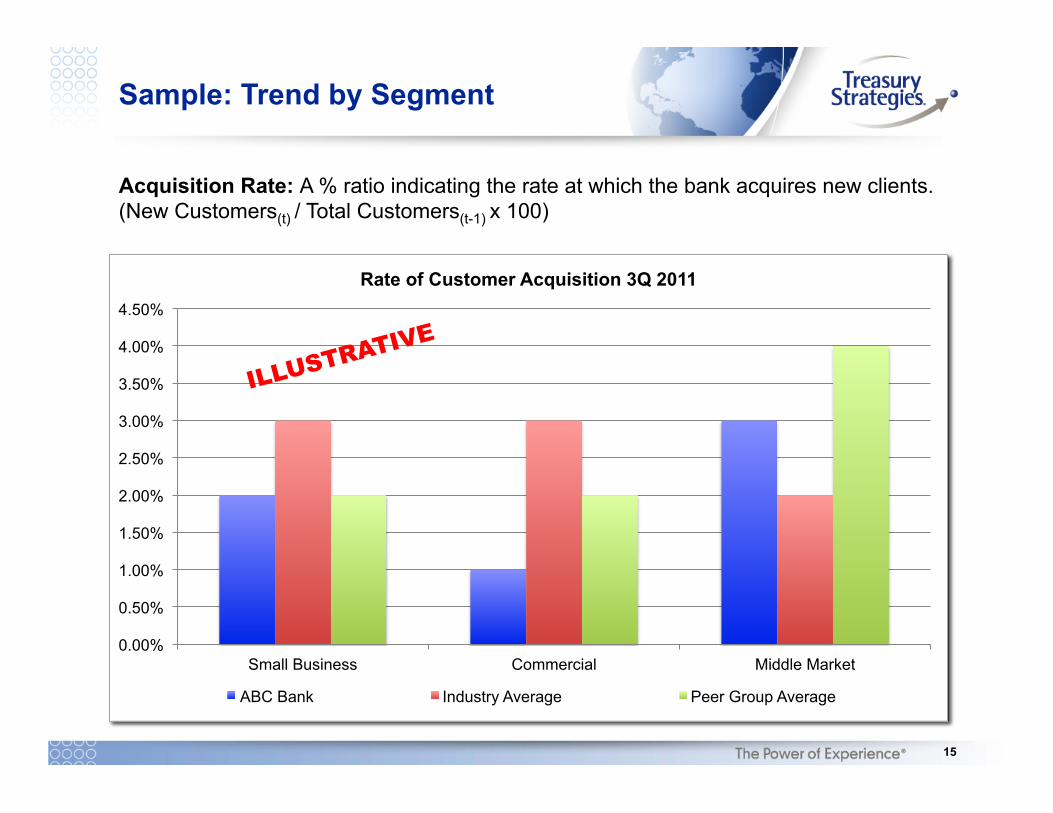
Sample: Trend by Segment
Acquisition Rate: A % ratio indicating the rate at which the bank acquires new clients. (New Customers(t) / Total Customers(t-1) x 100)
ILLUSTRATIVE
16!
Sample: Revenue Composition
Revenue Composition by Solution Set
17!
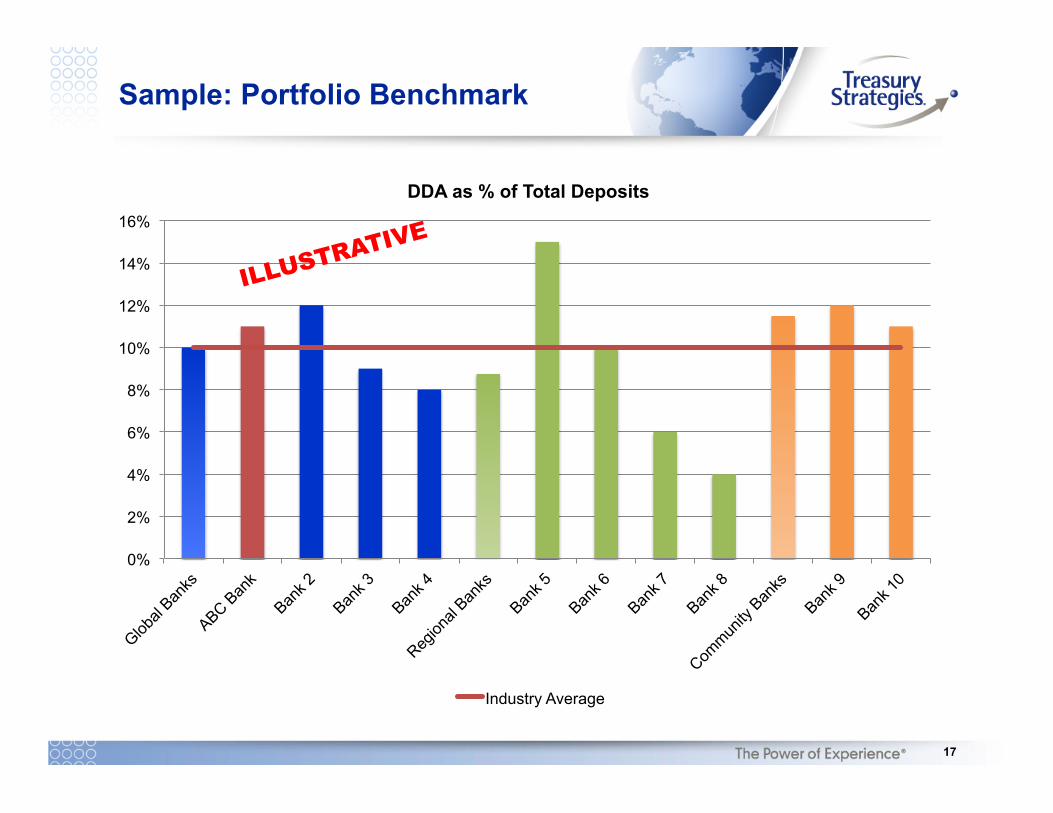
Sample: Portfolio Benchmark
0%
2%
4%
6%
8%
10%
12%
14%
16%
DDA as % of Total Deposits
Industry Average
ILLUSTRATIVE
18!
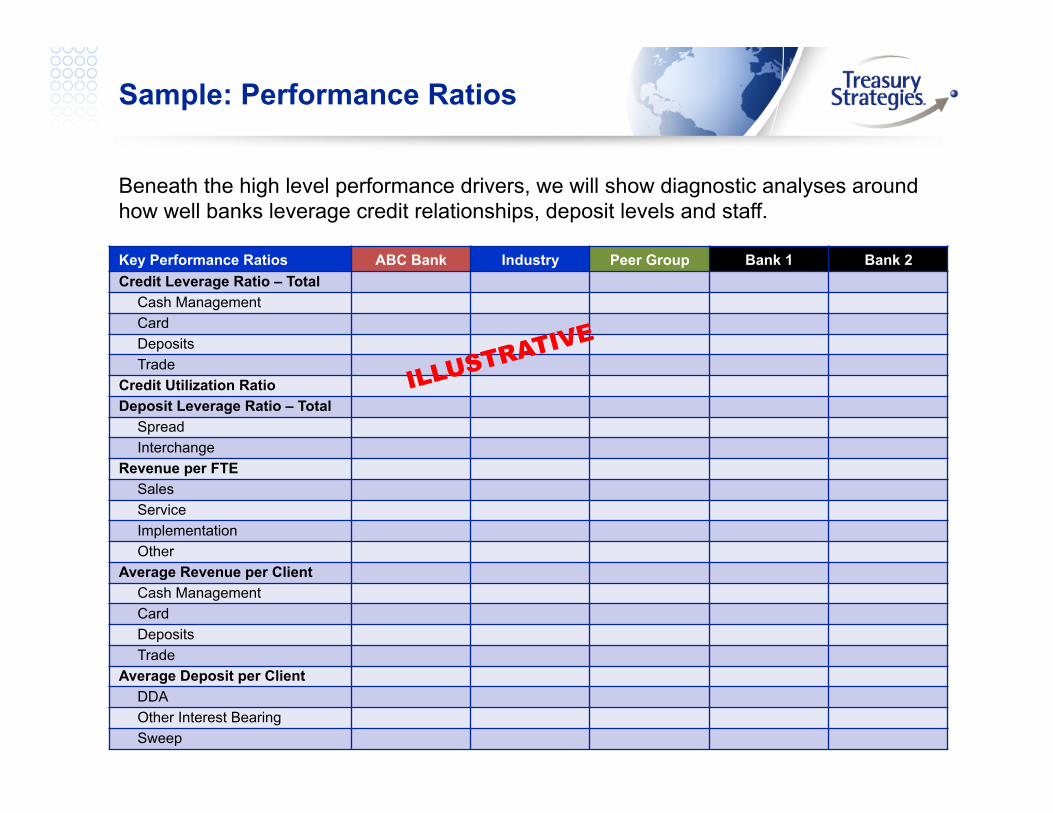
Sample: Performance Ratios
Beneath the high level performance drivers, we will show diagnostic analyses around how well banks leverage credit relationships, deposit levels and staff.
ILLUSTRATIVE
Key Performance Ratios ABC Bank Industry Peer Group Bank 1 Bank 2 Credit Leverage Ratio – Total
Cash Management Card Deposits Trade
Credit Utilization Ratio Deposit Leverage Ratio – Total
Spread Interchange
Revenue per FTE Sales Service Implementation Other
Average Revenue per Client Cash Management Card Deposits Trade
Average Deposit per Client DDA Other Interest Bearing Sweep
ILLUSTRATIVE
19!
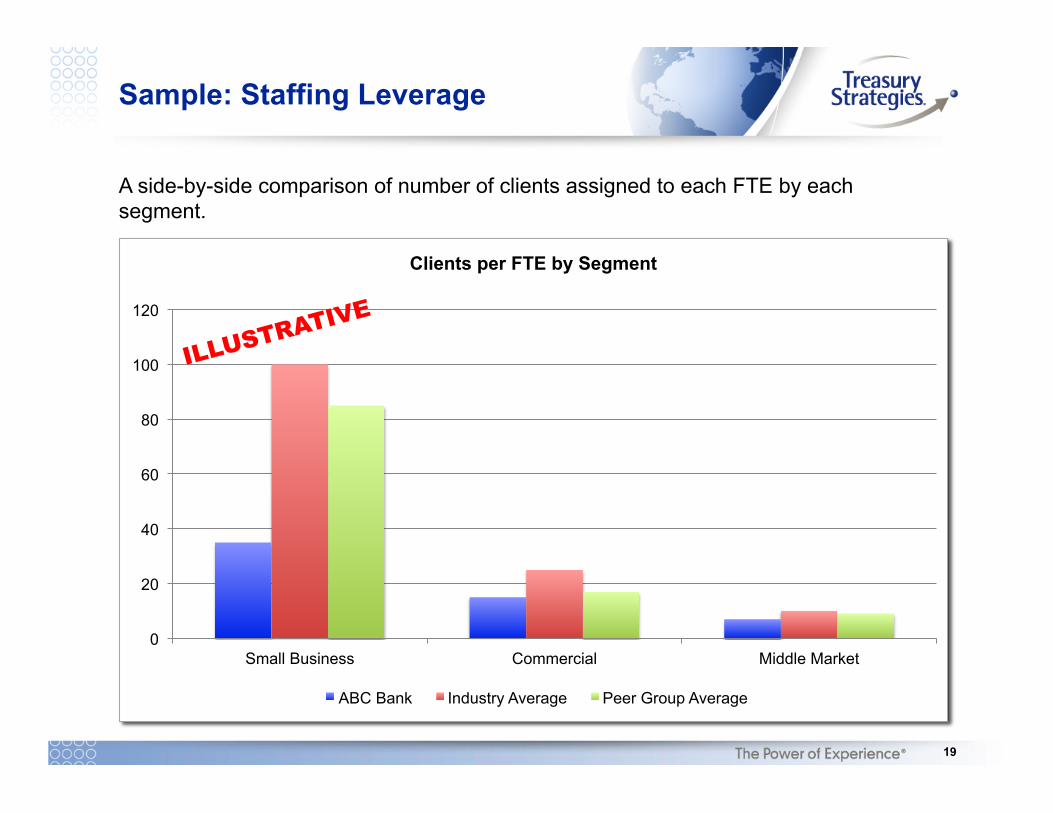
Sample: Staffing Leverage
A side-by-side comparison of number of clients assigned to each FTE by each segment.
0
20
40
60
80
100
120
Small Business Commercial Middle Market
Clients per FTE by Segment
ABC Bank Industry Average Peer Group Average
ILLUSTRATIVE
20!
Polling Question
Are there any key benchmarks not mentioned that you would like to see?
21!
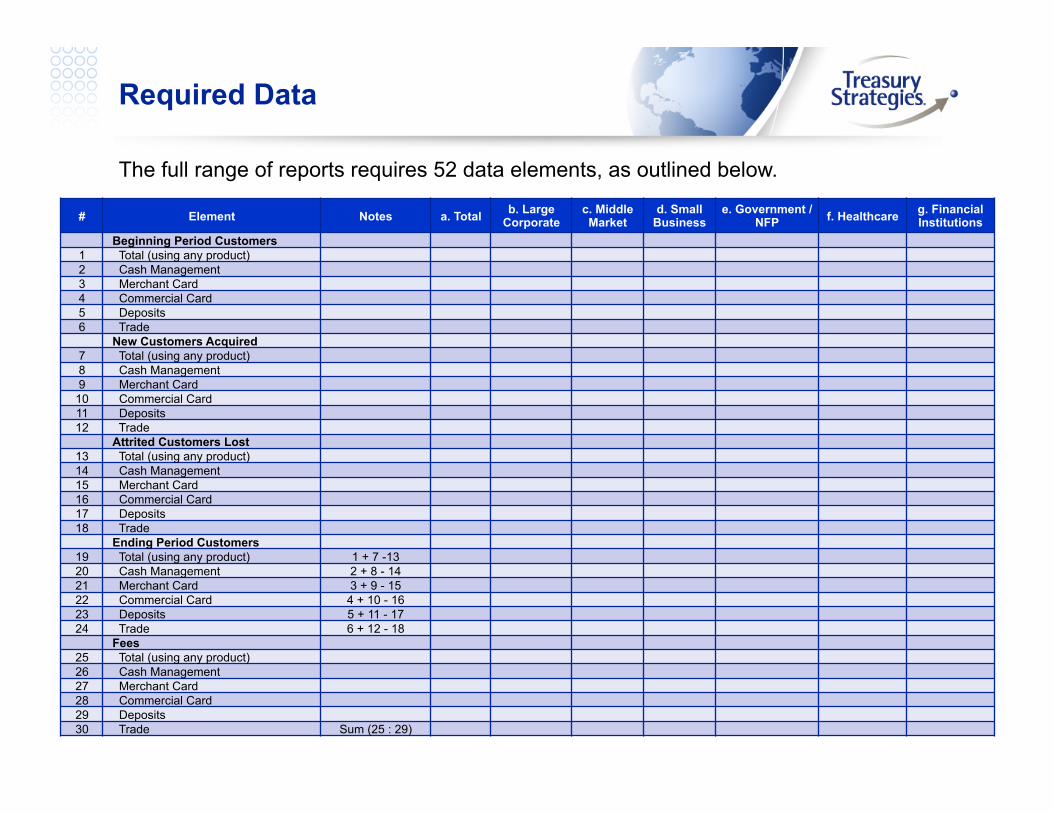
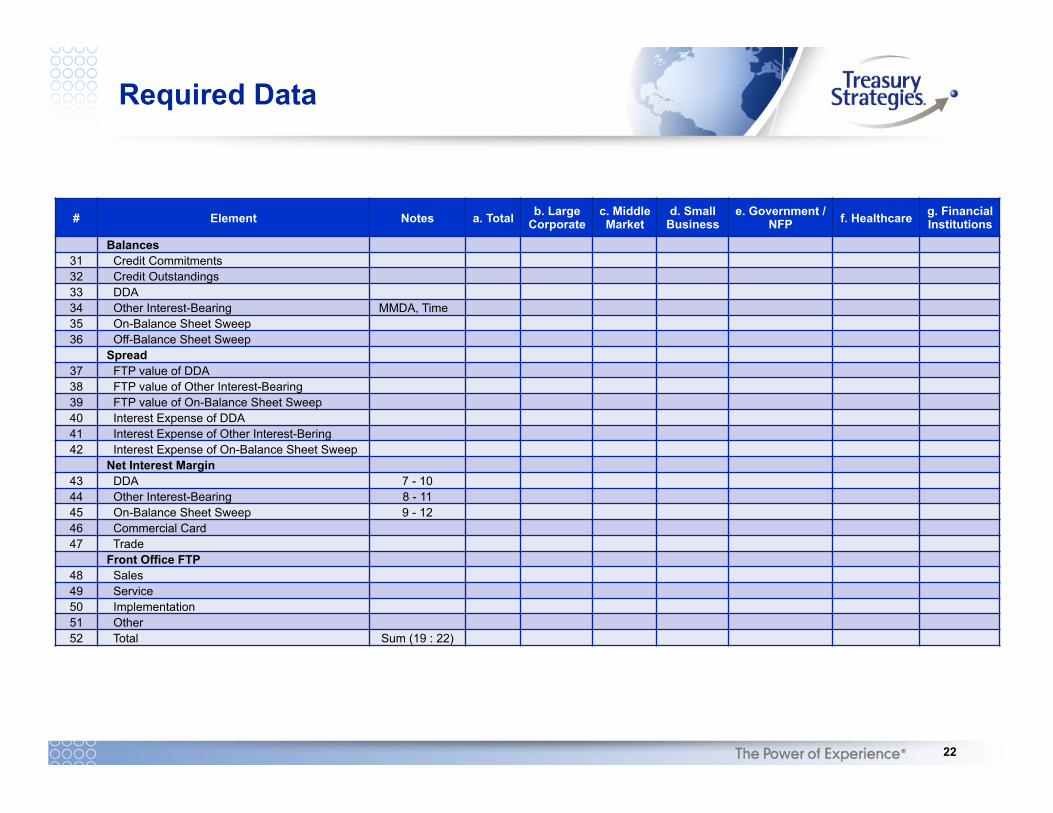
Required Data
The full range of reports requires 52 data elements, as outlined below.
# Element Notes a. Total b. Large Corporate
c. Middle Market
d. Small Business
e. Government / NFP f. Healthcare g. Financial
Institutions Beginning Period Customers
1 Total (using any product) 2 Cash Management 3 Merchant Card 4 Commercial Card 5 Deposits 6 Trade
New Customers Acquired 7 Total (using any product) 8 Cash Management 9 Merchant Card
10 Commercial Card 11 Deposits 12 Trade
Attrited Customers Lost 13 Total (using any product) 14 Cash Management 15 Merchant Card 16 Commercial Card 17 Deposits 18 Trade
Spread 37 FTP value of DDA 38 FTP value of Other Interest-Bearing 39 FTP value of On-Balance Sheet Sweep 40 Interest Expense of DDA 41 Interest Expense of Other Interest-Bering 42 Interest Expense of On-Balance Sheet Sweep
Our strategic advice and pragmatic solutions improve bottom line performance. Clients benefit from our 360o view of the treasury market, deep relationships, and proprietary analytic frameworks that transform data into strategic insights.
26!
About Treasury Strategies, Inc.
Who We Are Treasury Strategies, Inc. is the leading treasury consulting firm working with corporations and financial services providers. Our experience and thought leadership in treasury management, working capital management, liquidity and payments, combined with our comprehensive view of the market, rewards you with a unique perspective, unparalleled insights and actionable solutions.
What We Do Corporations We help you maximize worldwide treasury performance and navigate regulatory and payment system changes through a focus on best practices, technology, liquidity and controls.
Treasury Technology We provide guidance through every step of the technology process. Our expert approach will uncover opportunities to optimize the value of your treasury through fully integrated technology solutions.
Financial Services Our experience, analytic approach and benchmarks provide unique consulting solutions to help you strengthen and grow your business.


![Benchmarks - June, 2013 | Benchmarks Onlineit.unt.edu/sites/default/files/benchmarks-06-2013.pdf · Benchmarks - June, 2013 | Benchmarks Online 4/26/16, 8:52:25 AM] Skip to content](https://static.documents.pub/doc/80x56/5f9d6dd4a6e586755376b37d/benchmarks-june-2013-benchmarks-benchmarks-june-2013-benchmarks-online.jpg)


