30
Treatability Testing for In-Situ Chemical Oxidation Jerry Cresap, PE Regional Engineering Manager

Treatability Testing for In-Situ Chemical Oxidation
Jerry Cresap, PE
Regional Engineering ManagerRegional Engineering Manager

Overview
• Definition of Treatability Testing
• Benefits and Limitations
• Types of Treatability Tests
• Case Study
• Summary
”The strongest arguments prove
nothing so long as the conclusions
are not verified by experience.”
- Roger Bacon
• Summary
What is Treatability Testing?
• Measurement of Treatment Under “Ideal” Conditions
• Controlled Tests Performed on Water and Soil Samples
• Proof of Concept
• Establish Parameters for Pilot /
Will target compounds degrade to
desired end products under site
conditions.
• Establish Parameters for Pilot / Full-Scale ISCO
• Common Objectives> Determine reactivity of soil
> Select the optimum chemistry
> Evaluate potential adverse reactions
> Develop cost estimate
Benefits of Treatability Testing
• Generates Site-Specific Data
• Allows Optimization Prior to Full-Scale Implementation
> Refine chemistry
> Incorporate efficiencies
> Cost savings potential
• Enhances Pilot Testing / Full-Scale Implementation
> Expected results guide next phase of work
> Simplifies evaluation of field scale results

Limitations of Treatability Testing
• Linear Scale-Up Limitations> Difficult to simulate heterogeneity in test column
> Small sample volume compared to site
> Well-mixed static system
• Contact and Mixing> May favorably bias results
>> Not possible to evaluate delivery process
• Pilot Study Required (usually)

Types of Treatability Tests
• Laboratory Tests
> Simple, inexpensive tests
> Incorporate into RI
> SOD, peroxide reactivity
• Bench-Scale Study
> Proof of concept > Proof of concept
> Basis of design
> Scale-up for pilot test
• Pilot Testing> Discussed in next session
> Provides full-scale design parameters
> Requires extensive monitoring
66
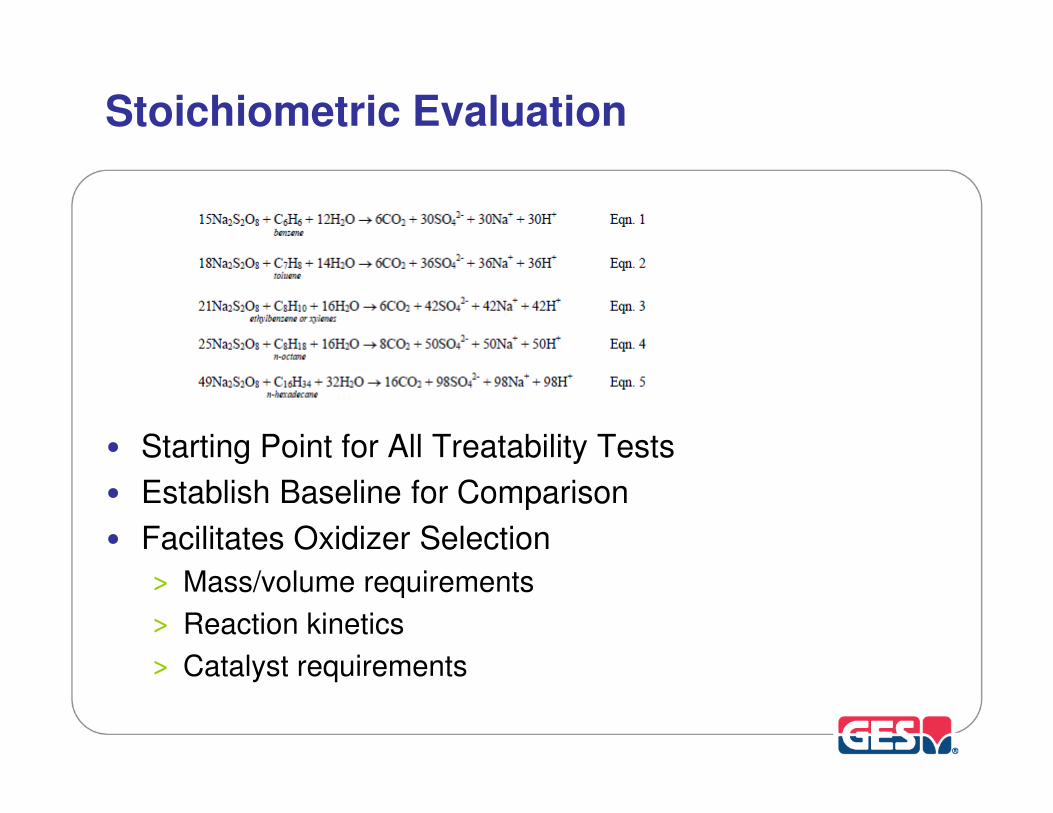
Stoichiometric Evaluation
• Starting Point for All Treatability Tests
• Establish Baseline for Comparison
• Facilitates Oxidizer Selection
> Mass/volume requirements
> Reaction kinetics
> Catalyst requirements

Gas Evolution and Generation
Stoichiometric Oxygen Gas Production
25
30
35
Oxyg
en
Gas P
rod
uctio
n (S
CF
M)
PeroxidePeroxidePeroxidePeroxide
ConcentrationConcentrationConcentrationConcentration
0
5
10
15
20
0.0 0.5 1.0 1.5 2.0 2.5
Peroxide Injection Rate (gpm)
Oxyg
en
Gas P
rod
uctio
n (S
CF
M)
8%
10%
15%
31%
Reference: 2011 Pilot Test Work Plan, GES

Soil Oxidant Demand
• Measure of Oxidant Depletion Over Time
> Grams of oxidant per kilogram of soil (g/kg)
> Range: 0.1 to 20 g/kg
• Standard Methods
> Permanganate: USEPA Method – PSODand ASTM D7262-10
> Other oxidants: Varies> Other oxidants: Varies
• Variables – Soil Related
> Natural organic matter
> Reduced solid species
> Soil structure / mineralogy
• Variables – Process Related
> Oxidant
> Oxidant concentration
> Time of measurement

Oxidant Demand – Primary Design Factor
• Soil Matrix is Generally Dominant > 2 to 3 orders of magnitude
> Groundwater constituents relatively
unimportant
• Matrix Demand May Exceed
Contaminant DemandContaminant Demand
• Interpreting the Results> Cost of full-scale implementation
> Evaluate oxidant mass versus pore
volume
> SOD ignores relative reaction rates
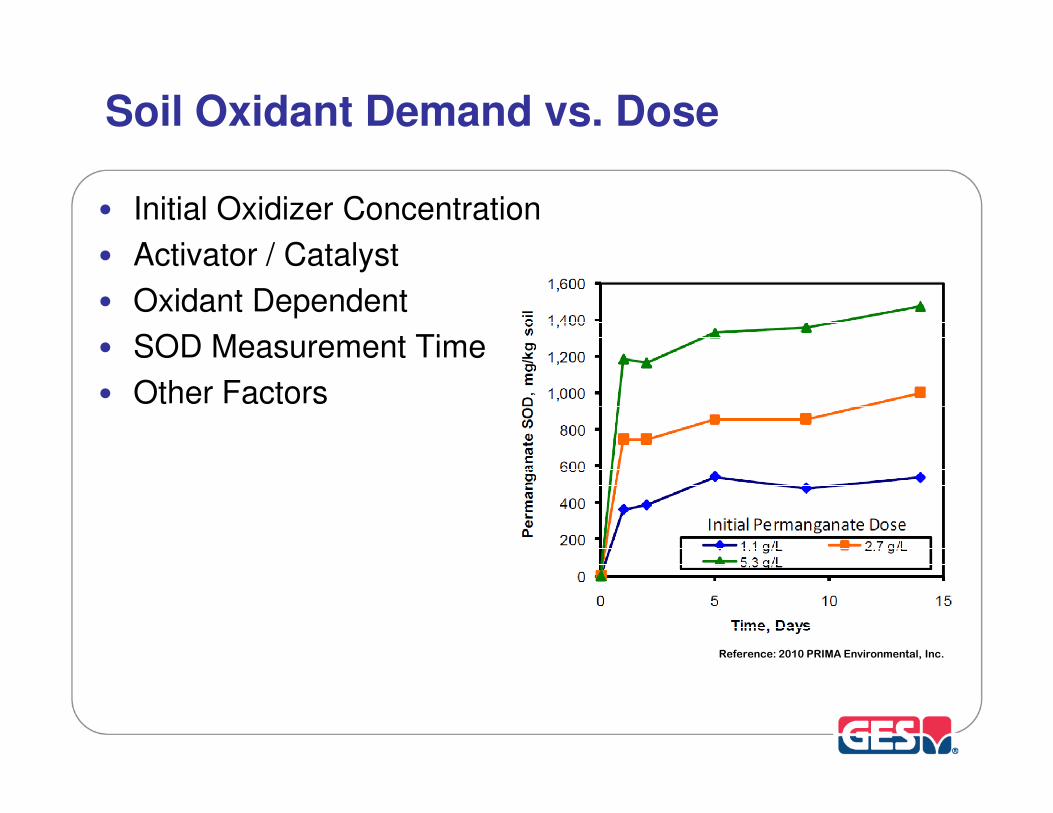
Soil Oxidant Demand vs. Dose
• Initial Oxidizer Concentration
• Activator / Catalyst
• Oxidant Dependent
• SOD Measurement Time
• Other Factors
Reference: 2010 PRIMA Environmental, Inc.ERI
• Other Factors
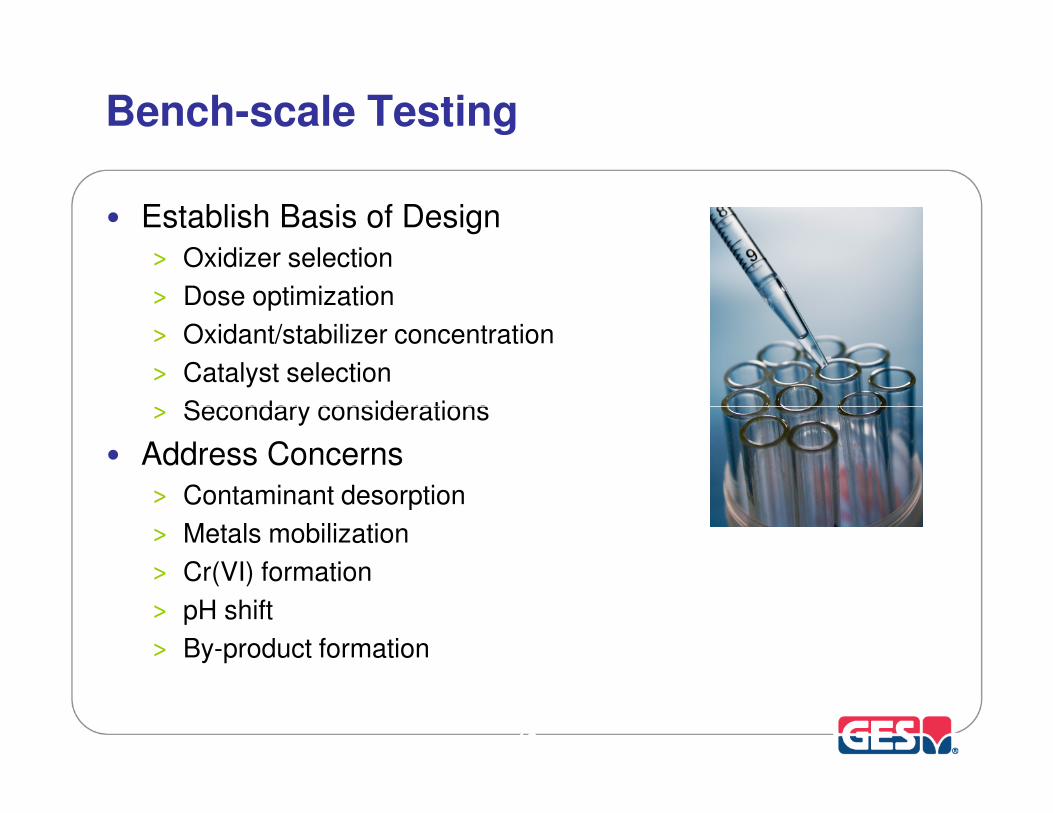
Bench-scale Testing
• Establish Basis of Design
> Oxidizer selection
> Dose optimization
> Oxidant/stabilizer concentration
> Catalyst selection
> Secondary considerations> Secondary considerations
• Address Concerns
> Contaminant desorption
> Metals mobilization
> Cr(VI) formation
> pH shift
> By-product formation
1212

Dose Optimization
• Some metals can be mobilized by oxidizing conditions
• Redox sensitive metals must be considered
> Cr 3+ → Cr 6+
• Bench-Scale and Pilot Test Important
> Directly measure constituent concentrations
Metals Mobilization
> Directly measure constituent concentrations
> Evaluate “buffering” capacity of site
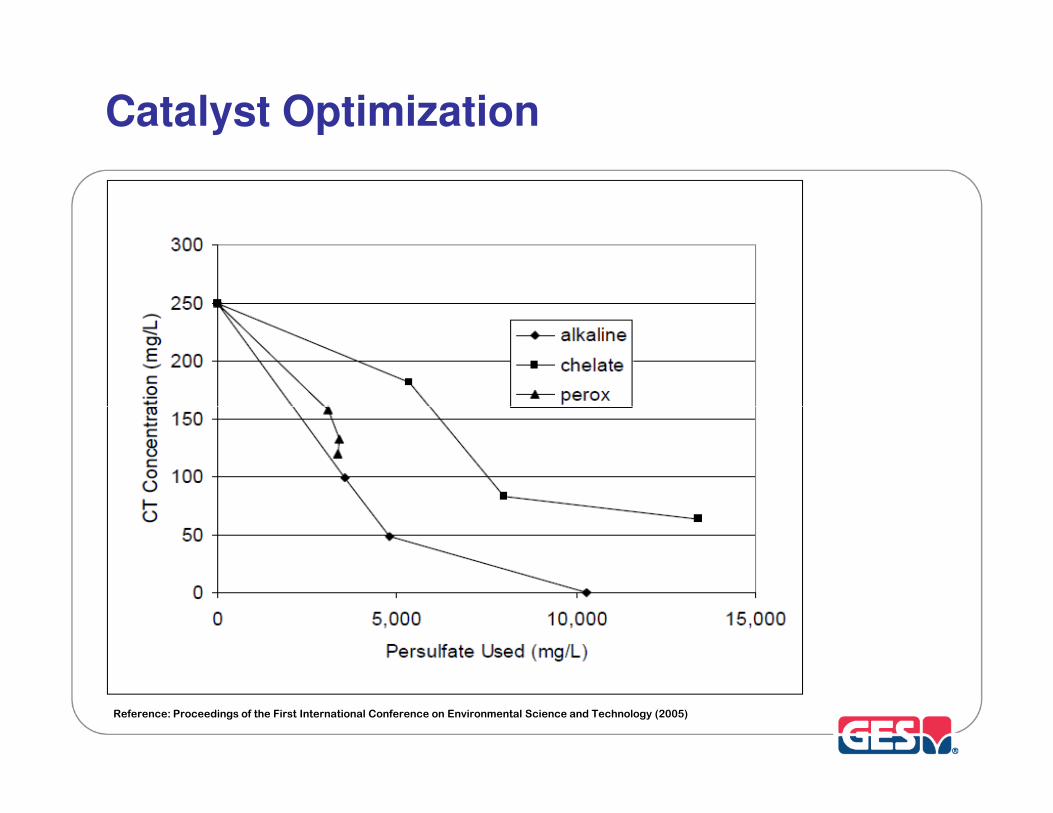
Catalyst Optimization
Reference: Proceedings of the First International Conference on Environmental Science and Technology (2005)

Activation Method Optimization
Reference: Proceedings of the First International Conference on Environmental Science and Technology (2005)
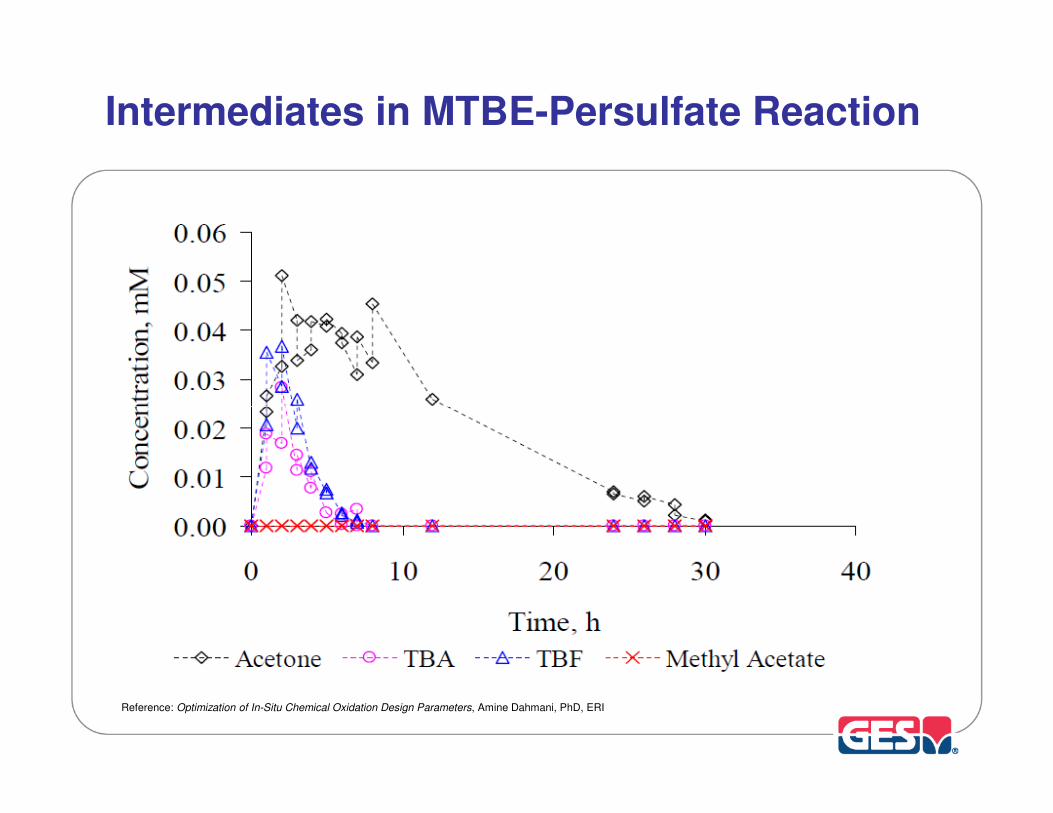
Intermediates in MTBE-Persulfate Reaction
Reference: Optimization of In-Situ Chemical Oxidation Design Parameters, Amine Dahmani, PhD, ERI

Pilot Tests
Pilot tests are performed on targeted area(s) of the site
• Common Objectives
> Radius of influence
> Rate of application
> Field-scale inefficiencies
> Field oxidant volume estimates
> Evaluate injection design
• Cost Estimate for Full-Scale Implementation
• Another Opportunity to Say “No”

Case Study: Bulk Storage Facility
• Background
> Petroleum bulk storage facility
> 125 million gallon storage capacity
> 200 acres
> COCs – gasoline, diesel, heavy fuel oil
• Geology
> Heterogeneous deposits
> Sand, silt, clay, some gravel
> Clay unit underlies superficial water
bearing unit
• Hydrogeology
> Aquifer: 5 – 35 feet thick
> DTW: 1 – 29 feet bgs
> Hydraulic gradient: 0.04 ft/ft to 0.005 ft/ft
> Hydraulic conductivity: 0.003 ft/min to 0.024 ft/min
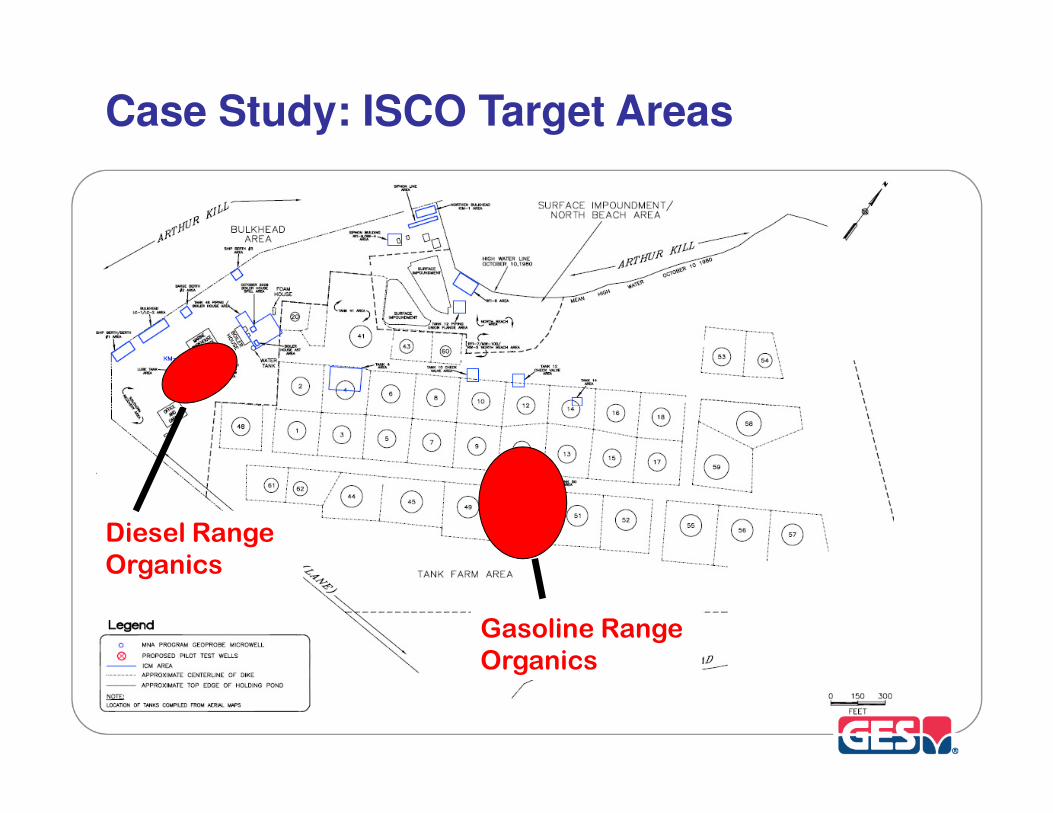
Case Study: ISCO Target Areas
Gasoline Range
Organics
Diesel Range
Organics
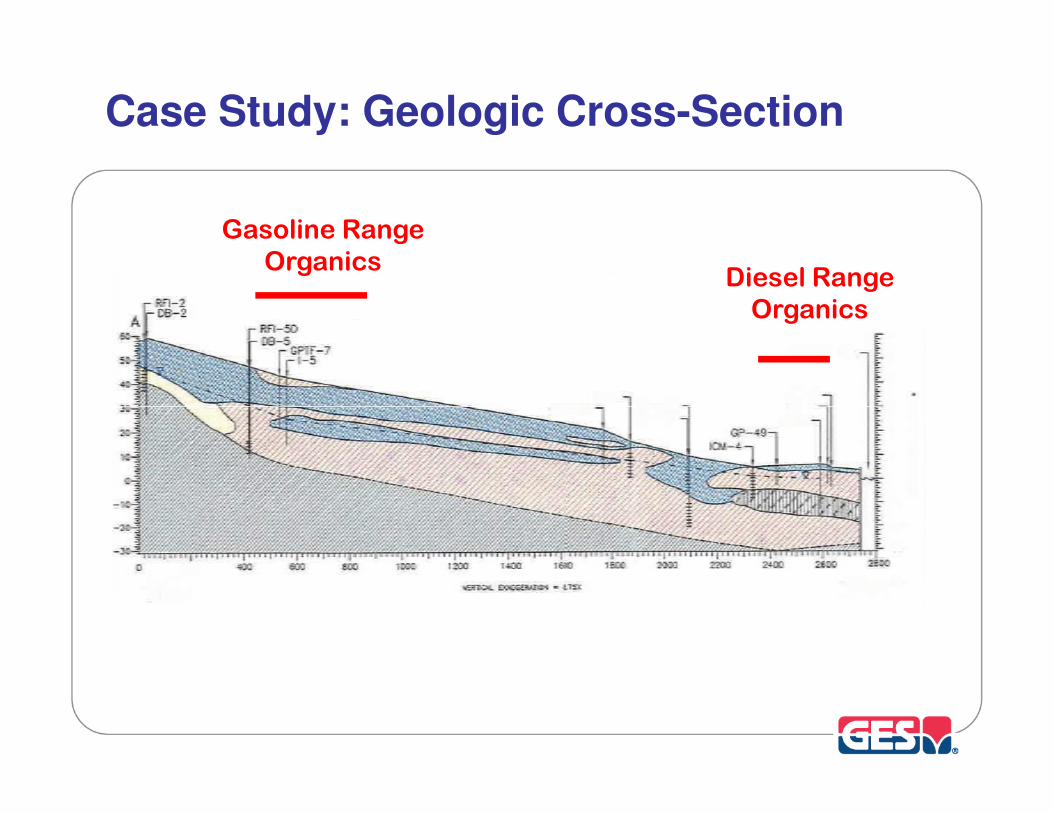
Case Study: Geologic Cross-Section
Diesel Range
Organics
Gasoline Range
Organics
Case Study: Treatability Study Objectives
Process Variable Evaluation/Optimization• Chemistry Optimization
• Oxidant Stability / Gas Evolution
• Soil Oxidant Demand
• Soil Buffering Capacity• Soil Buffering Capacity
• Optimize Reaction Chemistry
> Oxidizer Dose
> Oxidant Determination
• Address Concerns
> pH reduction (persulfate)
> Chromium VI

Case Study: Chemistry Optimization
• Sodium Persulfate / Hydrogen Peroxide Activation
> Activate with H2O2 / Persulfate
> Activate with EDTA-Iron
• Hydrogen Peroxide
> EDTA-Iron
> Stability of peroxide
• Catalyst Evaluation
> EDTA only
> Utilize “native” iron
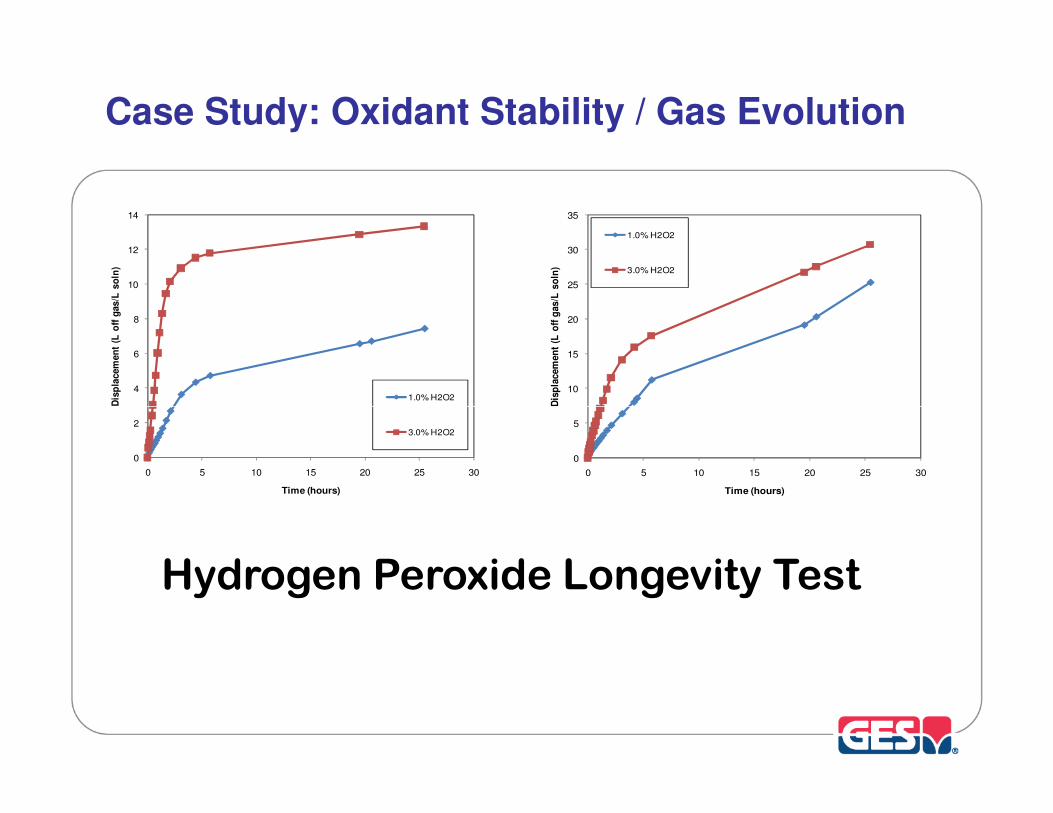
Case Study: Oxidant Stability / Gas Evolution
10
15
20
25
30
35
Dis
pla
cem
en
t (L
off
gas/L
so
ln)
1.0% H2O2
3.0% H2O2
4
6
8
10
12
14
Dis
pla
cem
en
t (L
off
gas/L
so
ln)
1.0% H2O2
0
5
0 5 10 15 20 25 30
Dis
pla
cem
en
t (L
off
gas/L
so
ln)
Time (hours)
0
2
0 5 10 15 20 25 30
Time (hours)
3.0% H2O2
Hydrogen Peroxide Longevity Test
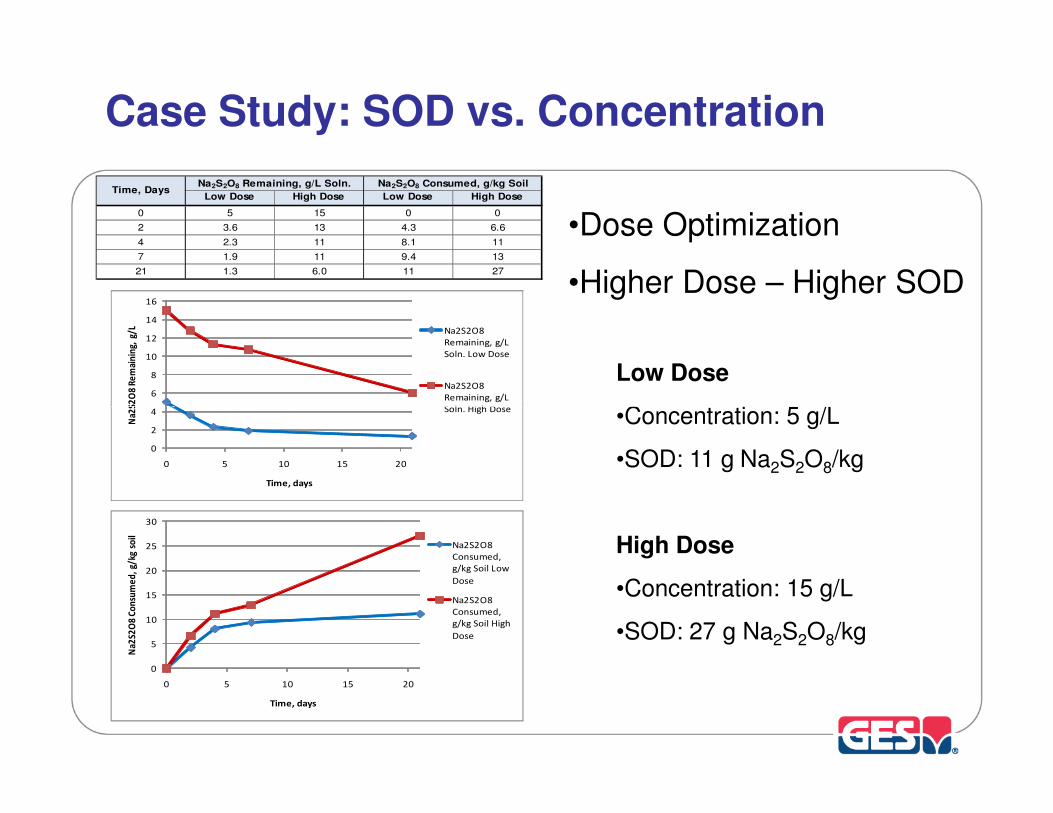
Case Study: SOD vs. Concentration
Low Dose High Dose Low Dose High Dose
0 5 15 0 0
2 3.6 13 4.3 6.6
4 2.3 11 8.1 11
7 1.9 11 9.4 13
21 1.3 6.0 11 27
Time, DaysNa2S2O8 Remaining, g/L Soln. Na2S2O8 Consumed, g/kg Soil
4
6
8
10
12
14
16
Na2
S2O
8 R
em
ain
ing,
g/L Na2S2O8
Remaining, g/L
Soln. Low Dose
Na2S2O8
Remaining, g/L
Soln. High Dose
•Dose Optimization
•Higher Dose – Higher SOD
Low Dose
•Concentration: 5 g/L0
2
4
0 5 10 15 20
Na2
S2O
8 R
em
ain
ing,
g/L
Time, days
Soln. High Dose
0
5
10
15
20
25
30
0 5 10 15 20
Na2
S2O
8 C
on
sum
ed
, g/
kg s
oil
Time, days
Na2S2O8
Consumed,
g/kg Soil Low
Dose
Na2S2O8
Consumed,
g/kg Soil High
Dose
•Concentration: 5 g/L
•SOD: 11 g Na2S2O8/kg
High Dose
•Concentration: 15 g/L
•SOD: 27 g Na2S2O8/kg

Case Study: Soil Buffering Capacity
4
5
6
7
8
pH
None (DI Control)
Amount of Acid Added
PAIR 1•Assess pH drop
following persulfate
injection
•Mild buffering capacity
0
1
2
3
4
-1 1 3 5 7 9 11 13 15 17 19 21
pH
Time (d)
100 mmol H+/kg soil (pH 1)
10 mmol H+/kg soil (pH 2)
1 mmol H+/kg soil (pH 3)
•Mild buffering capacity
of soil
•May require pH
adjustment following
persulfate injection
•All samples similar
results
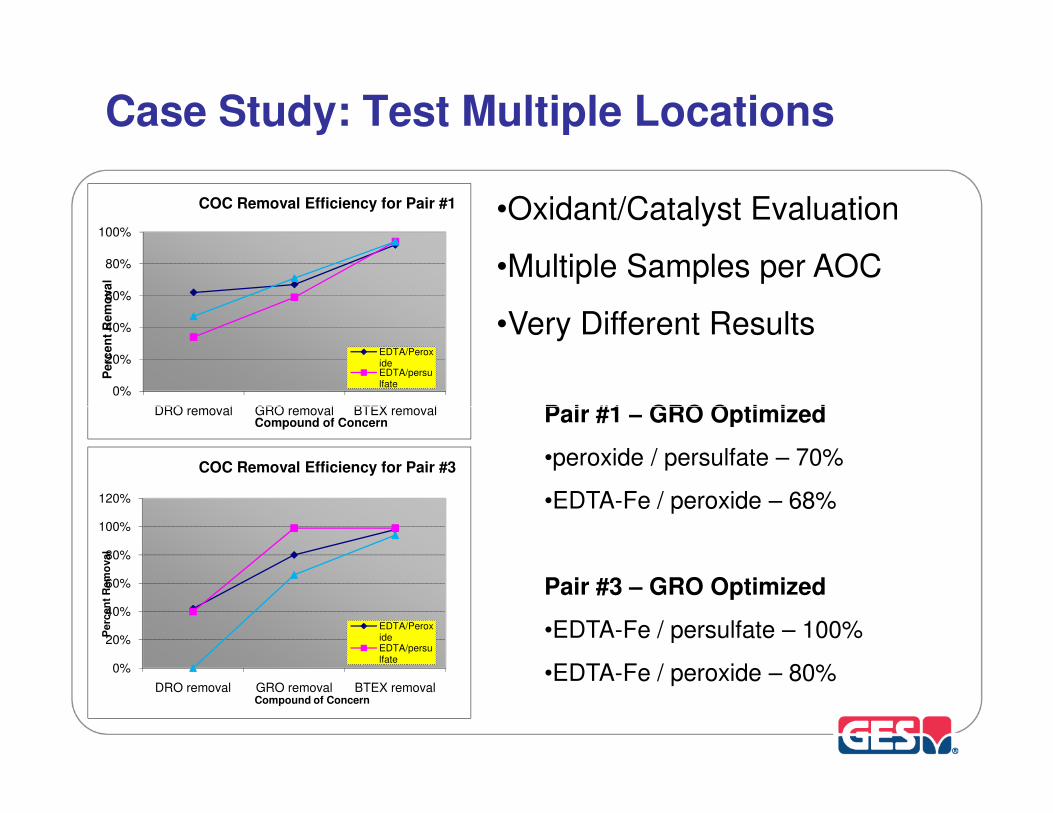
Case Study: Test Multiple Locations
•Oxidant/Catalyst Evaluation
•Multiple Samples per AOC
•Very Different Results
Pair #1 – GRO Optimized0%
20%
40%
60%
80%
100%
DRO removal GRO removal BTEX removal
Pe
rce
nt
Re
mo
va
l
COC Removal Efficiency for Pair #1
EDTA/PeroxideEDTA/persulfate
Pair #1 – GRO Optimized
•peroxide / persulfate – 70%
•EDTA-Fe / peroxide – 68%
Pair #3 – GRO Optimized
•EDTA-Fe / persulfate – 100%
•EDTA-Fe / peroxide – 80%
DRO removal GRO removal BTEX removalCompound of Concern
0%
20%
40%
60%
80%
100%
120%
DRO removal GRO removal BTEX removal
Perc
en
t R
em
oval
Compound of Concern
COC Removal Efficiency for Pair #3
EDTA/PeroxideEDTA/persulfate
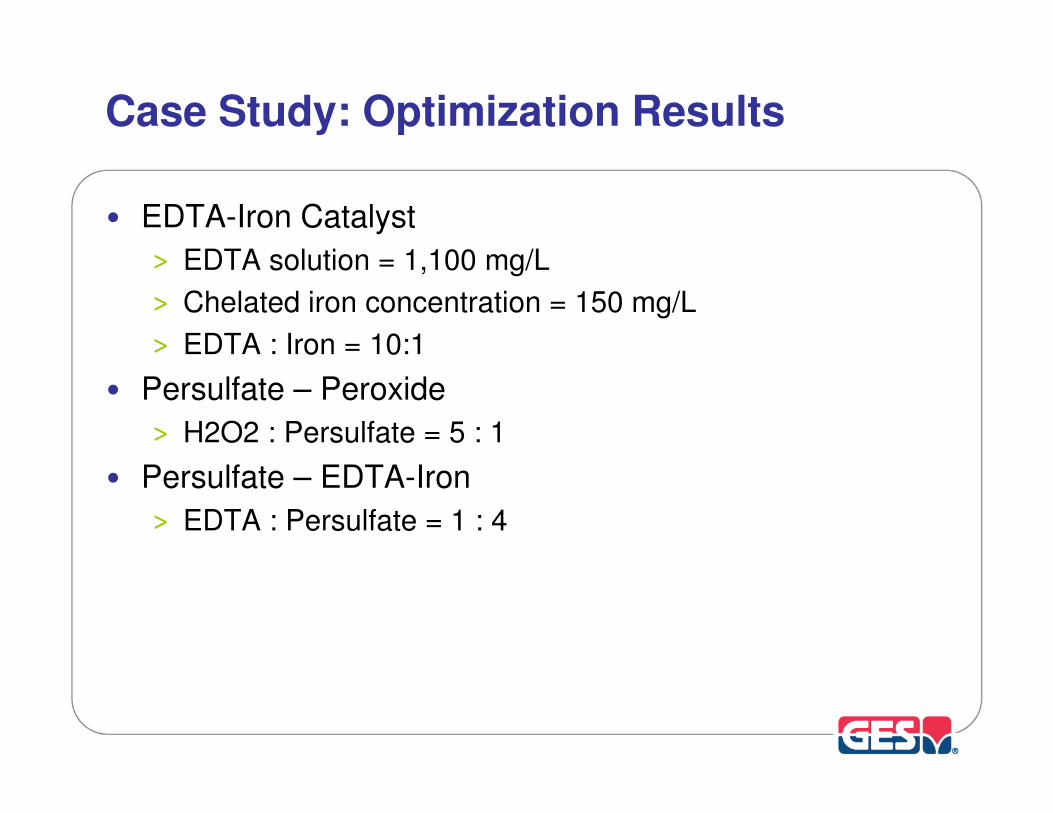
Case Study: Optimization Results
• EDTA-Iron Catalyst
> EDTA solution = 1,100 mg/L
> Chelated iron concentration = 150 mg/L
> EDTA : Iron = 10:1
• Persulfate – Peroxide
> H2O2 : Persulfate = 5 : 1
• Persulfate – EDTA-Iron
> EDTA : Persulfate = 1 : 4
Summary
• Treatability Testing is Valuable
> Process optimization
> Cost information
• Decision Making Enhanced
> Site-specific data
”Happy is he who gets to know
the reason for things.”
- Virgil
> Go / No-go earlier in design process
• Lessons Learned
> Optimize chemistry
> Develop contingencies for concerns
> Even “Simple Sites” benefit
2929

Treatability Testing for In-Situ Chemical Oxidation
Jerry Cresap, PE
Regional Engineering ManagerRegional Engineering Manager


