Abstract Adsorption technology is accepted worldwide because of its application in environmental engineering. Different fruit peels were used as activated carbon for the treatment of synthetic greywater. The activated carbon was prepared from the peels of banana, orange and sapodilla. The fruit peels were collected from the three juice shops and fifteen houses of Qasimabad Hyderabad. Based on one-month data, the fruit waste generation was calculated per day, per week and month. The treatment of synthetic greywater using fruit peels as an adsorbent and the treatment efficiency of orange peels adsorbent, banana peels adsorbent, and sapodilla peels adsorbent were observed. The peels were first segregated and washed several times to remove dirt, and other impurities then dried in an oven at a temperature of 105˚C for 24 hours to remove the moisture content. The synthetic greywater was prepared by different constituents to check its physicochemical parameters. The activated carbon agent phosphoric acid was used to prepare activated carbon then it was used as a coagulant for the removal of different impurities present in synthetic greywater. An effort has been made to give a brief idea of an approach to wastewater treatment, particularly discussing and highlighting, in brief, the low-cost alternative adsorbents to utilize these waste/low-cost materials.
on. Sci., 2019, Volume 10, Issue 10, Page 966-986 tp://www.jmaterenvironsci.com
Treatment of Synthetic Greywater by Using Banana, Orange and
Sapodilla Peels as a Low Cost Activated Carbon
Muhammad Yousuf Jat Baloch 1* & Sajid Hussain Mangi 2 1School of Environmental Studies, China University of Geosciences Wuhan, Hubei Province, 430074, P.R. China
2 Institute of Environmental Engineering and Management, Mehran University of Engineering & Technology, Jamshoro, Sindh, Pakistan
1. Introduction
Water is the basic need for survival of human beings. The scarcity of fresh water is increasing day by day. Fruit wastes (like Banana, Orange, etc.) are agricultural waste which is discarded as a waste material in all over the world [1]. The grey water is the waste water that is generated in the offices buildings, household and from streams without fecal contamination. Greywater also called as sullage and it contains lesser pathogens as compared to domestic wastewater. Water from sinks, laundry showers, baths, washing machine and kitchen are the sources of greywater. It is generally easier to treat, safer to handle and reuse onsite for landscape or crop irrigation. The reuse of greywater also reduces the demand for fresh water supply. Water pollution is a global problem and its control has become increasingly important in recent years [2]. Greywater treatment and reuse is becoming a significant field of research in a worldwide context of increasing water shortage. Dissolved pollutants (organic and inorganic) of water can be removed through an effective adsorption technique. Activated carbon (AC) is very familiar with all types of adsorbents due to high adsorption capacity. The adsorption frequency of activated charcoal relates to its great surface area, high pores distribution, and rapid grade of external reactivity [3]. Activated carbons are mostly extracted from raw materials in an environment through carbonization and followed by the activation process of the charcoal material. The activation process can be carried out by chemical or physical activation [4]. Activated carbon technology treats mostly the organic pollutants like VOCs etc. The US Environmental Protection Agency cited the activated carbon adsorption as one of the best control technologies
Baloch et al., J. Mater. Environ. Sci., 2019, 10 (10), pp. 966-986 967
available.[5] The wastewater consists of different types of waste like organic substances (Proteins, carbohydrates and lipids), total solids, nitrates, metals, etc. [6]. There are many technologies to treat the water, bio-adsorption technique is also one of them. Wastewater treatment plants concerning cost involvement and these plants have also problems related to disposal [7]. To overcome this issue fruit waste is used as an adsorbent for the treatment of wastewater. Adsorption is that type of technique which is the most economic and efficient and does not require any type of energy for the treatment of wastewater; this technology is environment-friendly[8]. Various agro- wastes and fruit waste are used as adsorbents for the treatment of water, such as banana peel [9,10], orange peel [11], pomegranate [12], caulerpa lentillifera [13,14] Corn Cob [15-17] and agricultural wastes [18-20]. As fruit waste is easy to available and biodegradable material, which may cause leachate when it is discarded in an open atmosphere. Adsorption is the process in which matter is extracted from one phase and concentrated at the surface of a second phase [21]. Nowadays, the population of Pakistan burgeoning day by day and industries have also been increased, which has caused a severe problem regarding the availability of fresh water in the country [22]. Various researchers have conducted studies on drinking water quality throughout the different regions of Pakistan. In, Pakistan, 20% population have access to safe drinking water [22], which is an alarming situation for the future generation that’s why it was decided to treat the wastewater using such technology which should be economical, cost effective and efficient for the removal of physicochemical parameters of greywater. The scope of this research is to compare the treatment efficiency of different fruit peels used as an adsorbent for the treatment of domestic greywater. As fruit waste is dumped openly in our country which may cause leachate and leachate will degrade our earth. The lab study on the treatment of domestic greywater from fruit peels will give the idea for the treatment of domestic wastewater at large scale.
2 Materials & Methods 2.1 Preparation of Domestic Greywater Greywater is a type of wastewater used for various activities like washing purpose, kitchen, and showers etc. excluding excreta arise from toilets. Hair’s traces food constituents, household products and dirt can be observed in the composition of greywater. It may even appear unclean, but at the same time in some cases, it can be valuable for plants. The availability of nutritious elements in greywater released from homes are the basic cause of pollution, and these nutritious elements can be a productive fertilizer for plants [23]. In this study, the synthetic greywater was prepared from components usually present in greywater. The constituents including 85 mg/L of dextrin, 75 mg/L of ammonium chloride, 70 mg/L of yeast extract, 55 mg/L of soluble starch, 30 mg/L of washing powder, 11.5 mg/L of sodium dihydrogen phosphate, 4.5 mg/L of Potassium sulphate, 10 ml/L of settled sewage and 0.1 ml/L of shampoo and oil as shown in Table 1. The domestic greywater recipe was prepared by the following constituents [24] Table 1 Synthetic wastewater preparation recipe
Baloch et al., J. Mater. Environ. Sci., 2019, 10 (10), pp. 966-986 968
Segregation of peels
Washing of fruit peels several times to remove dirt and other impurities
De-watering of fruit peels at 105˚C for 24 hours
Carbonization process at 400˚C for 30 minutes after adding 30% phosphoric acid
Preparation of activated carbon at 800˚C for 10 minutes in muffle furnace
Grinding of peels
Adsorbent
Collection of fruit peels
2.2 Preparation of Adsorbent Mixed fruit waste was collected from 15 houses and three juice shops of Qasimabad Hyderabad as shown in figure 1. After the collection of fruit waste, the waste was separated and peels were collected of required fruit waste after the separation, fruit peels were washed several times to remove dirt and other impurities, then dried for 24 hours into oven at a temperature of 105˚C to remove the moisture content.
Banana peels Orange peels Sapodilla peels Figure 1: Fruit waste was collected from houses and juice shops
2.3 Making of activated carbon from Fruit peels (Carbonization process) Carbonization with Phosphoric Acid H3PO4: The material was soaked in 30% solution of phosphoric acid for 24 hours. After saturation, the liquid portion was drawn off and then dried. The dried mass was subjected to carbonization process at 400˚C, powdered well and finally activated at 800˚C for 10 minutes [8]. After the processes of de-hydration and carbonization fruit peels were grinded into electric grinder to make it into powder form which was called as adsorbent. Figure 2 shows, the complete process of preparation of adsorbent from the fruit peels.
Figure 2: Complete process of preparation of adsorbent from the fruit peels
Baloch et al., J. Mater. Environ. Sci., 2019, 10 (10), pp. 966-986 969
2.4 Batch Adsorption Experiment This experimental work was carried out in the batch study, in which different samples were taken in conical flasks to measure the adsorption capacity of the adsorbent. 100 ml samples of domestic greywater were taken with 1.0g of banana, orange and sapodilla adsorbents [25] and were shacked at 180 rpm in mechanical shaker at different the stirring times (i.e. contact time) from 30 min, 1 h, 2 h, 4 h, 6 h. After shaking, the samples were filtered with Whatman filter paper No.42 to separate the adsorbent and water sample; then the sample was stored to analyze the different physio-chemical parameters before and after the adsorbent used. [21].
2.5 Adsorbent Dosages The study was carried out at different dosages of fruit peels adsorbent to get the maximum removal efficiency of physicochemical parameters removal which were present in domestic greywater. The dosage of banana, orange and sapodilla peels in this study different dosage were taken 0.5, 1, 1.5 and 2g in four sets of the 100ml conical flask and these flasks were shaken for 1 hour with 180 rpm at a 25oC temperature [25].
2.6 Laboratory Analysis Different physicochemical parameters of domestic greywater were analyzed. Turbidity were analyzed by nephloturbidimeter method, Total Suspended Solids were analyzed by DR 2000 Spectrophotometer Method, Chemical Oxygen Demand were analyzed by APHA 5220 D (Closed Reflux, Colorimetric Method), Biochemical Oxygen Demand were analyzed by US-EPA 5210 B (5 days BOD Method), lead and chromium were analyzed by Atomic Absorption Spectrophotometer (AAS). Physicochemical parameters with their equipment name and method as shown in table 2.
Table 2 Physicochemical parameters of domestic greywater
S.R# Parameter Standard Method 01 Turbidity Nephloturbidimeter Method
02 Total Suspended Solids DR 2000 Spectrophotometer Method
03 Chemical Oxygen Demand APHA 5220 D (Closed Reflux, Colorimetric Method) 04 Biochemical Oxygen Demand US-EPA 5210 B (5 days BOD Method)
Turbidity Turbidity is the physical parameter of water quality and it is the cloudiness or dirtiness of water which is caused by fine suspended solid particles like silt, clay organic and inorganic matter etc. These fine solid particles are invisible to our naked eyes. This parameter of water is measured by nephloturbidimeter method. Turbidity is measured in Nephlo Turbidity Unit (NTU), according to NEQS the standard value of turbidity in drinking water must not be exceeded to 5 NTU. It is used to measure the presence of turbidity in domestic greywater. The main purpose of this parameter to analyze in water is to stop the growing of different micro-organisms which grow due to the turbid water. The turbid water effects not only on human health but also effects aquatic life like fish, plankton, zooplankton, etc.
Total Suspended Solids The suspended particles are those particles which may not pass through filter paper. TSS is also called as conventional pollution according to US EPA clean water act. (Source: wikipedia.org). According to SEQS, the wastewater can be used as effluent if it has TSS up to 200 mg/L. TSS can be analyzed by two methods, one is the gravimetric method, and the other one is a colorimetric method. In this research work, TSS were analyzed through
Baloch et al., J. Mater. Environ. Sci., 2019, 10 (10), pp. 966-986 970
Colorimetric (DR 2000 Spectrophotometer) method. TSS may include a wide variety of silt, clay, animal decaying and industrial waste which may cause serious problem for aquatic life and water streams.
Chemical Oxygen Demand The Chemical Oxygen Demand (COD) is the amount of oxygen consumed by organic matter in a solution. In
this research work, the closed reflux / colorimetric method was used to determine the amount of COD in domestic greywater before and after adsorbent. According to SEQS, the COD of effluent must be less than 150 mg/L. In closed reflux / colorimetric method, first of all, sample is digested through COD digester at 150◦C for a time duration of 2 hours and cool it at room temperature and analyze the COD of the sample through COD photometer.
Biochemical Oxygen Demand The Biochemical Oxygen Demand is the amount of oxygen required to microorganisms for the decomposition
of organic matter present in wastewater. In this research work, the BOD was analyzed by 5 – days BOD method. According to SEQS the BOD of effluent must be less than 80 mg/L.
Lead Lead is the heavy metal which is generally present in wastewater. The main sources of lead into wastewater are lead-acid batteries, ceramics and leather industries. The standard method of lead analysis is Atomic Absorption Spectrophotometer method. According to SEQS, the lead of effluent must be less than 0.5 ppm.
Chromium Chromium is also a type of brittle, hard metal. The major source of chromium is ores of chromite. The chromium is also called as carcinogenic heavy metal [26]. According to SEQS, the chromium of effluent must be less than 0.1 ppm.
3. Results & Discussion 3.1 Fruit Waste Generation in Qasimabad Hyderabad A survey was conducted in Qasimabad to check generation of fruit waste. In this survey 3 juice shops and 15 houses with three categories like upper class, middle class and lower class houses. From fruit juice shops, the data was collected seven days continuously, and it was calculated per day and per week.
Fruit Juice Center Qasimabad Fruit waste generation data from fruit juice center was collected in seven days, and the total fruit waste was also calculated with each type of waste. Table No. 3 shows the total fruit waste generation Apple which 14.6 Kg/week, Banana waste 107.13 Kg/week, 71.1Kg / week and sapodilla waste 10.44 Kg/week. The average weight of Apple waste generation per day will be equal to 2.087 Kg, The average weight of Banana waste generation per day was equal to 15.30 Kg, the average weight of Orange waste generation per day was equal to 10.15 Kg and the average weight of sapodilla waste generation per day was equal to 1.49 Kg. While the average weight of Fruit waste generation of shop per day was equal to 29.027 Kg.
Table 3: Fruit waste generation of fruit juice center
Name of Fruit Units Day 1 Day 2 Day 3 Day4 Day 5 Day 6 Day 7 Total weight
Apple Kg 3.2 1.7 0.6 0.7 2.3 3.7 2.4 14.6 Banana Kg 17.4 15.8 12.5 14.23 15.4 19.5 12.3 107.13 Orange Kg 10.4 11 13.1 5.8 12.4 8.8 9.6 71.1
Sapodilla Kg 1.75 2.25 1 0.65 1.57 1.35 1.87 10.44
Baloch et al., J. Mater. Environ. Sci., 2019, 10 (10), pp. 966-986 971
Al – Shahbaz Juice Center Qasimabad Hyderabad From this fruit juice shop, the data of fruit waste generation were collected for seven days. As shown in table no. 4 the generation of total fruit waste of apple was 9.9 Kg, banana waste was 37 Kg, orange waste 28.3 Kg and sapodilla waste was 5.26 Kg. Table 4 Fruit waste generation of Al - Shahbaz juice center
Name of Fruit Units Day 1 Day 2 Day 3 Day4 Day 5 Day 6 Day 7 Total weight
Apple Kg 0.8 1.1 0.9 1.5 2.3 1.7 1.6 9.9 Banana Kg 2.3 7.8 5.3 2.7 5.4 6.2 7.3 37 Orange Kg 6.1 2.1 3.3 6.1 5.1 3.4 2.2 28.3
Sapodilla Kg 0.56 1.1 1.24 0.87 0.5 0.32 0.67 5.26
The average fruit waste of Al – Shahbaz juice center per day was estimated 11.48 kg/day. The average weight of Apple waste generation per day was equal to 1.41 Kg, the average weight of Banana waste generation per day was equal to 5.28 Kg, the average weight of Orange waste generation per day was equal to 4.04 Kg and the average weight of sapodilla waste generation per day was equal to 0.75 Kg.
Masha Allah Fruit Juice Center Qasimabad Hyderabad
Table No. 5 shows the data of fruit waste generation from Masha Allah fruit juice center Qasimabad.
Table 5: Fruit waste generation of Masha Allah juice center
Name of Fruit Units Day 1 Day 2 Day 3 Day4 Day 5 Day 6 Day 7 Total weight
Apple Kg 4.3 3.2 1.1 1.2 2.5 3.8 2.7 18.8 Banana Kg 8 8.89 9.01 5.5 10.2 7.75 7.32 56.67 Orange Kg 3.41 6.89 6.91 3.31 10 9.75 7.68 47.95
sapodilla Kg 1.68 2.2 1.32 0.89 1.10 0.34 0.46 7.99
The average weight of Apple waste generation per day was equal to 2.68 Kg, the average weight of Banana waste generation per day was equal to 8.09 Kg, the average weight of Orange waste generation per day was equal to 6.85 Kg and the average weight of sapodilla waste generation per day was equal to 1.14 Kg while the average weight of Fruit waste generation of shop per day was equal to 18.76 Kg.
Fruit waste generation of upper-class houses The generation of fruit waste data was collected four weeks continuously. The waste was collected at every last day of the week and then was segregated and measured the amount of different type of waste. Table No. 6 to 9 shows the data of fruit waste generation in four weeks. Table no. 10 shows the fruit waste generation of a house per day, per week and month.
Table 6: Fruit waste generation of upper class houses 1st week
House No.
Units Orange Grey fruit
Pomegranate Apple Sapodilla Papaya Banana Total weight
01 Kg 0.5 0.35 0.7 0.4 0.2 0.15 0.7 3 02 Kg 0.3 - 0.4 0.2 0.1 0.6 0.4 2 03 Kg 0.4 0.2 - - 0.4 0.3 0.8 2.1 04 Kg 0.2 0.1 - 0.3 0.2 0.2 1 05 Kg 0.6 0.4 0.6 - 0.4 - 0.9 2.9
Baloch et al., J. Mater. Environ. Sci., 2019, 10 (10), pp. 966-986 972
Table 7: Fruit waste generation of upper class houses 2nd week
House No.
Units Orange Grey fruit
Pomegranate Apple Sapodilla Papaya Banana Total weight
01 Kg 0.3 - - 0.1 0.3 0.3 0.3 1 02 Kg 0.4 0.3 0.4 - 0.2 0.15 0.2 1.75 03 Kg 0.2 0.2 0.3 - 0.25 - - 1.15 04 Kg 0.4 - 0.25 0.2 - 0.4 0.1 1.25 05 Kg 0.6 0.4 0.4 - 0.1 - - 1.6
Table 8: Fruit waste generation of upper class houses 3rd week
House No.
Units Orange Grey fruit
Pomegranate Apple Sapodilla Papaya Banana Total weight
01 Kg 0.4 - 0.45 - 0.1 - 0.5 1.45 02 Kg 0.5 0.7 0.6 0.2 0.4 - 0.4 2.8 03 Kg - 0.6 0.4 0.15 0.15 0.35 - 1.65 04 Kg 0.4 - - 0.1 - 0.2 0.3 1.0 05 Kg 0.4 0.6 0.4 - 200 0.45 0.5 2.55
Table 9: Fruit waste generation of upper class houses 4th week
House No.
Units Orange Grey fruit
Pomegranate Apple Sapodilla Papaya Banana Total weight
01 Kg 0.35 0.2 0.6 0.4 0.35 0.1 0.6 0.26 02 Kg 0.25 0.1 0.25 0.1 0.2 0.45 0.4 1.75 03 Kg 0.6 0.1 0.6 - 0.4 0.4 0.9 3.0 04 Kg 0.2 - 0.1 0.15 0.3 0.2 0.55 1.5 05 Kg 0.4 0.2 0.4 0.1 0.1 - 0.4 1.6
Table 10: Fruit waste generation of each house in per day, per week and month
Fruit waste generation of middle-class houses The same practice was repeated in middle-class houses at the beginning of the week the plastic shoppers were handed over to each house and last day of week fruit waste collected from the houses and segregated and then measured each type of fruit waste. Table no. 11 to 13 shows the generation of fruit waste of each house in kilograms.
Baloch et al., J. Mater. Environ. Sci., 2019, 10 (10), pp. 966-986 973
Table 11: Fruit waste generation of middle class houses 1st week
House No.
Units Orange Pomegranate Apple Sapodilla Banana Total weight
01 Kg 0.4 - - 0.1 0.5 1 02 Kg 0.3 0.2 - 0.1 0.4 1 03 Kg 0.1 0.2 0.1 0.2 0.2 0.8 04 Kg 0.15 0.1 0.1 0.1 0.25 0.7 05 Kg 0.1 - - 0.15 0.25 0.5
Table 12: Fruit waste generation of middle class houses 2nd week
House
No. Units Orange Pomegranate Apple Sapodilla Banana Total weight
01 Kg 0.35 0.2 0.15 0.2 0.5 1.4 02 Kg 0.17 - - 0.15 0.18 0.5 03 Kg 0.2 - - 0.1 0.3 0.6 04 Kg 0.3 0.5 0.2 - - 1 05 Kg 0.6 0.2 0.3 0.2 0.2 1.6
Table 13: Fruit waste generation of middle class houses 3rd week
House
No. Units Orange Pomegranate Apple Sapodilla Banana Total weight
01 Kg 0.15 0.12 0.04 0.06 0.13 0.5 02 Kg 0.5 0.2 0.1 0.2 - 1 03 Kg 0.2 - 0.08 0.1 0.16 0.54 04 Kg - 0.2 - 0.1 - 0.3 05 Kg 0.2 0.1 - 0.1 0.2 0.6
Fruit waste generation of lower class houses Fruit waste generation from lower class houses also was done by the same procedure as in upper and middle-class house. In this class of houses only two weeks data was collected and in the third week, no any data was obtained. Table no. 14 and 15 show the fruit waste generation of lower class houses.
Table 14: Fruit waste generation of lower class houses 1st week
House No.
Units Orange Apple Sapodilla Banana Total weight
01 Kg 0.2 - 0.1 0.2 0.5 02 Kg 0.1 - 0.1 0.28 0.48 03 Kg 0.1 0.1 - 0.2 0.4 04 Kg 0.13 - 0.1 0.15 0.38 05 Kg 0.2 - 0.1 0.3 0.6
Table 15: Fruit waste generation of lower class houses 2nd week
House No.
Units Orange Apple Sapodilla Banana Total weight
01 Kg 0.15 - 0.1 0.3 0.55 02 Kg 0.1 - 0.1 0.2 0.4 03 Kg 0.15 - 0.05 0.4 0.6 04 Kg 0.11 0.07 0.1 0.2 0.48 05 Kg 0.14 0.1 - 0.3 0.54
Baloch et al., J. Mater. Environ. Sci., 2019, 10 (10), pp. 966-986 974
3.2 Treatment of Domestic Greywater by Using Activated Carbon as an Adsorbent The general water quality parameters like Turbidity, Total Suspended Solids, COD, BOD, Chromium and Lead were tested for domestic greywater before and after adsorbent. For the analysis of different physicochemical parameters, 12 samples of synthetic wastewater were prepared under different experimental conditions.
3.3 Effect of Bio-adsorbent Dosages Various dosage of the prepared banana peels, orange peels and sapodilla peels bio-adsorbent used to treat the domestic greywater. The parameters such as Turbidity, TSS, BOD, COD, Chromium and Lead have been changed with the increase in the bio-adsorbent dosage. The effects of adsorbent dosage were varied from 0.5 to 2 g for banana peel, orange peel and sapodilla peel individually. Hence 1 g was found to be the optimum dosage in treating the domestic greywater for banana and orange adsorbent.[27]
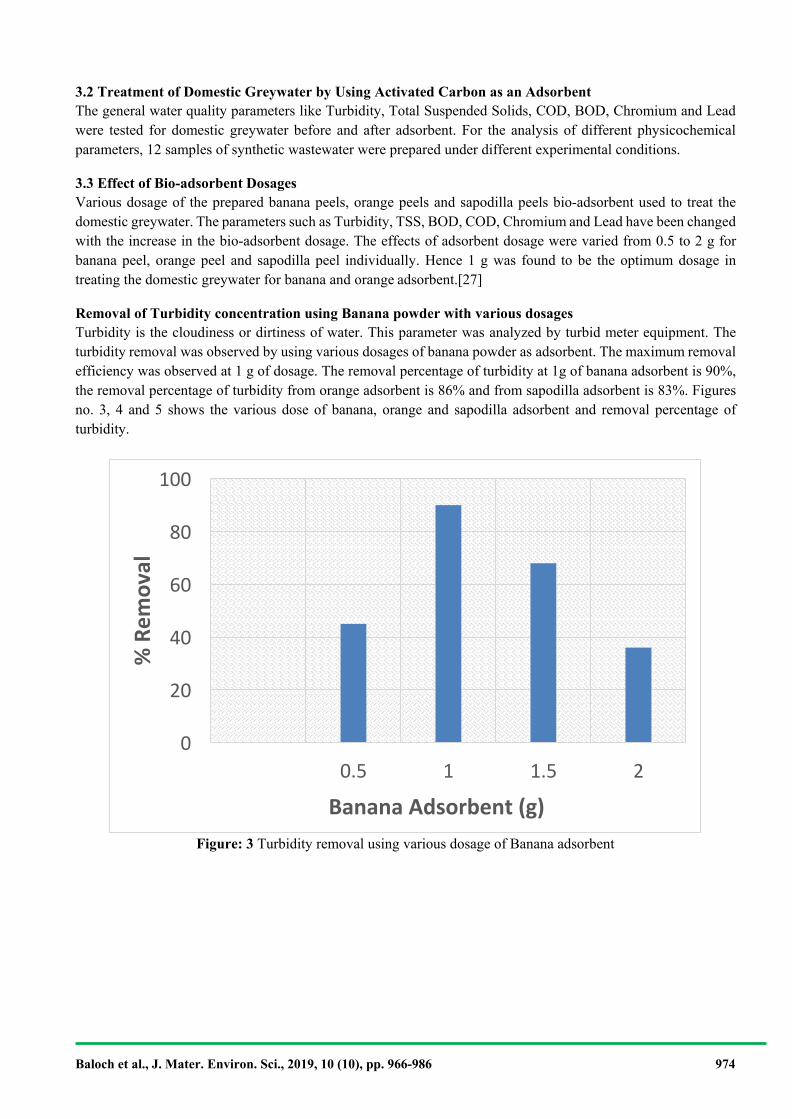
Removal of Turbidity concentration using Banana powder with various dosages Turbidity is the cloudiness or dirtiness of water. This parameter was analyzed by turbid meter equipment. The turbidity removal was observed by using various dosages of banana powder as adsorbent. The maximum removal efficiency was observed at 1 g of dosage. The removal percentage of turbidity at 1g of banana adsorbent is 90%, the removal percentage of turbidity from orange adsorbent is 86% and from sapodilla adsorbent is 83%. Figures no. 3, 4 and 5 shows the various dose of banana, orange and sapodilla adsorbent and removal percentage of turbidity.
Figure: 3 Turbidity removal using various dosage of Banana adsorbent
Banana Adsorbent (g) 2 1.5 1 0.5
0
20
40
60
80
100
% R
emov
al
Baloch et al., J. Mater. Environ. Sci., 2019, 10 (10), pp. 966-986 975
Figure 4: Turbidity removal using various dosage of Orange adsorbent
Figure 5: Turbidity removal using various dosage of sapodilla adsorbent
Orange Adsorbent (g) 2 1.5 1 0.5 0
100 90 80 70 60 50 40 30 20 10
0
Sapodilla Adsorbent (g)
2 1.5 1 0.5 0
90 80 70 60 50 40 30 20 10
0
% R
emov
al
% R
emov
al
Baloch et al., J. Mater. Environ. Sci., 2019, 10 (10), pp. 966-986 976
Removal of Total Suspended Solids concentration using Banana powder with various dosage Total Suspended Solids are those particles present in wastewater which are not filterable. The maximum removal of TSS is at 1 g of each adsorbent. From banana adsorbent, the removal of TSS is 88%, from orange adsorbent the removal of TSS is 87% and from sapodilla adsorbent the removal of TSS is 75%. Figure 6, 7 and 8 shows the removal percentage of Total Suspended Solids by using banana, orange and sapodilla powder as an adsorbent in domestic greywater.
Figure 6: TSS removal using various dosage of Banana adsorbent
Figure 7: TSS removal using various dosage of Orange adsorbent
Banana Adsorbent (g) 2 1.5 1 0.5
100
80
60
40
20
0
Orange Adsorbent (g) 2 1.5 1 0.5
0
20
40
60
80
100
% R
emov
al
% R
emov
al
Baloch et al., J. Mater. Environ. Sci., 2019, 10 (10), pp. 966-986 977
Figure 8: TSS removal using various dosage of sapodilla adsorbent
Removal of Biochemical Oxygen Demand (BOD) concentration using Banana peels with various dosage Biochemical Oxygen Demand is the amount of oxygen required to microorganisms to decompose the organic matter. The average maximum removal of BOD was at 1.5 g of each adsorbent, but not in orange adsorbent. The removal percentage of Biochemical Oxygen Demand by using Orange powder as an adsorbent in domestic greywater. In orange adsorbent the maximum removal efficiency is obtained at 1 g dosage which is shown in following figure. From banana adsorbent the removal of BOD was 89%, from orange adsorbent the removal of BOD was 93% and from sapodilla adsorbent the removal of BOD was 70%. Figure 9, 10 and 11 show the removal percentage of Biochemical Oxygen Demand by using banana, orange and sapodilla powder as an adsorbent in domestic greywater.
Figure 9: BOD removal using various dosage of Banana adsorbent
Sapodilla Adsorbent (g) 2 1.5 1 0.5
80 70 60 50 40 30 20 10
0
Banana Adsorbent (g) 2 1.5 1
100
80
60
40
20
0
% R
emov
al
% R
emov
al
Baloch et al., J. Mater. Environ. Sci., 2019, 10 (10), pp. 966-986 978
Figure 10: BOD removal using various dosage of Orange adsorbent
Figure 11: BOD removal using various dosage of sapodilla adsorbent
Orange Adsorbent (g) 2 1.5 1
0
20
40
60
80
100
2 1.5 Sapodilla Adsorbent (g)
1
80
70
60
50
40
30
20
10
0
% R
emov
al
& R
emov
al
Baloch et al., J. Mater. Environ. Sci., 2019, 10 (10), pp. 966-986 979
86 84
82
80
78
76
74
72 1 1.5
Banana Adsorbent (g) 2
Removal of Chemical Oxygen Demand (COD) concentration using Banana peels with various dosage Chemical Oxygen Demand is the amount of oxygen consumed by organic matter in a solution. The average maximum removal of COD was at 1.5 g of each adsorbent, but not in orange adsorbent. From banana adsorbent the maximum removal of COD was 84%, from orange adsorbent the maximum removal of COD was 87% and from sapodilla adsorbent the removal of COD was 84%. Figure 12, 13 and 14 shows the removal percentage of Chemical Oxygen Demand by using banana powder as an adsorbent in domestic greywater.
Figure 12: COD removal using various dosage of Banana adsorbent
Figure 13: COD removal using various dosage of Orange adsorbent
2 1.5 Orange Adsorbent (g)
1 0
20
40
60
80
100
% R
emov
al
% R
emov
al
Baloch et al., J. Mater. Environ. Sci., 2019, 10 (10), pp. 966-986 980
Figure 14: COD removal using various dosage of sapodilla adsorbent
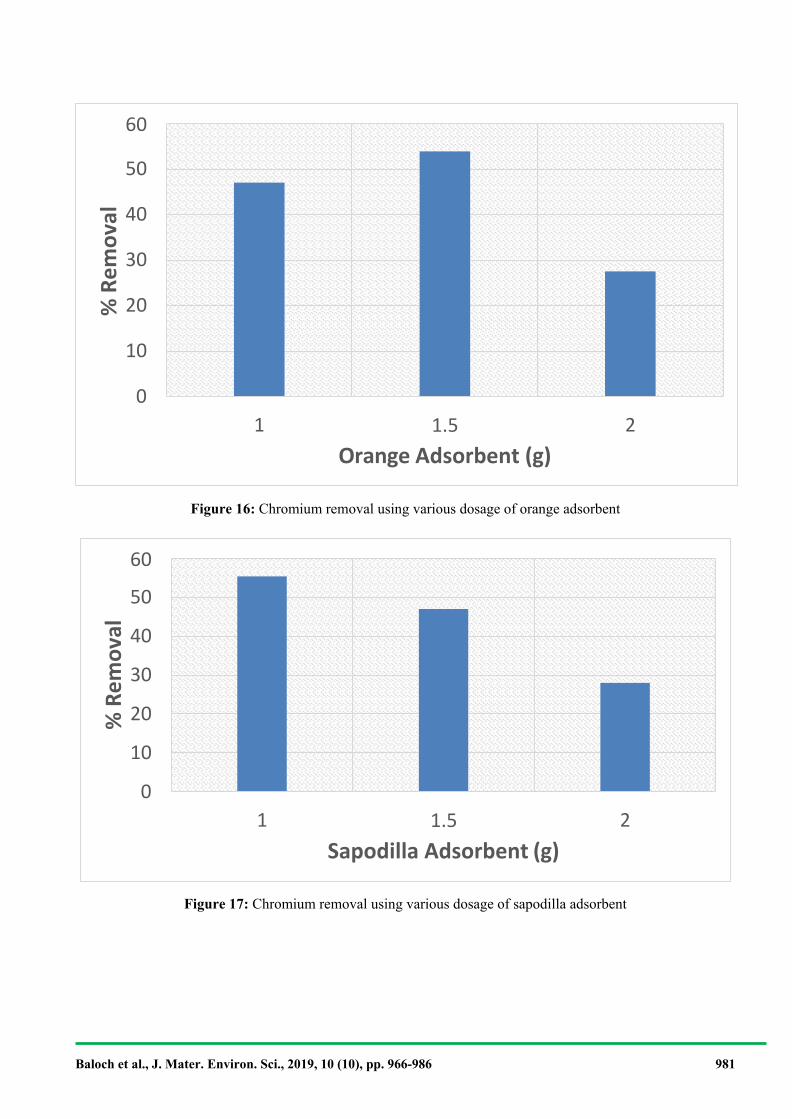
Removal of Chromium concentration using Banana, Orange and Sapodilla peels with various dosages For the analysis of chromium from domestic greywater, 10 ppm solution of chromium was prepared and was analyzed after adsorbent through Atomic adsorption spectrophotometer. Figures 15, 16 and 17 show the removal of chromium from these three adsorbent. The maximum removal of chromium was obtained at 1.5 g except for banana adsorbent, which was maximum 68% at 1 g, and the maximum removal of chromium from orange and sapodilla adsorbent were 55% and 54%.
Figure 15: Chromium removal using various dosage of banana adsorbent
2 1.5 Sapodilla Adsorbent (g)
1 65
70
75
80
85
2 1.5 Banana Adsorbent (g)
1
80 70 60 50 40 30 20 10
0
% R
emov
al
% R
emov
al
Baloch et al., J. Mater. Environ. Sci., 2019, 10 (10), pp. 966-986 981
Figure 16: Chromium removal using various dosage of orange adsorbent
Figure 17: Chromium removal using various dosage of sapodilla adsorbent
2 1.5 Orange Adsorbent (g)
1
60 50 40 30 20 10
0
2 1.5 Sapodilla Adsorbent (g)
1
60
50
40
30
20
10
0
% R
emov
al
% R
emov
al
Baloch et al., J. Mater. Environ. Sci., 2019, 10 (10), pp. 966-986 982
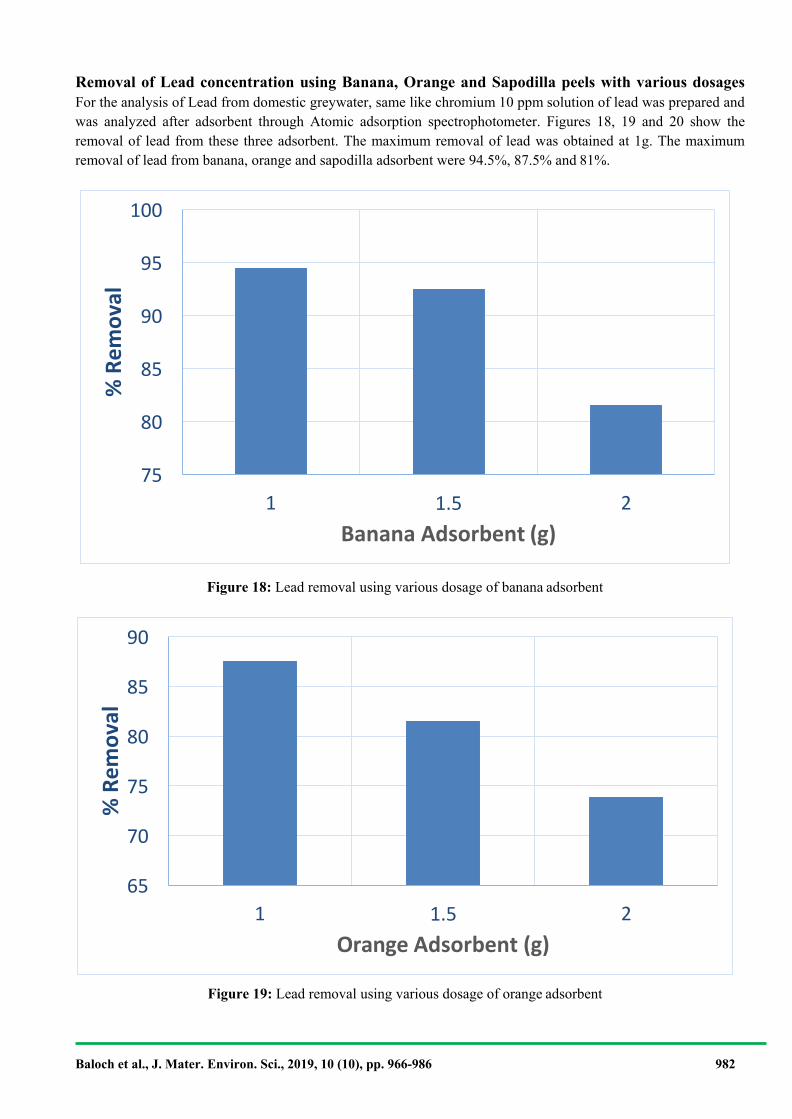
Removal of Lead concentration using Banana, Orange and Sapodilla peels with various dosages For the analysis of Lead from domestic greywater, same like chromium 10 ppm solution of lead was prepared and was analyzed after adsorbent through Atomic adsorption spectrophotometer. Figures 18, 19 and 20 show the removal of lead from these three adsorbent. The maximum removal of lead was obtained at 1g. The maximum removal of lead from banana, orange and sapodilla adsorbent were 94.5%, 87.5% and 81%.
Figure 18: Lead removal using various dosage of banana adsorbent
Figure 19: Lead removal using various dosage of orange adsorbent
2 1.5 Banana Adsorbent (g)
1 75
80
85
90
95
100
2 1.5 Orange Adsorbent (g)
1 65
70
75
80
85
90
% R
emov
al
% R
emov
al
Baloch et al., J. Mater. Environ. Sci., 2019, 10 (10), pp. 966-986 983
90 80 70 60 50 40 30 20 10
0 1 1.5
Sapodilla Adsorbent (g) 2
Figure 20: Lead removal using various dosage of sapodilla adsorbent
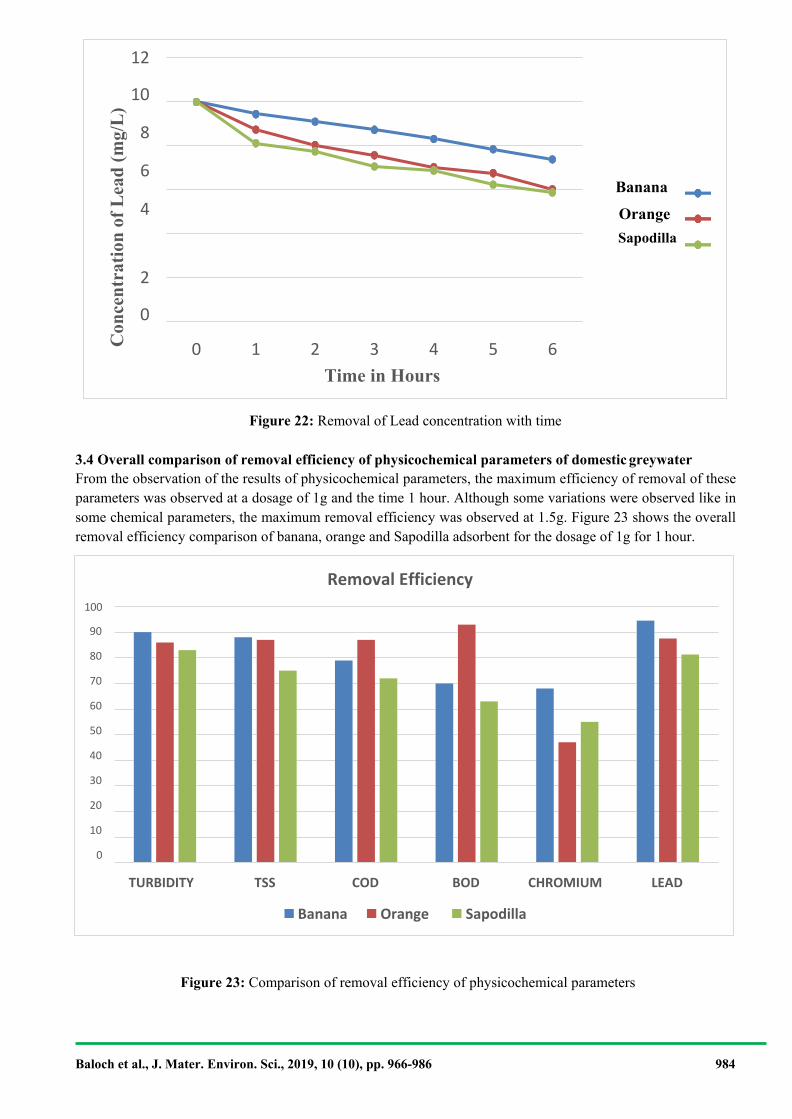
3.4 Effect of Contact Time The effect of contact time was observed for the analysis of heavy metals to check the maximum removal at a particular duration of time. The eighteen samples were run with different time duration range 0 to 6 hours. The maximum removal of chromium and lead were observed at 1 hour using banana, orange and sapodilla as an adsorbent with a constant amount 1 g. After six hours, the phenomenon of desorption took place. Desorption is a process in which the equilibrium condition during adsorption takes place where further removal of any contaminant stops. Figures 21 and 22 shows the relationship between the concentration removal of heavy metals and contact time [21].
Figure 21: Removal of Chromium concentration with time
Time in Hours 6 5 4 3 2 1 0
2 0
Banana
Orange
Sapodilla
12 10
8
6
4
% R
emov
al
Con
cent
ratio
n of
Chr
omiu
m
(mg/
L)
Baloch et al., J. Mater. Environ. Sci., 2019, 10 (10), pp. 966-986 984
Figure 22: Removal of Lead concentration with time
3.4 Overall comparison of removal efficiency of physicochemical parameters of domestic greywater From the observation of the results of physicochemical parameters, the maximum efficiency of removal of these parameters was observed at a dosage of 1g and the time 1 hour. Although some variations were observed like in some chemical parameters, the maximum removal efficiency was observed at 1.5g. Figure 23 shows the overall removal efficiency comparison of banana, orange and Sapodilla adsorbent for the dosage of 1g for 1 hour.
Figure 23: Comparison of removal efficiency of physicochemical parameters
Sapodilla Orange Banana
LEAD CHROMIUM BOD COD TSS TURBIDITY
100
90
80
70
60
50
40
30
20
10
0
Removal Efficiency
Time in Hours 6 5 4 3 2 1 0
2
0
Banana
Orange Sapodilla
12
10
8
6
4
Con
cent
ratio
n of
Lea
d (m
g/L
)
Baloch et al., J. Mater. Environ. Sci., 2019, 10 (10), pp. 966-986 985
Conclusion There are many technologies to treat the water, bio-adsorption technique is also one of them. Fruit wastes (like Banana, Orange, etc.) are agricultural waste which is discarded as waste material in all over the world. Two objectives were set, the first objective was to determine the generation of fruit waste in Qasimabad Hyderabad city while the second objective was related with the treatment of domestic greywater using fruit waste as an adsorbent. Three fruit wastes were selected for adsorption which includes Banana, Orange and Sapodilla waste. Activated carbon was prepared from these fruit wastes and then were used for adsorbent to check the different physic-chemical parameters of domestic greywater. Six physicochemical parameters like Turbidity, TSS, COD, BOD, Chromium and Lead were analyzed and their removal efficiency by using three adsorbent at different dosages and different time period were observed. The optimum dosage of adsorbent was selected 1g. At 1g of adsorbent dosage the removal of these six parameters were greater than 65% which was suitable for effluent according to Sindh Environmental Protection Agency. The activated carbon technology is the branch of nanotechnology which is the advanced technology nowadays for future generation. The main advantage of this activated carbon is that this technology treats mostly the organic pollutants like VOCs etc. In industrial wastewater huge quantity of VOCs and other organic pollutants are present which may be easily removed by activated carbon, therefore for the treatment of industrial wastewater activated carbon is the best technology for the removal of organic matter. In future this technology can be used in filtration process of the influent which is coming from industries.
References
1. Stuart T (2009) Waste: Uncovering the global food scandal. WW Norton & Company, 2. T. Robinson, B. Chandran, P. Nigam, Studies on the decolourisation of an artificial textile-effluent by white-
rot fungi in N-rich and N-limited media. Applied microbiology and biotechnology 57 (5-6) (2001) 810-814 3. W. Gwenzi, Chaukura N, Noubactep C, Mukome FN Biochar-based water treatment systems as a potential
low-cost and sustainable technology for clean water provision. Journal of environmental management 197 (2017) 732-749 https://doi.org/10.1016/j.jenvman.2017.03.087
4. S. Yakout, G.S. El-Deen, Characterization of activated carbon prepared by phosphoric acid activation of olive stones. Arabian Journal of Chemistry 9 (2016) S1155-S1162 https://doi.org/10.1016/j.arabjc.2011.12.002
5. N.G. Asenjo, Álvarez P, Granda M, Blanco C, Santamaría R, Menéndez R High performance activated carbon for benzene/toluene adsorption from industrial wastewater. Journal of hazardous materials 192 (3) (2011) 1525-1532 https://doi.org/10.1016/j.jhazmat.2011.06.072
6. I. Rawat, Kumar RR, Mutanda T, Bux F (2011) Dual role of microalgae: phycoremediation of domestic wastewater and biomass production for sustainable biofuels production. Applied energy 88 (10):3411-3424 https://doi.org/10.1016/j.apenergy.2010.11.025
7. AG E-S, Mansour HF (2013) Potential application of orange peel as an eco-friendly adsorbent for textile dyeing effluents. Research Journal of Textile and Apparel 17 (4):31-39 https://doi.org/10.1108/RJTA-17-04-2013- B004
8. Baseri JR, Palanisamy P, Sivakumar P (2012) Preparation and characterization of activated carbon from Thevetia peruviana for the removal of dyes from textile waste water. Adv Appl Sci Res 3 (1):377-383
9. M. Hossain, Ngo HH, Guo W, Nguyen T (2012) Removal of copper from water by adsorption onto banana peel as bioadsorbent. International Journal of Geomate 2 (2):227-234
10. R. Olaoye, Afolayan O, Mustapha O, Adeleke H (2018) The Efficacy of Banana Peel Activated Carbon in the Removal of Cyanide and Selected Metals from Cassava Processing Wastewater. Advances in Research:1-12 https://doi.org/10.9734/AIR/2018/43070
11. A. Pandiarajan, Kamaraj R, Vasudevan S, Vasudevan S (2018) OPAC (orange peel activated carbon) derived from waste orange peel for the adsorption of chlorophenoxyacetic acid herbicides from water: adsorption isotherm, kinetic modelling and thermodynamic studies. Bioresource technology 261:329-341 https://doi.org/10.1016/j.biortech.2018.04.005
Baloch et al., J. Mater. Environ. Sci., 2019, 10 (10), pp. 966-986 986
12. Ben-Ali S, Jaouali I, Souissi-Najar S, Ouederni A (2017) Characterization and adsorption capacity of raw pomegranate peel biosorbent for copper removal. Journal of Cleaner Production 142:3809-3821 https://doi.org/10.1016/j.jclepro.2016.10.081
13. Apiratikul R, Pavasant P (2006) Sorption isotherm model for binary component sorption of copper, cadmium, and lead ions using dried green macroalga, Caulerpa lentillifera. Chemical Engineering Journal 119 (2- 3):135-145
of Cu2+, Cd2+, Pb2+, and Zn2+ using dried marine green macroalga Caulerpa lentillifera. Bioresource technology 97 (18):2321-2329 https://doi.org/10.1016/j.biortech.2005.10.032
15. Buasri A, Chaiyut N, Tapang K, Jaroensin S, Panphrom S (2012) Equilibrium and kinetic studies of biosorption of Zn (II) ions from wastewater using modified corn cob. Apcbee Procedia 3:60-64 https://doi.org/10.1016/j.apcbee.2012.06.046
16. Janani T, Sudarsan J, Prasanna K Grey water recycling with corn cob as an adsorbent. In: AIP Conference Proceedings, 2019. vol 1. AIP Publishing, p 020181 https://doi.org/10.1063/1.5112366
17. Vaughan T, Seo CW, Marshall WE (2001) Removal of selected metal ions from aqueous solution using modified corncobs. Bioresource technology 78 (2):133-139 https://doi.org/10.1016/S0960-8524(01)00007- 4
18. Ajmi RN, Sultan M, Hanno SH (2018) Bioabsorbent of Chromium, Cadmium and Lead from Industrial waste water by Waste plant. Journal of Pharmaceutical Sciences and Research 10 (3):672-674
19. Hassoon HA (2015) The Adsorption of Some Trace Heavy Metals from Aqueous Solution Using Non Living Biomass of Sub Merged Aquatic Plant Ceratophyllum demersum. Iraqi Journal of Science 56 (4A):2822- 2828
20. Khan NA, Ibrahim S, Subramaniam P (2004) Elimination of heavy metals from wastewater using agricultural wastes as adsorbents. Malaysian Journal of Science 23 (1):43-51
21. S. Karunya, Feroz S, Al Harassi S, Sakhile K (2015) Treatment of Oman Pharmaceutical Industry Wastewater Using Low Cost Adsorbents. Journal of Multidisciplinary Engineering Science and Technology 2:339-341
22. K.M. Al-Qahtani (2016) Water purification using different waste fruit cortexes for the removal of heavy metals. Journal of taibah university for science 10 (5):700-708 https://doi.org/10.1016/j.jtusci.2015.09.001
23. I.A. Kandhar, Khaskheli GB, Sahito AR, Mahar RB (2017) Assessing the Removal of Turbidity and Coliform Transport through Canal-Bed Sediment at Lab-Scale: Column Experiments. Mehran University Research Journal of Engineering and Technology 36 (4):995-1008
24. Z.A. Almani, Pathan AFH, Memon AA (2013) Heavy metal diffusion through soft clay under high hydraulic gradients. Mehran University Research Journal of Engineering and Technology 32 (2):307-318
25. N.M. Rane, Sapkal R (2014) Chromium (VI) removal by using orange peel powder in batch adsorption. carbon 5 (8)
26. F.B. Eshun (2011) Distribution of heavy metals in the Fosu Lagoon (Cape coast). 27. DM. Ghaitidak, K.D. Yadav, Characteristics and treatment of greywater—a review. Environmental Science
and Pollution Research 20 (5) (2013) 2795-2809 https:// doi=10.1007/s11356-013-1533-0