AJOURNA'L'OFAGRICtJ'~niRAL SCIENCE'pusLisHED f THE CAL~FORNIAAGRICULTURALEXPERIMENTSTATION Volume 55 . Number 8 . October 1987 Tree Height and Diameter Growth Models for Northern California Conifers Lee C. Wensel,Walter J. Meerschaert, and Greg s. Biging .'.
Transcript
AJOURNALOFAGRICtJ~niRALSCIENCEpusLisHEDf THE CAL~FORNIAAGRICULTURALEXPERIMENTSTATION
Volume 55 Number 8 October 1987
Tree Height and Diameter Growth Models for Northern California Conifers
Lee C WenselWalter J Meerschaert and Greg s Biging
ABSTRACT
This paper presents growth models for predicting the components of height and diameter growth for six conifer species in northern Calishyfornia Sample data came from the lands of the industry members of the Northern California Forest Yield Cooperative and the coefficients were developed for use in CACTOS the California Conifer Timber Output Simulator The basic field data required for predictions are 50shyyear (at breast height) site indexes for each species in the stand as well as the following items for each tree species diameter at breast height total height height to the crown base and number of trees per acre The models express growth as a product of potential and comshypetition components For height growth the potential is based upon 50-year (breast height) site index curves while for diameter growth potential coefficients come from an iterative procedure using free to grow trees as a starting point The competition components rely primarily upon the relative position of the crown expressed as the crown closure at 66 percent of the trees height Data from stem analysis were used to fit the height growth coefficients but both the stem analysis and increment core data were used to fit and test the diameter growth coefficients
THE AUTHORS
Lee C Wensel is Professor Department of Forestry and Resource Management University of California Berkeley
Walter J Meerschaert is Assistant Specialist Department of Forestry and Resource Management University of California Berkeley
Greg S Biging is Associate Professor Department of Forestry and Resource Management University of California Berkeley
~
I
Lee C Wensel Walter] Meerschaert and Greg S Biging
Tree Height and Diameter Growth Models for Northern California Conifers
INTRODUCTION
ESTIMATESOF FOREST~rowth are of vital importance to the forestland manager Growth rates determine the rates of return on investment and hence of the forestry operation Thus to develop optimum forest regulation plans estimates of growth rates for each alternative management practice must be available
The objective here is to present estimates of tree growth rates for use with forest stands in the mixed-conifer region of northern California An individual tree distanceshyindependent modelling approach is taken to provide the flexibility and detail required to enable the model to be used with forest inventory data By separating the estimated growth potential and competition components the user is able to modify the competishytion component (through partial harvests) to predict the effects of alternative manageshyment prescriptions for established forest stands The predicted yields can then be used in developing optimized management plans for the forest The equations developed here can be used to predict the growth of trees in even-aged single-species or mixedshyspecies stands multiple-aged stands (individual ages usually unknown) and trees that are now or have been previously suppressed However the majority of the data used for model development were from mixed species multiple-aged stands and little testing was done with single-species plantations Tree diameters ranged from 6 to 36 inches
The growth estimators described here are incorporated in CACTOS the California Conifer Timber Output Simulator (Wensel Daugherty and Meerschaert 1986) They use the data and research results of the Northern California Forest Yield Research
Cooperative as described below
DATA
The growth coefficients presented result from analyzing data collected in cooperashytion with 12 forest industry contributors of the Northern California Forest Yield Cooperative They consist of tree measurements from two sources permanent plots and stem analysis plots These data come from samples taken throughout northern California and are selected to represent the growth of six conifer species (see table 1) in young-growth forest stands within the ownership of the industry cooperators
Stem Analysis Plots
The stem analysisdata described by Biging (1984 1985) consist of measurements on both felled and standing trees A total of 39 cluster plots were chosen for measureshyment by the cooperators 31 clusters of three one-fifth acre (008 ha) plots and 8 clustersof two one-tenthacre(004 ha) plotsOn each plot approximately12 trees were selected for falling including four to six dominants to represent the one or two
Accepted for publication July 23 1987
1
2 Wensel Meerschaert and Biging Tree Height and Diameter Growth
TABLE 1 DEFINITION OF SPECIES CODES USED
Code Definition
PP Ponderosa pine Pinus ponderosa (Laws)
SP Sugar pine Pinus lambertiana (Doug)
DF Douglas-fir Pseudohuga menziesii (Mirb) Franco
WF
RF
White fir Abies concr (Gord and Gle
Red fir Abies magnifica (A Murr)
nd) Lind
IC Incense cedar Libocedrus decurrens (Torr)
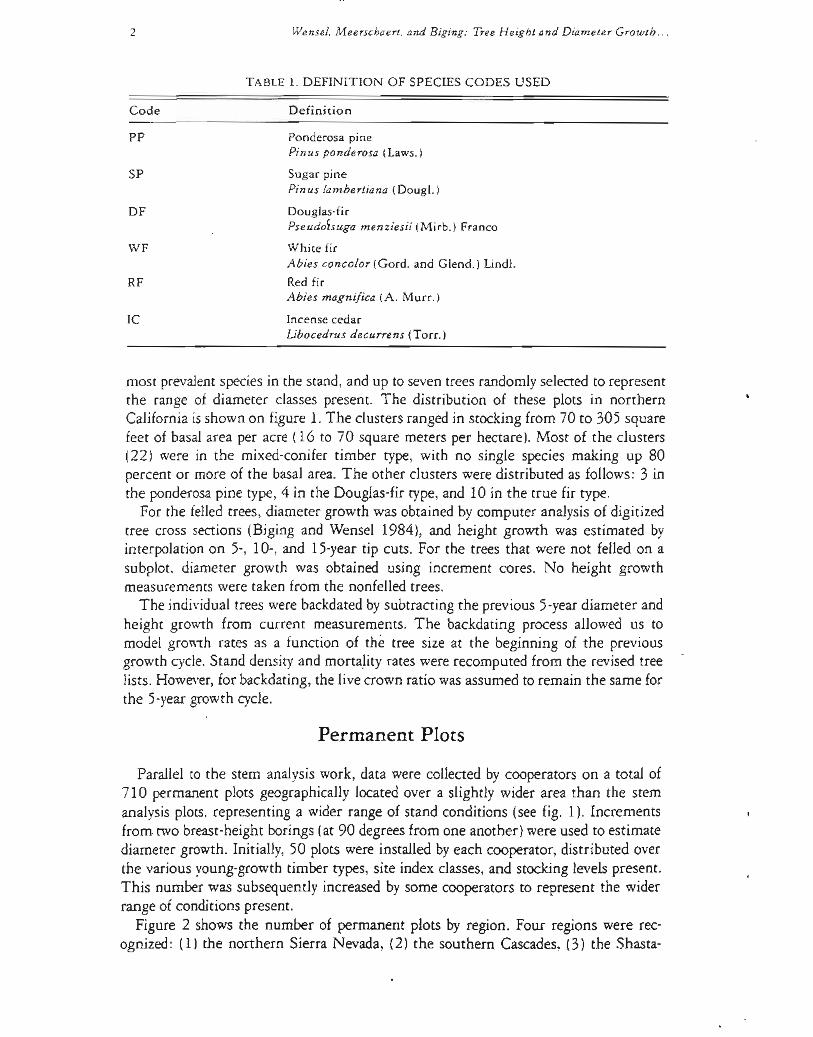
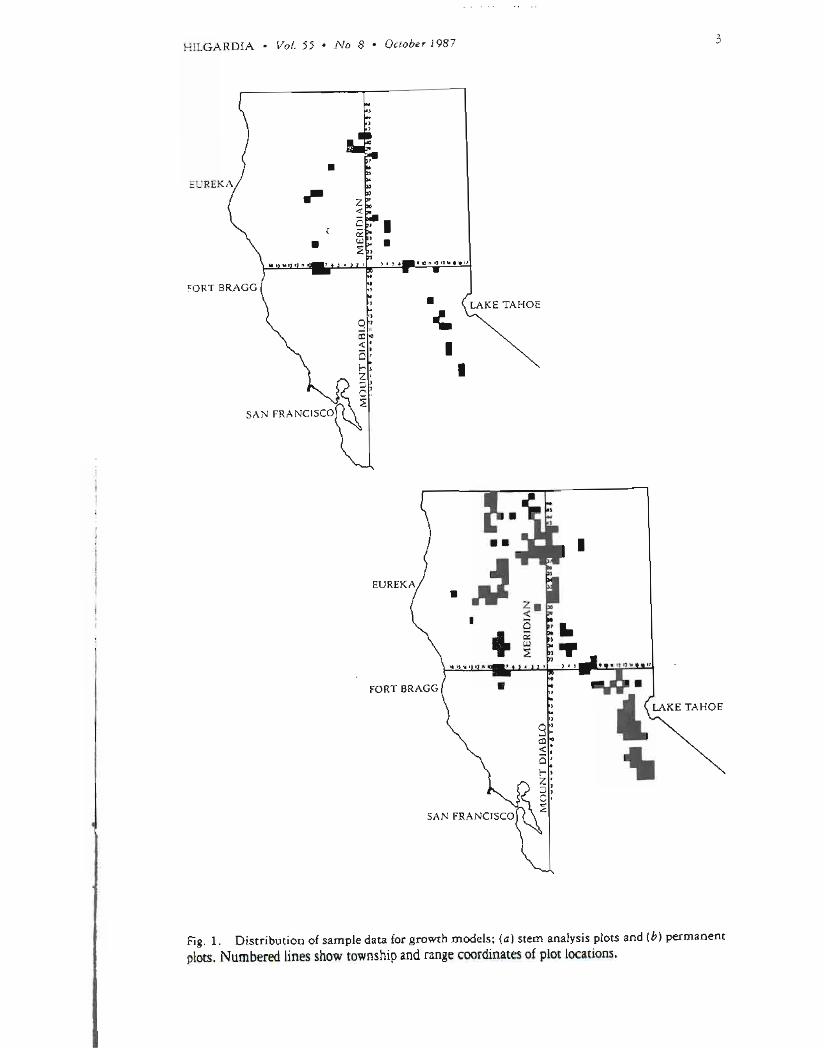
most prevalentspeciesin the stand and up to seventrees randomlyselectedto represent the range of diameter classes present The distribution of these plots in northern Californiais shown on figure 1 The clusters ranged in stocking from 70 to 305 square feet of basal area per acre (16 to 70 square meters per hectare) Most of the clusters (22) were in the mixed-conifer timber type with no single species making up 80 percent or more of the basal area The other clusters were distributed as follows 3 in the ponderosapine type 4 in the Douglas-fir type and 10 in the true fir type
For the felledtrees diameter growth was obtained by computer analysisof digitized tree cross sections (Biging and Wensel 1984) and height growth was estimated by interpolation on 5- 10- and 15-yeartip cuts For the trees that were not felled on a subplot diameter growth was obtained using increment cores No height growth measurementswere taken from the nonfelledtrees
The individualtrees were backdatedbysubtracting the previous 5-yeardiameter and height growth from current measurements The backdating process allowed us to model growth rates as a function of the tree size at the beginning of the previous growth cycleStand density and morta~ityrates were recomputed from the revised tree lists Howeverfor backdatingthe livecrown ratio wasassumed to remain the same for the 5-yeargrowth cycle
Permanent Plots
Parallel to the stem analysiswork data were collectedby cooperators on a total of 710 permanent plots geographicallylocated over a slightly wider area than the stem analysis plots representing a wider range of stand conditions (see fig 1) Increments from two breast-heightborings (at 90 degreesfrom one another) were used to estimate diameter growth Initially 50 plots were installed byeach cooperator distributed over the various young-growthtimber types site index classes and stocking levels present This number was subsequently increased by some cooperators to represent the wider range of conditionspresent
Figure 2 shows the number of permanent plots by region Four regions were recshyognized (1) the northern Sierra Nevada (2) the southern Cascades (3) the Shastashy
3 HILGARDIA Vol 55 No8 October 1987
FORT BRAGG
r 11 D
~
I
I
FORT BRAGG
-
Fig 1 Distribution of sample data for growth models (a) stem analysis plots and (b) permanent plots Numbered lines show township and range coordinates of plot locations
~
250
200
en 0 150 A 0 (
0Z
100
Wensel Meerschaert and Biging Tree Height and Diameter Growth
(3) MixedConifer
[]] PonderosaPine
l2) Douglas-fIr
TrueFir
1 2 3 4
Region
Fig 2 Number of permanent plots by region for each timber type
Trinity area and (4) the east side of the Mendocino range Region 1 was the most heavilysampledwith the mixed-conifertypepredominating (Ponderosapine Douglasshyfir and true fir types contain at least 80 percent of the stand basal area in the singleshyspecies plots while the mixed-conifertype has at least 80 percent conifer but no one speciesmakes up more than 80 percent of the stand basalarea) The numbers of plots by stocking levels are illustrated in figure 3 Note that the first four of the stocking classes are represented in all of the timber types and the most dense class is not well represented in either the ponderosa pine or Douglas-fir types However these two speciesdid occur in denser stands in the mixed conifer type
A research plan and measurement standards were establishedso that data obtained from these permanent plots could be combined into a compatible computerized datashybase for analysisFor analysiseach tree was assigned to one of two subsets at random One subset was used to estimate the diameter growth modelcoefficientsand the other provided an independent check on the estimated coefficients This procedure is disshycussed further in the Resultssections
GROWTH MODELS
Actual tree diameter and height growth are modelled as the product of the trees potential growth and a measureof competition that restricts that trees ability to reach its potential (Haule 1917) That is
growth =(potential growth) x (competition) where potential growth is based on a theoretical estimate of the growth rate of a
dominant tree of that sizeand the competition component is basedupon some measure ~i
of stand density and relative tree size Since one of the objectives is to predict the ~ltif~~ ~-~~~~~ -7~~i~gt~~~7ltgt ~
~~~~~JI-~I~
---~~~ ~~~)t~ -gt-Thi~~ -_~~
5 HILGARDIA Vol 55 No8 October1987
140
120
100 CI1 0 800 0
600 z
40
20
0 MC
Fig 3 Number of permanent
amp1 lt 100 sq ft
E1 101 to 150 sq ft
~ 151 to 200 sq ft
IE] 201 to 300 sq ft
gt 300sq ft
pp DF TF
TimberType
plots by timber type and stocking level
growth rates of residual trees after thinning or natural mortalitythe potential growth rate is adjusted by a factor reflecting the ability of the tree to take advantage of the growing space made available Seidel (1980) Helms and Standiford (1985) Oliver (1986) Ferguson and Adams (1980) and others have found that the amount of photosynthetic area is a factor in determining the growth rates of released trees Trees with lowlevelsof photosyntheticarea as indicatedbylow livecrown ratios are not able to respond to release as quicklyas trees with larger live crown ratios Thus an adjustshyment was made on the potential growth based upon the trees live crown ratio This adjustment is applied separately below for the height and diameter components of
J growth1- While there are some differericesin previouslypublishedformulations of the potenshy1 tial growth components the major differencesin these modelsare in the formulation r of the component for competition Monserud (1975) expressedthe competition comshysshy ponent used in the northern hardwoodsimulation model FOREST(Ek and Monserud
1974) as a product of growth multipliers the principal one being a distanceshydependent competition index For the North Central region growth simulation model STEMS Learyand Holdaway(1979) Hahn and Leary(1979) and Belcher Holdaway and Brand (1982) used asymptotic functions of tree size relative tree size current stocking and the maximum stocking levelexpectedon the site
s In CRYPTOS a growth simulation routine for Californiasredwoodregion Krumshych land and Wensel (1981 1982) and Krumland (1982) expressedcompetition as an
asymptotic function of crown size and crown competition at two-thirds of each trees height While these variableswere tested in the present study the CRYPTOS models
a failedto produce unbiasedestimatesof growth when fitted to the data used here Thus lre a reformulation of the diameter and height growth components of the model was he warranted
II
II i
I
II I II
~
~
oiIi~lt1~~i1i
-~~y~ ~( ltt~I~~
fr~~i~~
-- --- om-no n_ - n____- _n__n - - -shy
6 Wensel Meerschaert and Biging Tree Height and Diameter Growth
Thecomponentapproach built largely on theoretical models with empirically derived coefficients contrasts to the empirical approach used in models such as PROGNOSIS (Stage 1973 and Wykoff Crookston and Stage 1982) a model widely used in the West by the US Forest Service The empirical models are developed to predict future growth based upon correlation observed between the independent and dependent variables While theoretical models depend upon data for their scale empirical models may depend upon the data for both their form and scale In practice however most modelshyling efforts have corpponents of each type-theoretical and empirical
Martin and Ek (1984) using red pine stands in Wisconsin compared a semishyempirical model similar to the component model used here to a decidedly empirical model similar to that used in the PROGNOSIS model (Stage 19731975) Using test data Martin and Eks study showed bias in all of the estimates However it is intershyesting to note that the empirical model appeared to be more accurate for managed stands but was highly biased for unmanaged stands where their semi-empirical model performs better These results were based upon 17 one-acre sample plots
In the discussion that follows potential and competition components are developed for both height and diameter at breast height (DBH) growth The approach used is similar to that used for red pine plantations by Martin and Ek (1984) and for redwood and Douglas-fir forests by Krumland and Wensel ( 1981 ) and Krumland (1982 )
Potential Height Growth
The potential height growth is derived from the site index curves given by Biging and Wensel (1985) and Biging(1985)
H =45 + bOSbI[1-exp( -b2A)]b3 [1]
where H is the total tree height A is breast-height age and S is site index The coefficients derived using a varying-parametermodel are bo =293243 bI =089 b2=0024 and b3=18184Siteindexis specifiedseparatelyforeachspeciespresent in the stand
The expression for height growth is based on the proposition that the potential change in height followsthe site index curve from the trees current height to what it wouldbe 5 yearslaterThususing an inverted form of equation [1] a nominal tree age is computed for a tree of height H on site index S Monserud (1975) referred to this inverseof the height-ageequation as the trees physiologicalage Adding 5 years to this age and substituting into equation [1] and subtracting current height yields the expression for the potential height growth for the 5-year cycle This process is illusshytrated in figure 4 (alsosee Monserud 1975 p 55) Explicitlydenoting the function in equation [1] as f(A) the physiologicalage in equation [1] becomes f-I(H) and the estimated potential change in height becomes
PH=f(physiologicalage+ 5) - current height or [2] PH =f(f-I(H)+ 5)-H
where by inversion of equation [1]
f-l(H)= -(lIb2) log1-[Hb(boSbl)Pb3
and log=natural logarithm
Hb=H-45
7 HILGARDIA Vol 55 No 8 October 1987
1
c HZ ~
~ HI ]0
E-
A Fig 4 Illustration of height growth potential
Breast Height Age determination
Note that site index reflects the averageheight of dominant and codominant trees and therefore the potential height growth could be somewhat higher than that obtainedby using equation [2] As a result while fitting the competition coefficients (below) a site index adjustment (a) was estimated for each species such that the potential height growth is computed using site index $ thus
$= S+ a [3]
is used in place of $ in equation [2]
Crown adjustment
The estimate of the potential tree height growth is further adjusted based upon the trees crown ratio under the premise that a tree cannot grow at the potential of a given site unless it has a sufficiently large crown This gives the crown-adjusted height growth potential PH as
PH = PHdd[1 + exp (4-d2 LCR)] [4]
and the crown-adjustedDBH2 growth Po as
Po =Po[l +exp (4-d2 LCR)] [4]
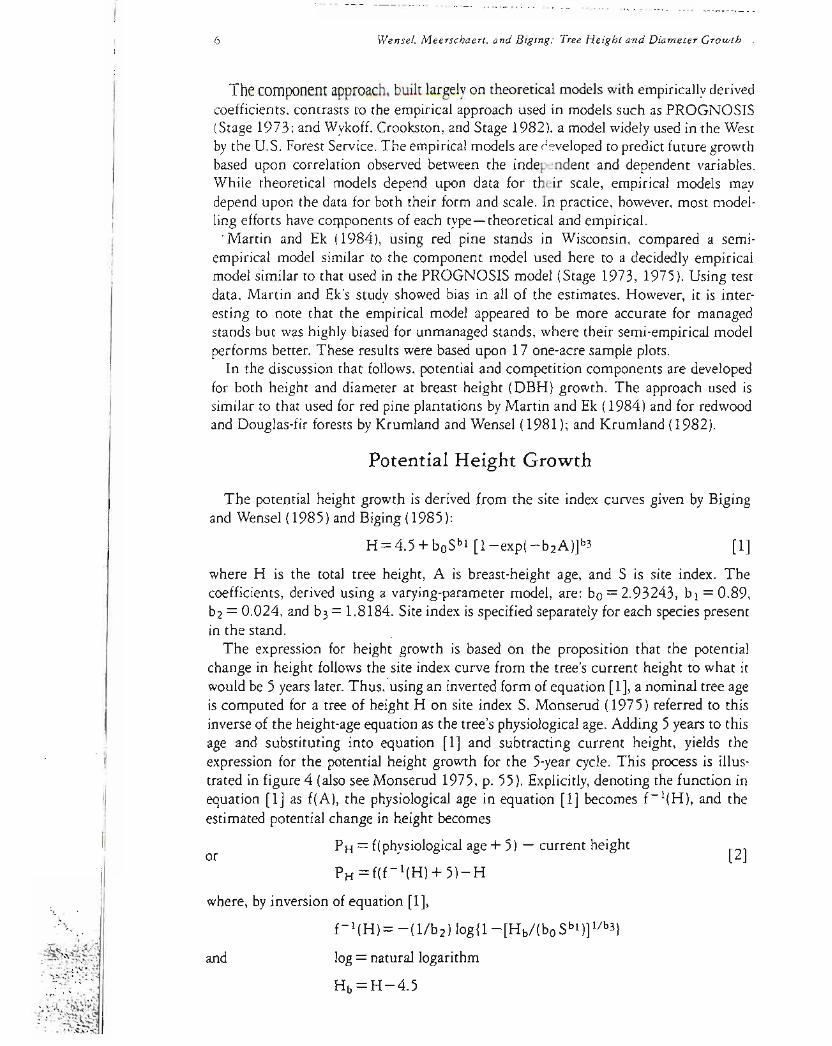
where LCR is the live crown ratio d 1=1 (except for red fir and incense cedar height growth) and d2 is a constant shown to be about 20 for all speciesThus the live crown ratio is used in [4] with current height to represent the current photosyntheticpotential of the tree The effectof this adjustment is shown in figure 5 For a tree with livecrown ratio greater than 05 the adjustment is 10 and has no effect on the values of the potential height growth Howeverfor live crown ratio less than 05 there is a signifishycant reduction in the trees potential height growth This relationship appears to be similar in form and extent for all speciestested
8 Wensel Meerschaert and Biging Tree Height and Diameter Growth
10 09 08
d2 = 15 07 5 06~ 05I ~ 04 laquo 03
02I ~ ~ ~ I range for DBH2 growth
01 00
00 01 02 03 04 05 06 07 08 09 10 Crown Ratio
Fig 5 Illustration of reduction of growth potential due to live crown ratio (d 1 = 1)
Potential Diameter Growth
Diameter growth curves analogous to site index curves do not exist since diameter growth is more sensitive to competition than height growth Also there are no generally accepted upper asymptotesfor DBH growth Therefore the followingproceshydure was developedfor estimating the diameter growth potential component
In a manner similar to that for potential height growth potential DBH2 growth is viewedconceptuallyas a function of site index and age as
D2=boSbl [1-exp(-5 b2A)]b3 [5]
where D is the tree DBH S is the species-specificsite index A is the breast height age of the tree and bo bI bz and b3 are coefficients Using the relationship given by equation [5] the potential diameter-squaredgrowth corresponding to equation [2] for height growth is
PD[co S cl + Cz DZ c3]l1c3- D2 [6]
where
Co= [l-exp (- 5 b2)]bo (lb3)
CI=bdb3
C 2 =exp ( - 5 b 2 )
c3 = lIb3
The coefficientsin equation [6] were fitted directly bynonlinear least squares As in the case of height growth potential a crown adjustment was made on the
potential diameter growth to reflect the reduction in the potential growth due to insufficient crown The form of the adjustment is the same as that shown in equation
~
[4] for height growth except that the impact is greater correspondingto the lines for d2 lt from 8 to 15 in figure 5 Values of dz are given for each of the six species in the
~~t~ RESULTSsection - ~ht - ~~
~~tit ~X~)~X --~
--~ - -~~~
9 HILGARDIA Vol 55 No8 October1987
J Measures of Competition
10
r J
shy
s
e
r
e ) 1 2 e
Distance-independent measures of competition have been compared with measures based upon the trees location within the stand (distance-dependent measures) by Opie (1968) Martin and Ek (1984) and Daniels Burkhart and Clason (1987) In general these studies showed that distance-independent measures perform on a level with more complicated distance-dependent measures making the expense of recording tree posishytion unnecessary Further while tree spacing is theoretically important in determining tree growth rates empirical studies show that relative location within the stand can be reflected using other measures Working in hardwood stands Lorimer (1983) found distance-dependent measures of competition to perform better than basal area parshyticularly when competitors were of equal or higher crown class Our measure of comshypetition is designed to reflect the relative vertical position of the tree in the stand Hence it reflects the location of the tree only on a statistical basis
The form of the height growth competition (CH) factor is as follows
CH=exp (d3 CC66d4PBAd5) [7]
where CC66 is the crown area at 66 percent of the subject trees height PBA is the proportion of the basal area of that species in the stand and the coefficients d3 d4 and d5 are estimated for each species using nonlinear regression Crown closure CC66 is used to reflect the density of the plot as it affects the photosynthetic portion of the crown (Krumland and Wensel 1981 and Krumland 1982) and estimates are obtained as a function of DBH total height and live crown ratio as illustrated in the next section Alternative formulations of this model were fitted using the sum of basal area
for trees larger than the subject tree (BAL) in place of CC66 This measure is used to good advantage by Monserud (1975) and Wykoff Crookston and Stage (1982) BAL is easily computed and does not depend on the crown models While BAL produced a reasonable statistical fit here for most species it does not reflect the vertical profile of the stand
The competition component for diameter growth follows the same logic as the height competition component The variable PBA does not cast the same influence on
diameter growth as it doe~ on height growth therefore it is left out of the diameter component (ie d5 =0) The final form of the competition component is given as
Co = [exp (d3 CC66d4)] [8]
Failures if any of the equations [2] and [6] to represent the potential growth will likely be compensated for by the competition components equations [7] and [8] While this improves the accuracy of the predictions for the current data set any inability to represent the separate components presents a problem in applying the results of the simulation to real forest conditions Simulated management activities will change the competition component but not the potential components or the crown adjustment Thus failures to estimate these individual components correctly will lead to incorrect estimates of the effects of management activities
For simply predicting change in DBH or height the product of the potential and competition equations may appear over-parameterized If it was not necessary to separate the two components for use in the simulator a simplified model with fewer
parameters might be possible However the number of coefficients used here is similar to the number used in the empirical model by Stage (1975) Wykoff Crookston and
10 Wensel Meerschaert and Biging Tree Height and Diameter Growth
Stage (1982) and Wykoff (1985) and in both the empirical and semi-empirical models by Martin and Ek (1984)
Crown closure at 66 percent of trees height
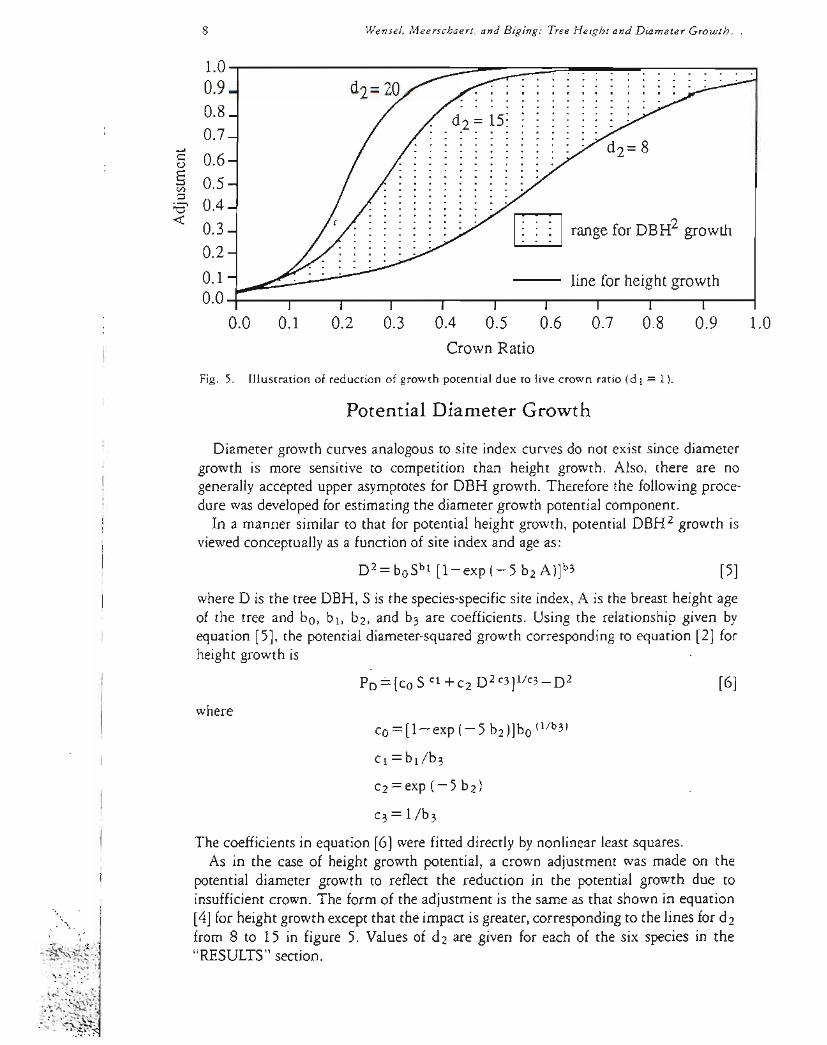
Computation of crown closure CC66 is illustrated in figure 6 where the values of C66 are illustrated for the trees shaded In figure 6(a) the center tree is shorter than the others giving it a higher value of C66 than for the left tree in figure 6( b) or for the right tree in figure 61c) Note that as measured by CC66 the center tree contributes nothing to the crown competition for the tallest tree shown in figure 6(c)
The crown estimates used here were developed from initial crown models by Van Deusen and Biging (1984) and Biging and Wensel (1987) Using the same felled tree data used in this study Biging and Wensel (1987) estimated the crown volume by the expressIOn
CV=a Db He LCRd [9]
where as before D is tree DBH h is tree total height LCR is tree live crown ratio and a b c and d are coefficients given by species in table 2 They also estimated the crown cross-sectional area at height h CA(h) as
and CA(h)=k CV (H -HCB)-1
CA(h)=k CV (H-h)k-l (H-HCB)-k
Olths HCB
HCBlths H
[10]
[11]
where HCB is the height to the crown base CV (crown volume) is estimated using equation [9] and the values for k are given by species in table 2 These models illustrated in figure 7define the projectionfrom the base of the crown to ground level (equation [10]) as well as the crown taper from the base of the crown to the tip (equation [11])
Using equations [10] and [11] CC66 is computed for each tree in the stand as follows for tree i i =1 2 3 n
CC66i=1 CAj(hdXTPAl43560 [12]
I
I
j
where hi =066 Hi Hi is the total height of tree i TPA is the number of trees per acre represented by tree j and 1 is the sum for all trees on the plot (j =1 2 n) Dividingby the number of square feet in an acre 43560 converts the absolute area to relative area commonly used for expressingcrown closure
I
100
I
j
100 66
100
66 66
deg
(a)
Fig 6 Crown cross-sectional shaded tree)
(b)
area at 66 percent of trees height (CC66 (c)
shown by bold line for
11 HILGARDIA Vol 55 No8 October1987
TABLE 2 COEFFICIENTS FOR CROWN MODELS EQUATIONS [9] [10] and [11]-
Coef pp SP DF WF RF IC
a 5287 5287 16236 11984 9572 8909
b 1314 1314 0976 0952 0952 1124
c 1000 1000 1000 1000 1000 1000
d 1922 1922 1463 1564 1 564 1727
k 1785 1785 1805 2004 2040 1702
-Fit statistics and complete information can be found in Biging and Wensel ( 1987)
RESULTS
The stem analysis data were used to estimate the height growth coefficients and to test the DBH2 coefficients As shown above the broad base of the permanent plot database made it well suited for estimating the DBH 2 growth coefficients even though these data could not be used to estimate the height growth coefficients
Height Growth Coefficients
Table 3 shows the estimated coefficients for the height growth model given in equations [3] [4] and [7] Although there are five coefficientsin the complete height growth model table 3 showsthat nomore than four werecoefficientsestimated for any
tlI
H HCB I
h
~ ~I ~ Fig 7 Model for crown cross-sectional area (CA) at heighth
12 Wensel Meerschaert and Biging Tree Height and Diameter Growth
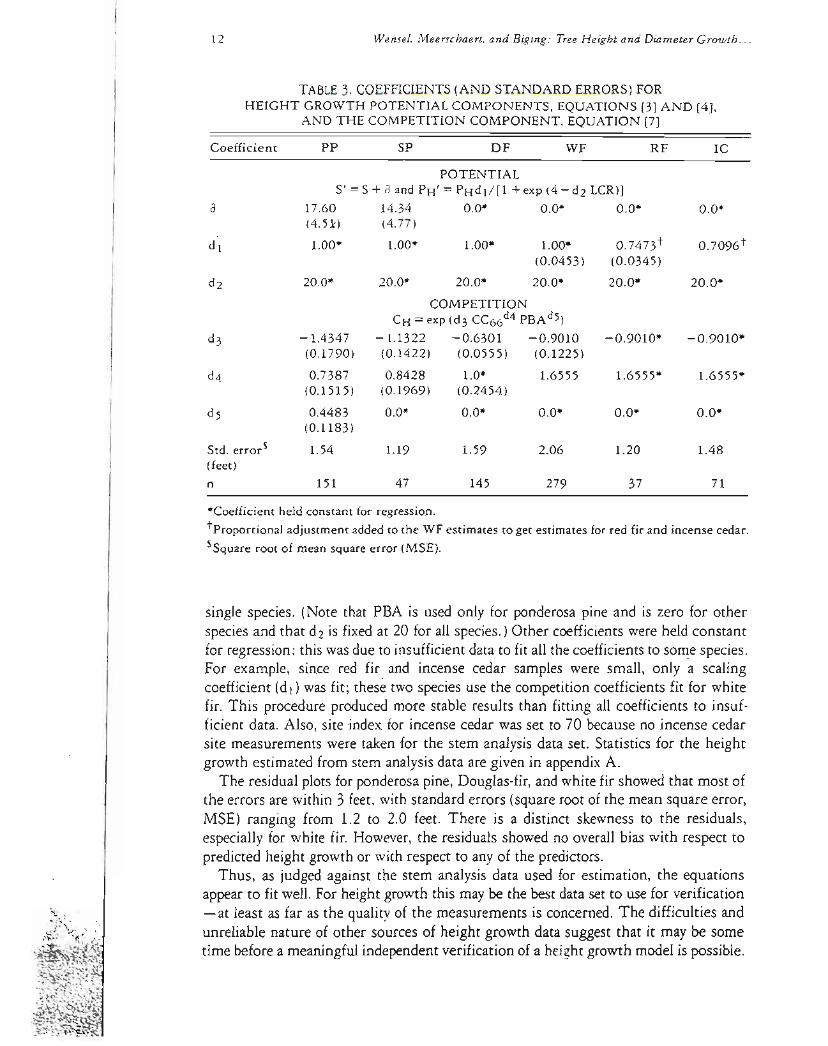
TABLE3COEFFICIENTS (AND STANDARD ERRORS) FORHEIGHT GROWTH POTENTIAL COMPONENTS EQUATIONS [3] AND [4]
AND THE COMPETITION COMPONENT EQUATION [7]
Coefficient PP SP DF WF RF IC
POTENTIAL
S = S + a and PH = PHdl[1 + exp (4 - d2 LCR)] a 1760 1434 00 00 00 00
tproportional adjustment added to the WF estimates to get estimates for red fir and incense cedar
SSquare root of mean square error (MSE)
single species (Note that PBA is used only for ponderosa pine and is zero for other species and that d2 is fixedat 20 for all species)Other coefficientswere held constant for regression this was due to insufficient data to fit all the coefficientsto so~e species For example since red fir and incense cedar samples were small only a scaling coefficient (d1)was fit these two species use the competition coefficientsfit for white fir This procedure produced more stable results than fitting all coefficients to insufshyficient data Also site index for incense cedar was set to 70 because no incense cedar site measurements were taken for the stem analysis data set Statistics for the height growth estimated from stem analysisdata are given in appendixA
The residual plots for ponderosapine Douglas-firand white fir showedthat most of the errors are within 3 feet with standard errors (square root of the mean square error MSE) ranging from 12 to 20 feet There is a distinct skewness to the residuals especially for white fir Howeverthe residuals showed no overall bias with respect to predicted height growth or with respect to any of the predictors
Thus as judged against the stem analysis data used for estimation the equations appear to fit well For height growth this maybe the best data set to use for verification - at least as far as the quality of the measurements is concerned The difficulties and unreliable nature of other sources of height growth data suggest that it may be some time before a meaningful independentverification of a height growth model is possible
13 HILGARDIA Vol 55 No8 October1987
th
-
Diameter Growth Coefficients
Attempts at a simultaneous solution of all coefficients confounded the potential and competition effects Therefore this approach was abandoned Instead an iterative process was used to obtain coefficients of equations [6] and [8] First a subset of the data was used to make an initial estimate of the coefficients for the potential composhynent using trees growing under little or no competition This subset 5 to 10 percent of the total was selected from the largest 33 percent of the trees in each stand (by basal
(
area) providedthat the trees had livecrown ratios greater than 05 It wasassumed that these trees were not under significant competition and the competition component was fixed at 10 Secondthe coefficientsd2 d3 and d4 wereestimated using all trees with the potential components computed using the coefficientsfrom the previousstep Finally the coefficientsco c 1 C2and C3were re-estimated using all trees with the other components computed using the coefficientsfrom the secondstep This iterative technique allows for more stable coefficient estimates with lower intra-component correlations
As an independent check the diameter growth coefficientsestimated using the first subset of the permanent plot data were used to produce residuals for each species in both the second subset of the permanent plot data and the felledand nonfelled trees in the stem analysis data These residuals were plotted against the independent variables for visual analysisof any linear or nonlinear trends For both data sets there were no apparent trends to these residual plots for any speciesexcept in the case of sugar pine and red fir For these two species the more limited sample range failed to reflect the entire permanent plot data set Therefore to provide more robust estimates for these two species their coefficientswere reestimated using the entire permanent plot data set Statistics for the DBH 2 growth estimates are shown in appendix A and a sample residualplot is shown in appendixB The residuals producedby these new coefficients producedno correlationswith the independent predictors in the stem analysisdata set
The final coefficient estimates and standard errors for the diameter growth equashytions are given in table4 The standard errors (square roots of the mean square errors) vary from 83 to 134 (sq in) Expressing these standard errors in terms of DBH growth they vary from 03~ to 054 inches for 12-inch trees and 017 to 028 inches for 24-inch trees The positive skewnessnoted in the height growth residuals is even more obvious in predicting DBH2 growth Also the residual variances increase with the size of the predictionsas well as the size (DBH) of the trees Howeverthe relative errors decreaseSmallgrowth rates (6DBH2Iessthan 6 sq in) appearedto be slightly underestimatedAttempts to reduce this bias either using weightedregressionor fitting a transformed modelonly addedto the biasof the small growth rates as well as decreasshying the ability to predict the larger growth rates
DISCUSSION
Accurate predictionsof forest growth are essential for long run planning and evalushyation of silvicuIturalregimes in the mixed conifer forestsof northern CaliforniaGiven a sufficient modelling base individual tree simulation models can provide the longshyterm forecasts with sufficient detail to allow for economic and silvicuItural analysis To be useful howeveraforecasting mustbebothlogicalandaccurate system
14 Wensel Meerschaert and Biging Tree Height and Diameter Growth
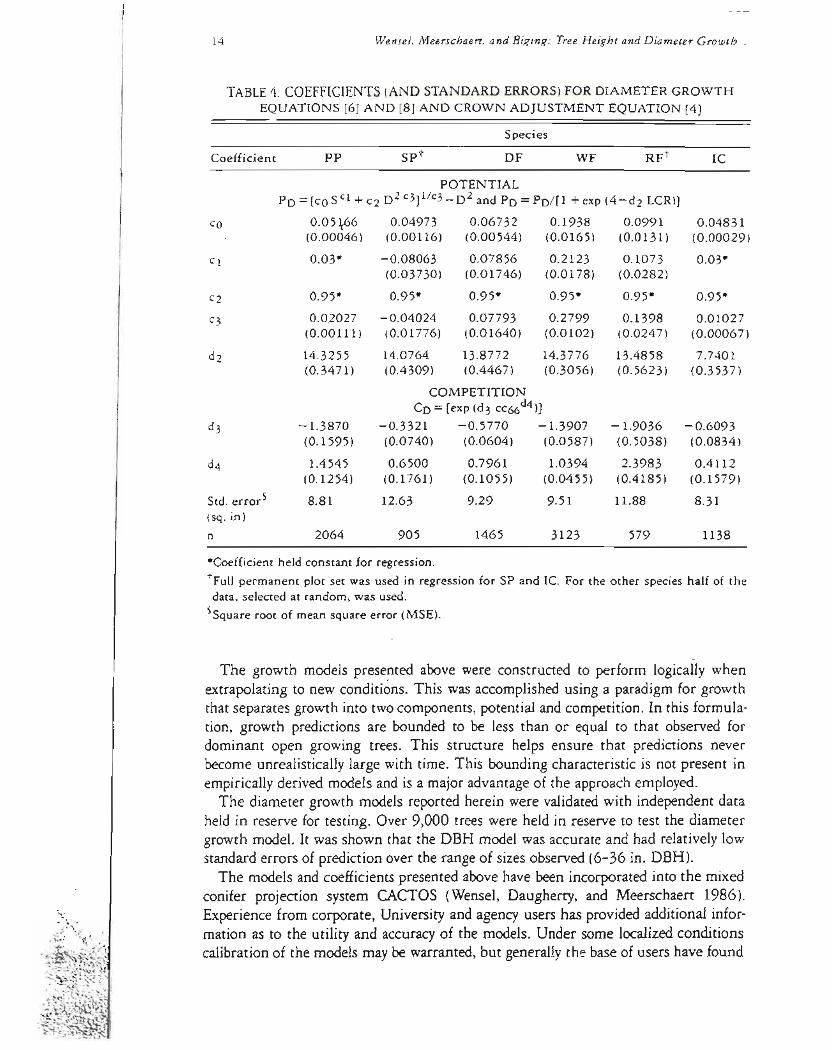
TABLE4 COEFFICIENTS (AND STANDARD ERRORS) FOR DIAMETER GROWTH EQUATIONS (6) AND (8) AND CROWN ADJUSTMENT EQUATION [4]
Species
Coefficient pp spt DF WF RFt IC
POTENTIAL Po =[CO S Cl + C2 D2 C3]1c3-D2 and Po = PO[1 + exp (4-d2 LCR)]
tFull permanent plot set was used in regression for SP and Ie For the other species half of the data selected at random was used
SSquare root of mean square error (MSE)
The growth models prese~ted above were constructed to perform logically when extrapolating to new conditions This was accomplishedusing a paradigm for growth that separates growth into two componentspotential and competition In this formulashytion growth predictions are bounded to be less than or equal to that observed for dominant open growing trees This structure helps ensure that predictions never become unrealisticallylarge with time This bounding characteristic is not present in empiricallyderived models and is a major advantageof the approach employed
The diameter growth models reported herein were validatedwith independent data held in reserve for testing Over 9000 trees were held in reserve to test the diameter growth model It was shown that the DBH model was accurate and had relativelylow standard errors of prediction over the range of sizes observed(6-36 in DBH)
The models and coefficientspresented abovehave been incorporated into the mixed conifer projection system CACTOS (Wensel Daugherty and Meerschaert 1986)
Experiencefrom corporate University and agency users has providedadditional inforshymation as to the utility and accuracyof the models Under some localizedconditions
i~~~1 calibrationof the models may be warranted but generallythe base of users have found ~~~)~1
~~W~ ~-~~rtt~ ~~~it~ ~~~~~~
1138
15 HILGARDIA Va 55 No8 October1987
rhat the growth models in CACTOS predict values that are in concert with their inventory and research plot values As more data become available and more tests are conducted for validating these models estimates can be revised by the calibration routines embedded in CACTOS If indicated major changes may require revisions of rhe model or changes in the values of the coefficients
ApPENDIX Al
Ponderosa pine
Variable
Height Crown Ratio CC66 SITE HGR5 POTENTIAL ADJUSTMENT COMPETITION PREDICTED
Sugar pine
Variable
Height Crown Ratio
s
CC66 SITE HGR5 POTENTIAL ADJUSTMENT COMPETITION PREDICTED
s e
sshy
1
Douglas-fir
Variable
e
]
Height Crown Ratio CC66 SITE HGR5 POTENTIAL ADJUSTMENT COMPETITION PREDICTED
APPENDICES
SUMMARY STATISTICS FOR STEM ANALYSIS TREE DATA USED IN HEIGHT MODELLING
The Journal HILGARDIA is published irregularly Number of pages and number ~lfYtr+t of issues vary per annually numbered volume Address Agriculture and Natural Resources Publications University of California Berkeley CA 94720 ~~i~i~~~~~~
t~o~Ji~W~ ~ ~~~jo~~1
lt ~(FsN~
ABSTRACT
This paper presents growth models for predicting the components of height and diameter growth for six conifer species in northern Calishyfornia Sample data came from the lands of the industry members of the Northern California Forest Yield Cooperative and the coefficients were developed for use in CACTOS the California Conifer Timber Output Simulator The basic field data required for predictions are 50shyyear (at breast height) site indexes for each species in the stand as well as the following items for each tree species diameter at breast height total height height to the crown base and number of trees per acre The models express growth as a product of potential and comshypetition components For height growth the potential is based upon 50-year (breast height) site index curves while for diameter growth potential coefficients come from an iterative procedure using free to grow trees as a starting point The competition components rely primarily upon the relative position of the crown expressed as the crown closure at 66 percent of the trees height Data from stem analysis were used to fit the height growth coefficients but both the stem analysis and increment core data were used to fit and test the diameter growth coefficients
THE AUTHORS
Lee C Wensel is Professor Department of Forestry and Resource Management University of California Berkeley
Walter J Meerschaert is Assistant Specialist Department of Forestry and Resource Management University of California Berkeley
Greg S Biging is Associate Professor Department of Forestry and Resource Management University of California Berkeley
~
I
Lee C Wensel Walter] Meerschaert and Greg S Biging
Tree Height and Diameter Growth Models for Northern California Conifers
INTRODUCTION
ESTIMATESOF FOREST~rowth are of vital importance to the forestland manager Growth rates determine the rates of return on investment and hence of the forestry operation Thus to develop optimum forest regulation plans estimates of growth rates for each alternative management practice must be available
The objective here is to present estimates of tree growth rates for use with forest stands in the mixed-conifer region of northern California An individual tree distanceshyindependent modelling approach is taken to provide the flexibility and detail required to enable the model to be used with forest inventory data By separating the estimated growth potential and competition components the user is able to modify the competishytion component (through partial harvests) to predict the effects of alternative manageshyment prescriptions for established forest stands The predicted yields can then be used in developing optimized management plans for the forest The equations developed here can be used to predict the growth of trees in even-aged single-species or mixedshyspecies stands multiple-aged stands (individual ages usually unknown) and trees that are now or have been previously suppressed However the majority of the data used for model development were from mixed species multiple-aged stands and little testing was done with single-species plantations Tree diameters ranged from 6 to 36 inches
The growth estimators described here are incorporated in CACTOS the California Conifer Timber Output Simulator (Wensel Daugherty and Meerschaert 1986) They use the data and research results of the Northern California Forest Yield Research
Cooperative as described below
DATA
The growth coefficients presented result from analyzing data collected in cooperashytion with 12 forest industry contributors of the Northern California Forest Yield Cooperative They consist of tree measurements from two sources permanent plots and stem analysis plots These data come from samples taken throughout northern California and are selected to represent the growth of six conifer species (see table 1) in young-growth forest stands within the ownership of the industry cooperators
Stem Analysis Plots
The stem analysisdata described by Biging (1984 1985) consist of measurements on both felled and standing trees A total of 39 cluster plots were chosen for measureshyment by the cooperators 31 clusters of three one-fifth acre (008 ha) plots and 8 clustersof two one-tenthacre(004 ha) plotsOn each plot approximately12 trees were selected for falling including four to six dominants to represent the one or two
Accepted for publication July 23 1987
1
2 Wensel Meerschaert and Biging Tree Height and Diameter Growth
TABLE 1 DEFINITION OF SPECIES CODES USED
Code Definition
PP Ponderosa pine Pinus ponderosa (Laws)
SP Sugar pine Pinus lambertiana (Doug)
DF Douglas-fir Pseudohuga menziesii (Mirb) Franco
WF
RF
White fir Abies concr (Gord and Gle
Red fir Abies magnifica (A Murr)
nd) Lind
IC Incense cedar Libocedrus decurrens (Torr)
most prevalentspeciesin the stand and up to seventrees randomlyselectedto represent the range of diameter classes present The distribution of these plots in northern Californiais shown on figure 1 The clusters ranged in stocking from 70 to 305 square feet of basal area per acre (16 to 70 square meters per hectare) Most of the clusters (22) were in the mixed-conifer timber type with no single species making up 80 percent or more of the basal area The other clusters were distributed as follows 3 in the ponderosapine type 4 in the Douglas-fir type and 10 in the true fir type
For the felledtrees diameter growth was obtained by computer analysisof digitized tree cross sections (Biging and Wensel 1984) and height growth was estimated by interpolation on 5- 10- and 15-yeartip cuts For the trees that were not felled on a subplot diameter growth was obtained using increment cores No height growth measurementswere taken from the nonfelledtrees
The individualtrees were backdatedbysubtracting the previous 5-yeardiameter and height growth from current measurements The backdating process allowed us to model growth rates as a function of the tree size at the beginning of the previous growth cycleStand density and morta~ityrates were recomputed from the revised tree lists Howeverfor backdatingthe livecrown ratio wasassumed to remain the same for the 5-yeargrowth cycle
Permanent Plots
Parallel to the stem analysiswork data were collectedby cooperators on a total of 710 permanent plots geographicallylocated over a slightly wider area than the stem analysis plots representing a wider range of stand conditions (see fig 1) Increments from two breast-heightborings (at 90 degreesfrom one another) were used to estimate diameter growth Initially 50 plots were installed byeach cooperator distributed over the various young-growthtimber types site index classes and stocking levels present This number was subsequently increased by some cooperators to represent the wider range of conditionspresent
Figure 2 shows the number of permanent plots by region Four regions were recshyognized (1) the northern Sierra Nevada (2) the southern Cascades (3) the Shastashy
3 HILGARDIA Vol 55 No8 October 1987
FORT BRAGG
r 11 D
~
I
I
FORT BRAGG
-
Fig 1 Distribution of sample data for growth models (a) stem analysis plots and (b) permanent plots Numbered lines show township and range coordinates of plot locations
~
250
200
en 0 150 A 0 (
0Z
100
Wensel Meerschaert and Biging Tree Height and Diameter Growth
(3) MixedConifer
[]] PonderosaPine
l2) Douglas-fIr
TrueFir
1 2 3 4
Region
Fig 2 Number of permanent plots by region for each timber type
Trinity area and (4) the east side of the Mendocino range Region 1 was the most heavilysampledwith the mixed-conifertypepredominating (Ponderosapine Douglasshyfir and true fir types contain at least 80 percent of the stand basal area in the singleshyspecies plots while the mixed-conifertype has at least 80 percent conifer but no one speciesmakes up more than 80 percent of the stand basalarea) The numbers of plots by stocking levels are illustrated in figure 3 Note that the first four of the stocking classes are represented in all of the timber types and the most dense class is not well represented in either the ponderosa pine or Douglas-fir types However these two speciesdid occur in denser stands in the mixed conifer type
A research plan and measurement standards were establishedso that data obtained from these permanent plots could be combined into a compatible computerized datashybase for analysisFor analysiseach tree was assigned to one of two subsets at random One subset was used to estimate the diameter growth modelcoefficientsand the other provided an independent check on the estimated coefficients This procedure is disshycussed further in the Resultssections
GROWTH MODELS
Actual tree diameter and height growth are modelled as the product of the trees potential growth and a measureof competition that restricts that trees ability to reach its potential (Haule 1917) That is
growth =(potential growth) x (competition) where potential growth is based on a theoretical estimate of the growth rate of a
dominant tree of that sizeand the competition component is basedupon some measure ~i
of stand density and relative tree size Since one of the objectives is to predict the ~ltif~~ ~-~~~~~ -7~~i~gt~~~7ltgt ~
~~~~~JI-~I~
---~~~ ~~~)t~ -gt-Thi~~ -_~~
5 HILGARDIA Vol 55 No8 October1987
140
120
100 CI1 0 800 0
600 z
40
20
0 MC
Fig 3 Number of permanent
amp1 lt 100 sq ft
E1 101 to 150 sq ft
~ 151 to 200 sq ft
IE] 201 to 300 sq ft
gt 300sq ft
pp DF TF
TimberType
plots by timber type and stocking level
growth rates of residual trees after thinning or natural mortalitythe potential growth rate is adjusted by a factor reflecting the ability of the tree to take advantage of the growing space made available Seidel (1980) Helms and Standiford (1985) Oliver (1986) Ferguson and Adams (1980) and others have found that the amount of photosynthetic area is a factor in determining the growth rates of released trees Trees with lowlevelsof photosyntheticarea as indicatedbylow livecrown ratios are not able to respond to release as quicklyas trees with larger live crown ratios Thus an adjustshyment was made on the potential growth based upon the trees live crown ratio This adjustment is applied separately below for the height and diameter components of
J growth1- While there are some differericesin previouslypublishedformulations of the potenshy1 tial growth components the major differencesin these modelsare in the formulation r of the component for competition Monserud (1975) expressedthe competition comshysshy ponent used in the northern hardwoodsimulation model FOREST(Ek and Monserud
1974) as a product of growth multipliers the principal one being a distanceshydependent competition index For the North Central region growth simulation model STEMS Learyand Holdaway(1979) Hahn and Leary(1979) and Belcher Holdaway and Brand (1982) used asymptotic functions of tree size relative tree size current stocking and the maximum stocking levelexpectedon the site
s In CRYPTOS a growth simulation routine for Californiasredwoodregion Krumshych land and Wensel (1981 1982) and Krumland (1982) expressedcompetition as an
asymptotic function of crown size and crown competition at two-thirds of each trees height While these variableswere tested in the present study the CRYPTOS models
a failedto produce unbiasedestimatesof growth when fitted to the data used here Thus lre a reformulation of the diameter and height growth components of the model was he warranted
II
II i
I
II I II
~
~
oiIi~lt1~~i1i
-~~y~ ~( ltt~I~~
fr~~i~~
-- --- om-no n_ - n____- _n__n - - -shy
6 Wensel Meerschaert and Biging Tree Height and Diameter Growth
Thecomponentapproach built largely on theoretical models with empirically derived coefficients contrasts to the empirical approach used in models such as PROGNOSIS (Stage 1973 and Wykoff Crookston and Stage 1982) a model widely used in the West by the US Forest Service The empirical models are developed to predict future growth based upon correlation observed between the independent and dependent variables While theoretical models depend upon data for their scale empirical models may depend upon the data for both their form and scale In practice however most modelshyling efforts have corpponents of each type-theoretical and empirical
Martin and Ek (1984) using red pine stands in Wisconsin compared a semishyempirical model similar to the component model used here to a decidedly empirical model similar to that used in the PROGNOSIS model (Stage 19731975) Using test data Martin and Eks study showed bias in all of the estimates However it is intershyesting to note that the empirical model appeared to be more accurate for managed stands but was highly biased for unmanaged stands where their semi-empirical model performs better These results were based upon 17 one-acre sample plots
In the discussion that follows potential and competition components are developed for both height and diameter at breast height (DBH) growth The approach used is similar to that used for red pine plantations by Martin and Ek (1984) and for redwood and Douglas-fir forests by Krumland and Wensel ( 1981 ) and Krumland (1982 )
Potential Height Growth
The potential height growth is derived from the site index curves given by Biging and Wensel (1985) and Biging(1985)
H =45 + bOSbI[1-exp( -b2A)]b3 [1]
where H is the total tree height A is breast-height age and S is site index The coefficients derived using a varying-parametermodel are bo =293243 bI =089 b2=0024 and b3=18184Siteindexis specifiedseparatelyforeachspeciespresent in the stand
The expression for height growth is based on the proposition that the potential change in height followsthe site index curve from the trees current height to what it wouldbe 5 yearslaterThususing an inverted form of equation [1] a nominal tree age is computed for a tree of height H on site index S Monserud (1975) referred to this inverseof the height-ageequation as the trees physiologicalage Adding 5 years to this age and substituting into equation [1] and subtracting current height yields the expression for the potential height growth for the 5-year cycle This process is illusshytrated in figure 4 (alsosee Monserud 1975 p 55) Explicitlydenoting the function in equation [1] as f(A) the physiologicalage in equation [1] becomes f-I(H) and the estimated potential change in height becomes
PH=f(physiologicalage+ 5) - current height or [2] PH =f(f-I(H)+ 5)-H
where by inversion of equation [1]
f-l(H)= -(lIb2) log1-[Hb(boSbl)Pb3
and log=natural logarithm
Hb=H-45
7 HILGARDIA Vol 55 No 8 October 1987
1
c HZ ~
~ HI ]0
E-
A Fig 4 Illustration of height growth potential
Breast Height Age determination
Note that site index reflects the averageheight of dominant and codominant trees and therefore the potential height growth could be somewhat higher than that obtainedby using equation [2] As a result while fitting the competition coefficients (below) a site index adjustment (a) was estimated for each species such that the potential height growth is computed using site index $ thus
$= S+ a [3]
is used in place of $ in equation [2]
Crown adjustment
The estimate of the potential tree height growth is further adjusted based upon the trees crown ratio under the premise that a tree cannot grow at the potential of a given site unless it has a sufficiently large crown This gives the crown-adjusted height growth potential PH as
PH = PHdd[1 + exp (4-d2 LCR)] [4]
and the crown-adjustedDBH2 growth Po as
Po =Po[l +exp (4-d2 LCR)] [4]
where LCR is the live crown ratio d 1=1 (except for red fir and incense cedar height growth) and d2 is a constant shown to be about 20 for all speciesThus the live crown ratio is used in [4] with current height to represent the current photosyntheticpotential of the tree The effectof this adjustment is shown in figure 5 For a tree with livecrown ratio greater than 05 the adjustment is 10 and has no effect on the values of the potential height growth Howeverfor live crown ratio less than 05 there is a signifishycant reduction in the trees potential height growth This relationship appears to be similar in form and extent for all speciestested
8 Wensel Meerschaert and Biging Tree Height and Diameter Growth
10 09 08
d2 = 15 07 5 06~ 05I ~ 04 laquo 03
02I ~ ~ ~ I range for DBH2 growth
01 00
00 01 02 03 04 05 06 07 08 09 10 Crown Ratio
Fig 5 Illustration of reduction of growth potential due to live crown ratio (d 1 = 1)
Potential Diameter Growth
Diameter growth curves analogous to site index curves do not exist since diameter growth is more sensitive to competition than height growth Also there are no generally accepted upper asymptotesfor DBH growth Therefore the followingproceshydure was developedfor estimating the diameter growth potential component
In a manner similar to that for potential height growth potential DBH2 growth is viewedconceptuallyas a function of site index and age as
D2=boSbl [1-exp(-5 b2A)]b3 [5]
where D is the tree DBH S is the species-specificsite index A is the breast height age of the tree and bo bI bz and b3 are coefficients Using the relationship given by equation [5] the potential diameter-squaredgrowth corresponding to equation [2] for height growth is
PD[co S cl + Cz DZ c3]l1c3- D2 [6]
where
Co= [l-exp (- 5 b2)]bo (lb3)
CI=bdb3
C 2 =exp ( - 5 b 2 )
c3 = lIb3
The coefficientsin equation [6] were fitted directly bynonlinear least squares As in the case of height growth potential a crown adjustment was made on the
potential diameter growth to reflect the reduction in the potential growth due to insufficient crown The form of the adjustment is the same as that shown in equation
~
[4] for height growth except that the impact is greater correspondingto the lines for d2 lt from 8 to 15 in figure 5 Values of dz are given for each of the six species in the
~~t~ RESULTSsection - ~ht - ~~
~~tit ~X~)~X --~
--~ - -~~~
9 HILGARDIA Vol 55 No8 October1987
J Measures of Competition
10
r J
shy
s
e
r
e ) 1 2 e
Distance-independent measures of competition have been compared with measures based upon the trees location within the stand (distance-dependent measures) by Opie (1968) Martin and Ek (1984) and Daniels Burkhart and Clason (1987) In general these studies showed that distance-independent measures perform on a level with more complicated distance-dependent measures making the expense of recording tree posishytion unnecessary Further while tree spacing is theoretically important in determining tree growth rates empirical studies show that relative location within the stand can be reflected using other measures Working in hardwood stands Lorimer (1983) found distance-dependent measures of competition to perform better than basal area parshyticularly when competitors were of equal or higher crown class Our measure of comshypetition is designed to reflect the relative vertical position of the tree in the stand Hence it reflects the location of the tree only on a statistical basis
The form of the height growth competition (CH) factor is as follows
CH=exp (d3 CC66d4PBAd5) [7]
where CC66 is the crown area at 66 percent of the subject trees height PBA is the proportion of the basal area of that species in the stand and the coefficients d3 d4 and d5 are estimated for each species using nonlinear regression Crown closure CC66 is used to reflect the density of the plot as it affects the photosynthetic portion of the crown (Krumland and Wensel 1981 and Krumland 1982) and estimates are obtained as a function of DBH total height and live crown ratio as illustrated in the next section Alternative formulations of this model were fitted using the sum of basal area
for trees larger than the subject tree (BAL) in place of CC66 This measure is used to good advantage by Monserud (1975) and Wykoff Crookston and Stage (1982) BAL is easily computed and does not depend on the crown models While BAL produced a reasonable statistical fit here for most species it does not reflect the vertical profile of the stand
The competition component for diameter growth follows the same logic as the height competition component The variable PBA does not cast the same influence on
diameter growth as it doe~ on height growth therefore it is left out of the diameter component (ie d5 =0) The final form of the competition component is given as
Co = [exp (d3 CC66d4)] [8]
Failures if any of the equations [2] and [6] to represent the potential growth will likely be compensated for by the competition components equations [7] and [8] While this improves the accuracy of the predictions for the current data set any inability to represent the separate components presents a problem in applying the results of the simulation to real forest conditions Simulated management activities will change the competition component but not the potential components or the crown adjustment Thus failures to estimate these individual components correctly will lead to incorrect estimates of the effects of management activities
For simply predicting change in DBH or height the product of the potential and competition equations may appear over-parameterized If it was not necessary to separate the two components for use in the simulator a simplified model with fewer
parameters might be possible However the number of coefficients used here is similar to the number used in the empirical model by Stage (1975) Wykoff Crookston and
10 Wensel Meerschaert and Biging Tree Height and Diameter Growth
Stage (1982) and Wykoff (1985) and in both the empirical and semi-empirical models by Martin and Ek (1984)
Crown closure at 66 percent of trees height
Computation of crown closure CC66 is illustrated in figure 6 where the values of C66 are illustrated for the trees shaded In figure 6(a) the center tree is shorter than the others giving it a higher value of C66 than for the left tree in figure 6( b) or for the right tree in figure 61c) Note that as measured by CC66 the center tree contributes nothing to the crown competition for the tallest tree shown in figure 6(c)
The crown estimates used here were developed from initial crown models by Van Deusen and Biging (1984) and Biging and Wensel (1987) Using the same felled tree data used in this study Biging and Wensel (1987) estimated the crown volume by the expressIOn
CV=a Db He LCRd [9]
where as before D is tree DBH h is tree total height LCR is tree live crown ratio and a b c and d are coefficients given by species in table 2 They also estimated the crown cross-sectional area at height h CA(h) as
and CA(h)=k CV (H -HCB)-1
CA(h)=k CV (H-h)k-l (H-HCB)-k
Olths HCB
HCBlths H
[10]
[11]
where HCB is the height to the crown base CV (crown volume) is estimated using equation [9] and the values for k are given by species in table 2 These models illustrated in figure 7define the projectionfrom the base of the crown to ground level (equation [10]) as well as the crown taper from the base of the crown to the tip (equation [11])
Using equations [10] and [11] CC66 is computed for each tree in the stand as follows for tree i i =1 2 3 n
CC66i=1 CAj(hdXTPAl43560 [12]
I
I
j
where hi =066 Hi Hi is the total height of tree i TPA is the number of trees per acre represented by tree j and 1 is the sum for all trees on the plot (j =1 2 n) Dividingby the number of square feet in an acre 43560 converts the absolute area to relative area commonly used for expressingcrown closure
I
100
I
j
100 66
100
66 66
deg
(a)
Fig 6 Crown cross-sectional shaded tree)
(b)
area at 66 percent of trees height (CC66 (c)
shown by bold line for
11 HILGARDIA Vol 55 No8 October1987
TABLE 2 COEFFICIENTS FOR CROWN MODELS EQUATIONS [9] [10] and [11]-
Coef pp SP DF WF RF IC
a 5287 5287 16236 11984 9572 8909
b 1314 1314 0976 0952 0952 1124
c 1000 1000 1000 1000 1000 1000
d 1922 1922 1463 1564 1 564 1727
k 1785 1785 1805 2004 2040 1702
-Fit statistics and complete information can be found in Biging and Wensel ( 1987)
RESULTS
The stem analysis data were used to estimate the height growth coefficients and to test the DBH2 coefficients As shown above the broad base of the permanent plot database made it well suited for estimating the DBH 2 growth coefficients even though these data could not be used to estimate the height growth coefficients
Height Growth Coefficients
Table 3 shows the estimated coefficients for the height growth model given in equations [3] [4] and [7] Although there are five coefficientsin the complete height growth model table 3 showsthat nomore than four werecoefficientsestimated for any
tlI
H HCB I
h
~ ~I ~ Fig 7 Model for crown cross-sectional area (CA) at heighth
12 Wensel Meerschaert and Biging Tree Height and Diameter Growth
TABLE3COEFFICIENTS (AND STANDARD ERRORS) FORHEIGHT GROWTH POTENTIAL COMPONENTS EQUATIONS [3] AND [4]
AND THE COMPETITION COMPONENT EQUATION [7]
Coefficient PP SP DF WF RF IC
POTENTIAL
S = S + a and PH = PHdl[1 + exp (4 - d2 LCR)] a 1760 1434 00 00 00 00
tproportional adjustment added to the WF estimates to get estimates for red fir and incense cedar
SSquare root of mean square error (MSE)
single species (Note that PBA is used only for ponderosa pine and is zero for other species and that d2 is fixedat 20 for all species)Other coefficientswere held constant for regression this was due to insufficient data to fit all the coefficientsto so~e species For example since red fir and incense cedar samples were small only a scaling coefficient (d1)was fit these two species use the competition coefficientsfit for white fir This procedure produced more stable results than fitting all coefficients to insufshyficient data Also site index for incense cedar was set to 70 because no incense cedar site measurements were taken for the stem analysis data set Statistics for the height growth estimated from stem analysisdata are given in appendixA
The residual plots for ponderosapine Douglas-firand white fir showedthat most of the errors are within 3 feet with standard errors (square root of the mean square error MSE) ranging from 12 to 20 feet There is a distinct skewness to the residuals especially for white fir Howeverthe residuals showed no overall bias with respect to predicted height growth or with respect to any of the predictors
Thus as judged against the stem analysis data used for estimation the equations appear to fit well For height growth this maybe the best data set to use for verification - at least as far as the quality of the measurements is concerned The difficulties and unreliable nature of other sources of height growth data suggest that it may be some time before a meaningful independentverification of a height growth model is possible
13 HILGARDIA Vol 55 No8 October1987
th
-
Diameter Growth Coefficients
Attempts at a simultaneous solution of all coefficients confounded the potential and competition effects Therefore this approach was abandoned Instead an iterative process was used to obtain coefficients of equations [6] and [8] First a subset of the data was used to make an initial estimate of the coefficients for the potential composhynent using trees growing under little or no competition This subset 5 to 10 percent of the total was selected from the largest 33 percent of the trees in each stand (by basal
(
area) providedthat the trees had livecrown ratios greater than 05 It wasassumed that these trees were not under significant competition and the competition component was fixed at 10 Secondthe coefficientsd2 d3 and d4 wereestimated using all trees with the potential components computed using the coefficientsfrom the previousstep Finally the coefficientsco c 1 C2and C3were re-estimated using all trees with the other components computed using the coefficientsfrom the secondstep This iterative technique allows for more stable coefficient estimates with lower intra-component correlations
As an independent check the diameter growth coefficientsestimated using the first subset of the permanent plot data were used to produce residuals for each species in both the second subset of the permanent plot data and the felledand nonfelled trees in the stem analysis data These residuals were plotted against the independent variables for visual analysisof any linear or nonlinear trends For both data sets there were no apparent trends to these residual plots for any speciesexcept in the case of sugar pine and red fir For these two species the more limited sample range failed to reflect the entire permanent plot data set Therefore to provide more robust estimates for these two species their coefficientswere reestimated using the entire permanent plot data set Statistics for the DBH 2 growth estimates are shown in appendix A and a sample residualplot is shown in appendixB The residuals producedby these new coefficients producedno correlationswith the independent predictors in the stem analysisdata set
The final coefficient estimates and standard errors for the diameter growth equashytions are given in table4 The standard errors (square roots of the mean square errors) vary from 83 to 134 (sq in) Expressing these standard errors in terms of DBH growth they vary from 03~ to 054 inches for 12-inch trees and 017 to 028 inches for 24-inch trees The positive skewnessnoted in the height growth residuals is even more obvious in predicting DBH2 growth Also the residual variances increase with the size of the predictionsas well as the size (DBH) of the trees Howeverthe relative errors decreaseSmallgrowth rates (6DBH2Iessthan 6 sq in) appearedto be slightly underestimatedAttempts to reduce this bias either using weightedregressionor fitting a transformed modelonly addedto the biasof the small growth rates as well as decreasshying the ability to predict the larger growth rates
DISCUSSION
Accurate predictionsof forest growth are essential for long run planning and evalushyation of silvicuIturalregimes in the mixed conifer forestsof northern CaliforniaGiven a sufficient modelling base individual tree simulation models can provide the longshyterm forecasts with sufficient detail to allow for economic and silvicuItural analysis To be useful howeveraforecasting mustbebothlogicalandaccurate system
14 Wensel Meerschaert and Biging Tree Height and Diameter Growth
TABLE4 COEFFICIENTS (AND STANDARD ERRORS) FOR DIAMETER GROWTH EQUATIONS (6) AND (8) AND CROWN ADJUSTMENT EQUATION [4]
Species
Coefficient pp spt DF WF RFt IC
POTENTIAL Po =[CO S Cl + C2 D2 C3]1c3-D2 and Po = PO[1 + exp (4-d2 LCR)]
tFull permanent plot set was used in regression for SP and Ie For the other species half of the data selected at random was used
SSquare root of mean square error (MSE)
The growth models prese~ted above were constructed to perform logically when extrapolating to new conditions This was accomplishedusing a paradigm for growth that separates growth into two componentspotential and competition In this formulashytion growth predictions are bounded to be less than or equal to that observed for dominant open growing trees This structure helps ensure that predictions never become unrealisticallylarge with time This bounding characteristic is not present in empiricallyderived models and is a major advantageof the approach employed
The diameter growth models reported herein were validatedwith independent data held in reserve for testing Over 9000 trees were held in reserve to test the diameter growth model It was shown that the DBH model was accurate and had relativelylow standard errors of prediction over the range of sizes observed(6-36 in DBH)
The models and coefficientspresented abovehave been incorporated into the mixed conifer projection system CACTOS (Wensel Daugherty and Meerschaert 1986)
Experiencefrom corporate University and agency users has providedadditional inforshymation as to the utility and accuracyof the models Under some localizedconditions
i~~~1 calibrationof the models may be warranted but generallythe base of users have found ~~~)~1
~~W~ ~-~~rtt~ ~~~it~ ~~~~~~
1138
15 HILGARDIA Va 55 No8 October1987
rhat the growth models in CACTOS predict values that are in concert with their inventory and research plot values As more data become available and more tests are conducted for validating these models estimates can be revised by the calibration routines embedded in CACTOS If indicated major changes may require revisions of rhe model or changes in the values of the coefficients
ApPENDIX Al
Ponderosa pine
Variable
Height Crown Ratio CC66 SITE HGR5 POTENTIAL ADJUSTMENT COMPETITION PREDICTED
Sugar pine
Variable
Height Crown Ratio
s
CC66 SITE HGR5 POTENTIAL ADJUSTMENT COMPETITION PREDICTED
s e
sshy
1
Douglas-fir
Variable
e
]
Height Crown Ratio CC66 SITE HGR5 POTENTIAL ADJUSTMENT COMPETITION PREDICTED
APPENDICES
SUMMARY STATISTICS FOR STEM ANALYSIS TREE DATA USED IN HEIGHT MODELLING
The Journal HILGARDIA is published irregularly Number of pages and number ~lfYtr+t of issues vary per annually numbered volume Address Agriculture and Natural Resources Publications University of California Berkeley CA 94720 ~~i~i~~~~~~
t~o~Ji~W~ ~ ~~~jo~~1
lt ~(FsN~
~
250
200
en 0 150 A 0 (
0Z
100
Wensel Meerschaert and Biging Tree Height and Diameter Growth
(3) MixedConifer
[]] PonderosaPine
l2) Douglas-fIr
TrueFir
1 2 3 4
Region
Fig 2 Number of permanent plots by region for each timber type
Trinity area and (4) the east side of the Mendocino range Region 1 was the most heavilysampledwith the mixed-conifertypepredominating (Ponderosapine Douglasshyfir and true fir types contain at least 80 percent of the stand basal area in the singleshyspecies plots while the mixed-conifertype has at least 80 percent conifer but no one speciesmakes up more than 80 percent of the stand basalarea) The numbers of plots by stocking levels are illustrated in figure 3 Note that the first four of the stocking classes are represented in all of the timber types and the most dense class is not well represented in either the ponderosa pine or Douglas-fir types However these two speciesdid occur in denser stands in the mixed conifer type
A research plan and measurement standards were establishedso that data obtained from these permanent plots could be combined into a compatible computerized datashybase for analysisFor analysiseach tree was assigned to one of two subsets at random One subset was used to estimate the diameter growth modelcoefficientsand the other provided an independent check on the estimated coefficients This procedure is disshycussed further in the Resultssections
GROWTH MODELS
Actual tree diameter and height growth are modelled as the product of the trees potential growth and a measureof competition that restricts that trees ability to reach its potential (Haule 1917) That is
growth =(potential growth) x (competition) where potential growth is based on a theoretical estimate of the growth rate of a
dominant tree of that sizeand the competition component is basedupon some measure ~i
of stand density and relative tree size Since one of the objectives is to predict the ~ltif~~ ~-~~~~~ -7~~i~gt~~~7ltgt ~
~~~~~JI-~I~
---~~~ ~~~)t~ -gt-Thi~~ -_~~
5 HILGARDIA Vol 55 No8 October1987
140
120
100 CI1 0 800 0
600 z
40
20
0 MC
Fig 3 Number of permanent
amp1 lt 100 sq ft
E1 101 to 150 sq ft
~ 151 to 200 sq ft
IE] 201 to 300 sq ft
gt 300sq ft
pp DF TF
TimberType
plots by timber type and stocking level
growth rates of residual trees after thinning or natural mortalitythe potential growth rate is adjusted by a factor reflecting the ability of the tree to take advantage of the growing space made available Seidel (1980) Helms and Standiford (1985) Oliver (1986) Ferguson and Adams (1980) and others have found that the amount of photosynthetic area is a factor in determining the growth rates of released trees Trees with lowlevelsof photosyntheticarea as indicatedbylow livecrown ratios are not able to respond to release as quicklyas trees with larger live crown ratios Thus an adjustshyment was made on the potential growth based upon the trees live crown ratio This adjustment is applied separately below for the height and diameter components of
J growth1- While there are some differericesin previouslypublishedformulations of the potenshy1 tial growth components the major differencesin these modelsare in the formulation r of the component for competition Monserud (1975) expressedthe competition comshysshy ponent used in the northern hardwoodsimulation model FOREST(Ek and Monserud
1974) as a product of growth multipliers the principal one being a distanceshydependent competition index For the North Central region growth simulation model STEMS Learyand Holdaway(1979) Hahn and Leary(1979) and Belcher Holdaway and Brand (1982) used asymptotic functions of tree size relative tree size current stocking and the maximum stocking levelexpectedon the site
s In CRYPTOS a growth simulation routine for Californiasredwoodregion Krumshych land and Wensel (1981 1982) and Krumland (1982) expressedcompetition as an
asymptotic function of crown size and crown competition at two-thirds of each trees height While these variableswere tested in the present study the CRYPTOS models
a failedto produce unbiasedestimatesof growth when fitted to the data used here Thus lre a reformulation of the diameter and height growth components of the model was he warranted
II
II i
I
II I II
~
~
oiIi~lt1~~i1i
-~~y~ ~( ltt~I~~
fr~~i~~
-- --- om-no n_ - n____- _n__n - - -shy
6 Wensel Meerschaert and Biging Tree Height and Diameter Growth
Thecomponentapproach built largely on theoretical models with empirically derived coefficients contrasts to the empirical approach used in models such as PROGNOSIS (Stage 1973 and Wykoff Crookston and Stage 1982) a model widely used in the West by the US Forest Service The empirical models are developed to predict future growth based upon correlation observed between the independent and dependent variables While theoretical models depend upon data for their scale empirical models may depend upon the data for both their form and scale In practice however most modelshyling efforts have corpponents of each type-theoretical and empirical
Martin and Ek (1984) using red pine stands in Wisconsin compared a semishyempirical model similar to the component model used here to a decidedly empirical model similar to that used in the PROGNOSIS model (Stage 19731975) Using test data Martin and Eks study showed bias in all of the estimates However it is intershyesting to note that the empirical model appeared to be more accurate for managed stands but was highly biased for unmanaged stands where their semi-empirical model performs better These results were based upon 17 one-acre sample plots
In the discussion that follows potential and competition components are developed for both height and diameter at breast height (DBH) growth The approach used is similar to that used for red pine plantations by Martin and Ek (1984) and for redwood and Douglas-fir forests by Krumland and Wensel ( 1981 ) and Krumland (1982 )
Potential Height Growth
The potential height growth is derived from the site index curves given by Biging and Wensel (1985) and Biging(1985)
H =45 + bOSbI[1-exp( -b2A)]b3 [1]
where H is the total tree height A is breast-height age and S is site index The coefficients derived using a varying-parametermodel are bo =293243 bI =089 b2=0024 and b3=18184Siteindexis specifiedseparatelyforeachspeciespresent in the stand
The expression for height growth is based on the proposition that the potential change in height followsthe site index curve from the trees current height to what it wouldbe 5 yearslaterThususing an inverted form of equation [1] a nominal tree age is computed for a tree of height H on site index S Monserud (1975) referred to this inverseof the height-ageequation as the trees physiologicalage Adding 5 years to this age and substituting into equation [1] and subtracting current height yields the expression for the potential height growth for the 5-year cycle This process is illusshytrated in figure 4 (alsosee Monserud 1975 p 55) Explicitlydenoting the function in equation [1] as f(A) the physiologicalage in equation [1] becomes f-I(H) and the estimated potential change in height becomes
PH=f(physiologicalage+ 5) - current height or [2] PH =f(f-I(H)+ 5)-H
where by inversion of equation [1]
f-l(H)= -(lIb2) log1-[Hb(boSbl)Pb3
and log=natural logarithm
Hb=H-45
7 HILGARDIA Vol 55 No 8 October 1987
1
c HZ ~
~ HI ]0
E-
A Fig 4 Illustration of height growth potential
Breast Height Age determination
Note that site index reflects the averageheight of dominant and codominant trees and therefore the potential height growth could be somewhat higher than that obtainedby using equation [2] As a result while fitting the competition coefficients (below) a site index adjustment (a) was estimated for each species such that the potential height growth is computed using site index $ thus
$= S+ a [3]
is used in place of $ in equation [2]
Crown adjustment
The estimate of the potential tree height growth is further adjusted based upon the trees crown ratio under the premise that a tree cannot grow at the potential of a given site unless it has a sufficiently large crown This gives the crown-adjusted height growth potential PH as
PH = PHdd[1 + exp (4-d2 LCR)] [4]
and the crown-adjustedDBH2 growth Po as
Po =Po[l +exp (4-d2 LCR)] [4]
where LCR is the live crown ratio d 1=1 (except for red fir and incense cedar height growth) and d2 is a constant shown to be about 20 for all speciesThus the live crown ratio is used in [4] with current height to represent the current photosyntheticpotential of the tree The effectof this adjustment is shown in figure 5 For a tree with livecrown ratio greater than 05 the adjustment is 10 and has no effect on the values of the potential height growth Howeverfor live crown ratio less than 05 there is a signifishycant reduction in the trees potential height growth This relationship appears to be similar in form and extent for all speciestested
8 Wensel Meerschaert and Biging Tree Height and Diameter Growth
10 09 08
d2 = 15 07 5 06~ 05I ~ 04 laquo 03
02I ~ ~ ~ I range for DBH2 growth
01 00
00 01 02 03 04 05 06 07 08 09 10 Crown Ratio
Fig 5 Illustration of reduction of growth potential due to live crown ratio (d 1 = 1)
Potential Diameter Growth
Diameter growth curves analogous to site index curves do not exist since diameter growth is more sensitive to competition than height growth Also there are no generally accepted upper asymptotesfor DBH growth Therefore the followingproceshydure was developedfor estimating the diameter growth potential component
In a manner similar to that for potential height growth potential DBH2 growth is viewedconceptuallyas a function of site index and age as
D2=boSbl [1-exp(-5 b2A)]b3 [5]
where D is the tree DBH S is the species-specificsite index A is the breast height age of the tree and bo bI bz and b3 are coefficients Using the relationship given by equation [5] the potential diameter-squaredgrowth corresponding to equation [2] for height growth is
PD[co S cl + Cz DZ c3]l1c3- D2 [6]
where
Co= [l-exp (- 5 b2)]bo (lb3)
CI=bdb3
C 2 =exp ( - 5 b 2 )
c3 = lIb3
The coefficientsin equation [6] were fitted directly bynonlinear least squares As in the case of height growth potential a crown adjustment was made on the
potential diameter growth to reflect the reduction in the potential growth due to insufficient crown The form of the adjustment is the same as that shown in equation
~
[4] for height growth except that the impact is greater correspondingto the lines for d2 lt from 8 to 15 in figure 5 Values of dz are given for each of the six species in the
~~t~ RESULTSsection - ~ht - ~~
~~tit ~X~)~X --~
--~ - -~~~
9 HILGARDIA Vol 55 No8 October1987
J Measures of Competition
10
r J
shy
s
e
r
e ) 1 2 e
Distance-independent measures of competition have been compared with measures based upon the trees location within the stand (distance-dependent measures) by Opie (1968) Martin and Ek (1984) and Daniels Burkhart and Clason (1987) In general these studies showed that distance-independent measures perform on a level with more complicated distance-dependent measures making the expense of recording tree posishytion unnecessary Further while tree spacing is theoretically important in determining tree growth rates empirical studies show that relative location within the stand can be reflected using other measures Working in hardwood stands Lorimer (1983) found distance-dependent measures of competition to perform better than basal area parshyticularly when competitors were of equal or higher crown class Our measure of comshypetition is designed to reflect the relative vertical position of the tree in the stand Hence it reflects the location of the tree only on a statistical basis
The form of the height growth competition (CH) factor is as follows
CH=exp (d3 CC66d4PBAd5) [7]
where CC66 is the crown area at 66 percent of the subject trees height PBA is the proportion of the basal area of that species in the stand and the coefficients d3 d4 and d5 are estimated for each species using nonlinear regression Crown closure CC66 is used to reflect the density of the plot as it affects the photosynthetic portion of the crown (Krumland and Wensel 1981 and Krumland 1982) and estimates are obtained as a function of DBH total height and live crown ratio as illustrated in the next section Alternative formulations of this model were fitted using the sum of basal area
for trees larger than the subject tree (BAL) in place of CC66 This measure is used to good advantage by Monserud (1975) and Wykoff Crookston and Stage (1982) BAL is easily computed and does not depend on the crown models While BAL produced a reasonable statistical fit here for most species it does not reflect the vertical profile of the stand
The competition component for diameter growth follows the same logic as the height competition component The variable PBA does not cast the same influence on
diameter growth as it doe~ on height growth therefore it is left out of the diameter component (ie d5 =0) The final form of the competition component is given as
Co = [exp (d3 CC66d4)] [8]
Failures if any of the equations [2] and [6] to represent the potential growth will likely be compensated for by the competition components equations [7] and [8] While this improves the accuracy of the predictions for the current data set any inability to represent the separate components presents a problem in applying the results of the simulation to real forest conditions Simulated management activities will change the competition component but not the potential components or the crown adjustment Thus failures to estimate these individual components correctly will lead to incorrect estimates of the effects of management activities
For simply predicting change in DBH or height the product of the potential and competition equations may appear over-parameterized If it was not necessary to separate the two components for use in the simulator a simplified model with fewer
parameters might be possible However the number of coefficients used here is similar to the number used in the empirical model by Stage (1975) Wykoff Crookston and
10 Wensel Meerschaert and Biging Tree Height and Diameter Growth
Stage (1982) and Wykoff (1985) and in both the empirical and semi-empirical models by Martin and Ek (1984)
Crown closure at 66 percent of trees height
Computation of crown closure CC66 is illustrated in figure 6 where the values of C66 are illustrated for the trees shaded In figure 6(a) the center tree is shorter than the others giving it a higher value of C66 than for the left tree in figure 6( b) or for the right tree in figure 61c) Note that as measured by CC66 the center tree contributes nothing to the crown competition for the tallest tree shown in figure 6(c)
The crown estimates used here were developed from initial crown models by Van Deusen and Biging (1984) and Biging and Wensel (1987) Using the same felled tree data used in this study Biging and Wensel (1987) estimated the crown volume by the expressIOn
CV=a Db He LCRd [9]
where as before D is tree DBH h is tree total height LCR is tree live crown ratio and a b c and d are coefficients given by species in table 2 They also estimated the crown cross-sectional area at height h CA(h) as
and CA(h)=k CV (H -HCB)-1
CA(h)=k CV (H-h)k-l (H-HCB)-k
Olths HCB
HCBlths H
[10]
[11]
where HCB is the height to the crown base CV (crown volume) is estimated using equation [9] and the values for k are given by species in table 2 These models illustrated in figure 7define the projectionfrom the base of the crown to ground level (equation [10]) as well as the crown taper from the base of the crown to the tip (equation [11])
Using equations [10] and [11] CC66 is computed for each tree in the stand as follows for tree i i =1 2 3 n
CC66i=1 CAj(hdXTPAl43560 [12]
I
I
j
where hi =066 Hi Hi is the total height of tree i TPA is the number of trees per acre represented by tree j and 1 is the sum for all trees on the plot (j =1 2 n) Dividingby the number of square feet in an acre 43560 converts the absolute area to relative area commonly used for expressingcrown closure
I
100
I
j
100 66
100
66 66
deg
(a)
Fig 6 Crown cross-sectional shaded tree)
(b)
area at 66 percent of trees height (CC66 (c)
shown by bold line for
11 HILGARDIA Vol 55 No8 October1987
TABLE 2 COEFFICIENTS FOR CROWN MODELS EQUATIONS [9] [10] and [11]-
Coef pp SP DF WF RF IC
a 5287 5287 16236 11984 9572 8909
b 1314 1314 0976 0952 0952 1124
c 1000 1000 1000 1000 1000 1000
d 1922 1922 1463 1564 1 564 1727
k 1785 1785 1805 2004 2040 1702
-Fit statistics and complete information can be found in Biging and Wensel ( 1987)
RESULTS
The stem analysis data were used to estimate the height growth coefficients and to test the DBH2 coefficients As shown above the broad base of the permanent plot database made it well suited for estimating the DBH 2 growth coefficients even though these data could not be used to estimate the height growth coefficients
Height Growth Coefficients
Table 3 shows the estimated coefficients for the height growth model given in equations [3] [4] and [7] Although there are five coefficientsin the complete height growth model table 3 showsthat nomore than four werecoefficientsestimated for any
tlI
H HCB I
h
~ ~I ~ Fig 7 Model for crown cross-sectional area (CA) at heighth
12 Wensel Meerschaert and Biging Tree Height and Diameter Growth
TABLE3COEFFICIENTS (AND STANDARD ERRORS) FORHEIGHT GROWTH POTENTIAL COMPONENTS EQUATIONS [3] AND [4]
AND THE COMPETITION COMPONENT EQUATION [7]
Coefficient PP SP DF WF RF IC
POTENTIAL
S = S + a and PH = PHdl[1 + exp (4 - d2 LCR)] a 1760 1434 00 00 00 00
tproportional adjustment added to the WF estimates to get estimates for red fir and incense cedar
SSquare root of mean square error (MSE)
single species (Note that PBA is used only for ponderosa pine and is zero for other species and that d2 is fixedat 20 for all species)Other coefficientswere held constant for regression this was due to insufficient data to fit all the coefficientsto so~e species For example since red fir and incense cedar samples were small only a scaling coefficient (d1)was fit these two species use the competition coefficientsfit for white fir This procedure produced more stable results than fitting all coefficients to insufshyficient data Also site index for incense cedar was set to 70 because no incense cedar site measurements were taken for the stem analysis data set Statistics for the height growth estimated from stem analysisdata are given in appendixA
The residual plots for ponderosapine Douglas-firand white fir showedthat most of the errors are within 3 feet with standard errors (square root of the mean square error MSE) ranging from 12 to 20 feet There is a distinct skewness to the residuals especially for white fir Howeverthe residuals showed no overall bias with respect to predicted height growth or with respect to any of the predictors
Thus as judged against the stem analysis data used for estimation the equations appear to fit well For height growth this maybe the best data set to use for verification - at least as far as the quality of the measurements is concerned The difficulties and unreliable nature of other sources of height growth data suggest that it may be some time before a meaningful independentverification of a height growth model is possible
13 HILGARDIA Vol 55 No8 October1987
th
-
Diameter Growth Coefficients
Attempts at a simultaneous solution of all coefficients confounded the potential and competition effects Therefore this approach was abandoned Instead an iterative process was used to obtain coefficients of equations [6] and [8] First a subset of the data was used to make an initial estimate of the coefficients for the potential composhynent using trees growing under little or no competition This subset 5 to 10 percent of the total was selected from the largest 33 percent of the trees in each stand (by basal
(
area) providedthat the trees had livecrown ratios greater than 05 It wasassumed that these trees were not under significant competition and the competition component was fixed at 10 Secondthe coefficientsd2 d3 and d4 wereestimated using all trees with the potential components computed using the coefficientsfrom the previousstep Finally the coefficientsco c 1 C2and C3were re-estimated using all trees with the other components computed using the coefficientsfrom the secondstep This iterative technique allows for more stable coefficient estimates with lower intra-component correlations
As an independent check the diameter growth coefficientsestimated using the first subset of the permanent plot data were used to produce residuals for each species in both the second subset of the permanent plot data and the felledand nonfelled trees in the stem analysis data These residuals were plotted against the independent variables for visual analysisof any linear or nonlinear trends For both data sets there were no apparent trends to these residual plots for any speciesexcept in the case of sugar pine and red fir For these two species the more limited sample range failed to reflect the entire permanent plot data set Therefore to provide more robust estimates for these two species their coefficientswere reestimated using the entire permanent plot data set Statistics for the DBH 2 growth estimates are shown in appendix A and a sample residualplot is shown in appendixB The residuals producedby these new coefficients producedno correlationswith the independent predictors in the stem analysisdata set
The final coefficient estimates and standard errors for the diameter growth equashytions are given in table4 The standard errors (square roots of the mean square errors) vary from 83 to 134 (sq in) Expressing these standard errors in terms of DBH growth they vary from 03~ to 054 inches for 12-inch trees and 017 to 028 inches for 24-inch trees The positive skewnessnoted in the height growth residuals is even more obvious in predicting DBH2 growth Also the residual variances increase with the size of the predictionsas well as the size (DBH) of the trees Howeverthe relative errors decreaseSmallgrowth rates (6DBH2Iessthan 6 sq in) appearedto be slightly underestimatedAttempts to reduce this bias either using weightedregressionor fitting a transformed modelonly addedto the biasof the small growth rates as well as decreasshying the ability to predict the larger growth rates
DISCUSSION
Accurate predictionsof forest growth are essential for long run planning and evalushyation of silvicuIturalregimes in the mixed conifer forestsof northern CaliforniaGiven a sufficient modelling base individual tree simulation models can provide the longshyterm forecasts with sufficient detail to allow for economic and silvicuItural analysis To be useful howeveraforecasting mustbebothlogicalandaccurate system
14 Wensel Meerschaert and Biging Tree Height and Diameter Growth
TABLE4 COEFFICIENTS (AND STANDARD ERRORS) FOR DIAMETER GROWTH EQUATIONS (6) AND (8) AND CROWN ADJUSTMENT EQUATION [4]
Species
Coefficient pp spt DF WF RFt IC
POTENTIAL Po =[CO S Cl + C2 D2 C3]1c3-D2 and Po = PO[1 + exp (4-d2 LCR)]
tFull permanent plot set was used in regression for SP and Ie For the other species half of the data selected at random was used
SSquare root of mean square error (MSE)
The growth models prese~ted above were constructed to perform logically when extrapolating to new conditions This was accomplishedusing a paradigm for growth that separates growth into two componentspotential and competition In this formulashytion growth predictions are bounded to be less than or equal to that observed for dominant open growing trees This structure helps ensure that predictions never become unrealisticallylarge with time This bounding characteristic is not present in empiricallyderived models and is a major advantageof the approach employed
The diameter growth models reported herein were validatedwith independent data held in reserve for testing Over 9000 trees were held in reserve to test the diameter growth model It was shown that the DBH model was accurate and had relativelylow standard errors of prediction over the range of sizes observed(6-36 in DBH)
The models and coefficientspresented abovehave been incorporated into the mixed conifer projection system CACTOS (Wensel Daugherty and Meerschaert 1986)
Experiencefrom corporate University and agency users has providedadditional inforshymation as to the utility and accuracyof the models Under some localizedconditions
i~~~1 calibrationof the models may be warranted but generallythe base of users have found ~~~)~1
~~W~ ~-~~rtt~ ~~~it~ ~~~~~~
1138
15 HILGARDIA Va 55 No8 October1987
rhat the growth models in CACTOS predict values that are in concert with their inventory and research plot values As more data become available and more tests are conducted for validating these models estimates can be revised by the calibration routines embedded in CACTOS If indicated major changes may require revisions of rhe model or changes in the values of the coefficients
ApPENDIX Al
Ponderosa pine
Variable
Height Crown Ratio CC66 SITE HGR5 POTENTIAL ADJUSTMENT COMPETITION PREDICTED
Sugar pine
Variable
Height Crown Ratio
s
CC66 SITE HGR5 POTENTIAL ADJUSTMENT COMPETITION PREDICTED
s e
sshy
1
Douglas-fir
Variable
e
]
Height Crown Ratio CC66 SITE HGR5 POTENTIAL ADJUSTMENT COMPETITION PREDICTED
APPENDICES
SUMMARY STATISTICS FOR STEM ANALYSIS TREE DATA USED IN HEIGHT MODELLING
The Journal HILGARDIA is published irregularly Number of pages and number ~lfYtr+t of issues vary per annually numbered volume Address Agriculture and Natural Resources Publications University of California Berkeley CA 94720 ~~i~i~~~~~~
t~o~Ji~W~ ~ ~~~jo~~1
lt ~(FsN~
16 Wensel Meerschaert and Biging Tree Height and Diameter Growth
APPENDIX A1 SUMMARY STATISTICS FOR STEM ANALYSIS TREE DATA USED IN HEIGHT
The Journal HILGARDIA is published irregularly Number of pages and number ~lfYtr+t of issues vary per annually numbered volume Address Agriculture and Natural Resources Publications University of California Berkeley CA 94720 ~~i~i~~~~~~
t~o~Ji~W~ ~ ~~~jo~~1
lt ~(FsN~
17 HILGARDIA Vol 55 No8 October1987
APPENDIX A2 SUMMARY STATISTICS FOR PERMANENT PLOT TREE DATAUSED IN DBH2 MODELLING
Ponderosa pine n =2064
Variable Mean Std Dev Minimum Maximum
DBH 10596 6772 0100 40800
Total Height 53351 32659 0000 184000 Crown Ratio 0470 0172 0020 0950
The Journal HILGARDIA is published irregularly Number of pages and number ~lfYtr+t of issues vary per annually numbered volume Address Agriculture and Natural Resources Publications University of California Berkeley CA 94720 ~~i~i~~~~~~
t~o~Ji~W~ ~ ~~~jo~~1
lt ~(FsN~
18 Wensel Meerschaert and Biging Tree Height and Diameter Growth
APPENDIX A2 SUMMARY STATISTICS FOR PERMANENT PLOT TREE DATAUSED IN DBH2 GROWTH MODELLING Continued
Red fir 1 = 579
Variable Mean Std Dev Minimum Maximum
DBH 11634 7881 0600 50800 Total Height 53737 34716 5000 154000 Crown Ratio 04 71 0188 0033 0940
The Journal HILGARDIA is published irregularly Number of pages and number ~lfYtr+t of issues vary per annually numbered volume Address Agriculture and Natural Resources Publications University of California Berkeley CA 94720 ~~i~i~~~~~~
t~o~Ji~W~ ~ ~~~jo~~1
lt ~(FsN~
HILGARDIA Editorial Board
Edward S Sylvester Chairman Berkeley(entomology insecticides ecology environmental toxicology)
Peter Berek Associate Editor Berkeley(economics statistics resource management)
The Journal HILGARDIA is published irregularly Number of pages and number ~lfYtr+t of issues vary per annually numbered volume Address Agriculture and Natural Resources Publications University of California Berkeley CA 94720 ~~i~i~~~~~~