ORIGINAL PAPER Tree species composition and richness along altitudinal gradients as a tool for conservation decisions: the case of Atlantic semideciduous forest Vanessa L. Rezende 1 • Pedro L. S. de Miranda 2 • Leila Meyer 1 • Cecı ´lia V. Moreira 1 • Mariana F. M. Linhares 1 • Ary T. de Oliveira-Filho 1 • Pedro V. Eisenlohr 3 Received: 6 September 2014 / Revised: 6 May 2015 / Accepted: 21 May 2015 / Published online: 4 June 2015 Ó Springer Science+Business Media Dordrecht 2015 Abstract Altitude is one of the major environmental variables influencing the distribu- tion of tree taxa around the world, and can be a useful parameter for the development of conservation strategies. Our objectives were to obtain an overview of the conservation status of taxa from the Atlantic semideciduous seasonal forests of southeastern Brazil and check, among the floristically consistent altitudinal zones, which had the largest number of endemic, threatened and indicator species. To accomplish this, we used species occurrence and geo-climatic data from the ‘NeoTropTree’ database. First, we checked which zones were floristically consistent using an ordination method (non-metric multidimensional scaling, NMS) followed by an analysis of variance. Then, we conducted an indicator species analysis, estimated species richness, calculated the taxonomic distinctness index for all zones and evaluated important aspects for conservation, such as endemism and threat of extinction. Taxa richness, and number of endemic and threatened species de- creased with increasing altitude, while the amount of indicator species for each zone increased with altitudinal elevation. These variations related to the altitudinal gradient should be considered when developing conservation strategies. We also should prioritise the conservation of the entire gradient and, whenever possible, include endemic and en- dangered species in forest recovery programs. Jefferson Prado. Electronic supplementary material The online version of this article (doi:10.1007/s10531-015-0939-z) contains supplementary material, which is available to authorized users. & Pedro V. Eisenlohr [email protected]1 Departamento de Bota ˆnica, Universidade Federal de Minas Gerais – UFMG, P.O. Box 486, Belo Horizonte, MG 31270-910, Brazil 2 School of Geosciences, The University of Edinburgh, Edinburgh EH9 3JN, UK 3 Laborato ´rio de Ecologia, Universidade do Estado de Mato Grosso – UNEMAT, Campus Universita ´rio de Alta Floresta (Campus II), P.O. Box 324, Alta Floresta, MT 78580-000, Brazil 123 Biodivers Conserv (2015) 24:2149–2163 DOI 10.1007/s10531-015-0939-z
Transcript
ORIGINAL PAPER
Tree species composition and richness along altitudinalgradients as a tool for conservation decisions: the caseof Atlantic semideciduous forest
Vanessa L. Rezende1 • Pedro L. S. de Miranda2 •
Leila Meyer1 • Cecılia V. Moreira1 •
Mariana F. M. Linhares1 • Ary T. de Oliveira-Filho1 •
Pedro V. Eisenlohr3
Received: 6 September 2014 / Revised: 6 May 2015 / Accepted: 21 May 2015 /Published online: 4 June 2015� Springer Science+Business Media Dordrecht 2015
Abstract Altitude is one of the major environmental variables influencing the distribu-
tion of tree taxa around the world, and can be a useful parameter for the development of
conservation strategies. Our objectives were to obtain an overview of the conservation
status of taxa from the Atlantic semideciduous seasonal forests of southeastern Brazil and
check, among the floristically consistent altitudinal zones, which had the largest number of
endemic, threatened and indicator species. To accomplish this, we used species occurrence
and geo-climatic data from the ‘NeoTropTree’ database. First, we checked which zones
were floristically consistent using an ordination method (non-metric multidimensional
scaling, NMS) followed by an analysis of variance. Then, we conducted an indicator
species analysis, estimated species richness, calculated the taxonomic distinctness index
for all zones and evaluated important aspects for conservation, such as endemism and
threat of extinction. Taxa richness, and number of endemic and threatened species de-
creased with increasing altitude, while the amount of indicator species for each zone
increased with altitudinal elevation. These variations related to the altitudinal gradient
should be considered when developing conservation strategies. We also should prioritise
the conservation of the entire gradient and, whenever possible, include endemic and en-
dangered species in forest recovery programs.
Jefferson Prado.
Electronic supplementary material The online version of this article (doi:10.1007/s10531-015-0939-z)contains supplementary material, which is available to authorized users.
1 Departamento de Botanica, Universidade Federal de Minas Gerais – UFMG,P.O. Box 486, Belo Horizonte, MG 31270-910, Brazil
2 School of Geosciences, The University of Edinburgh, Edinburgh EH9 3JN, UK
3 Laboratorio de Ecologia, Universidade do Estado de Mato Grosso – UNEMAT, CampusUniversitario de Alta Floresta (Campus II), P.O. Box 324, Alta Floresta, MT 78580-000, Brazil
Keywords Altitudinal gradient � Threatened species � Endemic species � NeoTropTreedatabase � Priority areas for conservation
Introduction
The effect of altitude on the variation of taxa composition, floristic diversity and structure
of forest formations has been widely demonstrated (Gaston 2000; Grytnes and Beaman
2006; Grytnes et al. 2006; Guo et al. 2013; Sanchez et al. 2013). The observed changes in
the vegetation are influenced by a number of abiotic factors that accompany the altitudinal
gradient, such as decreasing atmospheric pressure, reduced temperature, and increased
solar radiation (Korner 2007; Barry 2008; McCain and Grytnes 2010). Other abiotic factors
such as rainfall, wind speed, seasonality, cloud cover, and substrate types also vary with
elevation, but do not always follow the altitudinal gradient (Korner 2007; Barry 2008;
McCain and Grytnes 2010). The abiotic factors mentioned above, along with biotic factors
such as competition, mutualism, dispersal, and establishment, influence patterns of di-
versity and distribution of taxa along altitudinal gradients (McCain and Grytnes 2010),
especially regarding rare taxa with restricted distribution, which generally exhibit specific
adaptations that allow them to establish in such environments (Chaverri-Polini 1998;
Martinelli 2007). Variations in biological diversity and distribution need to be considered
when adopting actions for conservation to ensure the taxa’s protection and the mainte-
nance of ecological patterns and processes involved, which also includes ecosystem ser-
vices (Costanza et al. 1997; Kandus et al. 2011).
The variation in taxa richness in response to altitudinal gradients has been acknowl-
edged by various classification systems proposed for the Brazilian vegetation (e.g. Veloso
et al. 1991; Oliveira-Filho 2009; IBGE 2012), and other vegetation types around the world
(Aubreville 1956; Ellenberg and Mueller-Dombois 1967). In general, altitude constitutes
one of the hierarchical criteria necessary to divide the vegetation into subtypes; other
abiotic factors such as climate and substrate regime, as well as certain biological char-
acteristics, such as color of foliage and deciduousness, are also considered in these clas-
sification schemes (e.g. IBGE 2012). In spite of its importance, the task of precisely
demarcating altitudinal zones to be used in a classification system is arduous since the
vegetation does not usually exhibit abrupt changes along the altitudinal gradient, in ad-
dition to its response to other environmental factors such as substrate type and microhabitat
(Gentry 1988). Normally, such classification systems and their elevational boundaries are
supported by scientific studies, validation of results in the field and experience of re-
searchers involved, as is the case with systems designed for the Brazilian vegetation
aforementioned. For example, numerical evidence for the consistency of a classification
system was recently obtained by Eisenlohr and Oliveira-Filho (2014). The definition of
altitudinal zones in classification systems (Ellenberg and Mueller-Dombois 1967; Oliveira-
Filho 2009; IBGE 2012) should also guide decision-making process in biodiversity con-
servation, since these systems can guide the definition of priority areas for conservation,
human occupancy and even help shorten the reach of certain anthropogenic impacts
(Armenteras et al. 2003).
Altitudinal gradients and anthropogenic impacts are usually correlated (Nogues-Bravo
et al. 2008), as is the case with the Atlantic Forest domain, in which the forest remnants at
low and intermediate altitudes were reduced to less than 10 % of their original area, the
2150 Biodivers Conserv (2015) 24:2149–2163
123
majority of them having less than 30 hectares (Tabarelli et al. 2010). These areas generally
have arable lands that, throughout the history of occupation, were used for the extensive
cultivation of sugar cane, coffee and, more recently, soy and biofuels, in addition to
livestock raising and urban occupation (Dean 1995; Galindo-Leal and Hall Galindo-Leal
and Camara 2003). On the other hand, almost 40 % of all forests located at altitudes above
1600 m still persist; however, this was not enough to avoid massive losses, because only
1 % of the Atlantic Forest is located at this altitudinal zone (Tabarelli et al. 2010). Cur-
rently, higher areas and regions occupied by semideciduous seasonal forests (SDSF) are
being targeted for deforestation, especially for the production of coal for steel industry
(Fundacao SOS Mata Atlantica and INPE 2014).
The first efforts to conserve the Atlantic Forest are still recent (Tabarelli et al. 2005). Most
protected areas (PAs) were created only in the last 40 years and, despite the reasonable number
(approximately 700 PAs), the full extent of these areas represents only 4 % of the Atlantic
Forest (Galindo-Leal and Camara 2003). In addition, most PAs focus on evergreen rainforests,
which is a result of conservation strategies based on specific taxa (e.g. the use of ‘‘flagship
taxa’’) or a local focus (Camara 2005; Mittermeier et al. 2005; Tabarelli et al. 2005, 2010),
while the seasonal forests are virtually unprotected (MMA 2014). Currently, the Atlantic
seasonal forest of southeast Brazil has 38 PAs (five municipal, 25 state and eight federal;
Embrapa 2014) covering an area of*3 million hectares (*5 % of the original area of SDSF).
However, it is not possible to know whether all these PAs are effectively implemented or not,
as for many of them there is no information available. In the Brazilian government database
(MMA 2014 e ICMBIO 2014), only 11 PAs have information regarding altitudinal range.
From all of these sites, two encompasses all zones; four encompasses the lower highlands,
upper highlands and montane zones; two encompasses the lower/upper plains and lower
highlands; two cover only the lower/upper plains; and one encompasses upper highlands and
montane zone. Thus, it is urgent to define more areas of FESD as PAs.
Our goal was to obtain an overview of tree taxa conservation status in the Atlantic SDSF
of southeastern Brazil. Therefore, we analysed the altitudinal classification consistency,
considering the variation in composition of tree taxa, and addressed the following ques-
tions: (1) Do the altitudinal zones proposed by Oliveira-Filho (2009) reflect differences in
patterns of floristic composition observed when altitude changes? (2) Among the consistent
altitudinal zones, which one has the highest proportion of endemic, threatened, and indi-
cator species? (3) Which altitudinal zone has the highest taxa richness and highest taxo-
nomic distinctness? (4) Considering the aforementioned number of PAs per altitudinal
zone and the answers for questions 2 and 3, which of these zones can be considered as well
preserved or still in need of more conservation measures to preserve their flora? These
results may suggest additional collection efforts in areas where there is a shortage of
information and support conservation decisions such as the creation of new PAs.
Materials and methods
Study area and database
Our study area was the Atlantic SDSF of southeastern Brazil watersheds (Fig. 1), com-
prising approximately 62,895,523.33 hectares. The latitude ranges from 24�3605800S to
15�0202800S and the longitude varies from 54�3005000W to 39�3802000W. According to the
Koppen (1948) classification, two types of climate occur in this region: subtropical with
Biodivers Conserv (2015) 24:2149–2163 2151
123
dry winters, Cwa, and tropical altitude with mesothermal and humid climate, with mild
summer and temperature mitigated by elevation, Cwb. The annual precipitation varies
from 753 to 1706 mm, the mean annual temperature from 12.6 to 21.3� C, and the altitude,from 15 to 1577 m. The seasonal semideciduous forests in Brazil present a naturally
fragmented distribution. These forests occur along the contact zone between the Atlantic
rainforest and the diagonal of open formations (formed by Caatinga, Cerrado, and Chaco).
In southeastern Brazil, SDSF are distributed widely in sites with a seasonal rainfall regime,
which can be found in the Cerrado Domain and in most of the Atlantic Forest (Lopes et al.
2012). In the Atlantic Forest, SDSF is the predominant vegetation type, and, in the Cerrado
domain, SDSF occurs in enclaves associated with permanent or intermittent watercourses
(Scolforo and Carvalho 2006).
We obtained floristic data for 222 SDSF sites from the ‘NeoTropTree’ database (Oli-
veira-Filho 2014), formerly known as the ‘TreeAtlan’ database. The NeoTropTree data-
base consists of approximately 1500 sites in georeferenced areas of the Neotropics. Each
site has a radius of 5 km and contains records of occurrence of trees taxa based on
literature and herbaria records, which are included only after careful selection (Eisenlohr
and Oliveira-Filho in press; check also the NeoTropTree’s description, history and protocol
at http://www.icb.ufmg.br/treeatlan). Due to the complexity in determining what is and
what is not a tree, the database considers the free-standing plants with stems that can reach
Fig. 1 Study area, encompassing 222 sites of the Atlantic semideciduous seasonal forest of southeasternBrazil
progressively. We conducted a Tukey post hoc test adapted to treatments with unequal
sizes (Smith 1971), using the selected MEMs above as covariables.
Considering the floristically consistent altitudinal zones, we classified the species of
each zone as endemic to Brazil and to the Atlantic Forest using NeoTropTree database. To
check the amount of threatened species in each altitudinal zone, we consulted the Official
List of Threatened Brazilian Flora (MMA 2008), the Red Book of Brazilian Flora
(Martinelli and Moraes 2013) and the list prepared by the Biodiversitas Foundation
(Fundacao Biodiversitas 2007), based on the criteria and categories of IUCN (2001).
Threatened species were classified as vulnerable (VU), endangered (EN) or critically
endangered (CR) in accordance with Martinelli and Moraes (2013), the most recent
classification on this subject.
Biodivers Conserv (2015) 24:2149–2163 2153
123
In the indicator species analysis of each altitudinal zone, we excluded the uniques (427
species), i.e., species that occurred only in one site, because these occurred at that site most
likely by chance and not by affinity to habitat. We obtained indicator species using the
method proposed by Tichy and Chytry (2006) in PC-ORD 6.0 (McCune and Mefford
2011). In this analysis, an indicator value (IV) is given; the higher the IV, the greater the
affinity of the species in relation to that zone. We tested the significance of IVs by means of
Monte Carlo permutation test (999 permutations).
To compare species richness between elevation zones, we constructed rarefaction
curves based on the number of sites sampled and the number of species per zone, thus
reducing the effects of sampling effort (Gotelli and Colwell 2001). For each curve, we
generated 95 % confidence intervals with 1000 randomisations and extrapolated the curves
to a total of 222 sites (Gotelli and Colwell 2001; Colwell et al. 2012). We conducted these
analyses in EstimateS 9.1 (Colwell 2013). We also compared the taxonomic distinctness
between zones as proposed by Clarke and Warwick (1998), using PAST 3.01 (Hammer
2013). The taxonomic distinctness index is estimated by the average taxonomic distance
between any two randomly selected individuals in the data set (Magurran 2004), with
confidence intervals estimated using approximately 1000 randomisations from the pooled
dataset. One advantage of the taxonomic distinctness index is its independence from
sampling effort (Price et al. 1999).
To verify the sampling accuracy of each altitudinal zone together with all the sites, we
estimated the expected richness by using the non-parametric estimator Chao 2 through
EstimateS 9.1 (Colwell 2013) and comparing this estimate with the observed richness
(Jimenez-Valverde and Hortal 2003). The Chao 2 estimator is based on the concept of
statistical sampling coverage using the number of taxa with low frequency to estimate the
number of taxa included in the sample and, thus, the total number of taxa of an area
(Chazdon et al. 1998; Colwell and Coddington 1994). This index generates reliable esti-
mates of the minimum number of taxa in a given area (Longino et al. 2002).
Results
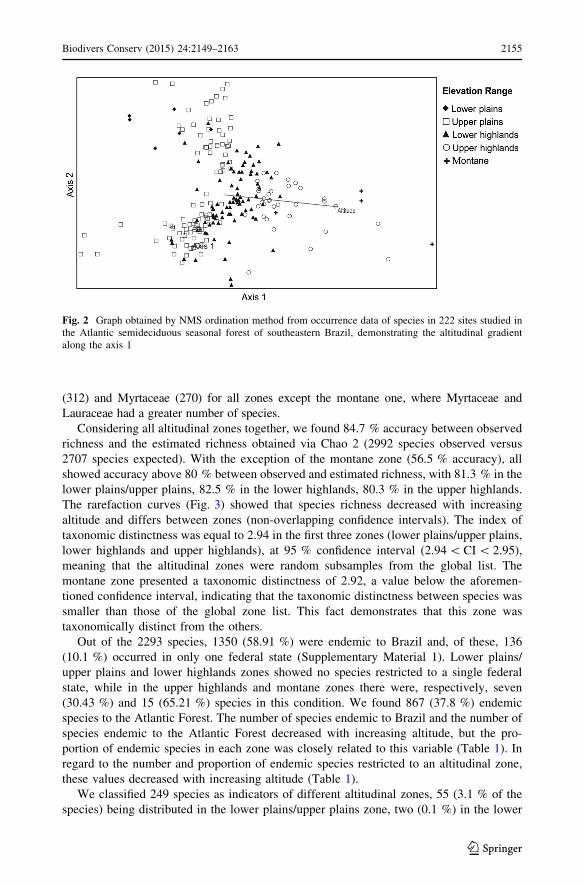
We found a consistent pattern of floristic separation between altitudinal zones along the
first NMS axis (partial ANOVA, F = 83.29, p\ 0.005; Fig. 2), although the lower alti-
tudinal zones (lower plains and upper plains) did not differ amongst themselves (Tukey
adjusted for unequal samples, p = 0.723). Thus, for subsequent analyses we united these
two zones into one, called ‘lower plains/upper plains’, between 0 and 600 m, and worked
with four zones: ‘lower plains/upper plains’, ‘lower highlands’, ‘upper highlands’, and
‘montane’. According to the DCA second axis, which reproduced*30 % of the ordination
in the original space, the length of gradient was 3.6—values close to 1 indicates a half-
change in species composition, whereas values around four indicate a full turnover in
floristic composition (Hill and Gauch 1980). Thus, the length of the gradient indicates a
high floristic variation along the altitudinal zones.
We found 2293 species in 537 genera and 110 families in the investigated sites. The zone
for ‘lower plains/upper plains’ stood out with 1773 species (484 genera and 98 families),
followed by the lower highlands zone, with 1567 species (433 genera and 100 families); the
upper highlands zone, with 1244 species (366 genera and 97 families); and the montane zone,
with 558 species (202 genera and 81 families) (Table 1). The richest families were Fabaceae
2154 Biodivers Conserv (2015) 24:2149–2163
123
(312) and Myrtaceae (270) for all zones except the montane one, where Myrtaceae and
Lauraceae had a greater number of species.
Considering all altitudinal zones together, we found 84.7 % accuracy between observed
richness and the estimated richness obtained via Chao 2 (2992 species observed versus
2707 species expected). With the exception of the montane zone (56.5 % accuracy), all
showed accuracy above 80 % between observed and estimated richness, with 81.3 % in the
lower plains/upper plains, 82.5 % in the lower highlands, 80.3 % in the upper highlands.
The rarefaction curves (Fig. 3) showed that species richness decreased with increasing
altitude and differs between zones (non-overlapping confidence intervals). The index of
taxonomic distinctness was equal to 2.94 in the first three zones (lower plains/upper plains,
lower highlands and upper highlands), at 95 % confidence interval (2.94\CI\ 2.95),
meaning that the altitudinal zones were random subsamples from the global list. The
montane zone presented a taxonomic distinctness of 2.92, a value below the aforemen-
tioned confidence interval, indicating that the taxonomic distinctness between species was
smaller than those of the global zone list. This fact demonstrates that this zone was
taxonomically distinct from the others.
Out of the 2293 species, 1350 (58.91 %) were endemic to Brazil and, of these, 136
(10.1 %) occurred in only one federal state (Supplementary Material 1). Lower plains/
upper plains and lower highlands zones showed no species restricted to a single federal
state, while in the upper highlands and montane zones there were, respectively, seven
(30.43 %) and 15 (65.21 %) species in this condition. We found 867 (37.8 %) endemic
species to the Atlantic Forest. The number of species endemic to Brazil and the number of
species endemic to the Atlantic Forest decreased with increasing altitude, but the pro-
portion of endemic species in each zone was closely related to this variable (Table 1). In
regard to the number and proportion of endemic species restricted to an altitudinal zone,
these values decreased with increasing altitude (Table 1).
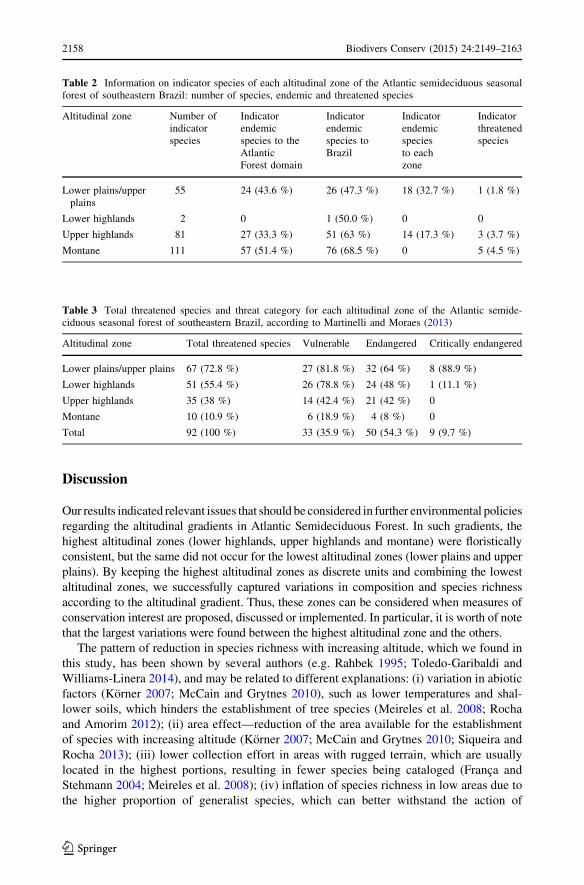
We classified 249 species as indicators of different altitudinal zones, 55 (3.1 % of the
species) being distributed in the lower plains/upper plains zone, two (0.1 %) in the lower
Fig. 2 Graph obtained by NMS ordination method from occurrence data of species in 222 sites studied inthe Atlantic semideciduous seasonal forest of southeastern Brazil, demonstrating the altitudinal gradientalong the axis 1
Biodivers Conserv (2015) 24:2149–2163 2155
123
highlands, 81 (6.5 %) in the upper highlands, and 111 (19.9 %) in the montane zone
(Table 1). The highest IVs were found for the two higher altitudes. Considering only the
indicator species, as the altitude increased, there was also an increase in the number of
species endemic to Brazil and endemic to the Atlantic Forest, as well as in the number of
threatened species, with the exception of the lower highlands zone (Table 2; Supple-
mentary Material 2).
We found 109 (4.8 %) threatened species. With increasing altitude, the number of
threatened species decreased, although the percentage of threatened species in relation
to the total number of species of each zone was very similar across the zones
(Table 1). Among the endemic species of each zone, we detected 39 (35.8 %) threat-
ened species in the lower plains/upper plains zone, eight (7.3 %) in the lower high-
lands, 13 (11.9 %) in the upper highlands, and none in the montane zone. Analysing
the number of species in each threat category according to the Red Book of Brazilian
Flora, we found that 54.3 % of the species belonged to the category ‘Endangered’,
35.9 % to the category ‘Vulnerable’, and 9.7 % to the category ‘Critically endangered’
(Table 3; Supplementary Material 3). The number of species per threat category also
decreased with increasing altitude (Table 3). Out of the nine species CR, eight were
endemic to the lower plains/upper plains zone and one was endemic to the lower
highlands zone. Among the indicator species, nine (3.6 %) were threatened, having one
(1.8 %) species in the lower plains/upper plains zone, three (3.7 %) species in upper
highlands, and five (4.5 %) species in the montane sites. Of these species, Gochnatia
hatschbachii was endemic to the upper highlands zone and Paratecoma peroba was
endemic to the lower plains/upper plains zone.
Fig. 3 Species rarefaction curve (thick line) and confidence interval of 95 % (thin line) based on number ofsites investigated in the Atlantic semideciduous seasonal forest of southeastern Brazil. The curves wereextrapolated to the total of 222 sites
Our results indicated relevant issues that should be considered in further environmental policies
regarding the altitudinal gradients in Atlantic Semideciduous Forest. In such gradients, the
highest altitudinal zones (lower highlands, upper highlands and montane) were floristically
consistent, but the same did not occur for the lowest altitudinal zones (lower plains and upper
plains). By keeping the highest altitudinal zones as discrete units and combining the lowest
altitudinal zones, we successfully captured variations in composition and species richness
according to the altitudinal gradient. Thus, these zones can be considered when measures of
conservation interest are proposed, discussed or implemented. In particular, it is worth of note
that the largest variations were found between the highest altitudinal zone and the others.
The pattern of reduction in species richness with increasing altitude, which we found in
this study, has been shown by several authors (e.g. Rahbek 1995; Toledo-Garibaldi and
Williams-Linera 2014), and may be related to different explanations: (i) variation in abiotic
factors (Korner 2007; McCain and Grytnes 2010), such as lower temperatures and shal-
lower soils, which hinders the establishment of tree species (Meireles et al. 2008; Rocha
and Amorim 2012); (ii) area effect—reduction of the area available for the establishment
of species with increasing altitude (Korner 2007; McCain and Grytnes 2010; Siqueira and
Rocha 2013); (iii) lower collection effort in areas with rugged terrain, which are usually
located in the highest portions, resulting in fewer species being cataloged (Franca and
Stehmann 2004; Meireles et al. 2008); (iv) inflation of species richness in low areas due to
the higher proportion of generalist species, which can better withstand the action of
Table 3 Total threatened species and threat category for each altitudinal zone of the Atlantic semide-ciduous seasonal forest of southeastern Brazil, according to Martinelli and Moraes (2013)
Altitudinal zone Total threatened species Vulnerable Endangered Critically endangered
Table 2 Information on indicator species of each altitudinal zone of the Atlantic semideciduous seasonalforest of southeastern Brazil: number of species, endemic and threatened species
Altitudinal zone Number ofindicatorspecies
Indicatorendemicspecies to theAtlanticForest domain
cia follii, Pouteria bapeba, Pouteria butyrocarpa, Chionanthus tenuis, and Symplocos
neglecta, have restricted distribution and occur in areas threatened by anthropogenic ac-
tions (Martinelli and Moraes 2013). These anthropogenic actions, such as changes in land
usage, common in areas of gentle relief, are often cited as the main triggers of species
extinction (Baillie et al. 2004).
The montane zone, despite having less taxa richness, also requires efforts to ensure its
conservation, especially because it incorporated a large number of indicator species and
exhibited a floristic composition quite distinct from the other altitudinal zones. The index
of taxonomic distinctness showed that this zone would be taxonomically different from the
others, which may be mostly due to the restricted occurrence of some taxa at higher
altitudes. Among these taxa are Araucaria angustifolia and Drymis brasiliensis, which are
species of ancient origin adapted to the highlands of southern Brazil (IBGE 2012). We also
emphasise that this altitudinal zone has not been sufficiently sampled, as indicated by the
results of estimated species richness, mainly because it comprises areas that are hardly
assessed due to topography. Franca and Stehmann (2004) and Meireles et al. (2008)
emphasised that few floristic surveys of montane forest vegetation were conducted on the
Atlantic Forest, with the exception of the southeastern region (e.g. Carvalho et al. 2000;
Soares et al. 2006; Gonzaga et al. 2008; Meireles et al. 2008). Thus, the inclusion of these
forest remnants within PAs and increasing collection efforts are essential to the conser-
vation of this altitudinal zone.
The largest number of indicator species threatened with extinction (five) was also found
in the montane zone. Among these, only Dicksonia sellowiana is widely distributed in the
Americas, with lower altitudinal restrictions (occurring at altitudes between 60 and
2200 m; CNCFlora 2012). In turn, the distribution of A. angustifolia, Baccharis ly-
chnophora, Lychnophora tomentosa and Euplassa semicostata is related to high altitudes
([1000 m), and A. angustifolia also occurs at lower altitudes in the subtropical portion of
the Atlantic Forest, while in the tropical portion of the Atlantic Forest this species is
restricted to high altitudes (Backes 2009). Of the two indicator species and also threatened
in the upper highlands zone, Ocotea odorifera has wide distribution in the Atlantic Forest
and Cerrado, and also occurs in the Amazon, while the distribution of G. hatschbachii is
restricted to the Serra do Cipo, in the state of Minas Gerais, at elevations above 700 m
(Martinelli and Moraes 2013). In the lower plains/upper plains zone, we found the species
P. peroba, which is endemic to southeastern Brazil and restricted to altitudes below 50 m.
The main threats to the species above mentioned are habitat loss and exploitation for
timber or ornamental use (Martinelli and Moraes 2013).
Biodivers Conserv (2015) 24:2149–2163 2159
123
Conservation strategies based on the analysis of large geographic ranges, considering
the largest number of taxa possible and environmental factors such as altitude, show a new
path to improve conservation in the Atlantic Forest, contrasting with strategies focusing
only in a few taxa and in small areas or fragments. For the SDSFs of southeastern Brazil,
by adopting this broader approach it was possible to verify that areas located in lower
altitudinal zones (lower plains/upper plains) deserve effective conservation efforts because
of high taxa richness, endemism and the high number of threatened species, and also
because of the strong anthropogenic pressures to which they are subjected. The interme-
diate altitudinal zones (lower and upper highlands highlands), although being gradually
less influenced by the changes in land use and human impacts as the altitude raises, also
have considerable species richness, endemic and EN species, which highlights the im-
portance of considering these zones in conservation strategies. The large amount of
indicator species of the montane zone, as well as its unique floristic composition in relation
to the other altitudinal zones, suggests that this zone should also be a focus of conservation
measures.
The loss and fragmentation of forest habitats can promote drastic changes in how an
ecosystem function and in the viability of its populations (Tabarelli et al. 2012). Therefore,
the adoptions of conservation measures such as the creation of PAs, as well as compliance
with environmental legislation, are measures that can help reduce the rate of deforestation.
Since the protection coverage in SDSFs is very limited, we emphasize the importance of
implementing new PAs to ensure the maintenance of its remaining diversity. The endemic
and EN species cited in the supplementary material of this paper should be taken into
account when selecting and prioritizing possible areas for conservation and can be included
in forest recovery programmes when appropriate and possible, always considering the
genetic and ecological features of each species and its natural habitat and area of occur-
rence. Strategies for conservation should, whenever possible, prioritise the maintenance of
the altitudinal gradient as a whole (see also McCain and Grytnes 2010), ensuring the
protection of taxa and their ecosystem services.
Acknowledgments VLR, PLSM, and LM thank CAPES, and PVE thanks CNPq for scholarships. ATOFalso offers thanks to CNPq for the research productivity scholarship.
References
Alexander JM, Kueffer C, Daheler CC, Edwards PJ, Pauchard A, Seipel T (2011) Assembly of non-nativefloras along elevational gradients explained by directional ecological filtering. Proc Natl Acad Sci USA108:656–661. doi:10.1073/pnas.1013136108
Armenteras D, Gast F, Villareal H (2003) Andean forest fragmentation and the representativeness ofprotected natural areas in the eastern Andes, Colombia. Biol Conserv 113:245–256. doi:10.1016/S0006-3207(02)00359-2
Aubreville A (1956) Essai de classification et de nomenclature des formations forestieres africaines avecextension du systeme propose a toutes les formations du monde tropical. In: CSA Specialist Meetingon Phyto-Geography. Yangambi, Congo
Backes A (2009) Distribuicao atual da Floresta com Araucaria: condicionamento climatico. In: Fonseca CR,Souza AF, Leal-Zanchet AN, Dutra T, Backs A, Ganaddo G (eds) Floresta com Araucaria: ecologia,conservacao e desenvolvimento sustentavel. Holos, Ribeirao Preto, pp 39–44
Baillie JEM, Hilton-Taylor C, Stuart S (2004) IUCN red list of threatened species: a global assessment.IUCN
Barry RG (2008) Mountain weather and climate. Cambridge University Press, CambridgeCamara IG (2005) Breve historia da conservacao da Mata Atlantica. In: Galindo-Leal C, Camara IG (eds)
Mata Atlantica: biodiversidade, ameacas e perspectivas. Fundacao SOS Mata Atlantica, Sao Paulo,pp 31–42
Carvalho LMT, Fontes MAL, Oliveira-Filho AT (2000) Tree taxa distribution in canopy gaps and matureforest in an area of cloud forest of the Ibitipoca range, south-eastern Brazil. Plant Ecol 149:9–22.doi:10.1023/A:1009836810707
Chaverri-Polini A (1998) Mountains, biodiversity and conservation. Unasylva 195:22–33Chazdon RL, Colwell RK, Denslow JS, Guariguata MR (1998) Statistical methods for estimating taxa
richness of woody regeneration in primary and secondary rain forests of NE Costa Rica. In: DallmeierF, Comiskey J (eds) Forest biodiversity research, monitoring and modeling: conceptual backgroundand old world case studies. Parthenon Publishing, Paris, pp 285–309
Clarke KR, Warwick RM (1998) A taxonomic distinctness index and its statistical properties. J Appl Ecol35:523–531. doi:10.1046/j.1365-2664.1998.3540523.x
CNCFlora—Centro Nacional de Conservacao da Flora (2012). http://cncflora.jbrj.gov.br/. Accessed 20 June2014
Colwell RK (2013) EstimateS: Statistical estimation of taxa richness and shared taxa from samples, version9, User’s Guide and application published. http://purl.oclc.org/estimates. Accessed 10 April 2014
Colwell RK, Coddington JA (1994) Estimating terrestrial biodiversity through extrapolation. Philos Trans RSoc 345:101–118. doi:10.1098/rstb.1994.0091
Colwell RK, Chao A, Gotelli NJ, Lin S, Mao CX, Chazdon RL, Longino JT (2012) Models and estimatorslinking individual-based and sample-based rarefaction, extrapolation and comparison of assemblages.J Plant Ecol 5:3–21. doi:10.1093/jpe/rtr044
Costanza R, d’Arge R, Groot R, Farber S, Grasso M, Hannon B, Limburg K, Naeem S, O’Neil RV, ParueloJ, Raskin RG, Sutton P, Van den Belt M (1997) The value of the world’s ecosystem services andnatural capital. Nature 387:253–260. doi:10.1038/387253a0
Dean W (1995) With broadax and firebrand—the destruction of the Brazilian Atlantic Forest. University ofCalifornia Press, Berkeley
Dray S, Legendre P, Peres-Neto P (2006) Spatial modeling: a comprehensive framework for principalcoordinate analysis of neighbor matrices (PCNM). Ecol Model 196:483–493. doi:10.1016/j.ecolmodel.2006.02.015
Eisenlohr PV (2014) Persisting challenges in multiple models: a note on commonly unnoticed issuesregarding collinearity and spatial structure of ecological data. Braz J Bot. doi:10.1007/s40415-014-0064-3
Eisenlohr PV, Oliveira-Filho AT (2014) Tree taxa composition in areas of Atlantic Forest in southeasternBrazil is consistent with a new system for classifying the vegetation of South America. Acta Bot Bras28:227–233. doi:10.1590/S0102-33062014000200009
Eisenlohr PV, Oliveira-Filho AT. Obtencao e estruturacao de metadados para trabalhos fitogeograficos desıntese e o banco de dados NeotropTree como estudo de caso. In: Eisenlohr PV, Felfili JM, AndradeLA, Melo MMRF, Meira-Neto JAA (eds) Fitossociologia no Brasil: Metodos e estudos de casos, v. 2.Editora UFV, Vicosa (in press)
Ellenberg H, Mueller-Dombois DA (1967) Tentative physiognomic-ecological classification of plant for-mations of the Earth. Berichte des Geobotanischen Institutes der Eidg. Techn. Hochshule StiftungRubel, Zurich
Embrapa Monitoramento por Satelite. SOMABRASIL: Sistema de Observacao e Monitoramento da Agri-cultura no Brasil. http://www.cnpm.embrapa.br/projetos/somabrasil/index.html. Accessed 20 Oct 2014
Franca GS, Stehmann JR (2004) Composicao florıstica e estrutura do componente arboreo de uma florestaaltimontana no municıpio de Camanducaia, Minas Gerais, Brasil. Rev Bras Bot 27:19–30. doi:10.1590/S0100-84042004000100003
Fundacao SOS Mata Atlantica, INPE—Instituto Nacional de Pesquisas Espaciais (2014) Atlas dos re-manescentes florestais da mata Atlantica, perıodo 2012–2013. http://www.sosmatatlantica.org.br.Accessed 10 June 2014
Galindo-Leal C, Camara IG (2003) Atlantic forest hotspots status: an overview. In: Galindo-Leal C, CamaraIC (eds) The Atlantic forest of South America: biodiversity status, threats, and outlook. Center forApplied Biodiversity Science e Island Press, Washington, pp 3–11
Gaston KJ (2000) Global patterns in biodiversity. Nature 405:220–227. doi:10.1038/35012228Gentry AH (1988) Changes in plant community diversity and floristic composition on environmental and
geographical gradients. Ann Mo Bot Gard 75:1–34. doi:10.2307/2399464
Gonzaga APD, Oliveira-Filho AT, Machado ELM, Hargreaves P, Machado JNM (2008) Diagnosticoflorıstico-estrutural do componente arboreo da floresta da Serra de Sao Jose, Tiradentes, MG, Brasil.Acta Bot Bras 22:505–520. doi:10.1590/S0102-33062008000200018
Gotelli NJ, Colwell RK (2001) Quantifying biodiversity: procedures and pitfalls in the measurement andcomparison of taxa richness. Ecol Lett 4:379–391. doi:10.1046/j.1461-0248.2001.00230.x
Grytnes JA, Beaman JH (2006) Elevational taxa richness patterns for vascular plants on Mount Kinabalu,Borneo. J Biogeogr 33:1838–1849. doi:10.1111/j.1365-2699.2006.01554.x
Grytnes JA, Heegaard E, Ihlen PG (2006) Taxa richness of vascular plants, bryophytes, and lichens along analtitudinal gradient in western Norway. Acta Oecol 29:241–246. doi:10.1016/j.actao.2005.10.007
Guo O, Kelt DA, Sun Z, Liu H, Hu L, Ren H, Wen J (2013) Global variation in elevational diversitypatterns. Sci Rep. doi:10.1038/srep03007
Gut B (2008) What is a tree. In: Gut B (ed) Trees in Patagonia. Birkhauser Basel, Berlin, p 29Hammer Ø (2013) PAST—Paleontological Statistics version 3.01. http://folk.uio.no/ohammer/past/. Ac-
cessed 21 April 2014Hill MO, Gauch HG Jr (1980) Detrended correspondence analysis: an improved ordination technique.
Vegetatio 42:47–58IBGE (2012) Manual Tecnico da Vegetacao Brasileira. Instituto Brasileiro de Geografia e Estatıstica—
IBGE, Rio de JaneiroICMBIO—Instituto Chico Mendes de Conservacao da Biodiversidade. http://www.icmbio.gov.br. Accessed
30 June 2014IUCN—International Union for Conservation of Nature (2001) IUCN red list categories and criteria, version
3.1. IUCN, Gland, Switzerland and Cambridge, UKJimenez-Valverde A, Hortal J (2003) Las curvas de acumulacion de etaxa y la necesidad de evaluar la
calidad de los inventarios biologicos. Rev Iber Aracnol 8:151–161Kandus P, Quintana RD, Minotti PG, Oddi JP, Baigun C, Trilla GG, Ceballos D (2011) Ecosistemas de
humedal y uma perspectiva hidrogeomorfica como marco para la valoracion ecologica de susbienes yservicios. In: Laterra P, Jobbagy EG, Paruelo JM (eds) Valoracion de servicios ecosistemicos: con-ceptos, herramientas y aplicaciones para el ordenamiento territorial. Ediciones Inta, Buenos Aires,pp 265–292
Koppen W (1948) Climatologia. Fondo de Cultura, MexicoKorner C (2007) The use of altitude in ecological research. Trends Ecol Evol 22:569–574. doi:10.1016/j.
tree.2007.09.006Longino JT, Coddington J, Colwell RK (2002) The ant fauna of a tropical rain forest: estimating taxa
richness three different ways. Ecology 83:689–702. doi:10.1890/0012-9658(2002)083[0689:TAFOAT]2.0.CO;2
Lopes SF, Schiavini I, Oliveira AP, Vale VS (2012) An ecological comparison of floristic composition inseasonal semideciduous forest in Southeast Brazil: implications for conservation. Int J For Res. doi:10.1155/2012/537269
Magurran AE (2004) Measuring biological diversity. Blackwell, LondonMartinelli G (2007) Mountain biodiversity in Brazil. Rev Bras Bot 30:587–597. doi:10.1590/S0100-
84042007000400005Martinelli G, Moraes MA (2013) Livro vermelho da flora do Brasil. Jardim Botanico do Rio de Janeiro, Rio
de JaneiroMcCain CM, Grytnes JA (2010) Elevation gradients in taxa richness. eLS. doi:10.1002/9780470015902.
a0022548McCune B, Grace JB (2002) Analysis of ecological communities. MjM Software Design, Gleneden BeachMcCune B, Mefford MJ (2011) PC-ORD—multivariate analysis of ecological data, version 6.0. MjM
Software Design, Gleneden BeachMeireles LD, Shepherd GL, Kinoshita LS (2008) Variacoes na composicao florıstica e na estrutura fi-
tossociologica de uma floresta ombrofila densa alto-montana na Serra da Mantiqueira, Monte Verde,MG. Rev Bras Bot 31:559–574. doi:10.1590/S0100-84042008000400003
Mittermeier RA, Gil RP, Hoffman M, Pilgrim J, Brooks T, Mittermeier CG, Lamoreux J, Fonseca GAB(2005) Hotspots revisited: earth’s biologically richest and most endangered terrestrial ecoregions.University of Chicago Press, Boston
MMA—Ministerio do Meio Ambiente (2008) Instrucao Normativa n�. 6, de 23 de setembro de 2008. http://www.mma.gov.br/estruturas/179/_arquivos/179_05122008033615.pdf. Accessed 16 April 2014
MMA—Ministerio do Meio Ambiente (2014). http://www.mma.gov.br/. Accessed 29 June 2014Nimer E (1977) Clima, Geografia do Brasil, Regiao do Sudeste. Fund Inst Geogr Estat 3:51–89Nogues-Bravo D, Araujo MB, Romdal R, Rahbek C (2008) Scale effects and human impact on the
Oliveira-Filho AT (2009) Classificacao das fitofisionomias da America do Sul Cisandina Tropical e Sub-tropical: proposta de um novo sistema—pratico e flexıvel—ou uma injecao a mais de caos? Ro-driguesia 60:237–258
Oliveira-Filho AT (2014) NeoTropTree, Flora arborea da Regiao Neotropical: um banco de dados envol-vendo biogeografia, diversidade e conservacao. http://www.icb.ufmg.br/treeatlan/. Accessed 10 April2014
Peres-Neto PR, Legendre P (2010) Estimating and controlling for spatial structure in the study of ecologicalcommunities. Global Ecol Biogeogr 19:174–184. doi:10.1111/j.1466-8238.2009.00506.x
Peres-Neto PR, Legendre P, Dray S, Borcard D (2006) Variation partitioning of taxa data matrices: esti-mation and comparison of fractions. Ecology 87:2614–2625. doi:10.1890/0012-9658(2006)87[2614:VPOSDM]2.0.CO;2
Price ARG, Keeling MJ, O’Callaghan CJ (1999) Ocean scale-patterns of ‘‘biodiversity’’ of Atlantic asteroidsdetermine from taxonomic distinctness and other measures. Biol J Linn Soc 66:187–203. doi:10.1111/j.1095-8312.1999.tb01883.x
Rahbek C (1995) The elevational gradient of taxa richness: a uniform pattern? Ecography 18:200–205.doi:10.1111/j.1600-0587.1995.tb00341.x
Rocha DSB, Amorim AMA (2012) Altitudinal heterogeneity in northern Atlantic Forest: a case study insoutheastern Bahia, Brazil. Acta Bot Bras 26:309–327. doi:10.1590/S0102-33062012000200008
Safford HD (2007) Phytogeography of the campos de altitude. J Biogeogr 34:1–22. doi:10.1111/j.1365-2699.2007.01732.x
Sanchez M, Pedroni F, Eisenlohr PV, Oliveira-Filho AT (2013) Changes in tree community composition andstructure of Atlantic rain forest on a slope of the Serra do Mar range, southeastern Brazil, from near sealevel to 1000 m of altitude. Flora. doi:10.1016/j.flora.2013.03.002
Scolforo JR, Carvalho LMT (2006) Mapeamento e inventario da flora nativa e dos reflorestamentos deMinas Gerais. UFLA, Lavras
Siqueira CC, Rocha CFD (2013) Altitudinal gradients: concepts and implications on the biology, thedistribution and conservation of Anurans. Oecol Aust 17:282–302
Smith CJ (1971) Seed dormancy in Sabi Panicum. Proc Int Seed Test Assoc 36:81–97Smith AP, Young TP (1987) Tropical alpine plant ecology. Annu Rev Ecol Syst 18:137–158. doi:10.1146/
annurev.es.18.110187.001033Soares MP, Junior AWS, Meira-Neto JAA, Silva AF, Souza AL (2006) Composicao florıstica do estrato
arboreo de floresta Atlantica Interiorana em Araponga—Minas Gerais. Rev Arv 30:859–870. doi:10.1590/S0100-67622006000500020
Tabarelli M, Pinto LP, Silva JMC, Hirota M, Bede L (2005) Challenges and opportunities for biodiversityconservation in the Brazilian Atlantic forest. Conserv Biol 19:695–700. doi:10.1111/j.1523-1739.2005.00694.x
Tabarelli M, Aguar AV, Ribeiro MC, Metzger JP, Peres CA (2010) Prospects for biodiversity conservationin the Atlantic forest: lessons for aging human-modified landscapes. Biol Conserv 143:2328–2340.doi:10.1016/j.biocon.2010.02.005
Tabarelli M, Aguiar AV, Ribeiro MC, Metzger JP (2012) A conversao da Floresta Atlantica em paisagensantropicas: licoes para a conservacao da diversidade biologica das florestas tropicais. Interciencia37:88–92
Tichy L, Chytry M (2006) Statistical determination of diagnostic taxa for site groups of unequal size. J VegSci 17:809–818. doi:10.1111/j.1654-1103.2006.tb02504.x
Toledo-Garibaldi M, Williams-Linera G (2014) Tree diversity patterns in successive vegetation types alongan elevation gradient in the Mountains of Eastern Mexico. Ecol Res 29:1097–1104. doi:10.1007/s11284-014-1196-4
Veloso HP, Rangel Filho ALR, Lima JCA (1991) Classificacao da vegetacao brasileira adaptada a umsistema universal. Fundacao Instituto Brasileiro de Geografia e Estatıstica—IBGE, Rio de Janeiro