IRIS CORE PROPOSAL 2010 | VOLUME II | EPISODIC TREMOR AND SLIP, TRIGGERED EARTHQUAKES | II- 81 Tremor Monitoring Aaron Wech (University of Washington) Since their discovery nearly a decade ago, advances in both instrumentation and methodology in subduction zones around the world have brought the causal connection between seismically observed tectonic tremor and geodetically observed slow slip into sharper focus—with it becoming increasingly clear that tremor serves as a proxy for slow slip. Considering geodesy’s lower limits in spatio-temporal resolution together with the abundance of low-level, ageodetic tremor, this connection makes tremor a key component in monitoring when, where, and how much slip is occurring. Because slow slip transfers stress to the updip seismogenic portion of the plate interface, monitoring transient events may serve in forecasting the threat of a megathrust earth- quake by inferring the temporal and spatial variations in the loading of the seismogenic zone. We use waveform envelope cor- relation & clustering [Wech and Creager, 2008] methodology to automatically detect and locate tremor. Applying this technique to TA, PASSCAL, PBO, and regional network data, we map tremor epicenters from northern California to mid- Vancouver Island and present a system that monitors and reports tremor activity in near-realtime on an interactive webpage [Wech, 2010]. Collectively the resulting product is an automatic margin-wide tremor catalog and a website disseminating this information in a way that is accessible and engaging to the general population yet remains valuable as a tool for scientific synergy across institu- tions and disciplines: www.pnsn.org/tremor References Wech, A.G., and K.C. Creager (2008), Automatic detection and location of Cascadia tremor, Geophys. Res. Lett., 35, L20302. Wech, A.G. (2010), Interactive Tremor Monitoring, Seismol. Res. Lett., 81:4, July/August 2010. Audet, P., et al. (2010), Slab morphology in the Cascadia fore arc and its relation to episodic tremor and slip, J. Geophys. Res., 115. Acknowledgements: is work was funded by USGS grant #’s 08HQGR0034, G09AP00024, & G10AP00033. Realtime data are provided by the Pacific Northwest Seismic Network, Pacific Geoscience Center, Plate Boundary Observatory, and Northern California Regional Network. Tremor map. Margin-wide epicenters from 2006-2009 using TA, PASSCAL, PBO, and regional network data. Yellow lines are 20, 30, and 40 km isodepths from Audet et al. [2010]. A screenshot of the web product resulting from this near-realtime system.
Transcript
IRIS CoRe PRoPoSal 2010 | Volume I I | ePISoDIC TRemoR anD SlIP, TRIGGeReD eaRTHQuaKeS | I I -81
Tremor MonitoringAaron Wech (University of Washington)
Since their discovery nearly a decade ago, advances in both instrumentation and methodology in subduction zones around the world have brought the causal connection between seismically observed tectonic tremor and geodetically observed slow slip into sharper focus—with it becoming increasingly clear that tremor serves as a proxy for slow slip. Considering geodesy’s lower limits in spatio-temporal resolution together with the abundance of low-level, ageodetic tremor, this connection makes tremor akeycomponentinmonitoringwhen,where,andhowmuchslipisoccurring.Becauseslowsliptransfersstresstotheupdipseismogenic portion of the plate interface, monitoring transient events may serve in forecasting the threat of a megathrust earth-quakebyinferringthetemporalandspatialvariationsintheloadingoftheseismogeniczone.Weusewaveformenvelopecor-relation&clustering[Wech and Creager, 2008]methodologytoautomaticallydetectandlocatetremor.ApplyingthistechniquetoTA,PASSCAL,PBO,andregionalnetworkdata,wemaptremorepicenters fromnorthernCaliforniatomid-VancouverIsland and present a system that monitors and reports tremor activity in near-realtime on an interactive webpage [Wech, 2010].Collectively the resulting product is an automatic margin-wide tremor catalog and a website disseminating this information in a way that is accessible and engaging to the general population yet remains valuable as a tool for scientific synergy across institu-tionsanddisciplines:www.pnsn.org/tremor
Tremor map. margin-wide epicenters from 2006-2009 using Ta, PaSSCal, Pbo, and regional network data. Yellow lines are 20, 30, and 40 km isodepths from audet et al. [2010]. a screenshot of the web product resulting from this near-realtime system.
II-82 | IRIS CoRe PRoPoSal 2010 | Volume I I | ePISoDIC TRemoR anD SlIP, TRIGGeReD eaRTHQuaKeS
Latit
ude
Longitude-98˚ -96˚
16˚
18˚
OXPL
OXNC
OXSVOXEC
OXETOXTT
OXBV
SSEUSL
NoUSL
Megathrust EQ20-km
40-km
60-km
80-km
100-km
Middle America Trench
N50 km
Figure 1
Non-Volcanic Tremor along the Oaxaca Segment of the Middle America Subduction ZoneMichael Brudzinski (Department of Geology, Miami University of Ohio), Héctor Hinojosa-Prieto (Department of Geology, Miami University of Ohio), Kristen Schlanser (Department of Geology, Miami University of Ohio), Enrique Cabral-Cano (Departamento de Geomagnetismo y Exploración, Instituto de Geofísica, Universidad Nacional Autónoma de México), Alejandra Arciniega-Ceballos (Departamento de Vulcanología, Instituto de Geofísica, Universidad Nacional Autónoma de México), Oscar Diaz-Molina (Departamento de Geomagnetismo y Exploración, Instituto de Geofísica, Universidad Nacional Autónoma de México), Charles DeMets (Department of Geology and Geophysics, University of Wisconsin-Madison)
The Oaxaca subduction zone is an ideal area for detailed studies of plate boundary deformation as rapid convergent rates, shallow subduction, and short trench-to-coast distances bring the thermally defined seismogenic and transition zones of the plateinterfaceover100kminland.PreviousanalysisofslowslipeventsinsouthernMexicosuggeststheymayrepresentmotionin the transition zone, defining the downdip edge of future megathrust earthquakes. A new deployment consisting of broadband seismometersdistributedinlandalongtheOaxacasegmentprovidethemeanstoexaminewhethernon-volcanictremor(NVT)signals can also be used to characterize the boundary between the seismogenic and transition zones. In this study, we established thatNVTexistsintheOaxacaregionbasedonwaxingandwaningofseismicenergyonfilteredday-longseismogramsthatwere correlated across neighboring stations, and further supported by appropriate relative time moveouts in record sections, andspectrogramswithnarrowfrequencybands.18prominentNVTepisodesthatlastedupwardsofaweekwereidentifieddur-ingthe15monthsanalyzed(June2006toSeptember2007),recurringasfrequentlyasevery2-3monthsinagivenregion.WeanalyzeNVTenvelopewaveformswithasemi-automatedprocessforidentifyingprominentenergybursts,andanalyst-refinedrelativearrivaltimesareinvertedforsourcelocations.NVTburstepicentersprimarilyoccurbetweenthe40-50kmcontoursfordepthoftheplateinterface,exceptineasternOaxacawheretheyshifttowardsthe30kmcontourastheslabsteepens.NVThypocenterscorrelatewellwithahighconductivityzonethat is interpretedtobeduetoslabfluids.NVTismore frequent,shorterinduration,andlocatedfurtherinlandthanGPS-detectedslowslip,whilethelatterisassociatedwithazoneofultra-slowvelocityinterpretedtorepresenthighporefluidpressure.Thiszoneofslowslipcorrespondstoapproximately350–450°C,with megathrust earthquakes, microseismicity, and strong long-term coupling occurring immediately updip from it. This leaves NVTprimarilyinaregionfurtherinlandfromthethermallydefinedtransitionzone,suggestingthattransitionfromlockingtofree slip may occur in more than one phase.
Acknowledgements:NSFEAR-510812
map of the study region focused along the oaxaca seg-ment of the middle american Subduction Zone. Grey trian-gles (seismic) and white squares (GPS) show the state of the joint network in 2006-2007 that is used to determine the extent of non-volcanic tremor in July 2006 (green line, this study) and the 100 mm slip contour for slow slip events in early 2006 and early 2007 (white ovals) [Correa-mora et al., 2008; 2009]. black ovals are approximate rupture zones of large subduction thrust earthquakes over the past 50 years as estimated from locations of rupture aftershocks. Straight line is a profile of magnetotelluric measurements with areas of high conductivity near the subduction inter-face highlighted in yellow [Jödicke et al., 2006]. Dotted lines are isodepths of the subducting plate from analysis of seismicity [Pardo and Suarez, 1995]. blue circle indicates where an ultra-slow velocity layer has been detected, and dashed circle indicates where it is absent.
IRIS CoRe PRoPoSal 2010 | Volume I I | ePISoDIC TRemoR anD SlIP, TRIGGeReD eaRTHQuaKeS | I I -83
Slow Slip and Tremor in the Northern Costa Rica Seismogenic ZoneS.Y. Schwartz (University of California, Santa Cruz), J.I. Walter (UC Santa Cruz), T.H. Dixon (Univ. of Miami), K. Outerbridge (Univ. of Miami), J.M. Protti (OVSICORI-UNA), V. Gonzalez (OVSICORI-UNA)
Several episodes of slow slip and tremor are believed to have occurred at the plate boundary of northern Costa Rica between 2000and2008.Theevidence for theseeventsvariesandconsistsof:1)correlatedfluidflowexcursionsandseismic tremorrecorded on ocean bottom instruments in 2000 [Brown et al., 2005];2)offsetsincontinuousGPSdatainSeptember2003;3)offsetsinGPSdataaccompaniedbyseismictremorinMay2007[Outerbridgeetal.,2010];and4)strongprolongedseismictremorinAugust2008.Modelingofthe2000eventsuggestedthatslipoccurredatshallowdepth,betweenthesurfaceand~15kilometers. The much better constrained slip distribution of the 2007 event consisted of 2 patches, the stronger centered at ~30 kmdepth,nearthedowndiptransitionfromstick-sliptostablesliding,andtheweakerpatchlocatedat~6kmdepthattheupdipedgeoftheshallowfrictionaltransition.Tremorlocationsforthe2008episodelocateoffshoreatdepthsofbetween6-10km. The 2003 event was recorded on too few instruments to be modeled. These results are significant in that they are the first to suggest that slow slip occurs at the up dip transition from stick-slip to stable sliding; locations of slow slip in other environments have been limited to the down dip frictional transition.
Duetotherelativelysmallsurfacedisplacements(1-2cm)associatedwithCostaRicaslowslipevents,thecoincidentoccur-rence of seismic tremor is important for their detection and study. Similar to tremor observations in southwest Japan, Costa Rica tremor consists of swarms of low-frequency earthquakes that occur as repetitive stick-slip motion on the plate interface [Brown et al., 2009],containsverylowfrequencyearthquakes,withdominantenergybetween20-50s,andappearstobetidallymodulated.
References
Brown,J.R.,G.C.Beroza,S.Ide,K.Ohta,D.R.Shelly,S.Y.Schwartz,W.Rabbel,M.Thorwart,andH.Kao(2009),Deeplow-frequencyearth-quakes in tremor localize to the plate interface in multiple subduction zones, Geophys. Res. Lett., 36,L19306.
Brown,K.M.,M.D.Tryona,H.R.DeShon,L.M.Dorman,andS.Y.Schwartz,(2005),Transientfluidpulsingandseismictremor:Evidenceof episodic creep at the updip edge of the seismogenic zone, Costa Rica, Earth Planet. Sci. Lett., 238,189-203.
Outerbridge,K.C.,T.H.Dixon,S.Y.Schwartz,J.I.Walter,M.Protti,V.Gonzalez,J.Biggs,M.M.Thorwart,andW.Rabbel(2010),AtremorandslipeventontheCocos-CaribbeanSubductionzoneasmeasuredbyaGPSandseismicnetworkontheNicoyaPeninsula,CostaRica,J. Geophys. Res., in press.
Acknowledgements: This research was supported by several grants from NSF’s MARGINS and Instrumentation and Facilities programs including OCE-0841061andOCE-0841091alongwithEAR-0842338,EAR-0506463,EAR-0502488,EAR-0842137,EAR-0502221andEAR-0506382.
north component of displacement at station GRZa compared to a histogram of cumulative tremor duration per day for the entire year of 2007. The onset and duration of the geodetically determined slow slip correlates well with the peaks in the tremor time series.
locations of tremor episodes and low frequency earthquakes (lfes) compared with the 2007 slow slip distribution.
II-84 | IRIS CoRe PRoPoSal 2010 | Volume I I | ePISoDIC TRemoR anD SlIP, TRIGGeReD eaRTHQuaKeS
An Earthquake-Like Magnitude-Frequency Distribution of Tectonic Tremor in Northern CascadiaKenneth Creager (University of Washington), Aaron Wech (University of Washington), Heidi Houston (University of Washington), John Vidale (University of Washington)
Majorepisodictremorandslip(ETS)eventswithMw6.4to6.7repeatevery15±2monthswithintheCascadiasubductionzoneundertheOlympicPeninsula.AlthoughthesemajorETSeventsareobservedtoreleasestrain,smaller“tremorswarms”withoutdetectablegeodeticdeformationaremorefrequent.WeemployaWaveformEnvelopeCross-CorrelationandClustering(WECC)[WechandCreager,2008]algorithmtosearchevery50%-overlapping5-minutewindowfor tremor.Theresulting20,000tremorepicentersfrom2006through2009innorthernWashingtonnaturallyclusterinspaceandtimeintothe91tremorswarmsanalyzedhere.Wefindthat88inter-ETStremorswarmsaccountfor45%ofthetotaldurationoftremordetectiondur-ingthelastthreeETScycles.Consideringdurationasproportionaltomomentrelease,theswarmsfollowastandardGutenberg-Richterfrequency-magnituderelation,withthemajorETSeventslyingonthetrenddefinedbyinter-ETSswarms.Thisrela-tionshipimpliesthat1)inter-ETSswarmsarefundamentallysimilartothemajorevents,justsmallerandmorefrequent;and2)despite fundamental differences in moment-duration scaling, the tremor magnitude-frequency distribution has the same power lawtrendofnormalearthquakeswithab-valueof1.
figure 1. log of number (n) of tremor swarms exceeding durations given on upper axis can be fit with a straight line indicating that n is proportional to τ ^-0.65 where τ is the duration of a tremor swarm. We assume that the seismic moment is proportional to tremor duration scaled by mo (n-m) = 5.2x10^16 τ (hrs) [aguiar et al., 2009] to equate duration (upper axis) to moment magnitude (lower axis). This allows a standard Gutenburg-Richter style analysis and produces a b-value of 1.0 ( logn = a − bmw ), which is within the range commonly seen for regular earthquakes.
IRIS CoRe PRoPoSal 2010 | Volume I I | ePISoDIC TRemoR anD SlIP, TRIGGeReD eaRTHQuaKeS | I I -85
The Slumgullion Natural LaboratoryJoan Gomberg (US Geological Survey), Paul Bodin (University of Washington), Bill Schulz (US Geological Survey), Jason Kean (US Geological Survey)
Observational advances continue to reveal diversity in the seismic signals associated with fault slip. A particu-larly rich example are episodes of slow fault slip near major plate boundaries that manifest as geodetically observed aseismic deformation abetted by a new family of seismic signals (named ‘episodic tremor and slip’ orETS).Whilethe driving forces and scales differ, there are striking par-allelsbetweensomeobservationsandmodelsofETSandof landslide behaviors. To explore common features andthe underlying processes we are studying the Slumgullion landslide in southwest Colorado, and an ideal natural labo-ratory for observing fault slip and associated phenomena. Unlike crustal- or plate-scale studies significant deforma-tion can be measured within a single field season, because the Slumgullion moves at average rates of up to 2 cm/day.WecompletedafieldexperimentontheSlumgullionto test several hypotheses, particularly that slip along the basal surface and side-bounding faults occurs with com-parable richness of aseismic and seismic modes as crustal- andplate-scaleboundaries. FromAugust 18-26, 2009wemonitoredtheseismicradiationwith88short-periodver-ticalseismometersrecordedon“Texan”seismographsfromthe IRISPASSCALfacility.Theseismographs,with inter-station spacings of 25-50 m, recorded continuously at 250 samples per second. In addition, we recorded deformation on several extensometers that continuously measure slip across one of the two lateral faults bounding the landslide, andtrackeddisplacementsof29sitesonandofftheslidewithanautomatedtotal-stationanddifferentialGPS.Moreobservations came from 2 borehole-mounted piezometers and a meteorological station.
The seismic data contain an abundance of network-wide coherent signals with an amazing variety of characteristics. WeobservedimpulsiveearthquakeswithclearP,S,andsurfacewave phases. There are also “repeaters”, or multiplets of slid-equakes with very similar waveforms. There are episodes of tremor-like radiation coherent across our network. Noteably, a diurnal variation in the slide velocity tracks atmospheric pres-surefluctuations,whichcorrelateswiththeratesofrepeatingharmonic seismic signals. This correlation and our analyses of the wavefield associated with these events leads us to suggest thatthesignalsaretrappedwavesgeneratedata‘stickyspot’within the side-bounding strike-slip fault.
Acknowledgements: This work was funded through the US GeologicalVentureCapitalProgram.
3150 3200Elevation (m)
Seismic & Geodetic Networks{ 50 m
50 m
ContinuousPressure Sensor & Extensometer
WeatherStation
Topographic map of the narrowest and fastest section of the Slumgullion landslide, showing the locations of the seismographs (labeled), weather station, and pressure sensor, all of which recorded continuously. The outer-most lines of seismic stations lie outside the active slide, which is bounded by strike slip faults nearest the seismic stations numbered 03 and 02. R00 is a few meters from the nearest road. ‘Geodetic’ stations correspond to prisms that serve as targets for the robotic total station and 3 extensometers (2 not shown are located above and below the net-works).
0 0.5 1 1.5 2 2.5 3Seconds from 08/26/2009 04:19:23.20
The relatively long duration wave-forms of events in this vigorous sequence, which lasted several tens of minutes, suggest the sources are similar but not identical in location, mechanism, and size.
Waveforms from a single, tiny quake show clear P and S arrivals & suggest an impulsive shear source a few hundred meters from station C03. This quake is part of a sequence containing tens of events within a few minutes.
Example of probable Rayleigh wave packets from similar sources that occurred throughtout the experi-ment.
Tremor
We recorded many signals with the same characteristics as tremor observed in plate-scale systems. Their durations last from several seconds to minutes. Although preliminary examina-tion of envelope functions appears to show promise (e.g. enve-lopes correlate visually at multiple stations), we have yet to quantitatively analyze the tremor signals.
We recorded hundreds of events with waveforms similar to these transient harmonic signals. The largest amplitude signals are shown in orange and are recorded at stations near the side-bounding fault.
Topographic map of the narrowest and fastest section of the Slumgullion landslide, showing the locations of the seismographs (labeled), weather station, and pressure sensor, all of which recorded continuously. The outer-most lines of seismic stations lie outside the active slide, which is bounded by strike slip faults nearest the seismic stations numbered 03 and 02. R00 is a few meters from the nearest road. ‘Geodetic’ stations correspond to prisms that serve as targets for the robotic total station and 3 extensometers (2 not shown are located above and below the networks).
a. The relatively long duration waveforms of events in this vigorous sequence, which lasted several tens of minutes, suggest the sources are similar but not identical in location, mechanism, and size. b. Waveforms from a single, tiny quake show clear P and S arrivals & suggest an impulsive shear source a few hundred meters from station C03. This quake is part of a sequence containing tens of events within a few minutes. C. example of probable Rayleigh wave packets from similar sources that occurred throughtout the experiment. D. Record of many signals with the same characteristics as tremor observed in plate-scale systems. Their durations last from several seconds to minutes. although preliminary examination of envelope functions appears to show promise (e.g. envelopes correlate visually at multiple stations), we have yet to quanti-tatively analyze the tremor signals. e. Record of hundreds of events with waveforms similar to these transient harmonic signals. The largest amplitude signals are shown in orange and are recorded at stations near the side-bounding fault.
a.
D. e.
b. C.
II-86 | IRIS CoRe PRoPoSal 2010 | Volume I I | ePISoDIC TRemoR anD SlIP, TRIGGeReD eaRTHQuaKeS
Distribution and Triggering Threshold of Non-Volcanic Tremor Near Anza, Southern CaliforniaElizabeth S. Cochran (University of California, Riverside), Tien-Huei Wang (University of California, Riverside)
Tostudythedistributionandcharacteristicsofnon-volcanictremorinSouthernCalifornia,weusebroadbanddatacollectedbytheSouthernCaliforniaSeismicNetwork(SCSN)surfacestationsnearAnza,CaliforniaandfivePlateBoundaryObservatory(PBO)boreholestations.Todeterminethestressamplitudeandorientationneededtotriggertremor,weexamined41teleseis-micearthquakeschosenwithepicentraldistancesgreaterthan1900km,fromdiverseazimuthsandMwover7.0from2001to2008.Wefoundthatonlythe2002Mw7.8Denaliearthquake,withthelargestsurfacewaveamplitudesofalloftheteleseismicevents,triggereddetectabletremor.WearecurrentlydeterminingmorepreciselocationsofindividualtremorburstsintheofDenali-triggeredNVTusingatemplate-matchingmethod[Shelly et al., 2009].Thetemplateswillbeusedtopreciselylocatethetremor and to examine the spatial and temporal evolution of triggered tremor. Once the tremor are located, we will determine theprecisestresspertubationcausedbytheDenaliearthquakeatthetremorhypocenter.Wewillthencomparethetriggeringthreshold for tremor to the stress perturbation from teleseisms that trigger local earthquakes on the San Jacinto Fault. From this study we hope to illuminate differences in the response of earthquakes and tremor to stress pertubations.
References
Shelly,D.R.,Ellsworth,W.L.,Ryberg,T.,Haberland,C.,Fuis,G.S.,Murphy,J.,Nadeau,R.M.,andBurgmann,R.(2009),PreciselocationofSan Andreas Fault tremors near Cholame, California using seismometer clusters: Slip on the deep extension of the fault, Geophys. Res. Lett., 36,L01303.
map of seismic stations using the analysis. SCSn stations that detected tremor are shown by red triangles, borehole sta-tions that detected tremor are shown by yellow triangles, and other SCSn stations are shown by blue triangles.
filtered seismogram (top) and envelope functions of all surface stations that recorded the tremor triggered by the Denali surface waves. large amplitude bursts are well-correlated in time. borehole station records are not included in this analysis since most Pbo sta-tions were installed after 2006.
Waveform examples of Denali tremor on station RDm that is triggered by the passing surface waves of the Denali earthquake. The upper panel shows the Denali earthquake recorded on the vertical com-ponent of RDm. The region that is expanded in the lower panels is highlighted in red. The lower panels span 250 sec-onds and show all three com-ponents (vertical, fault paral-lel, and fault perpendicular).The orange curves show the surface waves of the earth-quake in nm/sec and the black curves show the data filtered between 2-8 Hz (amplitude is exaggerated by 20,000).
40
40
0
0
40
40
0
0
40
40
0
0
40
40
0
0
81000 81200 8130081100
40
0
DGR_N
BZN_N
PFO_N
CRY_N
AGA_N
RDM_N
FRD_N
PLM_N
LVA2_N
−150
−100
−50
0
50
100
150
CRY 2-6 Hz filtered
IRIS CoRe PRoPoSal 2010 | Volume I I | ePISoDIC TRemoR anD SlIP, TRIGGeReD eaRTHQuaKeS | I I -87
Intimate Details of Tremor Observed by a Dense Seismic ArrayAbhijit Ghosh (University of Washington), John E. Vidale (University of Washington), Justin R. Sweet (University of Washington), Kenneth C. Creager (University of Washington), Aaron G. Wech (University of Washington), Heidi Houston (University of Washington), Emily E. Brodsky (University of California Santa Cruz)
WeinstalledadensesmallapertureseismicarrayinCascadia,andcapturedtheepisodictremorandslipeventinMay2008.Wedevelopedanewbeam-backprojection(BBP)methodtodetectandlocatenon-volcanictremor[Ghoshetal.,2009].BBPmethod detects up to 4 times more duration of tremor during a weak episode, and gives unprecedented resolution in relative tremorlocation,comparedtoaconventionalenvelopecross-correlationmethod.Wetracktremorminute-by-minuteusingBBPmethod,andmapspatiotemporaltremordistributionoverdifferenttimescales.Overshorttimescale(severalminutes),tremorshowsrapid,continuous,slip-parallelmigrationwithavelocityof~50km/hr[Ghoshetal.,2010a].Overthetimescaleofseveralhours,slip-paralleltremorbandssweepCascadiaalong-strikewithavelocityof~10km/day[Ghoshetal.,2010b].Finally, over the time scale of several days, tremor develops distinct moment patches that overlap with geodetic slip patch on theinterface[Ghoshetal.,2009].Whileheterogeneityontheplateinterfacemaycausetremormomentpatches,along-strikestress transfer can explain slow along-strike marching of tremor bands. These varied and intriguing observations lead toward a unified view of tremor distribution in space and time.
References
Ghosh,A.,J.E.Vidale,J.R.Sweet,K.C.Creager,A.G.Wech,andH.Houston(2010a),Towardaunifiedviewoftremordistributioninspaceand time, Seismol. Res. Lett., 81(2),pp.297(SSAAnnualMeeting2010)
a unified view of tremor distribution in time and space: a time scale (log10) is shown at the top. The maps show different elements of spatiotemporal tremor distri-bution observed over different time scales. Positions of the maps along the time scale approximately correspond to the time scales over which these elements are typically observed. arrow in each map indicates slip direction of CSZ. black solid square marks the big Skidder array. (a) Slip-parallel tremor streak. Colored circles represent tremor locations. Time is color-coded to show rapid tremor migration over short time scale. (b) Slip-parallel tremor bands defining the long-term slower along-strike tremor migration over time-scales of hours to a day. Solid colored circles are tremor locations. blue, pink, and green locations define the tremor bands. faint yellow locations fall outside the tremor bands. (c) Relative band-limited tremor moment patches that release much of the seismic moment during an eTS event.
II-88 | IRIS CoRe PRoPoSal 2010 | Volume I I | ePISoDIC TRemoR anD SlIP, TRIGGeReD eaRTHQuaKeS
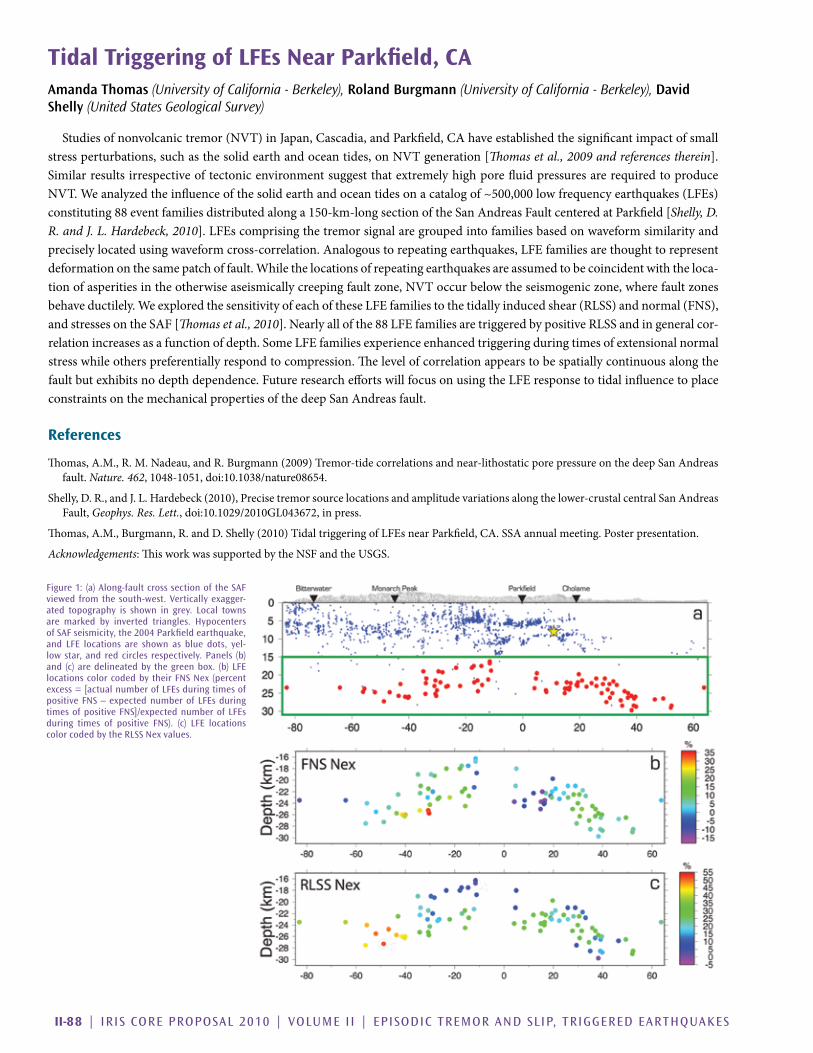
Tidal Triggering of LFEs Near Parkfield, CAAmanda Thomas (University of California - Berkeley), Roland Burgmann (University of California - Berkeley), David Shelly (United States Geological Survey)
Studiesofnonvolcanictremor(NVT)inJapan,Cascadia,andParkfield,CAhaveestablishedthesignificantimpactofsmallstressperturbations,suchasthesolidearthandoceantides,onNVTgeneration[Thomas et al., 2009 and references therein].SimilarresultsirrespectiveoftectonicenvironmentsuggestthatextremelyhighporefluidpressuresarerequiredtoproduceNVT.Weanalyzedtheinfluenceofthesolidearthandoceantidesonacatalogof~500,000lowfrequencyearthquakes(LFEs)constituting88eventfamiliesdistributedalonga150-km-longsectionoftheSanAndreasFaultcenteredatParkfield[Shelly, D. R. and J. L. Hardebeck, 2010].LFEscomprisingthetremorsignalaregroupedintofamiliesbasedonwaveformsimilarityandpreciselylocatedusingwaveformcross-correlation.Analogoustorepeatingearthquakes,LFEfamiliesarethoughttorepresentdeformationonthesamepatchoffault.Whilethelocationsofrepeatingearthquakesareassumedtobecoincidentwiththeloca-tionofasperitiesintheotherwiseaseismicallycreepingfaultzone,NVToccurbelowtheseismogeniczone,wherefaultzonesbehaveductilely.WeexploredthesensitivityofeachoftheseLFEfamiliestothetidallyinducedshear(RLSS)andnormal(FNS),and stresses on the SAF [Thomas et al., 2010].Nearlyallofthe88LFEfamiliesaretriggeredbypositiveRLSSandingeneralcor-relationincreasesasafunctionofdepth.SomeLFEfamiliesexperienceenhancedtriggeringduringtimesofextensionalnormalstress while others preferentially respond to compression. The level of correlation appears to be spatially continuous along the faultbutexhibitsnodepthdependence.FutureresearcheffortswillfocusonusingtheLFEresponsetotidalinfluencetoplaceconstraints on the mechanical properties of the deep San Andreas fault.
Acknowledgements: This work was supported by the NSF and the USGS.
figure 1: (a) along-fault cross section of the Saf viewed from the south-west. Vertically exagger-ated topography is shown in grey. local towns are marked by inverted triangles. Hypocenters of Saf seismicity, the 2004 Parkfield earthquake, and lfe locations are shown as blue dots, yel-low star, and red circles respectively. Panels (b) and (c) are delineated by the green box. (b) lfe locations color coded by their fnS nex (percent excess = [actual number of lfes during times of positive fnS – expected number of lfes during times of positive fnS]/expected number of lfes during times of positive fnS). (c) lfe locations color coded by the RlSS nex values.
IRIS CoRe PRoPoSal 2010 | Volume I I | ePISoDIC TRemoR anD SlIP, TRIGGeReD eaRTHQuaKeS | I I -89
global Search of Triggered Tremor and Low-Frequency EarthquakesZhigang Peng (Georgia Institute of Technology)
Deep “non-volcanic” tremor and episodic slow-slip events are among the most interesting discoveries in earthquake seismol-ogy in the last decade. These events have much longer source durations than regular earthquakes, and are generally located near orbelowtheseismogeniczonewhereregularearthquakesoccur.Tremorandslow-slipeventsappeartobeextremelystresssen-sitive,andcouldbeinstantaneouslytriggeredbydistantearthquakesandsolidearthtides.Wehaveconductedaglobalsearchoftriggeredtremorandlow-frequencyearthquakes(LFEs)associatedwithlargeregionalandteleseismicearthquakes.TheseincludetheParkfield-CholamesectionoftheSanAndreasFault[Gombergetal.,2008;Pengetal.,2009],theCalaverasfaultinnorthern California and the San Jacinto Fault in southern California [Gomberg et al., 2008],andbeneaththeCentralRangeinTaiwan[PengandChao,2008].Inseveralplaces,wefoundthattremorisofteninitiatedbytheLovewaves,andcontinuestobemodulatedduringthesubsequentRayleighwaves.ManyLFEswereidentifiedduringthetriggeredtremorepisode,andtrig-geredLFEssometimesshowedfastmigrationsalongthefaultstrike,similartoambientLFEs/tremorandpossiblyreflectingtrig-geredmicro-slow-slipevents.Long-periodandlarge-amplitudesurfacewavesfrombothregionalandteleseismiceventshaveagreaterpotentialoftriggeringtremor,andinferredtriggeringthresholdisontheorderof~1kPa,suggestingthatthedeepfaultsarecriticallystressed,mostlikelyduetonear-lithostaticfluidpressures.
Peng,Z.,andK.Chao(2008),Non-volcanictremorbeneaththeCentralRangeinTaiwantriggeredbythe2001Mw7.8Kunlunearthquake,Geophys. J. Int. (Fasttrack),825,829.
Peng,Z.,J.E.Vidale,A.Wech,R.M.NadeauandK.C.Creager(2009),RemotetriggeringoftremoralongtheSanAndreasfaultincentralCalifornia, J. Geophys. Res., 114,B00A06.
a comparison of surface waves of large teleseismic earthquakes and triggered tremor beneath (a) Vancouver Island in british Columbia [Rubinstein et al., 2007], (b) the Central Range in Taiwan [Peng and Chao, 2008], (c) the San andreas fault in Central California [Peng et al., 2009], and (d) the subduction zone is Southwest Japan [miyazawa et al., 2008]. The traces have been time-shifted to reflect the relationship between the surface waves and tremor at the source region.
II-90 | IRIS CoRe PRoPoSal 2010 | Volume I I | ePISoDIC TRemoR anD SlIP, TRIGGeReD eaRTHQuaKeS
Cascadia Transition Zone: Tremor as a Fault Strength IndicatorAaron Wech (University of Washington), Ken Creager (University of Washington)
As oceanic lithosphere descends beneath continents in subduction zones worldwide, the contact between the two plates under-goes a transformation in response to a variety of physical parameters that vary with increasing depth. The result of this transfor-mation is a transition in fault coupling from fully locked on the shallow, updip side to stable sliding downdip where the oceanic platedescendsintothemantle.Buthowthistransitionzoneworksisnotentirelyunderstood.Updipoftremor,thefaultyieldsnodisplacement for hundreds of years, constantly accumulating stress before breaking in the form of a megathrust earthquake. On thedowndipside,theplatesarethoughttostablyslidepasteachotherataconstantratewithoutincreasingstress.Byaccumu-latingstressformonthstoyearsbetweendiscreteepisodesofstablemomentrelease,episodictremorandslip(ETS)providesanintermediate mechanism for accommodating plate convergence between the locked and stable sliding end members in relatively young,warmsubductionzones.WeuseautomaticallydetectedtectonictremorasaslowslipindicatorinnorthernCascadiatoobserve updip migration and a depth-dependent transition in slip size and periodicity. Our observations fill in the transition zone spectrumwithacontinuumofslowslipbehaviorthatreflectsthefaultstrength.Thisbehaviorisexplainedbyafractal-likestresstransfer model controlled by friction, which provides a new and intuitive understanding of subduction zone dynamics.
updip tremor migration. (a) Horizontal down-dip tremor distance versus time of northern Washington catalog showing many small swarms downdip and larger swarms initiating deep and migrating updip. (b) migration for the past 4 eTS episodes. blue dots represent tremor epicenters and red squares show median daily downdip dis-tance. (c) example migration of 5 small and large inter-eTS tremor swarms.
Displacement history profiles and transition zone model. (a) Cumulative tremor profiles in each strike-perpendicular bin showing a transition from small, fre-quent slip downdip to larger, less frequent slip updip. (b) Profiles of displace-ment timelines from the locked zone to stable sliding with results from a inserted in the transition zone. (c) Profile schematic showing how the differ-ent regions accommodate plate convergence. our results may predict long-term slow slip updip (purple dashed line), which would shift the downdip limit of the megathrust (blue dashed line) updip. (d) Schematic profile of stress timelines illustrating our stress transfer model. Stable sliding loads the downdip tremor region, which is weakly coupled and slips easily. each slip relieves stress locally and transfers stress updip to a stronger portion of the fault with a higher stress threshold. This is a fractal-like process where the local stress is the integrated effect of downdip slip.
IRIS CoRe PRoPoSal 2010 | Volume I I | ePISoDIC TRemoR anD SlIP, TRIGGeReD eaRTHQuaKeS | I I -91
Slab Morphology in the Cascadia Fore Arc and Its Relation to Episodic Tremor and SlipPascal Audet (University of California Berkeley), Michael Bostock (University of British Columbia), Devin Boyarko (Miami University), Mike Brudzinski (Miami University), Richard Allen (University of California Berkeley)
Episodictremorandslip(ETS)eventsinsubductionzonesoccur in the general vicinity of the plate boundary, downdip of the locked zone. In developing an understanding of the ETSphenomenonitisimportanttorelatethespatialoccur-rence of nonvolcanic tremor to the principal structural ele-ments within the subduction complex. In Cascadia, active and passivesourceseismicdataimageahighlyreflective,dipping,low‐velocityzone(LVZ)beneaththefore‐arccrust;however,its continuity along the margin is not established with cer-tainty, and its interpretation is debated. In this work we have assembled a large teleseismic body wave data set compris-ingstationsfromnorthernCaliforniatonorthernVancouverIsland. Using stacked receiver functions we demonstrate that theLVZiswelldevelopedalongtheentiremarginfromthecoast eastward to the fore‐arc basins (Georgia Strait, PugetSound,andWillametteValley).Combinedwithobservationsand predictions of intraslab seismicity, seismic velocity struc-ture, and tremor hypocenters, our results support the thesis that theLVZrepresents the signatureof subductedoceaniccrust, consistent with thermal‐petrological modeling of sub-duction zone metamorphism. The location of tremor epicen-ters along the revised slab contours indicates their occurrence closetobutseawardofthewedgecorner.Basedonevidenceforhighporefluidpressurewithin theoceanic crust and adowndip transition in permeability of the plate interface, we proposeaconceptualmodelforthegenerationofETSwherethe occurrence and recurrence of propagating slow slip and low‐frequency tremor are explained by episodic pore fluidpressure buildup and fluid release into or across the plateboundary.
Depths contours of the top of the plate interface from receiver functions (this study, solid lines) and a compilation of various studies (dashed lines, mcCrory et al., 2006) along the Cascadia margin. earthquake epicenters from the GSC and uSGS catalogues for m > 2 are shown as green dots; tremor epicenters appear as black dots. broadband stations used in the analysis are displayed as inverted yellow triangles. numbers indicate depth (in km) to each contour. Solid black line with arrowheads indicates the location of the trench offshore.