IFRA-Nigeria working papers series, n°35 28/11/2014 Trends and patterns of fatal road accidents in Nigeria (2006-2014) http://www.ifra-nigeria.org/IMG/pdf/fatal-road-accidents-nigeria.pdf # Vitus N. UKOJI
Transcript
IFRA-Nigeria working papers series, n°35 28/11/2014
Trends and patterns offatal road accidentsin Nigeria(2006-2014)
Trends and patterns of fatal road accidents in Nigeria (2006 – 2014)
Executive summary The incidence of fatal road accidents in Nigeria is
phenomenal. Trend analysis of fatal road accidents between June 2006 and May 2014 using Nigeria Watch database shows that 15,090 lives were lost to fatal road accidents in 3,075 events. The highest fatality occurred in 2013 (2,061 deaths), a 2.8% increase from the 2012 record of 1,652 deaths. However, the probability of a high fatality record in 2014 remains high considering the 964 deaths already recorded between January and May 2014. On the national scene, Lagos recorded the highest number of fatalities (1,579 deaths from 620 events), while FCT (Abuja) has the highest relative number of deaths (0.6 deaths per 100,000 population). These findings are explained by the large population and continuous urbanization of Lagos and by the number of registered vehicles in the FCT (Abuja). On the regional level, a trend analysis shows that more people died in fatal road accidents in the South (8,288 people: 55%) than in the North (6,792 people: 45%). Among other factors, the volume of oil distribution and the occurrence of highway criminal activities explain why there are more fatal road accidents in the South than in the North. Finally, little correlation is found between political violence and accidents, except for the very few occasions when Boko Haram insurgents attacked and killed commuters in Borno State.
∗Vitus Nwankwo Ukoji is an Information Retrieval Specialist at
Nigeria Watch and a Research Fellow at the French Institute for Research in Africa (IFRA-Nigeria). He has an MSc in Peace and Conflict Studies. Any errors remain the sole responsibility of the author. Contact: [email protected]
IFRA-Nigeria epapers series, 2014, n°35
2
INTRODUCTION
The 19th century industrial revolution resulted in some fundamental changes in the transport sector1 and provided more flexibility of movement, speed, and timing. Since then, there has been an upsurge in both human and vehicular motor movement, a situation that has also resulted in more fatal road accidents. The International Road Federation, Geneva Programme Center reported that approximately 2.4 million people have died in road accidents across the world, with a yearly record of 1.3 deaths and daily record of 3,000 deaths.2 The worst hit are middle-income countries, a circumstance confirmed by Mrs. Tawia Addo-Ashong, World Bank Global Road Safety Facility Coordinator, when she said that 1.2 million die yearly from road traffic accidents especially in low- to middle-income countries.3
Most African countries fall within the middle-income category and thus are worst hit by fatal road accidents. A study carried out by Chen show that the fatality rate in African countries ranges from 10-fold to more than 100-fold that in the United States.4 Also, Lagarde reported that Africa has an average rate of 28.3 per 100,000 population road traffic mortality compared with 11 in Europe.5 Sub-Saharan African Transport Policy, in its report, quoted an increase of road fatalities in Africa by 350% between 1990 and 1998.6 One may
1 http://en.wikipedia.org/wiki/Transport 2 International Road Federation Report on the state of accidents in the world. 3 Favour Nnabugwu, 2014, 1.2 m dead in road accidents – World Bank chief, Vanguard June 15. 4 Chen, G. (2010). Road Traffic Safety in African Countries – Status, Trend, Contributing Factors, Counter Measures And Challenges,International Journal of Injury Control and Safety Promotion, 17(4): 247 – 255. 5 Lagarde, Emmanuel (2007), Road Traffic Injury Is an Escalating Burden in Africa and Deserves Proportionate Research Efforts, PLoS Medicine, vol.4, n°6, pp.967-71 6 Ibid.
VITUS NWANKWO UKOJI – TRENDS AND PATTERNS OF FATAL ROAD ACCIDENTS IN NIGERIA (2006-2014)
3
wonder why a less motorized Africa has such a high record of fatal road accidents, surging above an average of 18 deaths per 100,000 population. Most of those affected by fatal car accidents are young people.
Concerns about the rising incidence of fatal road
accidents compelled stakeholders, including the United Nations (UN) Assembly, into seeking means to curb road fatalities. On 11 May 2011, the UN adopted the period 2011–2020 as the UN Decade of Action for Road Safety, within which all efforts will concentrate on stabilizing and then reducing global road traffic fatalities by 2020. According to the UN Secretary General, Ban Ki-Moon, lives will be saved through this decade of action.7 Following the declaration by the UN in 2011, the Federal Road Safety Commission (FRSC) in Nigeria set out to adopt and domesticate the UN action plan by developing a number of programmes suitable for every road user in the country.
Despite integrated efforts towards reducing fatal
road accidents, Nigeria still remains one of the worst hit countries. With a human population of about 167 million, a high level of vehicular population estimated at over 7.6 million, a total road length of about 194,000 kilometres (comprising 34,120 km of federal, 30,500 km of state, and 129,580 km of local roads),8 the country has suffered severe losses to fatal car accidents. Its population density varies in rural and urban areas at about 51.7% and 48.3% respectively and translates to a population–road ratio of 860 persons per square kilometre, indicating intense traffic pressure on the available road network.9 Undoubtedly, this immense pressure contributes to the high road traffic accidents in the country (FRSC 2012).
7 A speech at the launch of the event, UN Secretary General by Ban Ki-Moon on May 11, 2011 during the United Nations Assembly. 8 Sumaila, AbdulGaniyu Femi, 2013. Road crashes trends and safety management in Nigeria, Department of Transport Management Technology, Federal University of Technology, Minna 9 Ibid.
IFRA-Nigeria epapers series, 2014, n°35
4 Nigeria is ranked second-highest in the rate of
road accidents among 193 countries of the world.10 Oladepo and Brieger (1986) argued that three-quarters of all accidents on Nigerian roads involve fatalities.11 Aside from the Boko Haram crisis, accidents are currently by far the main cause of violent death in Nigeria.12 The WHO adjudged Nigeria the most dangerous country in Africa with 33.7 deaths per 100,000 population every year.13 According to their report, one in every four road accident deaths in Africa occurs in Nigeria. The WHO survey and the FRSC report of 5,693 fatal road accidents in 200914 leave no doubt about the dangerous situation on Nigerian roads.
The causes of fatal car accidents in Nigeria have
been categorised into human, mechanical, and environmental factors. According to Umar, the human factor accounts for up to 90% of accidents, while the mechanical and environmental factors contribute to the other 10%.15 Human factors include visual acuteness, driver fatigue, poor knowledge of road signs and regulations, illiteracy, health problems, excessive speeding, drug abuse, and over-confidence while at the steering wheel. Among the mechanical factors that lead to fatal car accidents are poor vehicle maintenance, tyre blowouts, poor lights, un-roadworthy vehicles, and broken-down vehicles on the road without adequate warning. The environmental factors are include heavy 10 Agbonkhese, O, Yisa, G.L, Agbonkhese, E.G, Akanbi, D.O, Aka, E.O, Mondigha, E.B (2013), Road Traffic Accidents in Nigeria: Causes and Preventive Measures. Civil and Environmental Research, ISSN 2224-5790 (Paper) ISSN 2225-0514 (Online), Vol.3, No.13. 11 Oladepo, O. Brieger, R. (2006). Road Traffic Accidents: Applying the Brake to a Killing Tree. 12 Nigeria Watch Fourth Report on Violence in Nigeria (2006–2014) by Prof. Marc-Antoine Pérouse de Montclos Institut français de géopolitique, Université Paris 8 Associate Fellow, Africa Programme, Chatham House PRIO Global Fellow (Peace Research Institute in Oslo) 13 WHO 2013 report on Accidents in Africa 14 FRSC (2009). Traffic Digest, A Transport Digest Publication of PRS Department 15 Ibid.
VITUS NWANKWO UKOJI – TRENDS AND PATTERNS OF FATAL ROAD ACCIDENTS IN NIGERIA (2006-2014)
5
rainfall, Harmattan winds, sun reflection, heavy wind, pot holes, and un-tarred roads. These factors have independently and/or collectively contributed to the high rate of fatal road accidents in Nigeria.
The repercussions of such accidents have been
colossal. Despite the happiness and change of quality of family lives associated with owning a vehicle, its possession has left many families bereft of their breadwinners or loved ones.16 According to Adekunle, the socio-economic costs of RTA in Nigeria are immense, and the direct cost of traffic casualties can perhaps be understood best in terms of the labour lost to the nation’s economy.17 This was further developed by Pratte, who argued that persons injured in accidents on Nigerian highways and streets no longer participate in the economic mainstream, and this amounts to a loss of labour of millions of person’s years to the nation.18
In February 1988, the Federal Government
established the FRSC through Decree No. 45 of 1988, to reduce road mishaps. This was later amended by Decree 35 of 1992 and is referred to in the statute books as the FRSC ACT cap 141, Laws of the Federation of Nigeria (Nigerian Constitution 1999).19 To achieve its objective, the commission compiles comprehensive data on traffic road accidents, including injuries and deaths—unlike Nigeria Watch database,20 which deals only with violent
16 Dr. Murtala Muhammad Umar, Road Transport Accidents: Causes, Effects and Prevention, General Hospital Zurmi, Zamfara State 17 Adekunle JA (2010). Road Traffic accident deaths and socio-economic development in Nigeria. Int. Rev. Bus. Soc. Sci. 1(5):47-60. 18 Pratte, D. (1998) “Road to Ruin: Road Traffic Accident in the Developing World”, NEXUS, Vol. 13, 1998, pp. 46 – 62 19 Agbeboh G. U. and Osabuohien-Irabor Osarumwense, 2013. Empirical analysis of road traffic accidents: A case study of Kogi State, North-Central Nigeria, Department of Mathematics, Ambrose Alli University, Ekpoma, Nigeria. 20 Nigeria Watch is a database and research project that monitors lethal violence, conflicts, and human security in Nigeria. It aims to set up a GIS (Geographic Information System) to localise dangerous spots and to assess the rise, decline or stabilisation of violence in the
IFRA-Nigeria epapers series, 2014, n°35
6 deaths, including accidents. It is therefore imperative to draw conclusions after a comparative analysis of data from the FRSC and Nigeria Watch.
CONTEXT OF ROAD ACCIDENTS IN NIGERIA Different circumstances precipitate fatal car
accidents in Nigeria. Understanding these contexts (political and socio-economic) gives one a better understanding of why road accident has remained a leading cause of death in the country.
Political contexts Fatal road accidents in Nigeria may not be directly
attributed to politics. However, party activities, governance, budgetary allocations, contract evaluation, and so on have a direct impact on the rate at which accidents occur. The attempts of government ministries and parastatals to reduce the number of accidents have usually been frustrated by poor funding. The Federal Ministry of Works and the FRSC suffer from apparent severe budgetary constraints, leading to insufficient human and material resources and untimely acquisition of safety equipment. Furthermore, bureaucratic logjam and politicization of contract awards are marred with irregularities and inflated costs. This leads to situations where road contracts are not properly executed.
Government functionaries and party leaders have
been identified as protagonists in fatal road accidents in Nigeria. The indiscriminate use of sirens, coupled with very high speed rates, by political public office holders, including governors and their convoys, has caused several
country. Collated data is used to provide statistics, draw maps and analyse trends and it relies on a thorough reading of reports from at least 10 Nigerian press corporations as well as human rights organisations.
VITUS NWANKWO UKOJI – TRENDS AND PATTERNS OF FATAL ROAD ACCIDENTS IN NIGERIA (2006-2014)
7
road traffic accidents in Nigeria.21 A renowned Nigerian academician, Professor Iyayi, died in an accident that involved the convoy of Kogi State Governor Captain Idris Wada, who back on 28 December 2012 was involved in another fatal accident along the Lokoja–Ajaokuta Road, which killed his ADC, ASP Idris Mohammed. Similarly, the convoy of Governor Oshiomole of Edo State was involved in a gruesome auto accident, leading to the death of three reporters, while returning from a party function in April 2012 where some members of the People’s Democratic Party (PDP) were being received into the defunct Action Congress of Nigeria (ACN). In the same year, three political aides of Governor Al-Makura of Nasarawa State were killed in a multiple auto crash involving the governor’s convoy along the Gadabuke–Keffi Road in the state. Governor Abdul Aziz Yari was involved in a fatal car accident in 2012 that claimed the life of a police officer attached to his team. In Katsina in 2011, the ADC to State Governor Ibrahim Shema and four others died in a road accident that involved the governor’s convoy, just 48 hours after two people died when their vehicle had an accident while travelling in the convoy of Niger State Governor Babangida Aliyu for a campaign rally. The list is likely to be added to if nothing is done to manage convoys’ recklessness and careless driving.
Economic contexts The rapid development of comprehensive road
transportation is crucial to the economy of every nation. Opportunities to acquire and sell a variety of commodities necessary for industrial and manufacturing systems are expanded by a well-coordinated transport system. Oni (2004) argued that transport is a key element in the social and economic development of any nation. The restrictive nature of the waterways, the pitiful condition of the rail system, and the inability of an average Nigerian to afford
21 Op. cit.
IFRA-Nigeria epapers series, 2014, n°35
8 the high cost of air travel makes road transportation preferable in Nigeria. In 2006, 644,387 vehicles, including government motor cars and motor cycles, private motor cars and motor cycles, and commercial motor cars and motor cycles, were registered nationwide. The number fell in 2007 to 612, 867 but increased in 2008 to 746,814 and to 777,835 in 2009. In 2010, 712,938 vehicles were registered.22 Over 70% of the total movements of the registered vehicles in the country and about 80% of the freight movements take place on the road.23 The over-dependence on road transportation worsens the condition of roads, involves huge pressure on motorists, and causes many fatal road accidents.
The discovery of oil in Nigeria opened new
frontiers of economic engagement. Statistics from the National Bureau for Statistics (NBS) (2010) show that the crude petroleum sub-sector accounts for over 80% of Nigeria’s foreign exchange. The distribution of refined products across the country has been a thorn in the side of many Nigerians. In 2011, the FRSC reported that Nigeria has an average of approximately 5,000 tankers involved in wet cargo haulage, moving about 150 million litres of fuel, and 2,500 “trailers” in dry cargo plying Nigeria’s roads daily.24 Kayode also revealed that between 2007 and June 2010, a total of 4,017 tanker/trailer crashes were recorded on Nigerian roads, with a yearly average of 1,148 crashes, monthly average of 96 crashes, and a total of 4,076 persons killed in such crashes involving tankers and trailers.25 Due to the highly inflammable nature of premium motor spirit (PMS), fatal accidents involving petrol tankers have always been lethal.
22 National Bureau Of Statistics (2009), Annual Abstract Of Statistics. 23 FRSC (2011). Traffic Digestion 24 Op. cit. 25 Kayode Olagunju (Ph.D) 19th October, 2010. Corps Commander Corps Transport Standardization Officer, Federal Road Safety Corps, National Headquarters, Pmb 125, Abuja, Nigeria.
VITUS NWANKWO UKOJI – TRENDS AND PATTERNS OF FATAL ROAD ACCIDENTS IN NIGERIA (2006-2014)
9
Aside from the carnage of fire explosions involving petrol tankers, articulated vehicles have also significantly contributed to fatal road accidents in Nigeria. Trucks and trailers transport agricultural goods and industrial equipment to various locations by road. According to statistics from the National Bureau for Statistics (2010), over 60% of the Nigerian population are engaged in agriculture.26 In 2006, about 99,030 metric tons of major agricultural crops in Nigeria were produced. The number fell in 2007 to 97,183 and in 2008 to 95,097, then increased again in 2009 to 96,050 and to 115,424 metric tons in 2010.27 Transporting these products in trucks via roads plagued with potholes and congestion has caused several fatal road accidents.
In pursuit of extra profit, commercial vehicle
owners task their drivers to generate more profit, a situation that leads to careless driving and exhaustion. According to Olusiyi, most commercial drivers are paid daily wages of N1,000–2,500, depending on the city and the type of vehicle, which drivers consider meagre. After daily or weekly accounting, such drivers are left with low incomes, which cannot adequately sustain them and their families.28 Under such circumstances, cars are not properly maintained. The risk of being injured, according to Agbonkhese et al., increases exponentially with speed, and the severity of accidents depends on the transfer of kinetic energy at impact.29 In an attempt to increase their productivity and therefore remuneration, drivers tend to drive as fast as possible in their poorly maintained vehicles. The result is more accidents and more fatal accidents.
26 National bureau for Statistics (2010) 27 Ibid. 28 Olusiyi Ipingbemi, from the department of Urban and Regional planning, Faculty of the Social Science, University of Ibadan. The wrote on the Socio-Economic Characteristics and Driving Behavabiour of Commercial Drivers in Southwestern Nigerian Cities. 29 Op. cit
IFRA-Nigeria epapers series, 2014, n°35
10 Social contexts Poverty remains circumstantial in the occurrence
of fatal road accidents in Nigeria and may not be directly linked to it. Poor housing conditions, social isolation, overloading of passengers in slum areas, insecurity in public places, and several other variables explain why the risk of fatal road accidents remains high among low-income earners in Nigeria. Their living conditions are in sharp contrast with those of their richer citizens, who reside in metropolitan areas with overhead bridges, secured playgrounds, and greater traffic control and safety measures. Christie argued that a link between social deprivation and the high accident rate may be explained in terms of increased exposure to hazardous environments.30 This assumption was expanded by Abdalla, who argued that the casualty rates amongst residents from areas classified as relatively deprived are significantly higher than those from relatively affluent areas.31 Schools located within slum areas lack overhead bridges, and pupils and pedestrians are left at the mercy of careless drivers. Instances were seen in Anambra and Lagos, where school children were crushed to death while trying to cross an expressway. Where parents cannot afford the huge fees paid by the high-income earners, they have to send their children to slum schools, where they are exposed to fatal road accidents.
Population density is another social factor that
influences the frequency of fatal road accidents in large cities. Slum areas are mostly congested with peoples and vehicles. Lack of space is worsened by the dumping of car wrecks along the roads. When drivers scramble for space, they often cause fatal road accidents when they 30 Christie, N., (1995b) Social, economic and environmental factors in child pedestrian accidents: A research review. Transport Research Laboratory, Project Report 116. 31 Abdalla, I.M., (1997) Statistical investigation and modelling of the relationships between road accidents and social characteristics. PhD. Thesis, Napier University.
VITUS NWANKWO UKOJI – TRENDS AND PATTERNS OF FATAL ROAD ACCIDENTS IN NIGERIA (2006-2014)
11
manoeuvre around other road users. Safety measures are ignored and people are killed. The cities of Lagos, Kano, Rivers, and Ibadan frequently experience fatal road accident owing to the number of inhabitants and socio-economic activities.
Personal relationships, family issues, and financial
problems are elements that increase the frequency of fatal road accidents. A driver’s capacity to attend to hazards is essentially defined by his state of mind. Phone conversation while driving, social interaction, and peer influence undermine drivers’ sense of judgment and the speed of their responses. These in-vehicle distractions increase the likelihood of entirely missing critical events such as changes in traffic lights.32 Furthermore, drivers who are in the grip of negative emotions and stress arising from factors in their social backgrounds exhibit a high level of distraction, experience impaired observation skills, and fail to read road signs. Such distractions frequently lead to fatal road accidents.
COMPARING FRSC DATA ON FATAL ROAD ACCIDENTS WITH NIGERIA WATCH DATA
The FRSC, as mentioned earlier, was established
in 1988 as a result of the continuous increase in the number of fatal road accidents in Nigeria. They have the aim of reducing road traffic crashes and creating a safe motoring environment in Nigeria.33 To achieve these objectives, the commission relies on research. It has built a strong database on road crashes with a view to putting findings to use to achieving safer roads. Using Information and Communication Technology (ICT) for effective surveillance to capture and monitor data has
32 Hancock, P.A., Lesch, M., Simmons, L. (2003). The distraction effects of phone use during a crucial driving maneuver. Accident Analysis and Prevention (35) 501-514 33 FRSC (2007). An article on FRSC Establishment Act. www.Frsc.gov.ng Dec 15, 2007
IFRA-Nigeria epapers series, 2014, n°35
12 been transformed into evidence-based facts to address road problems. The commission regularly publishes briefs in its Road Mirror.
Nigeria Watch, an online database on violent
deaths (including accidents), has performed a similar task to the FRSC since the former’s establishment in June 2006. Unlike FRSC’s operation of a more advanced database on both fatal and non-fatal road accidents, however, Nigeria Watch focuses only on accidents that involve at least one death.34 Between 2006 and 2013, the FRSC recorded 41,118 deaths from road accidents (i.e. 74% of accidents resulted in fatalities), while Nigeria Watch recorded 14,300 (26%). Despite these differences and a more restricted data set, Nigeria Watch helps to monitor the trends and patterns of reported fatal road accidents because it gives more details than the official statistics of the FRSC on each accident recorded.
Figure 1 - FSRC and Nigeria Watch records of fatalities caused by road accidents (2007–2013)
34 Nigeria Watch is a database and research project that monitors lethal violence, conflicts, and human security in Nigeria. It aims to set up a GIS (Geographic Information System) to localize dangerous spots and to assess the rise, decline or stabilization of violence in the country. Collated data is used to provide statistics, draw maps and analyze trends and it relies on a thorough reading of reports from at least 10 Nigerian press corporations as well as human rights organizations.
VITUS NWANKWO UKOJI – TRENDS AND PATTERNS OF FATAL ROAD ACCIDENTS IN NIGERIA (2006-2014)
13
METHODS AND MATERIALS Nigeria Watch data focus on reported accident
cases involving at least one death between June 2006 and May 2014 in ten Nigerian daily newspapers. Data exclude non-fatal injuries. Road accidents come under a broad category of accidents involving cars, buses, tankers, lorry/trailers, bicycles, tricycles, and trains. Extracting data that relates to the above-mentioned categories requires an event by-event analysis. General causes of violent deaths within the period under review were analyzed in order to identify the most deadly violent event. To establish the pattern trends of fatal road accidents, secondary data was collated from the FRSC and compared with Nigeria Watch data. Fatal road accidents are grouped by year, region, state, city, severity index, and most dangerous route. The essence of categorizing the data extraction is to establish the trends and patterns of fatal road accidents nationwide. Also, the relative number of deaths was calculated in order to know the probability of someone dying from road accident per 100,000 population. The severity index was calculated by comparing the number of people killed with the number of fatal crashes. Search results were generated from Nigeria Watch database and exported to Excel for classification. Results are presented in bar charts and frequency distribution tables.
Methodological challenges Despite the consistency in news reportage in
Nigeria, there is a probability that some fatal car accidents, especially those that occurred in rural villages, are not reported. This challenge calls into question the validity of the records of fatal road accidents when compared with FRSC data, which usually have triple the numbers found in the Nigeria Watch data on fatal road accidents.
IFRA-Nigeria epapers series, 2014, n°35
14
CAUSES OF VIOLENT DEATHS IN NIGERIA Many Nigerians have lost their lives in various
violent events. Such events cut across different regions and ethnic identities. Figure 2 below shows the main causes of violent deaths between June 2006 and May 2014.
Figure 2 - Causes of violent deaths in Nigeria, cumulated figures (June 2006–May 2014)
Approximately 61,090 people lost their lives in
14,087 events nationwide during the period under review. In order of public importance, accidents of various types, including road accidents, recorded the highest number of deaths in total, followed by crime, political violence, ethno-religious matters, and economic issues. Apart from the Boko Haram crisis in the North-East, accident is thus the main cause of violent deaths in Nigeria. About 15,090 lives were lost to fatal road accidents involving cars, buses, tankers, and others articulated vehicles in 3,075 events between June 2006 and May 2014. Data from Nigeria Watch show that Lagos State recorded the highest number, with 1,543 car accident deaths, followed by Edo with 1,201 deaths and FCT (Abuja) with 1,026 deaths.
VITUS NWANKWO UKOJI – TRENDS AND PATTERNS OF FATAL ROAD ACCIDENTS IN NIGERIA (2006-2014)
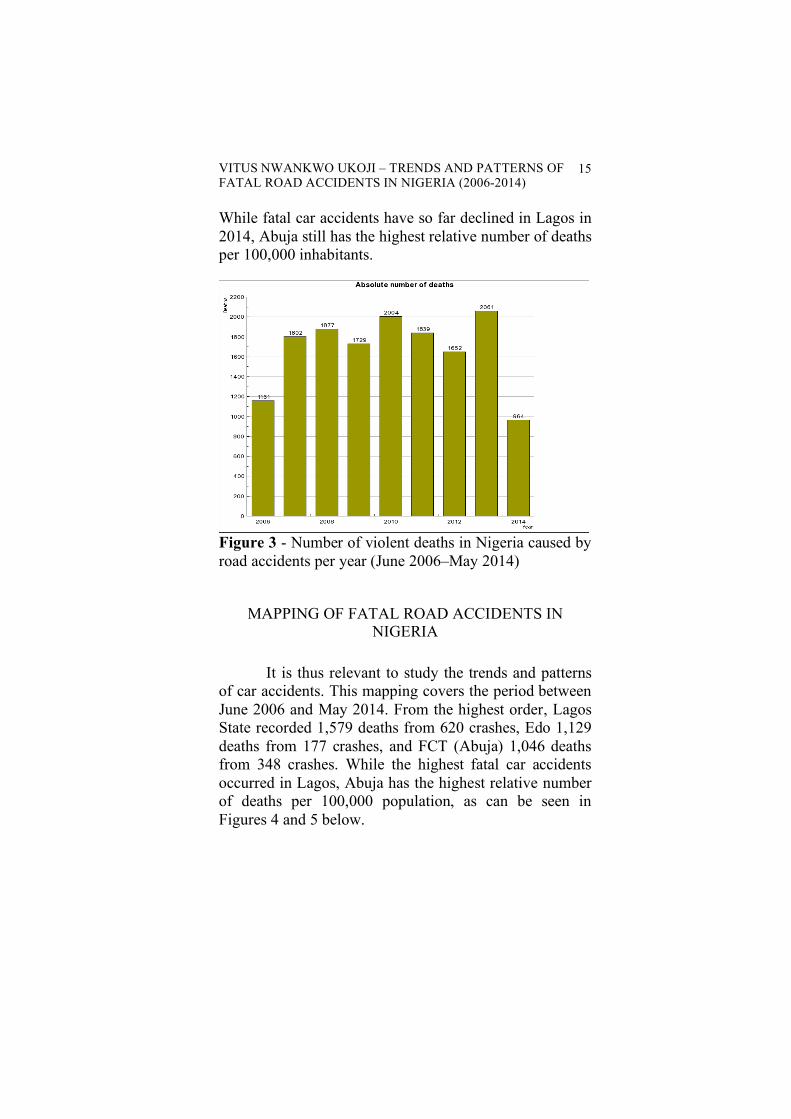
15
While fatal car accidents have so far declined in Lagos in 2014, Abuja still has the highest relative number of deaths per 100,000 inhabitants.
Figure 3 - Number of violent deaths in Nigeria caused by road accidents per year (June 2006–May 2014)
MAPPING OF FATAL ROAD ACCIDENTS IN NIGERIA
It is thus relevant to study the trends and patterns
of car accidents. This mapping covers the period between June 2006 and May 2014. From the highest order, Lagos State recorded 1,579 deaths from 620 crashes, Edo 1,129 deaths from 177 crashes, and FCT (Abuja) 1,046 deaths from 348 crashes. While the highest fatal car accidents occurred in Lagos, Abuja has the highest relative number of deaths per 100,000 population, as can be seen in Figures 4 and 5 below.
IFRA-Nigeria epapers series, 2014, n°35
16
Figure 4 - Number of violent deaths caused by road accidents in Nigeria (June 2006–May 2014)
Figure 5 - Rates of violent deaths caused by road accidents in Nigeria (June 2006–May 2014)
VITUS NWANKWO UKOJI – TRENDS AND PATTERNS OF FATAL ROAD ACCIDENTS IN NIGERIA (2006-2014)
17
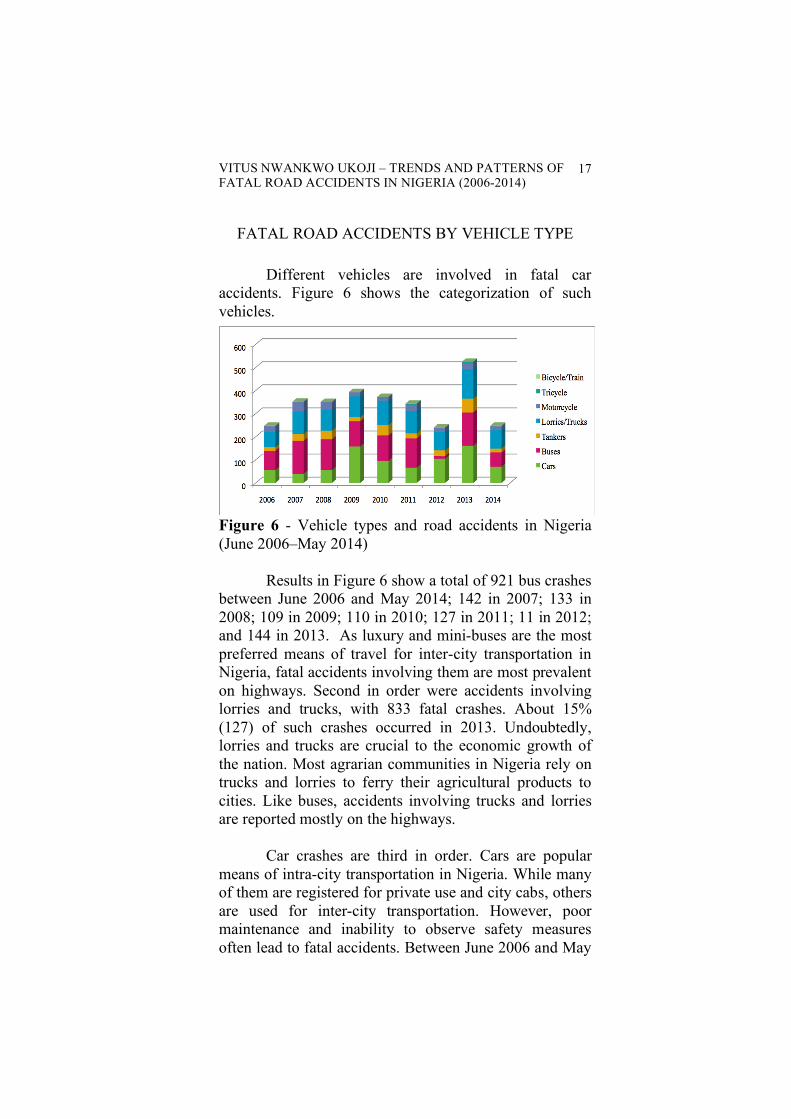
FATAL ROAD ACCIDENTS BY VEHICLE TYPE Different vehicles are involved in fatal car
accidents. Figure 6 shows the categorization of such vehicles.
Figure 6 - Vehicle types and road accidents in Nigeria (June 2006–May 2014)
Results in Figure 6 show a total of 921 bus crashes
between June 2006 and May 2014; 142 in 2007; 133 in 2008; 109 in 2009; 110 in 2010; 127 in 2011; 11 in 2012; and 144 in 2013. As luxury and mini-buses are the most preferred means of travel for inter-city transportation in Nigeria, fatal accidents involving them are most prevalent on highways. Second in order were accidents involving lorries and trucks, with 833 fatal crashes. About 15% (127) of such crashes occurred in 2013. Undoubtedly, lorries and trucks are crucial to the economic growth of the nation. Most agrarian communities in Nigeria rely on trucks and lorries to ferry their agricultural products to cities. Like buses, accidents involving trucks and lorries are reported mostly on the highways.
Car crashes are third in order. Cars are popular
means of intra-city transportation in Nigeria. While many of them are registered for private use and city cabs, others are used for inter-city transportation. However, poor maintenance and inability to observe safety measures often lead to fatal accidents. Between June 2006 and May
IFRA-Nigeria epapers series, 2014, n°35
18 2014, there were 808 incidents of fatal car accidents. Accidents involving cars are reported mostly in metropolitan areas.
Results in Figure 6 also reveal that 270 fatal
crashes involving tankers occurred between June 2006 and May 2014: 16 in 2006; 30 in 2007; 37 in 2008; 18 in 2009; 45 in 2010; 22 in 2011; 25 in 2012; and 60 in 2013. As at May 2014, 17 crashes had so far been recorded for 2014. Though the rate of tanker crashes may seem low, the impact is usually severe. Most victims are killed by fire outbreaks and explosions. Most crashes involving tankers occur on highways and roads close to farm tanks and depots.
Aside from tanker crashes, commercial
motorcycles (popularly called okada) accidents were frequent in states that still permitted their operation. There were 216 motorcycle crashes reported between June 2006 and May 2014: 25 occurred in 2006; 41 in 2007; 32 in 2008; 18 in 2009; 14 in 2010; 27 in 2011; 17 in 2012; and 25 in 2013. Most motorcycle accidents occur in slum areas with less access to good roads and affordable cars. The severity index of motorcycle accidents is often high due to poor safety measures by riders and passengers.
SEVERITY INDEX OF FATAL ROAD ACCIDENTS IN NIGERIA (JUNE 2006 – MAY 2014)
The intensity of fatal road accidents varies from
state to state. After comparing the number of people killed with the number of fatal crashes, states are ranked by a low, medium, or high severity index.35
35 Severity Index = Number of people killed / Number of fatal crashes
VITUS NWANKWO UKOJI – TRENDS AND PATTERNS OF FATAL ROAD ACCIDENTS IN NIGERIA (2006-2014)
Figure 7 - Severity index of fatal road accidents per state (June 2006–May 2014)
Ebonyi and Lagos states ranked low (0.00 –
2.99%) in the severity index of fatal road accidents that occurred between June 2006 and May 2014. Ebonyi had a severity index of 2.4 from 51 deaths in 21 crashes, while Lagos had a low severity index of 2.5 from 1,590 deaths in 620 crashes. States that are ranked medium (3.00 – 5.99%) include FCT (Abuja), Ekiti, Delta, Akwa Ibom, Plateau, Bauchi, Bayelsa, Kwara, Osun, Cross River, Taraba, Ogun, Abia, Nasarawa, Oyo, Anambra, and Sokoto. Those ranked with a high index (6.00 – 8.99%) are Imo, Jigawa, Benue, Niger, Edo, Gombe, Borno, Ondo, Enugu, Kano, Kaduna, Rivers, Zamfara, Kogi, Katsina, Kebbi, Adamawa, and Yobe. Highest in this category is Yobe State, with a severity index of 11.4.
IFRA-Nigeria epapers series, 2014, n°35
20
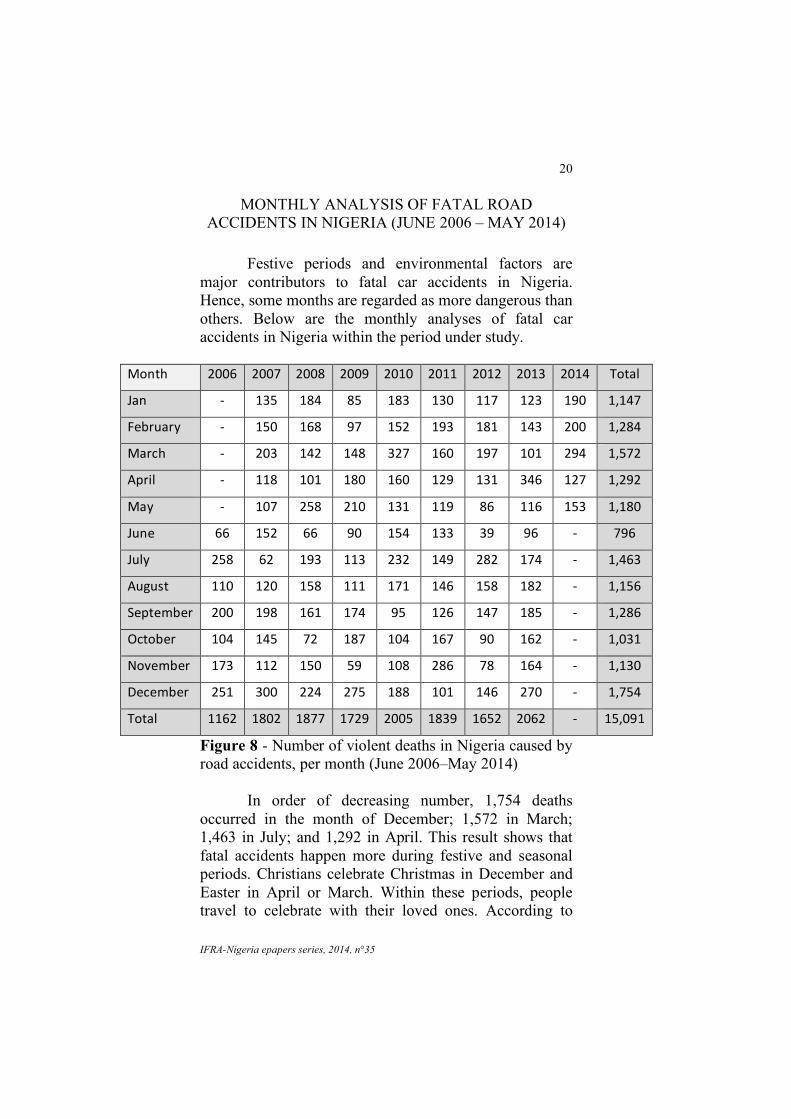
MONTHLY ANALYSIS OF FATAL ROAD ACCIDENTS IN NIGERIA (JUNE 2006 – MAY 2014)
Festive periods and environmental factors are
major contributors to fatal car accidents in Nigeria. Hence, some months are regarded as more dangerous than others. Below are the monthly analyses of fatal car accidents in Nigeria within the period under study.
Figure 8 - Number of violent deaths in Nigeria caused by road accidents, per month (June 2006–May 2014)
In order of decreasing number, 1,754 deaths
occurred in the month of December; 1,572 in March; 1,463 in July; and 1,292 in April. This result shows that fatal accidents happen more during festive and seasonal periods. Christians celebrate Christmas in December and Easter in April or March. Within these periods, people travel to celebrate with their loved ones. According to
VITUS NWANKWO UKOJI – TRENDS AND PATTERNS OF FATAL ROAD ACCIDENTS IN NIGERIA (2006-2014)
21
Tumes Sylvanus Dalop, accidents and deaths are higher during these “EMBER” months because of the various festivities lined up during this period, which involve much more travelling than usual.36 It is a period when commercial drivers make more money through overloading and excessive speeding, among other factors. Similar conditions apply to the Easter period. On 3 April 2013, for instance, 70 people died after a double-decker bus, a haulage truck, and a petrol tanker collided along the Benin–Ore Expressway. The tanker exploded and killed most people on board the bus.37 Two days later, a multiple accident involving a Dangote cement-laden trailer, a tanker, and a luxury bus led to the death of 60 persons in Edo. The bus lost control and rammed into the trailer and the trailer into the tanker. The victims were burnt beyond recognition. About 10 motorcycles and 15 shops were destroyed by the fire.38 On the same day in Anambra, another multiple accident involving a trailer, two minibuses belonging to the Rivers State Transport Company (RSTC), and two other vehicles claimed 25 lives.39 Within a space of two days, 155 lives were lost on the road.
December recorded the second-highest number of
deaths in 2013 with 270 deaths in 76 incidents. The period is marked with various economic activities, including transportation of cattle from the North to the South. Approximately nine persons died in an auto crash that involved two articulated vehicles carrying some passengers and cows.40 The traffic pressure on the road during the seasonal period increases fatal car accidents. 36 Vanguard 2012 interview with the past Sector Commander of the FRSC, Mr. Tumes Sylvanus Dalop on Ember months of road traffic accidents 37http://www.nigeriawatch.org/index.php?urlaction=evtView&id_evt=11317&rang=1 38http://www.nigeriawatch.org/index.php?urlaction=evtView&id_evt=11124&rang=2 39http://www.nigeriawatch.org/index.php?urlaction=evtView&id_evt=12573&rang=3 40http://www.nigeriawatch.org/index.php?urlaction=evtView&id_evt=12859&rang=2
IFRA-Nigeria epapers series, 2014, n°35
22 Evading bad portions of the road may lead to fatal car accidents nationwide. In Sokoto, ten people died in an auto crash involving two J5 buses. One of the vehicles had attempted to dodge potholes and suddenly lost control.41 Another incident happened along the Lagos–Ibadan Expressway, where a multiple accident claimed 23 lives.42 The crash occurred when a tanker loaded with petrol lost control and rammed into trailers parked by the roadside, igniting an inferno that burnt other vehicles trapped in the gridlock.
A total of 1,463 persons died in fatal road
accidents in the month of July between June 2006 and May 2014. July is the peak of the rainy season, when road markings are less visible, bridges collapse, trees fall, and rivers flood.43 On 4 October 2013, for instance, four finance clerks of a Local Government Area were killed in an auto crash while they were returning from the headquarters of the council during a heavy downpour.44 Fourteen members of an emirate palace guard in Wadugur Village, Ringim LGA, Jigawa died when a petrol tanker and a coaster bus collided as a result of heavy rain that obstructed their sight.45 Along the Lagos–Ibadan Expressway, five people lost their lives after two tankers rammed into each other in heavy rain and exploded.46 In Lagos, a Nissan Sony car plunged into a canal during a heavy downpour that lasted for over four hours, killing one person and injuring three others.47
VITUS NWANKWO UKOJI – TRENDS AND PATTERNS OF FATAL ROAD ACCIDENTS IN NIGERIA (2006-2014)
23
DAILY ANALYSIS OF FATAL ROAD ACCIDENTS IN NIGERIA (JUNE 2006 – MAY 2014)
Figure 9 - Fatal road accidents by days of the week (June 2006–May 2014)
Figure 9 shows that 2,468 people died in 481
crashes on Mondays from June 2006 to May 2014. This was followed by Sundays, with 2,425 deaths in 477 fatal road accidents, and Saturdays, with 2,269 deaths in 465 crashes. This result confirms the assumption that more accidents happen during weekends rather than on weekdays. Weekends are marked by several religious and social activities that lead to huge pressure on the roads and often lead to fatal accidents. Party activities, night clubbing, and other social events occur mostly during weekends. With limited driving experience, most youths engage in drunk driving, a situation that frequently leads to fatal road accidents. Smat et al. noted that limited driving experience, night-time driving, and fatigue are
IFRA-Nigeria epapers series, 2014, n°35
24 particular risks for young men.48 Using data from the University of Port Harcourt, Eke et al. found that 70% of fatal accidents in Port Harcourt occur during the weekends.49 This finding corroborates an FRSC report on road accidents which states that 16% of road accidents between 2007 and 2010 occurred on Sundays; 15% on Saturdays; 14% on Thursdays; 13% on Wednesdays; 14% on Tuesdays; and 13% on Mondays.50 People who travel back on Sundays to resume official duties on Mondays increase traffic volume and fatal road accidents. As for commercial drivers, they often try to recoup weekend expenses when they overload passengers and over-speed to complete more trips.
48 Smart D, Vassallo S, Sanson A, Cockfield S, Harris A, Harrison W, McIntyre A. In The Driver’s Seat: Understanding Young Adults’ Driving Behaviour. Melbourne: Australian Institute of Family Studies; 2005. 49 Eke, N., E.N. Etebu and S.O. Nwosu, 2000. Road Traffic Accident Mortalities In Port Harcourt, Nigeria. Anil Aggrawals Internet J. Forensic Med. Toxicol. Vol 1(2). 50 FRSC report on Road Traffic Crashes (Rtc) Involving Buses On Nigerian Roads (2007 – 2010)
VITUS NWANKWO UKOJI – TRENDS AND PATTERNS OF FATAL ROAD ACCIDENTS IN NIGERIA (2006-2014)
25
STATE ANALYSIS OF FATAL ROAD ACCIDENTS IN NIGERIA (JUNE 2006 – MAY 2014)
Fatal car accident is a national calamity though the
frequency and intensity varies from state to state. This section analyzes the trends and patterns of fatal car accidents per state.
Figure 10 - Number of violent deaths in Nigeria caused by road accidents per state (June 2006–May 2014)
Data collected by Nigeria Watch shows that Lagos
has the highest number of fatalities on the national level with 1,579, followed by Edo with 1,129 deaths, and by FCT (Abuja) with 1,046 deaths. On the other hand, Ebonyi (51 deaths), Taraba (68 deaths), and Akwa Ibom (91) recorded far fewer fatal road accidents.
IFRA-Nigeria epapers series, 2014, n°35
26
State 2006 2007 2008 2009 2010 2011 2012 2013 2014 TOTAL
Abia -‐ 28 12 3 1 5 57 42 5 153
Adamawa -‐ -‐ 54 10 39 13 30 12 2 160
Akwa Ibom
3 17 -‐ 3 5 8 26 22 7 91
Anambra 36 22 30 78 98 35 69 96 28 492
Bauchi 23 17 69 24 65 124 88 76 19 505
Bayelsa 1 30 19 4 -‐ 3 3 34 10 104
Benue 19 51 12 66 18 68 40 48 4 326
Borno -‐ 21 13 45 17 12 18 18 11 155
Cross River
34 21 54 10 10 10 6 26 18 189
Delta 44 82 181 39 184 44 62 112 50 798
Ebonyi 2 3 5 4 5 1 3 21 7 51
Edo 47 88 164 196 11 208 85 210 120 1,129
Ekiti -‐ 20 11 4 8 8 24 21 11 107
Enugu -‐ 5 2 40 61 44 27 35 30 244
FCT 48 80 159 120 198 134 87 162 58 1,046
Gombe 20 15 19 24 40 27 5 23 -‐ 173
Imo 26 21 71 33 17 14 20 30 7 239
Jigawa 1 24 23 14 6 10 13 32 37 160
Kaduna 43 186 24 32 28 17 48 50 18 446
Kano 36 16 31 102 49 48 13 50 28 373
Katsina 36 80 8 64 52 121 50 83 10 504
Kebbi 11 -‐ 1 10 36 38 3 43 7 149
Kogi 33 70 58 208 172 89 86 64 56 836
Kwara 39 29 34 50 34 21 47 43 22 319
VITUS NWANKWO UKOJI – TRENDS AND PATTERNS OF FATAL ROAD ACCIDENTS IN NIGERIA (2006-2014)
Figure 11 - Yearly breakdown of violent road accident deaths in Nigeria (June 2006–May 2014)
Lagos State The number of Lagos residents is contested.
According to the 2006 census, its population stands at 9,013,534, contrary to the state government’s parallel count of 17.5 million.51 Recent World Bank demographic trend analysis reported that Lagos State population growth rate of 8% has resulted in its capturing of 36.8% of Nigeria’s urban population, which is estimated to reach 49.8 million people.52 In this context, fatal car accidents are a challenge, with 212 deaths reported in six months in 2006; 260 in 2007; and 306 in 2008. Yet, there was a drastic reduction in road accident fatality rates, with 156 and 68 deaths in 2011 and 2012, respectively. The figure
Figure 12 – Summary of fatal car accidents in Lagos per LGA and route (June 2006 – May 2014)
VITUS NWANKWO UKOJI – TRENDS AND PATTERNS OF FATAL ROAD ACCIDENTS IN NIGERIA (2006-2014)
29
Ikeja, the capital of Lagos State, recorded the highest number of deaths from car accidents. Most lives were lost in the Ikeja axis of the Lagos–Ibadan Expressway. The strategic location of the area places it at the centre of fatal car accidents, with a record of 266 car accident deaths. Another route that has claimed several lives is the ever-busy Oshodi–Apapa Expressway. Oshodi is one of the most populated areas of Lagos State, with major industries located in the LGA. Within the period under study, 180 persons died in fatal car accidents. The expressway is a major link to Tin Island, where most companies involved in oil distribution are located. The presence of these companies has kept Apapa, Mainland, Island and Eti-Osa ever busy with commercial activities. Oil pipelines cut through many residential areas in Lagos State. Distribution of Premium Motor Spirit (PMS), a major cause of deaths along Apapa/Mile 2/Oshodi Expressway, has always been ongoing. The volatility of such refined products makes it fatal each time tankers have accidents. In May 2008, for instance, an explosion occurred after a bulldozer hit an oil pipe and about 100 people were killed by fire, including many school children.53 Aside from oil companies, other protagonists, such as government security agencies, have caused fatal road accidents in the state. In a bid to evade arrest, commercial bus drivers cause fatal accidents. Policemen mount road blocks that have caused several fatal road accidents. Approximately 54 people died in a multiple road accident caused by a police checkpoint on Shangisha Bridge, between the Toll Gate and Berger Bus Stop near Otedola Housing Estate in October 2010.54
30 However, the administration of Governor Fashola
(2007–2015) has achieved reasonable success in the reduction of road accidents in Lagos State. Lagos State Traffic Management Authority (LASTMA) was created to reduce deaths, injuries, and economic losses from road accidents by employing modern traffic management techniques. The agency is empowered, among other things, to relocate tankers to industrial parks, impound tankers and cars parked indiscriminately, and ensure strict compliance with safety measures. Accidents have been reduced from 19% in 2008 to 9% in 2009. It was further reduced to about 8% in 2013 and continues to show signs of reduction in the first five months of 2014.
Edo Edo State recorded the second-highest rate of fatal
road accidents in Nigeria between June 2006 and May 2014, with 1,129 deaths in 177 accident cases. There were 210 deaths in 2013; 208 in 2007; 196 in 2009; 164 in 2008; and 120 between January and May 2014. The strategic nature and location of Edo State as a major link to the South West, South-South, South East and North Central places it on a list of states with a high risk of fatal car accidents. The state also serves as a major terminal to most drivers travelling to different parts of the country. Figure 13 shows the distribution of fatal car accidents in Edo State within the period under study.
VITUS NWANKWO UKOJI – TRENDS AND PATTERNS OF FATAL ROAD ACCIDENTS IN NIGERIA (2006-2014)
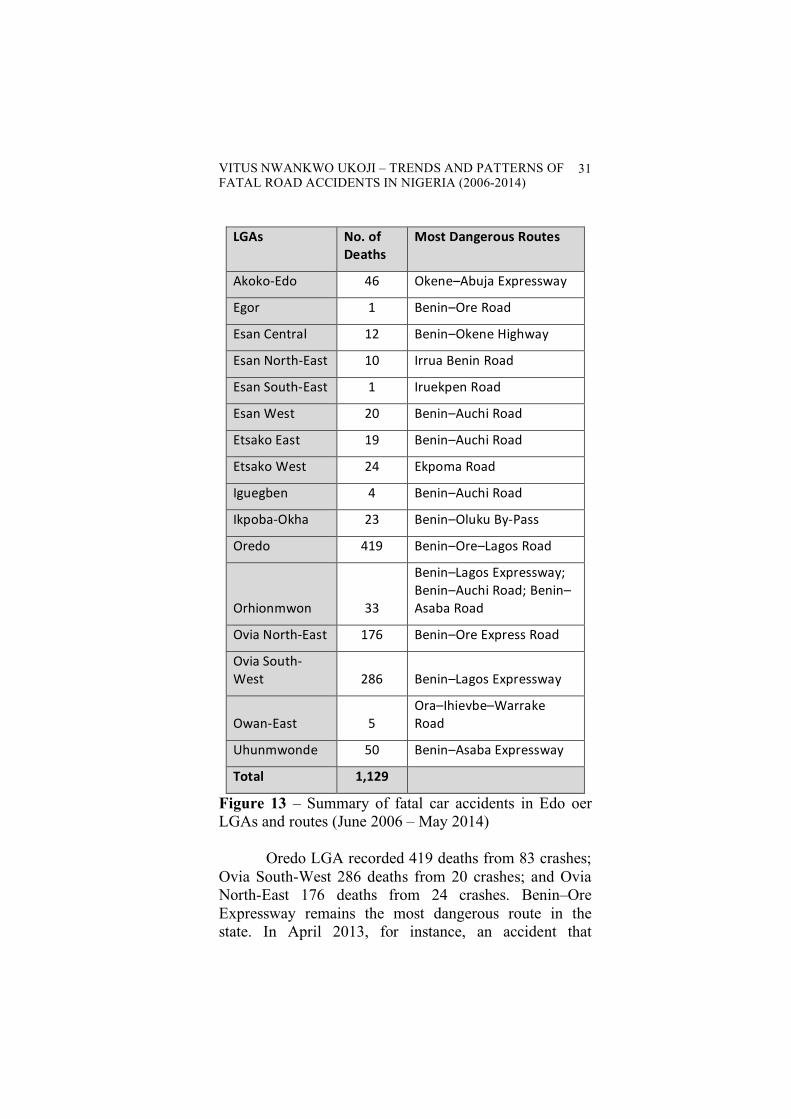
Figure 13 – Summary of fatal car accidents in Edo oer LGAs and routes (June 2006 – May 2014)
Oredo LGA recorded 419 deaths from 83 crashes; Ovia South-West 286 deaths from 20 crashes; and Ovia North-East 176 deaths from 24 crashes. Benin–Ore Expressway remains the most dangerous route in the state. In April 2013, for instance, an accident that
IFRA-Nigeria epapers series, 2014, n°35
32 involved a cement-laden Dangote trailer, a tanker, and a luxury bus along the route led to the death of 60 persons.55 The bus, suffering a burst tyre, rammed into the trailer, which in turn rammed into the tanker, and the 60 victims were burnt beyond recognition within minutes. About 16 vehicles, 10 motorcycles, and 15 shops by the roadside were also destroyed by the fire.
Another dangerous route in Edo State is the
Benin–Auchi–Okene Highway. The route connects the state with Kogi and serves as a major route to persons travelling to the South West. The traffic volume on the road makes it the second-most dangerous route within the period under study. In 2009, for instance, an 18-seater bus collided with an oncoming trailer along the highway and killed 15 people, including a lecturer at Auchi Polytechnic.56 However, the recent reconstruction of some roads in the state by the Federal Government is expected to be a form of palliative measure to reduce the incidence of fatal car accidents in the state.
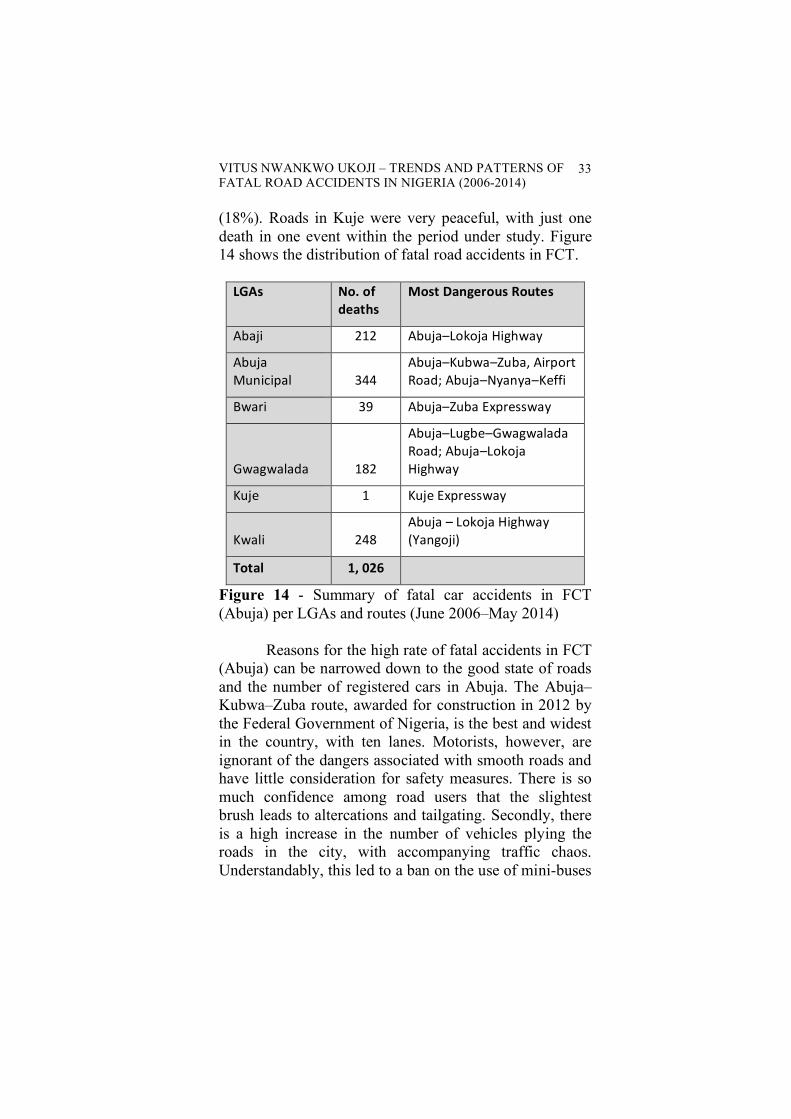
FCT (Abuja) FCT recorded the third-highest death toll of 1,046
lives in 348 fatal road accidents between June 2006 and May 2014, most of which occurred along the Abuja–Kubwa and Abuja–Lokoja routes, and within the urban settlements. A total of 198 deaths were reported in 2010; 162 in 2013; 159 in 2008; and 120 in 2009. Abuja Municipal recorded the highest number of fatal car accidents, with 344 deaths, followed by Kwali with 248 deaths and Abaji with 212. While road accidents are widely distributed in FCT (Abuja), the municipal area accounted for 34% of the total road accident deaths, followed by Kwali (23%), Abaji (21%), and Gwagwalada 55 http://www.nigeriawatch.org/index.php?urlaction=evtView&id_evt=11124&rang=1 56 http://www.nigeriawatch.org/index.php?urlaction=evtView&id_evt=5153&rang=1
VITUS NWANKWO UKOJI – TRENDS AND PATTERNS OF FATAL ROAD ACCIDENTS IN NIGERIA (2006-2014)
33
(18%). Roads in Kuje were very peaceful, with just one death in one event within the period under study. Figure 14 shows the distribution of fatal road accidents in FCT.
Figure 14 - Summary of fatal car accidents in FCT (Abuja) per LGAs and routes (June 2006–May 2014)
Reasons for the high rate of fatal accidents in FCT
(Abuja) can be narrowed down to the good state of roads and the number of registered cars in Abuja. The Abuja–Kubwa–Zuba route, awarded for construction in 2012 by the Federal Government of Nigeria, is the best and widest in the country, with ten lanes. Motorists, however, are ignorant of the dangers associated with smooth roads and have little consideration for safety measures. There is so much confidence among road users that the slightest brush leads to altercations and tailgating. Secondly, there is a high increase in the number of vehicles plying the roads in the city, with accompanying traffic chaos. Understandably, this led to a ban on the use of mini-buses
IFRA-Nigeria epapers series, 2014, n°35
34 for commercial purposes and the restriction of motorcycles and tricycles to the outskirts of the city.57
ANALYSIS OF FATAL ROAD ACCIDENTS IN NIGERIA BY REGION AND GEOPOLITICAL ZONE
Nigeria is broadly grouped into North and South.
North is comprised of Kogi, Niger, Benue, Kwara, Plateau, Nassarawa, and FCT. Others include Taraba, Borno, Bauchi, Adamawa, Gombe,Yobe, Kaduna, Kebbi, Zamfara, Sokoto, Kano, Jigawa and Katsina states. Its southern counterpart comprises Ebonyi, Enugu, Imo, Abia, Anambra, Akwa-Ibom, Bayelsa, Edo, Cross River, Rivers, and Delta states. Others are Oyo, Ogun, Lagos, Ondo, and Osun.
Based on the 2006 census, the nation’s population
is put at 140 million. The North accounts for 73.6 million and the South for 64.9 million. Kano is the most populated state in the North, with 9,383,682 inhabitants, while FCT (Abuja) has the lowest population, with 1,405,201. The population of southern Nigeria is dominated by Lagos (9,031,534), while Bayelsa is the least populated state, with 1,703,358.
Figure 15 - Number of violent deaths in Nigeria caused by road accidents by region (June 2006–May 2014)
VITUS NWANKWO UKOJI – TRENDS AND PATTERNS OF FATAL ROAD ACCIDENTS IN NIGERIA (2006-2014)
35
Results in Figure 15 show that 8,288 (55%) of
people in the South died in fatal road accidents and 6,792 (45%) people died in the North. In the South, many people died on the Lagos–Ibadan, Benin–Ore, and Enugu–Port Harcourt expressways prior to recent renovations. In the North, FCT (Abuja) has one of the best road networks in the country. Yet good roads also entail over-speeding and a high risk of fatal accidents. The number of registered vehicles also determines the frequency of fatal road accidents. According to the NBS in 2007, 387,338 (76%) of all vehicles were registered in the South and 122, 804 (24%) in the North (Figure 16).
Figure 16 - Number of motor vehicles registered (2007)58
Oil distribution through the activities of tankers is
also an important factor in the incidence of road accidents in the South. Tankers are usually rocked by fire explosions each time they crash on the roads. Several commuters have lost their lives in such incidents, especially along Lagos–Sagamu–Ibadan Expressway, East–West Road in Rivers State, and the Benin–Ore route in Edo. The failure of the government to renovate the railway system has led to increased pressure on oil distribution companies to use road transportation.
58 Source: National Bureau of Statistics (2009), Annual Abstract of Statistics, 2009
IFRA-Nigeria epapers series, 2014, n°35
36 Furthermore, rampant criminal activities on the
expressways have caused several fatal road accidents in the South. Arguably, the South is home to different networks of criminal gangs. Motorists are both robbed and forced to lie on the tarred roads, only to be crushed by oncoming vehicles. In other cases, they are chased into fatal accidents. On 1 August 2008, 30 Igbo traders were robbed in Ijebu Ode along the Benin–Ore Expressway. They were forced to lie face down on the road and eventually were crushed to death by an oncoming trailer.59 Similarly, 32 passengers of a bus were victims of a robbery attack and were forced to lie on the road and were crushed to death by an oncoming luxury bus.60 The foregoing fundamental and structural issues have always made the North a safer area with respect to the number of fatal car accidents in Nigeria.
When comparing death figures from road
accidents in the six geo-political zones of Nigeria, South-West recorded the greatest number of deaths (4,239) and was followed by North Central (3,242) (see Figure 17). This result is unsurprising given the immense contribution of Lagos and Oyo states (South West) and FCT (Abuja) and Kogi states (North Central) to fatal road accidents.
VITUS NWANKWO UKOJI – TRENDS AND PATTERNS OF FATAL ROAD ACCIDENTS IN NIGERIA (2006-2014)
37
Figure 17 - Number of violent deaths in Nigeria caused by road accidents per region
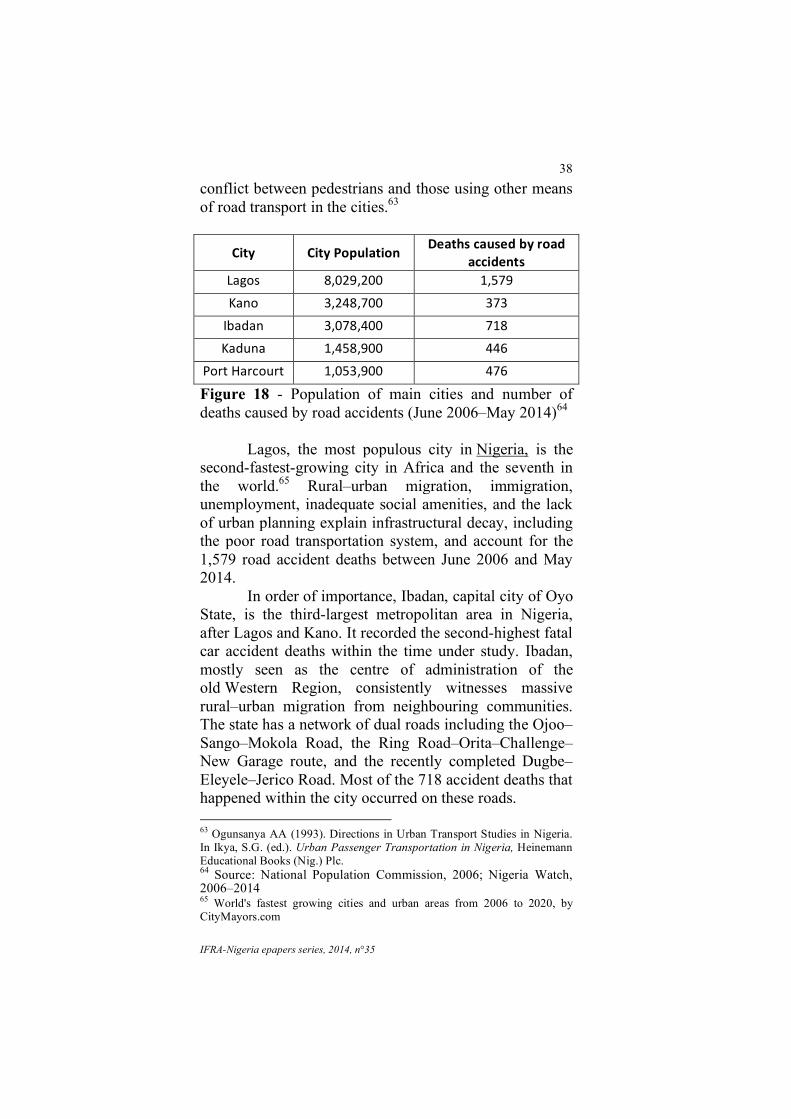
POPULATION, RURAL-URBAN MIGRATION AND FATAL ROAD ACCIDENTS IN NIGERIA Urbanization has taken a huge toll in fatal road
accidents in Nigeria. The nation is one of the countries in the developing world with a high rate of rural–urban migration and fast-growing cities. Though growth is a global phenomenon, 90% of growth in urban population worldwide occurs in developing countries and places intense pressure on urban infrastructure, particularly transportation.61 The NBS put Nigeria’s population at 166.2 million people in 2012.62 This represents 2.35% of the world’s total population, which arguably means that one person in every 43 people on the planet is a resident of Nigeria. In this context, very large metropolitan areas like Lagos, Kano, Ibadan, Kaduna, and Port Harcourt face congestion problems that often occur when traffic pressure is increased in the transport systems. A high number of accidents happen owing to the general impatience and ill-tempered nature of road users and to
61 Rodrigure J (2009). The Geography of Transport Systems, 2nd edition. New York: Routledge. 62 National Bureau of Statistics (2007)
IFRA-Nigeria epapers series, 2014, n°35
38 conflict between pedestrians and those using other means of road transport in the cities.63
City City Population Deaths caused by road
accidents Lagos 8,029,200 1,579
Kano 3,248,700 373
Ibadan 3,078,400 718
Kaduna 1,458,900 446
Port Harcourt 1,053,900 476
Figure 18 - Population of main cities and number of deaths caused by road accidents (June 2006–May 2014)64
Lagos, the most populous city in Nigeria, is the second-fastest-growing city in Africa and the seventh in the world.65 Rural–urban migration, immigration, unemployment, inadequate social amenities, and the lack of urban planning explain infrastructural decay, including the poor road transportation system, and account for the 1,579 road accident deaths between June 2006 and May 2014.
In order of importance, Ibadan, capital city of Oyo State, is the third-largest metropolitan area in Nigeria, after Lagos and Kano. It recorded the second-highest fatal car accident deaths within the time under study. Ibadan, mostly seen as the centre of administration of the old Western Region, consistently witnesses massive rural–urban migration from neighbouring communities. The state has a network of dual roads including the Ojoo–Sango–Mokola Road, the Ring Road–Orita–Challenge–New Garage route, and the recently completed Dugbe–Eleyele–Jerico Road. Most of the 718 accident deaths that happened within the city occurred on these roads. 63 Ogunsanya AA (1993). Directions in Urban Transport Studies in Nigeria. In Ikya, S.G. (ed.). Urban Passenger Transportation in Nigeria, Heinemann Educational Books (Nig.) Plc. 64 Source: National Population Commission, 2006; Nigeria Watch, 2006–2014 65 World's fastest growing cities and urban areas from 2006 to 2020, by CityMayors.com
VITUS NWANKWO UKOJI – TRENDS AND PATTERNS OF FATAL ROAD ACCIDENTS IN NIGERIA (2006-2014)
39
Port Harcourt, another major city in Nigeria, recorded 476 road accidents fatalities between June 2006 and May 2014. The city is an epicentre of oil activities by a large number of multinational and local firms. Hence, oil distribution has been a major threat to the city, when one considers tanker accidents, explosions, and fire outbreaks. Aside from oil-related activities, Port Harcourt is known for its bustling night activity and entertainment industry. Late-night driving, under-age driving, and drunk driving are factors that have contributed to the number of fatal road accidents in the state. Finally, the volume of trade within the city due to its proximity to Aba, the commercial centre of Abia State, increases the volume of traffic pressure from traders flocking in and out of the state. The increase of traffic volume often causes fatal road accidents.
CONCLUSION This study has examined the trends and patterns of
road accidents in Nigeria between June 2006 and May 2014. After studying the causes of violent deaths in Nigeria from a holistic point of view, fatal road accidents was discovered to be the deadliest cause, apart from the Boko Haram insurgency. Different contexts precipitate fatal car accidents in Nigeria. Understanding these political and socio-economic contexts gives a better insight into why road accident has remained a leading cause of death in the country. The distribution of fatal car accidents among the 36 states and the FCT shows that Lagos State recorded the highest number of fatal car accidents but was less dangerous after calculating the severity index. Abuja is more dangerous when compared with its relative number of inhabitants. Results further showed that regional variations exist in the fatality rate of road accidents, with more deaths occurring in the South than in the North. The results also established that state and city population estimates, number of registered vehicles, and trade volume are among the variables that
IFRA-Nigeria epapers series, 2014, n°35
40 determine the fatality rate of road accidents in Nigeria. Mapping such fatal road accidents in most states shows little correlation with political violence, except for a few accidents that were caused by Boko Haram attacks on commuters in Borno. As a result of government’s inability to appropriately budget and monitor road constructions and maintenance, criminal networks have also taken advantage of bad spots on the highways to rob travellers, causing fatal car accidents in the process.
VITUS NWANKWO UKOJI – TRENDS AND PATTERNS OF FATAL ROAD ACCIDENTS IN NIGERIA (2006-2014)
41
BIBLIOGRAPHY Abdalla, I.M., (1997) Statistical Investigation and
Modeling of the Relationships between Road Accidents And Social Characteristics. PhD. Thesis, Napier University.
Aderamo AJ (2002). Transport and the Nigerian
Urban Environment. Nigerian Geographical Association Aderemo, A.J (2012). Spatial Pattern of Road
Traffic Accident Casualties in Nigeria. Mediterranean Journal of Social Sciences Vol. 3 (2)
Adekunle JA (2010). Road Traffic Accident
deaths and Socio-economic Development in Nigeria. Int. Rev. Bus. Soc. Sci. 1(5):47-60.
Agbeboh G. U. and Osabuohien-Irabor, O (2013)
Empirical Analysis of Road Traffic Accidents: A case study of Kogi State, North-Central Nigeria, Department of Mathematics, Ambrose Alli University, Ekpoma, Nigeria.
Agbonkhese, O, Yisa, G.L, Agbonkhese, E.G,
Akanbi, D.O, Aka, E.O, Mondigha, E.B (2013), Road Traffic Accidents in Nigeria: Causes and Preventive Measures. Civil and Environmental Research, ISSN 2224-5790 (Paper) ISSN 2225-0514 (Online), Vol.3, No.13.
Alhassan U. B (2013). Herdsmen and Farmers
Conflicts in North-Eastern Nigeria: Causes, Repercussions and Resolutions. Academic Journal of Interdisciplinary Studies Published by MCSER-CEMAS-Sapienza University of Rome
Chen, G. (2010). Road Traffic Safety in African
Countries – Status, Trend, Contributing Factors, Counter
IFRA-Nigeria epapers series, 2014, n°35
42 Measures And Challenges, International Journal of Injury Control and Safety Promotion, 17(4): 247 – 255.
Christie, N., (1995b) Social, Economic and
Environmental Factors in Child Pedestrian Accidents: A research review. Transport Research Laboratory, Project Report 116.
Eke, N., Etebu, E.N. and Nwosu, S.O. (2000).
Road Traffic Accident Mortalities in Port Harcourt, Nigeria. Anil Aggrawals Internet J. Forensic Med. Toxicol., Vol 1(2).
Accident Report Federal Road Safety Commission (2010) Research
Monograph No. 2, Road Mirror Hancock, P.A., Lesch, M., Simmons, L. (2003)
The distraction effects of phone use during a crucial driving maneuver. Accident Analysis and Prevention (35) 501-514
International Road Traffic and Accident Database
(IRTAD) (2007): Road User Fatalities. Paris: Directorate for Science, Technology and Industry. Organization for Economic Co-operation and Development (OECD).
Jacobs, G. & Aeron-Thomas, A. (2000). Africa
road safety review final report. Washington, DC: US Department of Transportation, Federal Highway Administration.
VITUS NWANKWO UKOJI – TRENDS AND PATTERNS OF FATAL ROAD ACCIDENTS IN NIGERIA (2006-2014)
43
Lagarde, E. (2007). Road Traffic Injury is an
Escalating Burden in Africa and Deserves Proportionate Research Efforts. PLOS Medicine, 4(6):967 – 971.
National Bureau Of Statistics (2009), Annual
Abstract Of Statistics. National Buerau for Statistics (2010). The Review
of the Nigerian Economy Pérouse de Montclos, Marc-Antoine. (2014).
Nigeria Watch Fourth Report on Violence in Nigeria (2006–2014) Institut français de géopolitique, Université Paris
Ogunsanya AA (1993). Directions in Urban
Transport Studies in Nigeria. In Ikya, S.G. (ed.). Urban Passenger Transportation in Nigeria, Heinemann Educational Books (Nig.) Plc.
Pratte, D. (1998) “Road to Ruin: Road Traffic
Accident in the Developing World”, NEXUS, Vol. 13, 1998, pp. 46 – 62
Rodrigure J (2009). The Geography of Transport
Systems, 2nd Edition. New York: Routledge. Smart D, Vassallo S, Sanson A, Cockfield S,
Harris A, Harrison W, McIntyre A (2005). In The Driver’s Seat: Understanding Young Adults’ Driving Behaviour. Melbourne: Australian Institute of Family Studies.
Sumaila, AbdulGaniyu Femi (2013). Road crashes
trends and safety management in Nigeria, Department of Transport Management Technology, Federal University of Technology, Minna
IFRA-Nigeria epapers series, 2014, n°35
44 Terje Assum (1998), Road Safety in Africa: An
Appraisal of Road Safety Initiatives In Five African Countries
WHO, Decade of Action for Road Safety (2011-
2020): Global Launch WHO (2004): World Report on Road Traffic
Injury Prevention. Geneva: World Health Organization.
VITUS NWANKWO UKOJI – TRENDS AND PATTERNS OF FATAL ROAD ACCIDENTS IN NIGERIA (2006-2014)
45
ANNEX List of acronyms
FCT Federal Capital Territory UN United Nations FRSC Federal Road Safety Commission WHO World Health Organization RTA Road Traffic Accident ADC Aide-De-Camp ASP Assistant Superintendent of Police PDP People’s Democratic Party ACN Action Congress of Nigeria PMS Premium Motor Spirit ICT Information and Communication
Technology RSTC Rivers State Transport Company LGA Local Government Area LASTMA Lagos State Traffic Management Authority NBS National Bureau of Statistics