26
1 | Page Trends and Best Practices Redmond 2050 Comprehensive Plan Periodic Review SEPA Analysis & Documentation January 2021

1 | P a g e
Trends and Best Practices
Redmond 2050 Comprehensive Plan Periodic Review SEPA Analysis & Documentation
January 2021

2 | P a g e
Table of Contents
PURPOSE AND SUMMARY ...................................................................................................................... 3
TRENDS AND PRACTICES BY TOPIC ..................................................................................................... 9
NATURAL ENVIRONMENT ....................................................................................................................... 9
Earth .......................................................................................................................................................... 9
Water ....................................................................................................................................................... 10
Plants and Animals ................................................................................................................................ 12
Air Quality/Greenhouse Gas ................................................................................................................ 13
LAND USE AND SOCIO ECONOMICS ................................................................................................ 15
AESTHETICS ............................................................................................................................................. 16
TRANSPORTATION................................................................................................................................. 17
PUBLIC SERVICES .................................................................................................................................... 19
Schools .................................................................................................................................................... 19
Parks ........................................................................................................................................................ 20
Police Protection .................................................................................................................................... 22
Fire and Emergency Medical Services ............................................................................................... 23
STORMWATER, WATER, AND SEWER ............................................................................................... 23
Stormwater ............................................................................................................................................. 23
Water/Sewer ........................................................................................................................................... 25
Table 1 - Summary Table of Metrics and Best Practices .............................................................. 5 Table 2 – Redmond 2050 Themes ................................................................................................... 9
PRELIMIN
ARY DRAFT

3 | P a g e
Purpose and Summary The City of Redmond is preparing an update to its Comprehensive Plan [PR-2020-00134]. The plan will refine and implement the community vision, values, and objectives, and update each element of the Comprehensive Plan considering key themes of economic resiliency/recovery, equity and inclusion, technology forward ("smart city"), and sustainability. The Redmond 2050 Plan will address future growth and development consistent with the State's Growth Management Act (GMA) and regional planning requirements for updates.
The City proposes to update its Comprehensive Plan in conjunction other implementing plans our development regulations. This includes (but is not limited to) the:
• Transportation Master Plan • Stormwater Comprehensive Plan • General Sewer Plan & General Water Plan • PARCC Plan • Utilities Strategic Plan • Redmond Zoning Code & Redmond Municipal Code As part of the Redmond 2050 process, the City will prepare an environmental impact statement (EIS) to provide information to the public and decision-makers about the environmental effects of plans or projects on the natural and built environment. The EIS will identify environmental conditions, growth alternatives, potential impacts, and measures to reduce or mitigate any significant, unavoidable adverse impacts.
The expected environmental topics include: Natural Environment (earth, water, plants, and animals), Air Quality/Greenhouse Gas (GHG), Land Use and Socioeconomics, Aesthetics, Transportation, Public Services (police protection, fire and emergency medical services, parks, and schools), and Utilities (stormwater, water, and sewer). See Appendix for the expected scope and approach.
This document is intended to identify mitigation best practices, advances in environmental protection, and sustainability tools that could be addressed in EIS alternatives or programmatic mitigation measure options. This document can be considered with Vision and SEPA scoping results.
For each environmental topic anticipated, this document provides:
• performance metrics, • methods of measuring impacts, • linkages to Redmond priorities, • thresholds of significance to consider in EIS, and • best practices for alternatives and mitigation measure options.
Alternatives are different ways of achieving objectives. The City’s objectives include to create a Comprehensive Plan that meets state and regional requirements, such as to accommodate expected fair share of growth and focus most growth around Urban Centers and transit-oriented development areas. The Alternatives will consider different land use and growth options and infrastructure investments.
PRELIMIN
ARY DRAFT

4 | P a g e
Anticipated Environmental Impact Statement Topics
• Natural Environment (Earth, Water, Plants and Animals): A comprehensive review of potential impacts and opportunities related to the natural environment within the identified study area(s). The SEPA Team will focus identification of mitigation opportunities to those that best serve the ecological functions affected by plan updates using an approach consistent with BAS. The SEPA Team will also explore ways to streamline mitigation activities, through development of an advanced mitigation program, for example. The SEPA Team will also note ways to strengthen the community’s connection to the natural environment through interpretive or other educational opportunities.
• Air Quality/Greenhouse Gas: The SEPA Team will use the best available sources of regional and national data to evaluate greenhouse gas emissions. Transportation emissions will be evaluated using VMT and avg. trip length outputs from the City’s travel demand model by alternative. The SEPA Team will work with the City’s modeling consultant to post-process the results to account for factors that reduce GHG emissions, such as mixed-use development, higher densities, and greater transit usage. The King County SEPA GHG emissions worksheet will be used to estimate embodied and energy emissions associated with the construction and ongoing operation of land use development.
• Land Use and Socio Economics: The SEPA Team will evaluate growth alternatives on compatibility and consistency with state GMA goals, VISION 2050, and elements of the Redmond 2050 Update Vision and review the ability of alternatives to meet the City’s growth allocations. The SEPA Team will also analyze the potential relative effects of growth alternatives on affordable housing conditions and economic development strategies and job mix.
• Transportation: The SEPA Team will coordinate with the Transportation Modeling and Cost Estimating Team. The SEPA Team will review, interpret, and translate the TMP Update modeling and operational analysis results into a SEPA-compliant evaluation.
• Public Services: Growth under the alternatives will affect a wide variety of public services, including police protection, fire and emergency medical services, parks, and schools. The SEPA Team will evaluate each alternative with regard to the level of demand anticipated for each of these public services based on available system plan and service delivery studies and adopted level of service standards.
• Stormwater: The SEPA Team will analyze impacts and mitigation requirements for surface water and water resource improvements under each alternative while ensuring that public and private stormwater systems are planned, developed, and maintained to prevent flooding, protect water quality, and preserve natural stormwater systems.
• Water/Sewer: The SEPA Team will analyze each alternative for impacts, mitigation requirements, and public-private funding options for utility improvements for each alternative. The SEPA Team will consider anticipated or needed improvements to accommodate growth and development projections.
• Aesthetics: The SEPA Team will prepare the aesthetics and urban design analysis to address potential changes to physical conditions and views. The SEPA Team will integrate the Vision Team’s modeling or typology work. The SEPA Team will illustrate future study area conditions, both from an overview perspective, as well as from that of a street-level pedestrian. Locations to be analyzed will be targeted to provide views of important public open spaces, high-traffic corridors, and well-known landmarks based on mutual agreement with the City.
More details follow Table 1 below.
PRELIMIN
ARY DRAFT

5 | P a g e
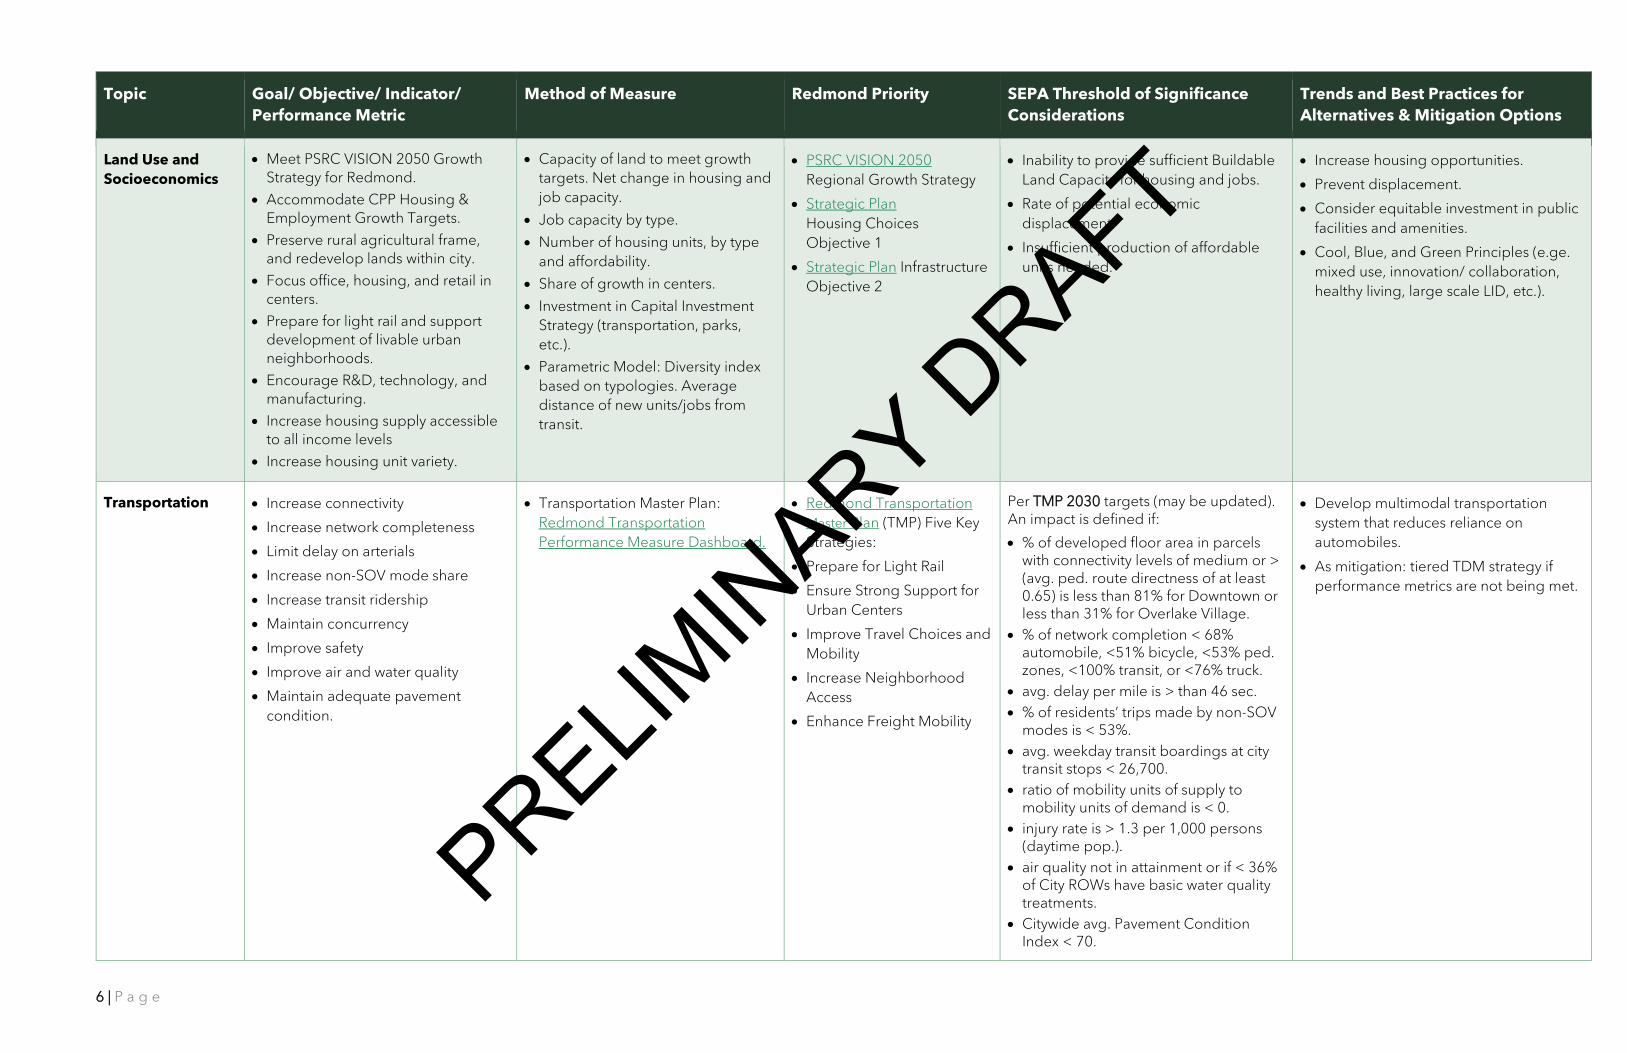
TABLE 1 - SUMMARY TABLE OF METRICS AND BEST PRACTICES
Topic Goal/ Objective/ Indicator/ Performance Metric
Method of Measure Redmond Priority SEPA Threshold of Significance Considerations
Trends and Best Practices for Alternatives & Mitigation Options
Natural Environment: Earth
• Limit disturbance of geologic hazard areas.
• Radius from mapped geologic areas.
• Natural Environment Element: Policies NE-27 to NE-36.
• Inconsistency with best available science.
• Creation or acceleration of a geologic hazard that exposes population to risk or injury or substantial property damage.
• Erosion could not be contained (future development sites).
• Consider addressing additional Geologic Hazard types.
• Consider erosion hazards due to streambank erosion.
• Address increasing risks of geologic hazards due to climate change.
Natural Environment: Water
• Avoid and minimize stream, wetland, and groundwater impacts.
• Increase the number of healthy streams (BIBI Index over 35 for 12 streams).
• Percent of water quality tests that meet compliance regulations.
• Radius from mapped streams and wetlands.
• Impervious surface changes in critical aquifer recharge areas.
• Strategic Plan Environmental Sustainability Objective #3.
• Inconsistency with best available science.
• Loss of wetland and stream habitat.
• Reduction in recharge.
• Reduction in water quality.
• Impact to functions and values that are more than moderate.
• Review impacts to wetlands and streams in a landscape context.
• Consider how the regulation of ditches may protect wetland, stream, and water quality functions.
• Address potential for water quality effects on wetlands and increasing importance due to climate change.
Natural Environment: Plants and Animals
• Avoid and minimize further loss of habitat corridors by minimizing landscape-scale fragmentation.
• Increase the tree canopy to 40%.
• Extent of habitat associated with protected species.
• Extent of usable wildlife corridors (protected or reserved open space, utility rights-of-way, riparian corridors, wetland buffers, and protected sensitive areas).
• Percent tree cover.
• Natural Environment Element: Policy NE-90, NE 92, NE 99.
• Strategic Plan Environmental: Sustainability Objective #3.
• Inconsistency with best available science.
• Loss of habitat affecting listed species.
• Fragmentation of wildlife corridors.
• Likelihood of jeopardizing a plant or animal population that is not currently vulnerable.
• Review impacts and mitigation in a landscape context.
• Address buffers and/or place seasonal restrictions on work to protect habitat.
• Tree canopy is increasingly valued in the context of urbanization and climate change.
Air Quality/ GHG • Decrease in greenhouse gas emissions - Resolution 1436: 80% below 2008 levels by 2050.1
• Greenhouse gas emissions inventory
• Strategic Plan Environmental. Sustainability Objective #1 and #3.
• An impact is defined if the alternative would conflict with City emissions reduction targets.
Climate Action Plan strategies:
• Reduce vehicle miles travelled (VMT).
• Increase the use of low carbon modes of transportation.
• Conserve energy and increase reliance on renewable energy
• Protect urban forests and wetlands.
• Use green infrastructure.
1 Climate Action Plan: Assuming 1% annual population growth, these targets translate to per capita emissions of approximately 8.5 metric tons of carbon dioxide equivalent (MTCO2e) by 2020, 5 MTCO2e by 2030, and 1.4 MTCO2e by 2050.
PRELIMIN
ARY DRAFT
6 | P a g e
Topic Goal/ Objective/ Indicator/ Performance Metric
Method of Measure Redmond Priority SEPA Threshold of Significance Considerations
Trends and Best Practices for Alternatives & Mitigation Options
Land Use and Socioeconomics
• Meet PSRC VISION 2050 Growth Strategy for Redmond.
• Accommodate CPP Housing & Employment Growth Targets.
• Preserve rural agricultural frame, and redevelop lands within city.
• Focus office, housing, and retail in centers.
• Prepare for light rail and support development of livable urban neighborhoods.
• Encourage R&D, technology, and manufacturing.
• Increase housing supply accessible to all income levels
• Increase housing unit variety.
• Capacity of land to meet growth targets. Net change in housing and job capacity.
• Job capacity by type.
• Number of housing units, by type and affordability.
• Share of growth in centers.
• Investment in Capital Investment Strategy (transportation, parks, etc.).
• Parametric Model: Diversity index based on typologies. Average distance of new units/jobs from transit.
• PSRC VISION 2050 Regional Growth Strategy
• Strategic Plan Housing Choices Objective 1
• Strategic Plan Infrastructure Objective 2
• Inability to provide sufficient Buildable Land Capacity for housing and jobs.
• Rate of potential economic displacement.
• Insufficient production of affordable units needed.
• Increase housing opportunities.
• Prevent displacement.
• Consider equitable investment in public facilities and amenities.
• Cool, Blue, and Green Principles (e.ge. mixed use, innovation/ collaboration, healthy living, large scale LID, etc.).
Transportation • Increase connectivity
• Increase network completeness
• Limit delay on arterials
• Increase non-SOV mode share
• Increase transit ridership
• Maintain concurrency
• Improve safety
• Improve air and water quality
• Maintain adequate pavement condition.
• Transportation Master Plan: Redmond Transportation Performance Measure Dashboard.
• Redmond Transportation Master Plan (TMP) Five Key Strategies:
• Prepare for Light Rail
• Ensure Strong Support for Urban Centers
• Improve Travel Choices and Mobility
• Increase Neighborhood Access
• Enhance Freight Mobility
Per TMP 2030 targets (may be updated). An impact is defined if:
• % of developed floor area in parcels with connectivity levels of medium or > (avg. ped. route directness of at least 0.65) is less than 81% for Downtown or less than 31% for Overlake Village.
• % of network completion < 68% automobile, <51% bicycle, <53% ped. zones, <100% transit, or <76% truck.
• avg. delay per mile is > than 46 sec. • % of residents’ trips made by non-SOV
modes is < 53%. • avg. weekday transit boardings at city
transit stops < 26,700. • ratio of mobility units of supply to
mobility units of demand is < 0. • injury rate is > 1.3 per 1,000 persons
(daytime pop.). • air quality not in attainment or if < 36%
of City ROWs have basic water quality treatments.
• Citywide avg. Pavement Condition Index < 70.
• Develop multimodal transportation system that reduces reliance on automobiles.
• As mitigation: tiered TDM strategy if performance metrics are not being met.
PRELIMIN
ARY DRAFT

7 | P a g e
Topic Goal/ Objective/ Indicator/ Performance Metric
Method of Measure Redmond Priority SEPA Threshold of Significance Considerations
Trends and Best Practices for Alternatives & Mitigation Options
Public Services: Schools
• Plan for school facilities in Redmond to meet target teacher student ratios.
• Provide for attainable broadband access for home school and remote school use.
• Lake Washington Six-Year Capital Facility Plan 2019-2024: Student Generation and Teacher Student Ratios.
• King County Broadband Study 2020 identifying unserved and households with lower incomes.
• Comprehensive Plan Goals for Redmond: To retain and enhance Redmond’s distinctive character and high quality of life, including an abundance of parks, open space, good schools, and recreational facilities.
• Define an impact if there is an increase in student demand and corresponding lack of capital facilities or broadband to serve demand.
• Given short-term and long-term trends, consider education capital facilities needs and broadband access in residential and mixed-use neighborhoods.
• Leverage municipal and school education and recreation resources such as through co-location.
Public Services: Parks
• Provide a natural area or recreational opportunity within proximity of residents and employees.
• Meet parks LOS in Parks, Arts, Recreation, Culture and Conservation Element.
• Access: Properties within a quarter mile of 100% of residents and 25% of workers in Redmond.
• Type: Measure LOS per PARCC Plan.
• Parks, Arts, Recreation, Culture and Conservation Element.
• PARCC Plan.
• Less than 100% of residents or 25% of employees are within proximity to park feature.
• LOS standards unmet.
• Consider changes to parks and trails due to pandemic – e.g. redesign of common areas, indoor HVAC, need for urban recreation, etc.
• Consider equity of access and investment to lower income households and persons of color.
• Consider recreation in a dense urban environment could be at ground level or at upper levels.
Public Services: Police
• LOS: Facilities and equipment sufficient to meet the demand for police services.
• Residents can fully and effectively access City services …and feel a sense of belonging and safety.
• Measure capital needs based on demand per LOS.
• Per capita investment in police training, and equity strategies.
• Capital Facilities Element.
• Strategic Plan Cultural Inclusion.
• Equity Action Team.
• LOS standards unmet.
• Police training, and equity strategies – to be determined.
Redmond has initiated goals around cultural inclusion and equity that reflect trends of community policing and
balancing resources and duties of police departments.
Public Services: Fire/EMS
• LOS: Travel time of six minutes or less for 90 percent of emergency fire and medical calls in the city.
• Due to lack of fire travel time model:
• Congestion measures per transportation.
• Households per fire station.
• Capital Facilities Element • Negatively affect the response times.
• Increased demand for special emergency services beyond current operational capabilities.
• The population would densify in taller structures and there will be a need for urban fire suppression and associated equipment.
• There is a balance in ensuring street designs that promote healthy active living as well as ensuring proper emergency access and staging. PRELIM
INARY D
RAFT

8 | P a g e
Topic Goal/ Objective/ Indicator/ Performance Metric
Method of Measure Redmond Priority SEPA Threshold of Significance Considerations
Trends and Best Practices for Alternatives & Mitigation Options
Stormwater • Prevent flooding.
• Protect water quality.
• Preserve natural stormwater systems.
• Number of acres of undetained impervious area.
• Number of acres of untreated pollution generating impervious surface.
• See also “Natural Environment” above.
• 2019 City of Redmond Stormwater Management Plan.
• Comprehensive Plan – Utilities Element: UT-36.
• An impact is defined if the alternative would increase or decrease these metrics compared to the existing conditions.
• Greater emphasis on LID, infiltration, and natural water quality treatment.
• Increased use of regional stormwater facilities in urban and urbanizing sub-areas.
• Anticipating climate change adaptations for wetter winters, more frequent and more extreme precipitation events.
Water/Sewer • Reduce average annual and peak day use.
• Increase conversion from onsite wastewater disposal systems as sewer lines.
• Remove stormwater connections to the sanitary sewer system.
• Average annual and peak day water usage.
• Number of on-site septic systems.
• Number of stormwater connections removed.
• Comprehensive Plan – Utilities Element: UT-19, UT-33, UT-34, UT-35.
• Increase or decrease these metrics compared to the existing conditions.
• Explore short-term and long-term implications of increase in work-from-home and school-from-home on residential water/sewer usage vs. commercial/office space water usage.
Aesthetics • Enhance natural features, distinct places, and character.
• Increase the tree canopy to 40%.
• Extent of tree canopy.
• Maintenance of Public View Corridors and Gateways.
• Three season access to parks and public spaces.
• Density of community gathering spaces.
• Parametric: Size of blocks, height differences, massing transition.
• Redmond Vision.
• Community Character and Historic Preservation Element.
• RDC 20D.42.
•
• Net loss of tree canopy/ impedance of City canopy goal.
• Inconsistency of development with public view protection policies/code.
• Shadows on public open spaces that could hinder public use.
• See parks.
• Determine urban design features with Vision process.
• See Land Use, Natural Environment, and Parks measures.
PRELIMIN
ARY DRAFT
9 | P a g e
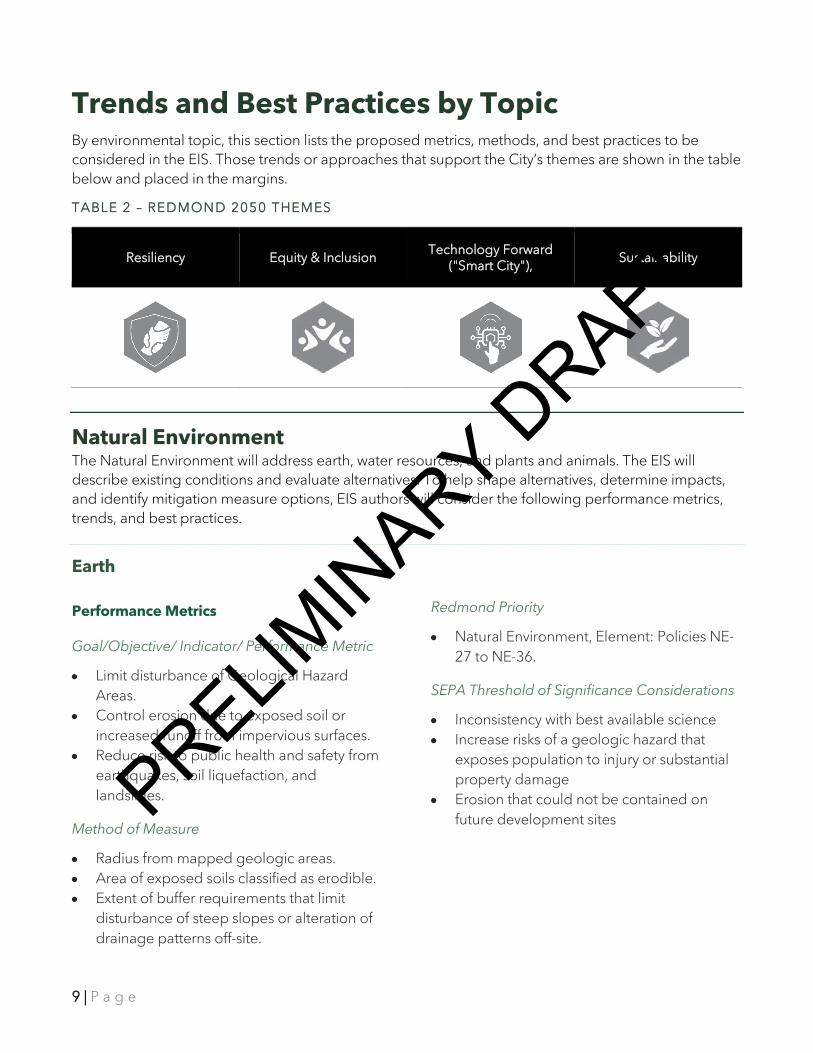
Trends and Best Practices by Topic By environmental topic, this section lists the proposed metrics, methods, and best practices to be considered in the EIS. Those trends or approaches that support the City’s themes are shown in the table below and placed in the margins.
TABLE 2 – REDMOND 2050 THEMES
Resiliency Equity & Inclusion Technology Forward ("Smart City"),
Sustainability
Natural Environment The Natural Environment will address earth, water resources, and plants and animals. The EIS will describe existing conditions and evaluate alternatives. To help shape alternatives, determine impacts, and identify mitigation measure options, EIS authors will consider the following performance metrics, trends, and best practices.
Earth
Performance Metrics
Goal/Objective/ Indicator/ Performance Metric
• Limit disturbance of Geological Hazard Areas.
• Control erosion due to exposed soil or increased runoff from impervious surfaces.
• Reduce risk to public health and safety from earthquakes, soil liquefaction, and landslides.
Method of Measure
• Radius from mapped geologic areas. • Area of exposed soils classified as erodible. • Extent of buffer requirements that limit
disturbance of steep slopes or alteration of drainage patterns off-site.
Redmond Priority
• Natural Environment, Element: Policies NE-27 to NE-36.
SEPA Threshold of Significance Considerations
• Inconsistency with best available science • Increase risks of a geologic hazard that
exposes population to injury or substantial property damage
• Erosion that could not be contained on future development sites PRELIM
INARY D
RAFT
10 | P a g e
Trends and Best Practices for Mitigation or Alternative
What are the Trends?
• Increase awareness of additional Geologically Hazardous Areas including volcano hazards (ashfall), land subsidence on organic soils and artificial fill, and hazardous mineral exposure.
• Increase awareness of Erosion Hazards due to streambank erosion caused by natural meander processes and increased peak flows on Bear Creek and Evans Creek.
• Address increasing risks of geological hazards due to climate change, such as increased erosion from areas burned by wildfire.
Rationale/Why
• Geological hazards will increase in significance as population increases and marginal areas are proposed for development.
• Increased winter streamflow due to climate change will result in geomorphic changes in streambanks and area of floodplain.
• Loss of standing vegetation due to climate change, particularly longer and drier summers with associated changes in plant communities, has implications for erosion and slope stability in Geological Hazard Areas.
Method
• Apply best available science (BAS) in updating regulations to reflect additional
geological and hydrological concerns resulting from changing conditions in the watershed.
• Update and ground-truth geological hazard maps to assure they are complete and reflect actual conditions on the ground.
Mitigation Measure Options – Initial
• Review proposed projects in Geological Hazard Areas to assure project designs mitigate potential impacts and reduce risks to public health and safety.
• Require proposed projects in Geological Hazard Areas to complete a geotechnical analysis and report to address potential impacts and risks to public health and safety.
• Increase public awareness of geological hazards by outreach and educational methods.
Resources and Examples
• Washington Department of Natural Resources. Washington Geological Survey. Geologic Risk for Washington State. Available: www.dnr.wa.gov/geology.
• Washington Department of Natural Resources. Geologic Information Portal. Available: https://www.dnr.wa.gov/geologyportal.
• Washington Department of Natural Resources. Liquefaction Susceptibility Map of King County, Washington by Stephen P. Palmer, et al. (2004).
• US Geological Survey. Washington Geologic and Hydrologic Hazards. USGS Fact Sheet 049-99. (2016).
Water
PRELIMIN
ARY DRAFT

11 | P a g e
Performance Metrics
Goal/Objective/ Indicator/ Performance Metric
• Avoid and minimize stream, wetland, and groundwater impacts.
• Increase the number of healthy streams (BIBI Index over 35 for 12 streams).
• Water quality tests that meet compliance regulations.
Method of Measure
• Radius from mapped streams and wetlands and buffer condition.
• Impervious surface changes in critical aquifer recharge areas.
Redmond Priority
• Strategic Plan: Environmental Sustainability Objective #3.
SEPA Threshold of Significance Considerations
• Inconsistency with BAS. • Loss of wetland and stream habitat. • Reduction in groundwater recharge. • Reduction in water quality. • Impact to functions and values that are more
than moderate.
Trends and Best Practices for Mitigation or Alternative
What are the Trends?
• After avoiding and minimizing impacts to wetlands and streams, review impacts in a landscape context.
• Some ditches may be regulated to protect wetland, stream and/or water quality functions. Washington State Department of Ecology notes ditches may be regulated by one or more agencies when the ditch is
within a wetland, conveys a historic stream, provides fish habitat, or contains water.
• Assessing and mitigating potential impacts to water quality and quantity entering a wetland or stream is increasingly important given climate change.
Rationale/Why
• On-site mitigation may not be the most sustainable or beneficial option. Landscape-scale or watershed level functions should be considered when planning mitigation.
• To maintain chemical and biological integrity of waters of the state, any significant nexus could degrade those waters without sufficient management and mitigation.
• Wetlands and streams are vulnerable to climate change and provide ecosystem services that help offset climate change impacts on communities.
Method
• Follow Washington State Department of Ecology and U.S. Army Corps of Engineers guidance for protecting and managing wetlands and waters of the state.
Resources and Examples
• Washington State Department of Ecology, U.S. Army Corps of Engineers Seattle District, and U.S. Environmental Protection Agency Region 10. October 2020. Draft Wetland Mitigation in Washington State – Part 1: Agency Policies and Guidance (Version 2). Washington State Department of Ecology Publication #20-06-010. Olympia, WA.
• Washington State Department of Ecology, website, wetlands page. Available: https://ecology.wa.gov/Water-Shorelines/Wetlands
PRELIMIN
ARY DRAFT

12 | P a g e
• Washington State Department of Ecology, website, water quality page. Available: https://ecology.wa.gov/Water-Shorelines/Water-quality.
• Washington State Department of Ecology. 2019. Stormwater Management Manual for
Western Washington (SWMMWW). • City of Redmond’s groundwater protection
program. Available: https://www.redmond.gov/831/GroundwaterWellhead-Protection.
Plants and Animals
Performance Metrics
Goal/Objective/ Indicator/ Performance Metric
• Avoid and minimize further loss of habitat corridors by minimizing landscape-scale fragmentation
• Increase tree canopy coverage to 40 percent.
Method of Measure
• Extent of habitat associated with protected species.
• Extent of wildlife corridors including parklands usable by wildlife, protected, or reserved (Native Growth Protection Easements) open space, utility rights-of-way, riparian corridors, wetland buffers, and protected sensitive areas.
• Percent tree canopy cover.
Redmond Priority
• Comprehensive Plan, Natural Environment Element: Policies NE-90, NE-92, NE-99.
• NE-90: Protect Core Preservation Areas within the city.
• NE-92: Pursue opportunities to preserve Quality Habitat Areas especially those which extend and connect to Core Preservation Areas.
• NE-99: Give special consideration to conservation and protection measure to
preserve and enhance anadromous fisheries.
• Strategic Plan, Environmental: Sustainability Objective #3.
SEPA Threshold of Significance Considerations
• Inconsistency with best available science. • Loss of habitat affecting listed species. • Fragmentation of wildlife corridors. • Likelihood of jeopardizing a plant or animal
population that is not currently vulnerable.
Trends and Best Practices for Mitigation or Alternative
What are the Trends?
• Review impacts and mitigation in a landscape context to improve, restore or maintain habitat corridors and connections.
• Provide buffers and/or place seasonal restrictions on work to protect identified priority plant or animal habitat.
• Tree canopy is increasingly valued in the context of urbanization and climate change.
Rationale/Why
• Habitat patches provide greater functions when they are part of a network that connects significant habitat patches and other opens spaces.
• Seasonal work windows and buffering both
PRELIMIN
ARY DRAFT

13 | P a g e
reduce impacts to sensitive species. • The importance of tree canopy is
recognized in maintaining healthy ecosystem functions, including habitat, microclimate, water quality, and air quality.
Method
• Follow Washington State Department of Fish and Wildlife, Washington State Department of Ecology, and U.S. Army Corps of Engineers guidance for protecting and managing priority habitats.
• Continue public outreach to promote the City’s Tree Canopy Strategic Plan.
Resources and Examples
• Washington State Department of Ecology, U.S. Army Corps of Engineers Seattle
District, and U.S. Environmental Protection Agency Region 10. October 2020. Draft Wetland Mitigation in Washington State – Part 1: Agency Policies and Guidance (Version 2). Washington State Department of Ecology Publication #20-06-010. Olympia, WA.
• Washington Department of Fish and Wildlife Priority Habitats and Species (PHS) webpage resources: https://wdfw.wa.gov/species-habitats/at-risk/phs.
• City of Redmond. January 15, 2019. Redmond’s Tree Canopy Strategic Plan. Available: https://www.redmond.gov/1256/Tree-Canopy.
Air Quality/Greenhouse Gas
The Air Quality/ Greenhouse Gas (GHG) analysis will use the best available sources of regional and national data to evaluate GHG emissions. EIS authors will consider the following performance metrics, trends, and best practices.
Performance Metrics
Goal/Objective/ Indicator/ Performance Metric
• Decrease carbon footprint: reduce greenhouse gas emissions produced by the community in total and per Redmond resident by 50% by 2030, and 80% by 2050 with a stretch goal of carbon neutrality by 20502.
• Reduce greenhouse gas emissions produced by the City of Redmond operations to achieve carbon neutrality by
2 https://www.redmond.gov/1493/Climate-Energy
2030.
Method of Measure
Greenhouse gas emission inventoryRedmond Priority
• Strategic Plan Environmental Sustainability Objectives.
• Objective #1: Decrease carbon footprint. • Objective #3: Align and implement
sustainability programs across programs, projects, and services.
SEPA Threshold of Significance Considerations
• An impact is defined if the alternative would conflict with City emissions reduction targets.
PRELIMIN
ARY DRAFT

14 | P a g e
Trends and Best Practices for Mitigation or Alternative
What are the Trends?
• The pandemic has disrupted travel patterns resulting in an initial steep drop in VMT – a key driver of GHG emissions – that has since returned to a steady climb as the economy reopened. However, it remains unclear if those gains will plateau into a long-term reduction below pre-pandemic levels or remain a sustained increase as preferences for driving outweigh the convenience of other modes. Potential migration to more suburban areas and permanent preferences for working from home are two critical factors that will influence VMT trends.
• The vehicle fleet continues to improve emissions levels with increased electrification and better fuel economy for gas-powered and hybrid vehicles. It is likely that gas/diesel powered vehicles will phased be out of production (or only be sold for niche purposes) by 2050, although there will still be internal combustion vehicles on the road.
• Buildings and energy represent the largest source of GHG emissions in Redmond—accounting for over 70% of total emissions. The largest sources within this sector are from commercial electricity and residential natural gas consumption, largely used for heating, cooling, and powering appliances
and equipment.3
Rationale/Why See “What are the Trends” above.
Method Best practices for mitigation and/or alternatives include:
• Reduce VMT from new land use development and transportation investments
• Increase the use of low carbon modes of transportation
• Increase the pace of vehicle fleet electrification
• Increase the energy efficiency of new development
• Increase the energy efficiency performance in existing buildings
• Improve accessibility through denser land use patterns
• Protect urban forests and wetlands and use green infrastructure
Resources and Examples
• City of Redmond. September 2020. Redmond Environmental Sustainability Action Plan. Available: https://www.redmond.gov/1493/Climate-Energy
• King County-Cities Climate Collaboration (K4C) Climate Action Toolkit
• California Senate Bill 743
3 https://www.redmond.gov/1493/Climate-Energy
PRELIMIN
ARY DRAFT

15 | P a g e
Land Use and Socio Economics The EIS will evaluate growth alternatives regarding compatibility and consistency with state GMA goals, VISION 2050, and elements of the Redmond 2050 Update Vision. The SEPA Team will review the ability of alternatives to meet the City’s growth allocations. The SEPA Team will also analyze the potential relative effects of growth alternatives on affordable housing conditions and economic development strategies and job mix. EIS authors will consider the following performance metrics, trends, and best practices.
Note: Address in collaboration with Vision Process. BERK to address in EIS using Vision results.
Performance Metrics
Goal/Objective/ Indicator/ Performance Metric
• Meet PSRC VISION 2050 Growth Strategy for Redmond.
• Accommodate CPP Housing & Employment Growth Targets.
• Preserve rural agricultural frame, and redevelop lands within city.
• Focus office, housing, and retail in centers. • Prepare for light rail and support
development of livable urban neighborhoods.
• Encourage R&D, technology, and manufacturing.
• Increase housing supply accessible to all income levels
• Increase housing unit variety.
Method of Measure
• Capacity of land to meet growth targets. Net change in housing and job capacity.
• Job capacity by type. • Number of housing units, by type and
affordability. • Share of growth in centers. • Investment in Capital Investment Strategy
(transportation, parks, etc.). • Parametric Model: Diversity index based on
typologies. Average distance of new units/jobs from transit.
Redmond Priority
• PSRC VISION 2050 Regional Growth Strategy
• Strategic Plan , Housing Choices, Objective 1 • Strategic Plan Infrastructure, Objective 2
SEPA Threshold of Significance Considerations
• Inability to provide sufficient Buildable Land Capacity for housing and jobs.
• Rate of potential economic displacement. • Insufficient production of affordable units
needed.
Trends and Best Practices for Mitigation or Alternative
What are the Trends?
• Increase opportunities for workforce and low-income households to live in Redmond through increasing housing choices.
• Prevent displacement of vulnerable residents, businesses, and cultural institutions.
• Equitable investment in public facilities and amenities to support quality neighborhoods, e.g. parks, sidewalks, etc.
• Cool, Blue, and Green Principles:
PRELIMIN
ARY DRAFT

16 | P a g e
• Cool: Vertical and horizontal mixture of compatible land uses, access to technology and collaboration in innovation districts.
• Blue: Urban development that promotes healthy living and longevity such as urban design that promotes healthy living and access to social and civic activities.
• Green: A large-scale application of LID low impact development (LID) to reduce a development’s carbon footprint and environmental impact (includes multimodal systems, energy, and water conservation, etc.).
Rationale/Why
• Meet local vision in context of regional growth management strategy and local and regional equity and holistic health needs.
Method
• Use results of Vision Process, e.g. typologies, bookends, and selected scenarios.
• King County, Urban Growth Capacity, underway.
• PSRC Opportunity Index. Available: https://www.psrc.org/opportunity-mapping.
• Jobs-Housing Fit: imbalance between a city’s total number of low-wage workers and the quantity of homes affordable to them. See: https://nonprofithousing.org/wp-content/uploads/JH-Fit-Fact-Sheet-FINAL-9.15.pdf.
Resources and Examples
• Redmond Housing Action Plan Strategies.
https://www.letsconnectredmond.com/housing.
• Seattle Equitable Development Implementation Plan, 2016. See: http://www.seattle.gov/Documents/Departments/OPCD/OngoingInitiatives/SeattlesComprehensivePlan/EDIImpPlan042916final.pdf.
• Local and Regional Government Alliance on Race and Equity: Equitable Development as a Tool to Advance Racial Equity, 2015. Available: https://www.racialequityalliance.org/wp-content/uploads/2016/11/GARE-Equitable-Development.pdf.
• See Transportation, Parks, and Utilities measures.
Aesthetics The aesthetics and urban design analysis will describe current conditions and address potential changes to physical conditions and views. EIS authors will consider the following performance metrics, trends, and best practices.
Note: This section subject to change to address metrics and trends through Visioning. Makers will address the subject in the EIS.
Performance Metrics
Goal/Objective/ Indicator/ Performance Metric
• Enhance natural features, distinct places,
and character. • Increase the tree canopy to 40%.
PRELIMIN
ARY DRAFT
17 | P a g e
Method of Measure
• Extent of tree canopy. • Maintenance of Public View Corridors and
Gateways. • Three season access to parks and public
spaces. • Density of community gathering spaces. • Parametric Model: Size of blocks, height
differences, massing transition.
Redmond Priority
• Redmond Vision. • Community Character and Historic
Preservation Element. • RDC 20D.42.
SEPA Threshold of Significance Considerations
• Net loss of tree canopy/ impedance of City canopy goal.
• Inconsistency of development with public
view protection policies/code. • Shadows on public open spaces that could
hinder public use. • See Parks and Transportation.
Trends and Best Practices for Mitigation or Alternative
What are the Trends? See Land Use, Natural Environment, and Parks.
Rationale/Why See Land Use, Natural Environment, and Parks.
Method
• Determine urban design features with Vision process.
• See Land Use, Natural Environment, and Parks measures.
Resources and Examples Land Use, Natural Environment, and Parks.
Transportation The EIS will adapt results from the TMP Update for the EIS. EIS authors will consider the following performance metrics, trends, and best practices.
Performance Metrics
Goal/Objective/ Indicator/ Performance Metric
• Increase connectivity within the transportation network to shorten distances and decrease travel times between origins and destinations.
• Increase the percentage of completion for the five modal corridor networks: automobile, bicycle, pedestrian, transit, and truck.
• Limit the average delay per mile incurred on principal, minor, and collector arterials during the p.m. peak hour.
• Increase the percentage of residents’ trips
made by modes other than single occupant vehicle.
• Increase average weekday transit ridership at transit stops within City limits.
• Allow development activity to continue by maintaining concurrency (adequate mobility units of supply to accommodate mobility units of demand).
• Improve safety by continuing the downward trend of per capita injury rates.
• Improve air and water quality by maintaining compliance with federal standards and increasing coverage of basic water quality treatments.
• Maintain adequate pavement condition as measured by the Pavement Condition Index.
PRELIMIN
ARY DRAFT

18 | P a g e
Method of Measure
• Transportation Master Plan: Redmond Transportation Performance Measure Dashboard
Redmond Priority
• Redmond Transportation Master Plan Five Key Strategies: Prepare for Light Rail, Ensure Strong Support for Urban Centers, Improve Travel Choices and Mobility, Increase Neighborhood Access, and Enhance Freight Mobility.
SEPA Threshold of Significance Considerations Note that the targets used below are those set for 2030 in the most recent TMP. As part of the City’s upcoming TMP update, these targets may be revised to progress farther toward the City’s aspirational targets.
• An impact is defined if the percentage of developed floor area in parcels with connectivity levels of medium or above (average pedestrian route directness of at least 0.65) is less than 81% for Downtown or less than 31% for Overlake Village.
• An impact is defined if the percentage of network completion is less than 68% for automobile, 51% for bicycle, 53% for pedestrian zones, 100% for transit, or 76% for truck.
• An impact is defined if the average delay per mile is more than 46 seconds.
• An impact is defined if the percentage of residents’ trips made by non-SOV modes is less than 53%.
• An impact is defined if average weekday transit boardings at transit stops within City limits are less than 26,700.
• An impact is defined if the ratio of mobility units of supply to mobility units of demand is less than zero.
• An impact is defined if the injury rate is
more than 1.3 per 1,000 persons (daytime population).
• An impact is defined if air quality is not in attainment with federal Clean Air Act standard or if less than 36% of City rights-of-way have basic water quality treatments.
• An impact is defined if the citywide average Pavement Condition Index is less than 70.
Trends and Best Practices for Mitigation or Alternative
What are the Trends?
• The pandemic has disrupted travel patterns including a change in mode share as people have avoided high capacity transit, but embraced walking and biking. However, over the long term, transit use is assumed to resume to its pre-pandemic levels particularly with the expansion of light rail service into Redmond. However, it may take some time for people to feel comfortable returning to less socially-distant forms of transportation.
• The pandemic has also dramatically changed travel patterns related to commuting (much more teleworking), retail (more home deliveries), and recreational travel (more walking and biking). Long-term trends related to teleworking and deliveries are difficult to predict at this point; however, it seems likely that teleworking and deliveries will continue at increased levels compared to 2019 conditions.
• While there is an increase in teleworking and decrease in retail traffic, areas that had high transit mode shares (which would include the greater Puget Sound Region and major employment centers like Overlake) have begun to see sharp increases in traffic as some people return to work, but not using transit. While there is no
PRELIMIN
ARY DRAFT
19 | P a g e
solid US data yet, car ownership rates are higher in Europe and Asia following the pandemic lockdowns. With this backdrop in mind, managing vehicle traffic and demand to drive must be a consideration to achieve Redmond’s goals.
Rationale/Why See “What are the Trends” above.
Method
• Best practices for mitigation and/or alternatives include developing multimodal transportation systems that reduce reliance on automobiles and provide credible alternatives to driving. Managing vehicle demand using tiered
TDM strategies to influence travel behavior may be required if performance metrics aren’t being met.
Resources and Examples
• Redmond’s Transportation Master Plan is currently referenced by other areas as a good example of how to build a complete transportation system around new nodes of density. Other examples of best practices related to Transportation Master Plans and TDM include:
• Olympia Transportation Master Plan • Oregon Metro Congestion Pricing • City of Aspen Transportation Impact
Analysis Guidelines and TDM Program
Public Services Growth under the alternatives will affect a wide variety of public services, including police protection, fire and emergency medical services, parks, and schools. EIS authors will consider the following performance metrics, trends, and best practices.
Schools
Performance Metrics
Goal/Objective/ Indicator/ Performance Metric
• Plan for school facilities in Redmond to meet target teacher student ratios.
• Provide for attainable broadband access for home school and remote school use.
Method of Measure
• Lake Washington Six-Year Capital Facility Plan 2019-2024: Student Generation and Teacher Student Ratios.
• King County Broadband Study 2020 identifying unserved and households with lower incomes.
Redmond Priority
• Comprehensive Plan Goals for Redmond: To retain and enhance Redmond’s distinctive character and high quality of life, including an abundance of parks, open space, good schools, and recreational facilities.
• Comprehensive Plan Policy LU-30 Allow some compatible nonresidential uses in Residential zones, such as appropriately scaled schools, religious facilities, home
PRELIMIN
ARY DRAFT
20 | P a g e
occupations, parks, open spaces, senior centers, and day care centers. Maintain standards in the Redmond Zoning Code for locating and designing these uses in a manner that respects the character and scale of the neighborhood.
SEPA Threshold of Significance Considerations
• Define an impact if there is an increase in student demand and corresponding lack of capital facilities or broadband to serve demand.
Trends and Best Practices for Mitigation or Alternative
What are the Trends?
• Explore short-term and long-term implications of pandemic for service delivery and equitable access to education resources.
• Distributed learning models. • Potential partnerships with school sites and
parks and recreation providers.
Rationale/Why
• Given short-term and long-term trends, consider education capital facilities needs and broadband access in residential and mixed-use neighborhoods.
• Leverage municipal and school education and recreation resources, e.g. co-location.
Resources and Examples
• Homeschool “school” in Lake Washington School District:
https://emersonk12.lwsd.org/about-us/school-history.
• Minerva College: https://www.nytimes.com/2020/08/01/opinion/sunday/minerva-college-coronavirus.html.
• Smart Growth, Community Schools and Co-Location: https://planning.maryland.gov/Documents/OurProducts/Publications/ModelsGuidelines/mg27.pdf
Parks
Performance Metrics
Goal/Objective/ Indicator/ Performance Metric
• Provide a natural area or recreational opportunity within proximity of residents and employees.
• Meet parks LOS in Parks, Arts, Recreation, Culture and Conservation Element.
Method of Measure
• Access: Properties within a quarter mile of 100% of residents and 25% of workers in Redmond.
• Type: Measure LOS per PARCC Plan.
Redmond Priority
• Parks, Arts, Recreation, Culture and Conservation Element.
• PARCC Plan.
SEPA Threshold of Significance Considerations
• Less than 100% of residents or 25% of employees are within proximity to park feature.
• LOS standards unmet.
PRELIMIN
ARY DRAFT

21 | P a g e
Trends and Best Practices for Mitigation or Alternative
What are the Trends?
• Due to the COVID-19 Pandemic, parks and trails and access to them have become particularly important. Per National Recreation and Park Association, July 2020v, changes will occur in the short-term and long term, including:
• Redesign of common areas and public gathering spots to address flow of pedestrian traffic and maintaining social distancing.
• Retrofits of HVAC and air handling systems to reduce coronavirus loads.
• Importance of urban recreation, including transitioning rights of way to emphasize pedestrian and bicycles and outdoor dining.
• Impact to access to recreation and social contact for elderly and youth that are not able to participate in club sports.
• Use of parks and recreation to address health equity, food security, and hunger prevention where school-based programs are not feasible.
• Ability of parks and recreation to facilitate community gardens, farmers markets, and farm-to-table or community supported agriculture (CSA) cooperatives.
• Consider addressing equity of access and investment to lower income households and persons of color.
• Consider that increasing space for recreation in a dense urban environment could be at ground level or at upper levels.
• See Pike Place Urban Garden: https://www.seattleurbanfarmco.com/pike-place-urban-garden/.
• San Francisco, requirement to provide publicly accessible open space with new office space: https://www.bizjournals.com/sanfrancisco/news/2019/06/20/guide-to-secret-and-public-rooftops-downtown-sf.html
Rationale/Why Redmond will be growing in population and jobs, and its land base will not change much. The areas of growth will be in growth centers and along corridors. Reserving adequate space for parks and recreation and repurposing rights of way to connect the population to gathering spaces will be important.
Method
• PARCC Plan Strategies • Co-location of park, school, and
community/civic spaces. • Improving non-motorized connections to
parks. • Adding parks and recreation facilities as
population growth occurs.
Resources and Examples
• Parks, Arts, Recreation, Culture and Conservation Element.
• PARCC Plan. • Trust for Public Land ParkScore: 89% of
Redmond residents live within a 10-minute walk of a park. 15% of Redmond's city land is used for parks and recreation. See https://www.tpl.org/city/redmond-washington.
• National Recreation and Park Association PRORAGIS for benchmarking, and articles identifying trends and resources, including The Essential Role of Parks and Recreation.
PRELIMIN
ARY DRAFT

22 | P a g e
Police Protection
Performance Metrics
Goal/Objective/ Indicator/ Performance Metric
• LOS: Facilities and equipment sufficient to meet the demand for police services.
• Residents can fully and effectively access City services …and feel a sense of belonging and safety.
Method of Measure
• Measure capital needs based on demand per LOS.
• Per capita investment in police training, and equity strategies.
Redmond Priority
• Capital Facilities Element. • Strategic Plan Cultural Inclusion. • Equity Action Team.
SEPA Threshold of Significance Considerations
• LOS standards unmet. • Police training, and equity strategies – to be
determined.
Trends and Best Practices for Mitigation or Alternative
What are the Trends? City strategic plans for inclusion and police initiatives for equity action team are along the lines of trends including:
• Community Policing where there is a partnership with residents and law enforcement agencies.
• Balancing resources and duties of police departments, e.g. mental health interventions, and who is best provider/responder.
Rationale/Why The Comprehensive Plan is primarily about physical development though it addresses public service delivery. The City has initiated some operational goals around cultural inclusion and equity including in how it delivers its police services.
Method
• See performance metrics.
Resources and Examples
• Building Momentum from the Ground Up, PolicyLink and The Center for Popular Democracy, 2015: https://www.policylink.org/sites/default/files/JusticeInPolicing-9.pdf.
• Eugene, Oregon, CAHOOTS, Social Workers and Police: https://www.npr.org/2020/06/10/874339977/cahoots-how-social-workers-and-police-share-responsibilities-in-eugene-oregon.
PRELIMIN
ARY DRAFT

23 | P a g e
Fire and Emergency Medical Services
Performance Metrics
Goal/Objective/ Indicator/ Performance Metric
• LOS: Travel time of six minutes or less for 90 percent of emergency fire and medical calls in the city.
Method of Measure Due to lack of fire travel time model:
• Congestion measures per transportation. • Households per fire station.
Redmond Priority
• Capital Facilities Element
SEPA Threshold of Significance Considerations
• Negatively affect the response times. • Increased demand for special emergency
services beyond current operational capabilities.
Trends and Best Practices for Mitigation or Alternative
What are the Trends?
• The vast majority of calls for service are
medical rather than fire. As the population ages this is anticipated to continue. Ensuring aging in place and ability to lead active lifestyles would be important for community health. There is a balance in ensuring street designs that promote healthy active living as well as ensuring proper emergency access and staging.
• The population would densify in taller structures and there will be a need for urban fire suppression and associated equipment.
Rationale/Why
• See “What are the Trends.”
Method
• See performance metrics. Also suggest interfacing with Fire Department regarding best means to measure LOS short of model for citywide response times.
Resources and Examples
• Emergency Access in Healthy Streets, 2015, NACTO: https://nacto.org/wp-content/uploads/2015/04/Best-Practices-Emergency-Access-in-Healthy-Streets.pdf
Stormwater, Water, and Sewer The EIS will analyze conditions, impacts, and mitigation requirements for surface water and water resource improvements, water supply, and sewer infrastructure and capacity. EIS authors will consider the following performance metrics, trends, and best practices.
Stormwater
PRELIMIN
ARY DRAFT

24 | P a g e
Performance Metrics
Goal/Objective/ Indicator/ Performance Metric
• Prevent flooding. • Protect water quality. • Preserve natural stormwater systems.
Method of Measure
• Number of acres of undetained impervious area.
• Number of acres of untreated pollution generating impervious surface.
• While this is a function of the stormwater system this also falls under “Natural Environment” above.
Redmond Priority
• 2019 City of Redmond Stormwater Management Plan.
• Comprehensive Plan – Utilities Element: UT-36.
SEPA Threshold of Significance Considerations
• An impact is defined if the alternative would increase or decrease these metrics compared to the existing conditions.
Trends and Best Practices for Mitigation or Alternative
What are the Trends?
• Greater emphasis on low impact development (LID), infiltration and natural water quality treatment.
• Increased use of regional stormwater facilities in urban and urbanizing sub-areas.
• Climate change in the Puget Sound area is expected to produce an increase in wetter
winters, more frequent and more extreme precipitation events. Agencies are increasing climate resilience by providing operators and decision-makers with 1-hour precipitation forecasts and 1- to 48- hour rain accumulation totals that can be used to manage extreme precipitation risks at the neighborhood- or basin-scale in real-time and requiring all planning documents to include how climate change and extreme weather vulnerability are considered.
Rationale/Why
• Given the value and best use of the land, consider low impact on-site stormwater facilities vs. regional facilities in residential and mixed-use neighborhoods.
• Leverage open space and recreation needs and opportunities in conjunction with regional facilities.
• Given that in urban areas, more frequent and heavier rainfall events will increase the likelihood of runoff volumes that exceed stormwater design capacities, amplifying the potential for stormwater pollution, localized flooding, and combined sewer overflows, consider increasing Redmond’s climate resilience.
Resources and Examples
• Washington State DOE Low Impact Development (LID) guidance: https://ecology.wa.gov/Regulations-Permits/Guidance-technical-assistance/Stormwater-permittee-guidance-resources/Low-Impact-Development-guidance
• City of Redmond Regional Stormwater Facilities: https://www.redmond.gov/497/Regional-Stormwater-Facilities
• City Parks, Clean Water:
PRELIMIN
ARY DRAFT

25 | P a g e
https://www.tpl.org/sites/default/files/City%20Parks%20Clean%20Water%20report_0.pdf
• Parks can Play a Major Role in Managing Stormwater: https://landstudies.com/parks-can-play-major-role-managing-stormwater/
• Climate Change Impacts for Stormwater Management in Puget Sound: https://cig.uw.edu/wp-content/uploads/sites/2/2014/11/TNC_Stormwater_final_3_24.pdf
Water/Sewer
Performance Metrics
Goal/Objective/ Indicator/ Performance Metric
• Reduce average annual and peak day use. • Increase conversion from onsite wastewater
disposal systems as sewer lines. • Remove stormwater connections to the
sanitary sewer system.
Method of Measure
• Average annual and peak day water usage. • Number of on-site septic systems. • Number of stormwater connections
removed from sanitary sewer system.
Redmond Priority
• Comprehensive Plan – Utilities Element: UT-19, UT-33, UT-34, UT-35.
SEPA Threshold of Significance Considerations
• An impact is defined if the alternative would increase or decrease these metrics compared to the existing conditions.
Trends and Best Practices for Mitigation or Alternative
What are the Trends?
• Explore short-term and long-term
implications of increase in work-from-home and school-from-home on residential water/sewer usage vs. commercial/office space water usage.
Rationale/Why
• Given short-term and potential long-term trends of increase in residential water/sewer use and decrease in commercial/office water/sewer use; also consider the changing water supply needs between various types of land use.
Resources and Examples
• How the Coronavirus Pandemic is Affecting Water Demand: https://pacinst.org/how-the-coronavirus-pandemic-is-affecting-water-demand/.
• US home water use up 21% daily during COVID-19 crisis: https://www.techrepublic.com/article/us-home-water-use-up-21-daily-during-covid-19-crisis/.
PRELIMIN
ARY DRAFT

26 | P a g e
The City of Redmond assures that no person shall, on the grounds of race, color, national origin, or gender, as provided by Title VI of the Civil Rights Act of 1964 and the Civil Rights Restoration Act of 1987, be excluded from participation in, be denied the benefits of, or be otherwise subjected to discrimination under any program or activity. For more information about Title VI, please visit redmond.gov/TitleVI.
无歧视声明可在本市的网址 redmond.gov/TitleVI 上查阅
El aviso contra la discriminación está disponible en redmond.gov/TitleVI.
PRELIMIN
ARY DRAFT


