13
TRENDS AND BEST PRACTICES: Succession Planning and Incentive Compensation WEALTH ADVISORY | OUTSOURCING | AUDIT, TAX, AND CONSULTING ©2016 CliſtonLarsonAllen LLP CLAconnect.com

TRENDS AND BEST PRACTICES:
Succession Planning and Incentive Compensation
WEALTH ADVISORY | OUTSOURCING | AUDIT, TAX, AND CONSULTING
©2016 CliftonLarsonAllen LLP
CLAconnect.com

CLA has just completed the 2015 LeadingAge-Chief Executives of Multi-Practice Organizations (CEMO) Leadership Compensation Survey©, a study focused on multi-site aging-services organizations. More than 129 multi-site organizations were surveyed representing a broad sampling of geography and size.
The purpose of the study was to provide multi-site aging-services organizations with data on executive compensation levels, trends, and practices. This document focuses on two areas of immediate interest to boards: succession planning and incentive compensation.

Succession PlanningThe 2015 study found that a large percentage of CEOs will be retiring in the next five years. The table below highlights the current average age of the CEO, CFO, and COO positions in the surveyed organizations.
Internal successionLeadership programs (developed by LeadingAge and other organizations) help develop individuals within organizations. Coupled with internal programs that promote rotations through different roles in organizations, such programs could help create internal succession programs.
External hiresAbsent a logical internal candidate, most organizations undertake executive searches hoping to attract and create opportunities for individuals within the industry. As the survey notes, there will likely be a lot of competition for those candidates.
CLA has helped many organizations place senior executives, and the process is time consuming, laborious, and challenging for all parties involved. Organizations may also find external searches to be difficult given the small pool of candidates.
Outside of the industryAlthough it may not be ideal to look for leaders outside of the aging-services industry, it could prove to be an effective option if organizations have a strong culture, efficient processes, and strong board leadership.
Strategic affiliationA recent option for boards evaluating succession has been the exploration of strategic affiliations where leadership may transition as part of an affiliation with another organization. While it is not recommended that succession planning be the impetus for an affiliation, a strategic benefit of such affiliation may very well be to deepen the executive ranks and build a succession organization that can also benefit from the immediate transition in leadership. If the strategic plan indicates that affiliation is a logical step for the organization, it may align well with a succession plan.
Succession planning practicesThe following are key elements in a successful transition:
• Board involvement — Succession planning has to be led by the board and, ultimately, has to achieve the board’s objectives. For example, beyond ensuring that a plan is developed, boards should know their full executive team and others within the organization who may be future succession
©2016 CliftonLarsonAllen LLP
CLAconnect.com3
Job/Level 2015 Count
2015 Current
(Average) Incumbent
Age
2015 Current
(Average) Years of Service
2015 Average of Years of
Service at CEO
Retirement
2015 Average of Remaining Years at CEO Retirement
CEO 113 58.2 16.5 23.3 NA
CFO 107 53.3 11.0 17.8 5.4
COO 66 53.6 12.8 19.6 5.9
Overall 286 55.3 13.6 20.4 3.4
It is important to note that in the table above, those executives (CEOs) older than 65 have been excluded. Of the surveyed organizations, 16.8 percent were already past 65 years of age. Including these individuals, 43 percent of the CEOs in the 2015 analysis are already or will reach age 65 in less than five years, less than the 48 percent noted in the 2014 study, but still a large cohort.
Anecdotally, CEOs of single-site aging-services organizations appear to be mirroring these trends. With that said, the overall average age of the CFO and COO relative to the CEO is also cause for concern. Although they are the most likely candidates for succession (if chosen internally), the CFO and COO will serve only a few years before their own retirements.
This information suggests that now would be a good time for boards to focus on the evaluation of succession plans. We will discuss elements of a succession plan, but as organizations develop succession plans, they will most likely choose one of the following courses of action:
1. Develop a succession model that “favors” internal successor development;2. Hire externally, but within the industry;3. Hire from outside the industry; or4. Affiliate with a similar minded organization to access executive talent.
©2016 CliftonLarsonAllen LLP
CLAconnect.com4
candidates. The board can gauge the depth of the knowledge within the organization while getting to know who is coming up in the ranks. Ensuring that leaders present to the board and are familiar with board workings is one way that boards can spend time with potential succession candidates.
• Strategic alignment — The plan needs to explore where the organization is headed. The successor profile must be determined based on the organization’s direction. Without a meaningful strategic plan, development and programs cannot be put in place to grow the right type of successors who will have the skills and experience to guide the organization into the future.
• Performance measures — Make sure that there are measurable elements of the succession plan. For example, if the plan is to rotate certain leadership candidates through different departments or experiences, how do you measure the success of those exercises?
• Written plan — A plan should be in place for unexpected transitions. Whether through death, poor performance, or mobility, C-suite individuals do leave their organizations. A written plan documents the roles of leadership positions in an emergency transition.
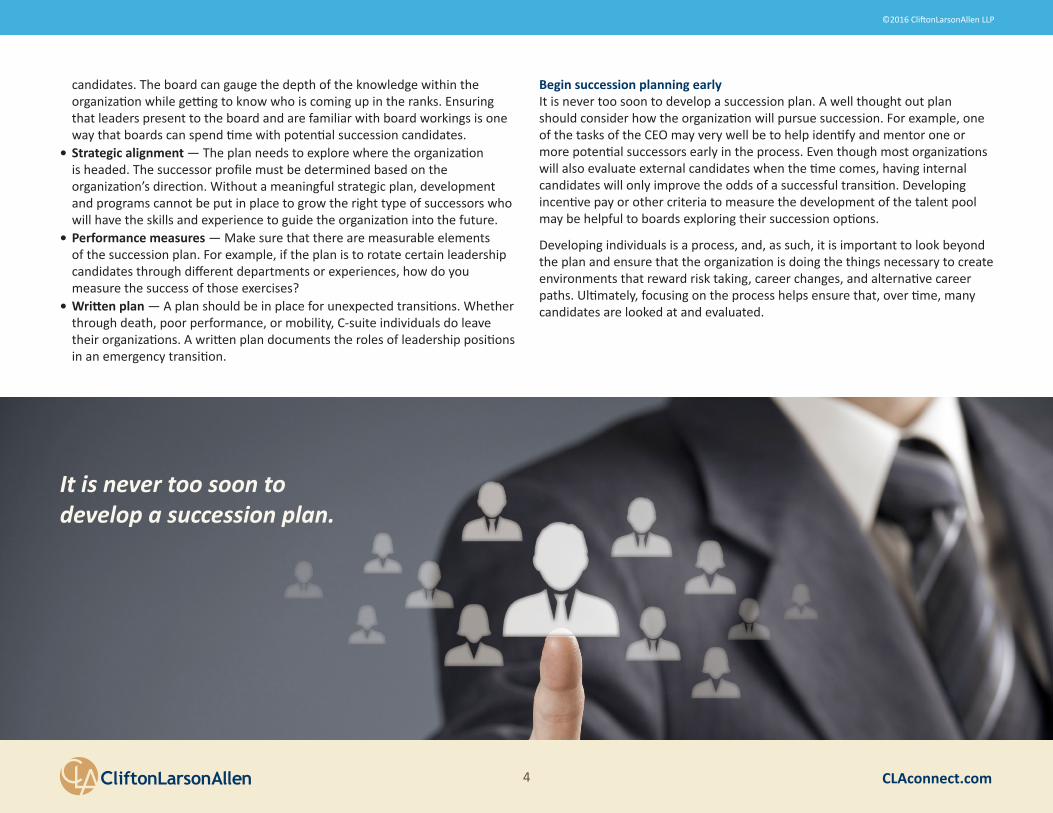
Begin succession planning earlyIt is never too soon to develop a succession plan. A well thought out plan should consider how the organization will pursue succession. For example, one of the tasks of the CEO may very well be to help identify and mentor one or more potential successors early in the process. Even though most organizations will also evaluate external candidates when the time comes, having internal candidates will only improve the odds of a successful transition. Developing incentive pay or other criteria to measure the development of the talent pool may be helpful to boards exploring their succession options.
Developing individuals is a process, and, as such, it is important to look beyond the plan and ensure that the organization is doing the things necessary to create environments that reward risk taking, career changes, and alternative career paths. Ultimately, focusing on the process helps ensure that, over time, many candidates are looked at and evaluated.
It is never too soon to develop a succession plan.

©2016 CliftonLarsonAllen LLP
CLAconnect.com5
Incentive CompensationEffective succession planning depends, in part, on retaining top talent in a very competitive environment, while ensuring that the goals of the organization are met. Incentive compensation can help boards achieve these goals, as well as provide concrete ways to evaluate performance.
2014 Survey 2015 Survey
PositionPercent
Receiving Incentive
Incentive as
Percentage of Base
Percent Receiving Incentive
Incentive as
Percentage of Base
Average Incentive
($000s)
Chief Executive Officer 43% 17% 46% 16% $59.2
Top Operations Executive/COO 34% 12% 42% 14% $34.7
Top Financial Executive/CFO 39% 12% 36% 15% $34.6
Operations VP/Director 40% 13% 38% 12% $20.8
VP of HUD 35% 12% 19% 26% $41.4
Chief Administrative Officer 43% 33%
Top Marketing Executive 38% 16% 35% 18% $28.5
Top Legal Executive 35% 10% 25% 15% $41.7
Top Human Resources Exec 36% 11% 36% 11% $17.9
Top Facilities/Construction Executive 31% 11% 29% 13% $21.6
Top Strategic/Long Range Planning Exec 46% 11% 29% 15% $28.0
Top Fund Development Exec 31% 13% 27% 12% $16.7
Top MIS Executive 37% 11% 28% 10% $16.5
Top Quality Assurance/ Healthcare Exec 49% 10% 32% 46% $15.4
Top/Chief Compliance Officer 31% 9% 29% 8% $10.5
Executive Director-Multiple Facilities 59% 16% 31% 10% $16.9
Executive Director-Single Facility 34% 12% 23% 12% $17.2
Average 39% 13% 32% 15% $28.7
The prevalence of formal incentive programs has continued to rise steadily with 46 percent of the CEOs in the total sample receiving an incentive in the year 2015 (3 percent more than in 2014).
Formal incentive plans continue to emphasize an organization’s mission with a balance of financial and operating metrics. The use of incentives, organization size, and CEO pay correlate strongly with positive organizational results. It is clear that top performing organizations pay incentives more frequently and in larger amounts. (It is important to note that total cash compensation does not necessarily correlate with higher profit margins.)
In the chart above, we have identified corporate positions present in at least half of the corporate/home office survey participant organizations (facility executive directors omitted) and added up each organization’s total cash compensation cost across these positions. These eight are the same positions that were included in the prior years’ analyses and can be considered the core executive group among most CEMO organizations. As noted, it is clear that total cash compensation for this group increases as the size of the organization increases.
$4,500
$4,000
$3,500
$3,000
$2,500
$2,000
$1,500
$1,000
$500
$-$ $50,000 $100,000 $150,000 $200,000 $250,000 $300,000 $350,000 $400,000
Tota
l Cas
h To
tal C
ost
($0
00)
y = 0.0052x + 706.76R2 = 0.5138
Operating Revenue ($000)
Note: 2014 survey result data sourced to Rodeghero Consulting, the author of the 2014 study.
©2016 CliftonLarsonAllen LLP
CLAconnect.com6
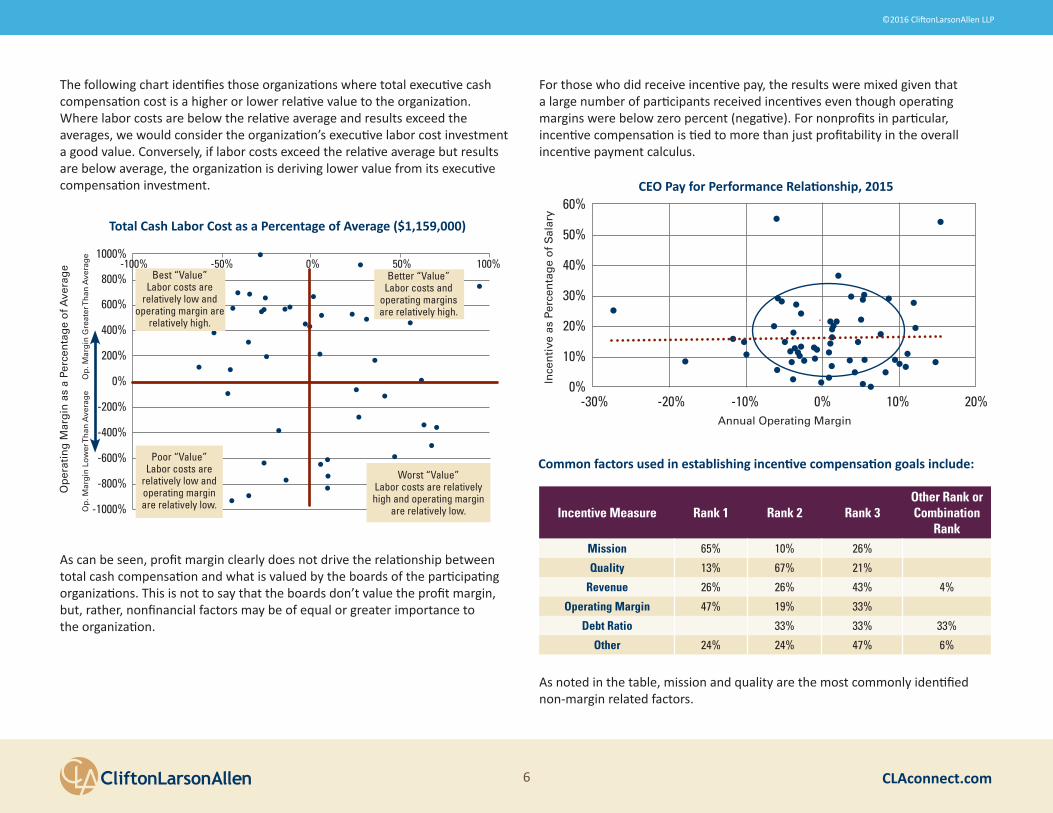
The following chart identifies those organizations where total executive cash compensation cost is a higher or lower relative value to the organization. Where labor costs are below the relative average and results exceed the averages, we would consider the organization’s executive labor cost investment a good value. Conversely, if labor costs exceed the relative average but results are below average, the organization is deriving lower value from its executive compensation investment.
As can be seen, profit margin clearly does not drive the relationship between total cash compensation and what is valued by the boards of the participating organizations. This is not to say that the boards don’t value the profit margin, but, rather, nonfinancial factors may be of equal or greater importance to the organization.
For those who did receive incentive pay, the results were mixed given that a large number of participants received incentives even though operating margins were below zero percent (negative). For nonprofits in particular, incentive compensation is tied to more than just profitability in the overall incentive payment calculus.
Incentive Measure Rank 1 Rank 2 Rank 3Other Rank or Combination
RankMission 65% 10% 26%
Quality 13% 67% 21%
Revenue 26% 26% 43% 4%
Operating Margin 47% 19% 33%
Debt Ratio 33% 33% 33%
Other 24% 24% 47% 6%
Common factors used in establishing incentive compensation goals include:
As noted in the table, mission and quality are the most commonly identified non-margin related factors.
1000%
800%
600%
400%
200%
0%
-200%
-400%
-600%
-800%
-1000%
Op
erat
ing
Mar
gin
as
a Pe
rcen
tag
e o
f Ave
rag
e
Op
. Mar
gin
Lo
wer
Th
an A
vera
ge
O
p. M
arg
in G
reat
er T
han
Ave
rag
e
-100% -50% 0% 50% 100%
Worst “Value”Labor costs are relatively high and operating margin
are relatively low.
Poor “Value”Labor costs are
relatively low and operating margin are relatively low.
Better “Value”Labor costs and
operating margins are relatively high.
Best “Value”Labor costs are
relatively low and operating margin are
relatively high.
Total Cash Labor Cost as a Percentage of Average ($1,159,000)60%
50%
40%
30%
20%
10%
0%-30% -20% -10% 0% 10% 20%
Ince
nti
ve a
s Pe
rcen
tag
e o
f S
alar
y
Annual Operating Margin
CEO Pay for Performance Relationship, 2015
©2016 CliftonLarsonAllen LLP
CLAconnect.com7
Conclusion and recommendations on incentive pay• The fundamental basis for any incentive compensation program is simple:
It should equitably and consistently recognize and compensate employees for superior performance.
• Incentive-based compensation is becoming much more common because of the increased emphasis on performance and competition for talent.
• Government is using pay-for-performance to redirect reimbursement under health care reform, making it more popular and acceptable within health care and continuing care.
• Setting up an incentive-based compensation program requires the same research into the industry as the base pay program. It may work best when it serves as a component of a board approved/managed compensation plan.
• An individual incentive program motivates staff to exert more effort because extra compensation is paid only to those who perform above the established metrics.
– A well-crafted and effective incentive compensation program should◊ Direct individual behavior toward achieving established
organizational goals.◊ Be designed to affect favorable change within your organization.◊ Allow a substantial portion of compensation to be a variable cost.
Ideally, the plan should reward results rather than actions. – To be fair and equitable, an incentive plan should cover all members of a
group, i.e. senior leadership. – Plans that cover the CEO only may be designed by the board. Under
the assumption that the CEO develops the annual operational plan and directs the use of resources, human and financial, the goals are generally operational but may also be strategic.
– The IRS has provided some guidance to nonprofits in the ruling known as Intermediate Sanctions. Discretionary bonuses are generally not acceptable as they are not objective nor results based. The incentive compensation should be based on performance results and truly at risk.
Incentive compensation improves employee motivation and morale.

©2016 CliftonLarsonAllen LLP
CLAconnect.com8
• Plans generally cover a single year. Longer-term plans are related to long-term strategic or performance improvement plans and are inherently more difficult to administer.
• Incentive compensation is generally at risk and is not paid if goals are not achieved.
Organizations implementing incentive plans for the first time are encouraged to start small and learn from their experiences. While CEMO indicates the average CEO incentive plan represents 17 percent of base compensation, a graduated approach is recommended. For example, if 15 percent is the target for incentive compensation as a percentage of base compensation, a three year plan of 5 percent, 10 percent, and 15 percent will provide the needed experience to effectively administer the plan and reduce the risk of failure.
Appendix A – Incentive CompensationAdvantages:• Provides the opportunity to develop employees who underperform• Motivates staff to exert more effort in key areas that may bring the greatest
advantage to the organization• Improves employee motivation and morale• Increases employee productivity and job performance• Increases retention of high performers• Increases ability of the organization to achieve its objectives• Potentially lowers costs, through increased productivity and efficiency
Risks:• Incentive plans are common, but satisfaction with them is not. Surveys of
human resource executives consistently show that incentive plans often do not live up to expectations.
• There is a risk for poorly designed incentive plans to backfire.• Goals and targets should be clearly defined and communicated. In many
cases, plans fail because people do not understand them, or the logic is flawed.
• Incentive compensation plans reward employees for business related performance that is usually based on results rather than traditional cost of living, seniority, or hours worked.
• Incentive compensation plans can redirect focus away from other important areas of operations. Care should be taken to assure that the incented goals are not achieved at the expense of other areas of operations.
• While most are, not all executives are motivated by money.
General guidelines:• Incentive compensation may work best when it is part of a board approved
and managed executive compensation plan. Discretionary bonuses should be avoided.
• Goals must be clear, measureable, and based on easily understood metrics.• Goals may be related to mission, quality, operating revenue, operating margin,
debt service ratio or related debt covenants, and other organizational goals.

©2016 CliftonLarsonAllen LLP
CLAconnect.com9
Appendix B – Typical Goals for an Incentive Compensation PlanTypical performance improvement goals • Occupancy percentage• Payor mix• Productivity — revenue per FTE• Revenue per occupied bed• EBITDA percentages• Operational revenue per occupied bed day• Bad debt expense as a percentage of operating revenue• Debt service coverage• Days cash• Days in accounts receivable• Fundraising percentage increase• Employee and resident satisfaction scores• Attrition reduction• Insurance expense per bed (annually)• Interest expense per bed (annualized)• Dietary costs per occupied bed and per meal• Employee benefits as a percentage of total salaries• Costs as a percentage of total expense
– Administration – Support services – Nursing care – Direct care as a percentage of total costs – Direct care cost per resident day (RNs, LPNs, aides)
• Direct care cost per resident day (RNs, LPNs, aides)• Ancillary costs and services per resident day• Average hourly wages
• Contract/temporary nursing costs per resident day• Labor costs (salary and benefits) per resident day• Direct care labor cost as a percent of total labor cost• Cost/revenue ratios for pharmacy (margin)• Cost/revenue ratios for therapies (margin)• Others as may be determined by the board to improve, sustain,
or grow the organization.
Sample language: executive compensation plan Executive incentive plan The executive incentive plan will provide compensation as an incentive to improve organizational and departmental (e.g., nursing home) financial results and achieve the organization’s mission objectives. At this time, the plan is designed for the use of the board in evaluating and compensating the CEO. However, the policies and procedures are established to cover any executive staff member who may participate in an incentive compensation program. When approved, the rules established by the board become the policy and standards for all employees. As the plan is tested and better understood, it may, at the discretion of the board of directors, be extended to include other key executives and officers of the corporation, and may be included in the related executive definitions by the IRS.Target award levels will be earned when pre-defined and approved goals, set by the board of directors, and/or individual goals are fully attained. No incentive compensation award can be paid when performance is below established goals and larger amounts (up to the approved maximum) may be provided when performance exceeds the established goals. No awards will be paid under the executive incentive plan if threshold performance levels are not achieved.
Performance expectations will be articulated in advance with clear, measurable, and written objectives, and performance feedback will be provided throughout the year. These expectations, in the form of measurable goals, will be predetermined annually by the governance committee, in consultation with the CEO, and will be approved by the board.

©2016 CliftonLarsonAllen LLP
CLAconnect.com10
Appendix C – Sample Incentive Compensation Plan
Goal Threshold Target StretchFinancial Viability
(Weight – 50%) (or $5,000)
33% 66% 100%
Annual Return on Net Revenue
(assume $1,500 of $5,000)
Exceeds previous year by 2%
($500 if completed)
Exceeds previous year by 3%
($1,000 if completed)
Exceeds previous year by 4%
($1,500 if completed)
Creates Cash Reserves
(assume $1,500 of $5,000)
Equal to one month of operating revenue
($500 if completed)
Equal to two months of operating revenue
($1,000 if completed)
Equal to three months of operating
revenue($1,500 if completed)
Develops Marketing Plan Focused on
Improving Census
($2,000 of $5,000)
Overall census improves by 1% over
previous year-end
($660 if completed)
Overall census improves by 2% over
previous year-end
($1,320 if completed)
Overall census improves by 3% over
previous year-end
($2,000 if completed)
Goal Threshold Target StretchHuman Resources
(Weight – 30%) (or $3,000)
33% 66% 100%
Reduces Overall Employee Attrition
(assume $1,500 of $3,000)
Average employee turnover in all departments is 2%
less than previous year-end total
($500 if completed)
Average employee turnover in all departments is 4%
less than previous year-end total
($1,000 if completed)
Average employee turnover in all departments is 6%
less than previous year-end total
($1,500 if completed)
Human Resource – Improvements
Presents and board approves alternative
staff scheduling options
Presents a
formal evaluation of employee benefits, including pension
Presents plan
to make (XYZ) a preferred employer
(assume $1,500 of $3,000)
Completesone of three
($500 if completed)
Completestwo of three
($1,000 if completed)
Completesthree of three
($1,500 if completed)
2016 Incentive Plan Goal Metrics Calculation Example: Assume Total Incentive Compensation available is $10,000.

©2016 CliftonLarsonAllen LLP
CLAconnect.com11
Goal Threshold Target StretchResident Life/ Participation
(Weight – 10%) (or $1,000)
33% 66% 100%
Measuring Resident Satisfaction
(assume $1,000)
Develops and presents
measurement system for board approval
($333 if completed)
Implements resident satisfaction survey
($666 if completed)
Presents results with plan to improve in
areas of low scores
($1,000 if completed)
Goal Threshold Target StretchContinuum
(Weight – 10%) (or $1,000)
33% 66% 100%
Develop Strategy for Clinical Home and Community-Based
Services
(assume $1,000)
Presents formal plan to the board and board approves
($333 if completed)
Implements one major plan initiative
approved by the board
($666 if completed)
Implements two major initiatives
approved by the board
($1,000 if completed)
Incentive compensation calculations:• The sample calculations are provided for illustration purposes only.• The board establishes the goals and weighting for the CEO incentive
compensation based on the mission and strategic and operational goals of most importance to the organization for the coming year. Professional goals may be included at the discretion of the board.
• In cooperation with the compensation committee, the CEO may establish the goals and weighting for the senior leadership team.
• A fixed dollar amount (maximum) or a percentage of salary is selected by the compensation committee to represent the maximum potential incentive compensation amount for each eligible participant.
• The weighting determination is used to calculate the percentage of the total amount assigned to each category.
• Subsequent weighting for specific goals may be designed to place greater emphasis and compensation on these goals.
• In the illustration, $10,000 has been assigned to the plan as the maximum for simplicity of the illustration.
• In each goal category, the maximum amount is assigned based on the board-approved percentages.
• The calculation then shows the potential achievement of each goal based on: – Threshold at 33 percent – Target at 66 percent – Stretch at 100 percent (maximum)
• Goal achievement is generally reviewed and determined with incentive compensation awards calculated in the first quarter or 90 days following the close of the fiscal year, allowing for year-end operating results to be determined from the organizational audit or final year-end financial statements.

©2016 CliftonLarsonAllen LLP
CLAconnect.com12
Appendix D – Definitions and ResourcesDefinitions Incentive compensation – a reward system for an individual or group that motivates staff to exert more effort because extra compensation is paid only to those who perform above the established metrics. It is based on a series of predetermined goals that must be measureable. It is generally considered at risk compensation meaning if not achieved, it is not earned.
At-risk compensation – not earned if measureable goals are not met.
Base compensation (salary) – Guaranteed cash earnings received during one year; salary data does not include the cost/value of benefits.
Total cash compensation (TCC) – Fixed cash compensation and any additional cash incentives or bonuses received during one year.
Total compensation and retirement – Fixed cash compensation, additional cash incentives or bonuses, and retirement amount funded during one year. (This does not include the value or cost of health and welfare benefits.)
AuthorsMario Mckenzie, Principal Mario is a partner with CLA specializing in aging-services. In that role, he leads the executive compensation services team along with Bob Morrow. Mario also has extensive experience in:
• Strategic planning• Financial feasibility studies• Market analyses• Strategic capital planning• Facilities master planning• Operations assessments and benchmarking• Acquisition or sell side due diligence
Mario received a master’s degree in accounting from the University of South Florida. Prior to his studies Mario served in the U.S. Army as a medic.
Robert Morrow, Principal Bob is a principal with CLA specializing in aging-services. He leads the executive compensation services team along with Mario Mckenzie. Bob Morrow also has extensive experience in:
• Operations assessments• Executive search• Compensation planning• Succession planning• Facilities master planning• Affiliations and acquisitions
Bob holds a master’s degree in health services administration from Gannon University and has held a Nursing Home Administrator’s license since 1977.
ResourcesLeadership Compensation Survey
Incentive Pay Programs Mike Schraeder – Auburn University J. Bret Becton – Auburn University, Montgomery
Incentive Compensation Paul L. Schumann, Ph.D. Professor of Management
Federal Reserve System FDR # OP 1374 – Guidance on Sound Incentive Compensation Policies Federal Register: June 25, 2010 (Volume 75, Number 122) DOCID: fr25jn10-64 FR Doc 2010-15435
IRS – Intermediate Sanctions
©2016 CliftonLarsonAllen LLP
CLAconnect.com13
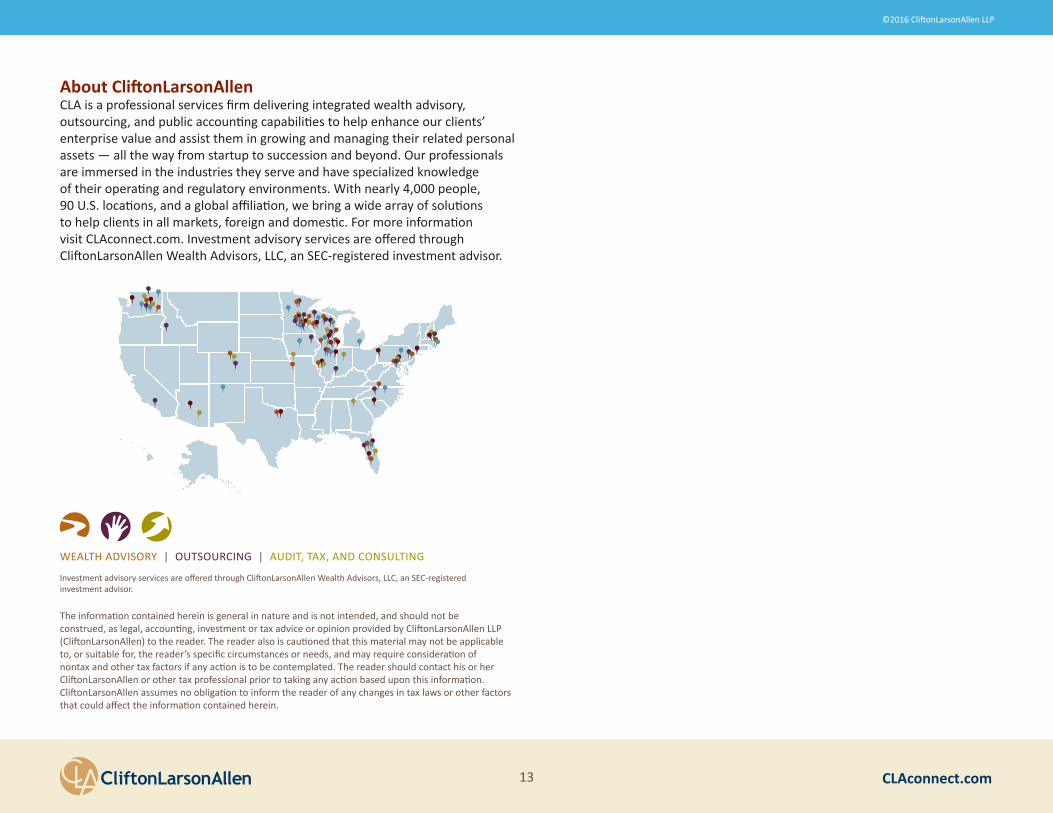
About CliftonLarsonAllenCLA is a professional services firm delivering integrated wealth advisory, outsourcing, and public accounting capabilities to help enhance our clients’ enterprise value and assist them in growing and managing their related personal assets — all the way from startup to succession and beyond. Our professionals are immersed in the industries they serve and have specialized knowledge of their operating and regulatory environments. With nearly 4,000 people, 90 U.S. locations, and a global affiliation, we bring a wide array of solutions to help clients in all markets, foreign and domestic. For more information visit CLAconnect.com. Investment advisory services are offered through CliftonLarsonAllen Wealth Advisors, LLC, an SEC-registered investment advisor.
The information contained herein is general in nature and is not intended, and should not be construed, as legal, accounting, investment or tax advice or opinion provided by CliftonLarsonAllen LLP (CliftonLarsonAllen) to the reader. The reader also is cautioned that this material may not be applicable to, or suitable for, the reader’s specific circumstances or needs, and may require consideration of nontax and other tax factors if any action is to be contemplated. The reader should contact his or her CliftonLarsonAllen or other tax professional prior to taking any action based upon this information. CliftonLarsonAllen assumes no obligation to inform the reader of any changes in tax laws or other factors that could affect the information contained herein.
WEALTH ADVISORY | OUTSOURCING | AUDIT, TAX, AND CONSULTING
Investment advisory services are offered through CliftonLarsonAllen Wealth Advisors, LLC, an SEC-registered investment advisor.


