Date post: | 16-Aug-2019 |
Category: |
Documents |
Upload: | phungkhanh |
View: | 217 times |
Download: | 1 times |
Trends and uncertainties in Siberian indicators of 20thcentury warming
J A N E S P E R *w , D AV I D F R A N K *, U L F B U N T G E N *, A N N E V E R S T E G E *, R A S H I T M .
H A N T E M I R O V z and A L E X A N D E R V. K I R D YA N O V §
*Swiss Federal Research Institute WSL, Zurcherstrasse 111, 8903 Birmensdorf, Switzerland, wOeschger Centre for Climate Change
Research, Erlachstrasse 9a, 3012 Bern, Switzerland, zLaboratory of Dendrochronology, Institute of Plant and Animal Ecology, Ural
Branch of Russian Academy of Sciences, 8 Marta Street, 222, Ekaterinburg 620144, Russia, §V. N. Sukachev Institute of Forest SB
RAS, 660036 Krasnoyarsk, Akademgorodok, Russia
Abstract
Estimates of past climate and future forest biomass dynamics are constrained by
uncertainties in the relationships between growth and climatic variability and uncertain-
ties in the instrumental data themselves. Of particular interest in this regard is the boreal-
forest zone, where radial growth has historically been closely connected with temperature
variability, but various lines of evidence have indicated a decoupling since about the
1960s. We here address this growth-vs.-temperature divergence by analyzing tree-ring
width and density data from across Siberia, and comparing 20th century proxy trends with
those derived from instrumental stations. We test the influence of approaches considered
in the recent literature on the divergence phenomenon (DP), including effects of tree-ring
standardization and calibration period, and explore instrumental uncertainties by em-
ploying both adjusted and nonadjusted temperature data to assess growth-climate
agreement. Results indicate that common methodological and data usage decisions alter
20th century growth and temperature trends in a way that can easily explain the post-1960
DP. We show that (i) Siberian station temperature adjustments were up to 1.3 1C for
decadal means before 1940, (ii) tree-ring detrending effects in the order of 0.6–0.8 1C, and
(iii) calibration uncertainties up to about 0.4 1C over the past 110 years. Despite these large
uncertainties, instrumental and tree growth estimates for the entire 20th century warming
interval match each other, to a degree previously not recognized, when care is taken to
preserve long-term trends in the tree-ring data. We further show that careful examination
of early temperature data and calibration of proxy timeseries over the full period of
overlap with instrumental data are both necessary to properly estimate 20th century long-
term changes and to avoid erroneous detection of post-1960 divergence.
Keywords: boreal forest, climate data, proxy data, Siberia, tree-rings, wood density
Received 28 January 2009 and accepted 30 January 2009
Introduction
Recent work has described a disassociation of tree
growth from temperatures in high latitude environ-
ments (overview in D’Arrigo et al., 2008). This disasso-
ciation is meanwhile widely recognized as the
‘divergence phenomenon’ (DP) and effectively de-
scribes systematic differences in the trends of summer
temperature and radial tree growth. Specifically, greater
increases in temperature than in growth are reported
since about the 1960s. DP was reported to be strongest
in Siberia (Briffa et al., 1998), but is also indicated in
other high latitude regions of the Northern Hemisphere
(Jacoby & D’Arrigo, 1995; Briffa et al., 1998; Barber et al.,
2000; Jacoby et al., 2000; Lloyd & Fastie, 2002; Driscoll
et al., 2005; Wilmking et al., 2005; Lloyd & Bunn, 2007;
Wilson et al., 2007; D’Arrigo et al., 2008). If DP would
remain as a widespread feature of boreal tree growth,
this would limit the skill of tree-ring based climate
reconstructions to properly estimate temperature varia-
tions during preinstrumental warm periods (Esper
et al., 2005b), such as the Medieval Warm Period (Lamb,
1965). Shifting growth/climate relationships would also
complicate future carbon budgets (Malhi et al., 2002;
Correspondence: Jan Esper, Swiss Federal Research Institute WSL,
Zurcherstrasse 111, 8903 Birmensdorf, Switzerland, tel. 1 41 44 739
2510, fax 1 41 44 739 2515, e-mail: [email protected]
Global Change Biology (2010) 16, 386–398, doi: 10.1111/j.1365-2486.2009.01913.x
386 r 2009 Blackwell Publishing Ltd
IPCC, 2007), as 21st century tree growth, and thus
carbon uptake, will be slower than expected based upon
20th century tree-ring/temperature associations.
While these globally relevant trends and feedbacks
are prone to uncertainties (Houghton, 2003), the regio-
nal instrumental climate data, that are used to both
calibrate tree growth trends and testify to the past
warming, also contain error. This is, for example, illu-
strated by the substantial uncertainty bands accompa-
nying the timeseries averaging land temperatures north
of 651N (IPCC, 2007, p. 249). In the entire Siberian area
east of the Ural Mountains and north of 601N, data from
only 13 instrumental climate stations are available in
1910. Further, data from six of these stations are not
reported after 1990 coinciding with major political
changes in the former USSR. Station records also con-
tain a number of missing values, and their low fre-
quency variations are frequently biased by nonclimatic
trends, which may or may not be adjusted before
integration in larger scale data compilations (Lands-
berg, 1981; Karl et al., 1988; Parker, 1994; Peterson et al.,
1998; Hansen et al., 1999; Bohm et al., 2001; Arnfield,
2003; Bohm et al., 2009). As a consequence, uncertainties
in regional climate data not only obscure the estimation
of 20th century temperature trends – and prediction of
these – but also complicate the calibration of tree-ring
proxy data (Frank et al., 2007a).
In this paper, we address these uncertainties in both
proxy and instrumental data using a network of 78 tree-
ring sites and 13 temperature stations (with data before
1910) from across Siberia. The tree-ring data represent a
large collection of boreal-forest sites visited in 1991, i.e.
1990 is the last complete ring (Schweingruber, 1993, 2002;
Schweingruber & Briffa, 1996b), as well as some newly
developed data (Hantemirov & Shiyatov, 2002; Knorre
et al., 2006). This update allows an investigation of
growth over the important last decade of the 20th cen-
tury. The old and new tree-ring collections are used to
test the relevance of a number of methodological choices
as applied in the recent literature on radial growth
dynamics, including the effect of (i) tree-ring detrending
on the preservation of long-term chronology trend, and
(ii) early (pre-1941) vs. late (post-1940) proxy calibration
on the emergence of DP. We link these tests on chronol-
ogy trend and DP size with estimates of instrumental
data uncertainty derived from (iii) the difference between
raw and adjusted temperatures from the 13 long-term
climate stations in Siberia. For all these approaches (i–iii)
we calculate residual timeseries (in 1C) to allow for a
comparison of the various uncertainties back to 1880.
Tree-ring and temperature data, and the approaches
used to analyze these data are presented in the ‘Materi-
als and methods’ . Results are organized as follows: we
first present the 1990 tree-ring network and detail the
effects of detrending and calibration techniques on
trend preservation and DP. We then present the results
obtained from the proxy update to 2000, and finally
compare proxy, instrumental, and calibration residual
timeseries. Results are discussed with focus on their
relevance to the ongoing debate on DP and accuracy of
temperature trends across Siberia.
Materials and methods
Proxy data
Tree-ring data from high latitude environments north of
601N and east of 601E were aggregated (Fig. 1). These
include 3075 samples from 60 larch, 12 spruce, and six
pine sites in Siberia (Table 1, see supporting informa-
tion: Tree-ring data). Seventy of these 78 datasets con-
tained not only tree-ring width (TRW) but also
maximum latewood density (MXD) measurements
(Schweingruber, 1993; Schweingruber & Briffa, 1995,
1996a; Hantemirov & Shiyatov, 2002; Kirdyanov et al.,
2007), thus allowing for a comparison of trends in wood
density and radial increment.
Correlation based cluster analysis (Friedrichs et al.,
2008) revealed eight spatially coherent clusters that
roughly reflected Siberian orography (Fig. 1): trees in
clusters C1–C3 were all located in an area west of 1001E,
clusters C4–C6 were located east of 1001E but also
included some far northern sites east of 1501E, and
cluster C7 was centered south of the Cherskiy Moun-
tains between about 150 and 1601E. Correlations be-
tween TRW and MXD mean cluster chronologies –
integrating all site chronologies within a cluster – were
0.74 in WSIB (between C1, C2, and C3) and 0.67 in ESIB
(between C4, C5, and C6). Because of this coherence of
growth variations, and the location and coherence of
instrumental stations, we aggregated the data into
western Siberia (WSIB: C1–C3), eastern Siberia (ESIB:
C4–C6), and northeastern Siberia (NESIB: C7).
Average age of the sampled trees increased from west
to east from 190 years in WSIB to 309 in NESIB, and
mean correlations between all 78 TRW and 70 MXD site
chronologies were 0.17 and 0.20 over the 1951–1980
period, respectively. The tree-ring data reached max-
imum replication of 2614 series in 1963, but strongly
declined from 2456 series in 1990 to 1520 series in 1991
(Fig. 2), the year of the second Swiss/Russian sampling
campaign. Overall sample replication changed gradu-
ally back in time (1731 series in 1801) with similar
tendencies in WSIB and ESIB and a slower decline in
the less-well replicated NESIB area. The fraction of data
from which only TRW measurements were available
was again quite small (max. 304 series in 1982) and
characterized by a similar decline in the 1990s from 301
S I B E R I A N I N D I C A T O R S O F WA R M I N G 387
r 2009 Blackwell Publishing Ltd, Global Change Biology, 16, 386–398
series in 1994 to 128 series in 1995 (not shown). Due to
recent field activities, we were able to keep the 1990s
sample replication reasonably steady in WSIB (386
series in 2000), which allowed for an extra analysis of
growth trends over the most recent decade of the 20th
century in this region. Replication declined below 150
series in 2001, defining the maximum period over
which reliable conclusions could be drawn.
Instrumental data
Siberia is characterized by relatively small changes in
temperature means but steep gradients in annual tem-
perature ranges (Table 1) with maximum continentality
displayed towards the center of the study region. Only
13 climate stations in the Global Historical Climatology
Network (GHCN; Peterson & Vose, 1997; Peterson et al.,
1998) database that started recording temperatures be-
fore 1910 are present in this region (see supporting
information: Climate data). Data from these stations
showed correlation patterns similar to those derived
from the tree-ring data, resulting in clusters of six
stations in WSIB, five in ESIB, and two in NESIB (Fig.
1). Correlations using June–August (JJA) mean tempera-
tures over the 1951–1980 period ranged from 0.59
between WSIB stations to 0.80 between (proximal) NE-
SIB stations. In all three regions, the station data were
also highly correlated (r40.98) with JJA temperatures
derived from corresponding grid points (shown in Fig.
1; Brohan et al., 2006), supporting utilization of the long-
term station data for calibration and trend analyses.
As for the tree-ring data, monthly temperature data
showed a steep replication decline in the early 1990s,
with data for only six stations in 1991 (Fig. 2). Maximum
replication (13 stations � 12 months 5 156) was only
achieved consistently between 1943 and 1983. Replica-
tion declined gradually back in time, to 131 monthly
values in 1930, 127 in 1900, and 76 in 1890. The number
of missing values was overall much larger before 1940.
Data from only three stations were available in 1882. As
these changes not only affect the error of regional
temperature records, but also modify the variance (lar-
ger with less data) of the mean timeseries (Frank et al.,
2007b), we adjusted this heteroscedasticity by removal
of changing standard deviations in a 30-year running
window.
Tree-ring detrending
To test the influence of age-trend removal on 20th
century growth trends and DP emergence, we applied
four different detrending techniques: regional curve
standardization (RCS), Hugershoff (HUG), negative
60
65
70
75
60 80 100 120 140 160 180Longitude E
Latit
ude
N
SurHan
Ber
Ole
Tur
Dud
Ust
Ver
Jak
VilAnaMar
WSIB(C1–C3)
PUTORANA
MTS.
CHERSKIY
MTS.
+ +
++
+
+ ++ + +
Sal
ESIB(C4–C6)
NESIB(C7)
Fig. 1 Siberian tree-ring and station temperature data. The map shows the 78 tree sites (triangles), and 13 climatic stations (circles) with
data back to 1910 in the sector north of 601N and 60–1801E. Crosses indicate locations from which grid point temperature data (Brohan et
al., 2006) are available. Tree-ring sites, differentiated using cluster analysis, from west to east: C1 in light blue, C2 dark blue, C3 blue, C4
red, C5 dark red, C6 orange, C7 green.
Table 1 Siberian tree-ring and long-term station temperature
data
Region WSIB ESIB NESIB SIBERIA
Cluster 1–3 4–6 7 1–7
No. tree sites 32 39 7 78
No. tree cores 1438 1341 296 3075
Mean tree age (years) 190 247 309 232
Intercluster correlation 0.74 0.67 – 0.45
Stations 1–6 7–11 12–13 1–13
JJA mean temperature ( 1C) 13.0 15.2 10.2 13.4
Annual temperature range ( 1C) 40.4 57.7 37.0 46.6
Interstation correlation 0.59 0.61 0.80 0.23
Cluster numbers correspond to triangles as indicated in Fig. 1;
meteorological stations are listed in Table S3. Mean tree age is
the average length of measurement series within one or
several clusters. Intercluster and inter-station correlations in-
dicate the coherence between RCS-detrended mean cluster
chronologies and mean JJA station temperatures over the
1951–1980 period, respectively. Annual temperature range is
the average difference between the warmest and coldest
months over the 1951–1980 period.
388 J . E S P E R et al.
r 2009 Blackwell Publishing Ltd, Global Change Biology, 16, 386–398
exponential (EXP), and 300-year splines (SPL) (see
supporting information: Detrending and chronology
building). These methods were chosen as they
were either typically used (HUG, EXP) for detrending
of high latitude TRW and MXD data (e.g., Schweingru-
ber et al., 1979; Jacoby & D’Arrigo, 1989, 1995; Schwein-
gruber & Briffa, 1995, 1996a; Briffa et al., 1998; Wilson
et al., 2005; Helama et al., 2008), or represent techniques
that preserve varying low frequency variability (RCS,
SPL) in resulting tree-ring chronologies (e.g., Briffa et al.,
1992; Cook et al., 1995, 2004; Esper et al., 2003b, 2007a;
Luckman & Wilson, 2005; Buntgen et al., 2005, 2006,
2007, 2008a).
The HUG detrending was specifically considered as it
was used in the first work describing large-scale DP
(Briffa et al., 1998), and has been implemented in many
subsequent hemispheric reconstructions (e.g., Briffa
et al., 2002b; Rutherford et al., 2005; Mann et al., 2008).
On the opposing end of the spectrum, we considered
RCS, which is one of the few methods that allows
preservation of long time-scale information in tree-ring
chronologies (Esper et al., 2003a, 2007b). Given the
data’s age structure and the general characteristics of
these methods (Fritts, 1976; Cook & Kairiukstis, 1990),
we expected the RCS technique to preserve most low
frequency variability, followed by EXP, HUG, and SPL.
Note that while the differing detrending methods alter
the low frequency spectra of timeseries – and thus the
fit with 20th century climate data – the higher fre-
quency, interannual to multidecadal variability remains
largely unaffected.
Calibration and residual analysis
As with the detrending, we applied calibration ap-
proaches that were considered in the original literature
on DP, and combined these techniques with alternative
ways of fitting tree-ring data against instrumental mea-
surements. All TRW and MXD cluster chronologies as
well as the WSIB (C1–C3) and ESIB (C4–C6) mean
timeseries were compared against regional JJA tem-
peratures using the Pearson correlation coefficient.
Tree-ring records were scaled to instrumental measure-
ments, i.e. their mean and variance adjusted to the
temperature data, over an early (pre-1941), late (post-
1940), and full (1881–1990) window. In all cases we
utilize scaling instead of least-squares regression as
many studies have shown that long-term variability is
suppress in most regression schemes (von Storch et al.,
2004; Esper et al., 2005a; Lee et al., 2008). We specifically
considered the HUG-detrended timeseries that were
calibrated over the pre-1941 period, and compared this
approach with the RCS-detrended timeseries that were
calibrated over the post-1940 (and full) period. This was
done, as these approaches either follow methodology of
Briffa et al. (1998) in their circumpolar DP assessment
(HUG and early calibration), or represent techniques
that tend to retain low frequency variance in proxy data
(RCS) and reduce late 20th century offset between
proxy and instrumental records (late calibration).
To estimate proxy uncertainty, and also quantify
potential magnitude of DP, we calculated the residuals
between the calibrated tree-ring and target instrumental
timeseries. This approach provides relatively conserva-
tive estimates of the proxy uncertainty, as the tree-ring
data were not fitted to temperatures based on ordinary
least-squares but on scaling the mean and variance over
some defined period of overlap. Instrumental uncer-
tainty was expressed as the difference series between
raw and adjusted GHCN temperature data. Similarly,
residuals between differently detrended (RCS and
HUG) and differently scaled (pre-1941 and post-1940
Num
ber
of m
onth
s
Num
ber
of tr
ee c
ores
Year
024487296
120144168
1800 1820 1840 1860 1880 1900 1920 1940 1960 1980 2000050010001500200025003000
Fig. 2 Temperature and tree-ring data replication. Upper panel shows the number of monthly temperature readings recorded at the
instrumental stations S1-6 in WSIB, S7-11 in ESIB, and S12-13 in NESIB (see Table S3 for station details). Dashed curve indicates the
theoretical amount of monthly data if no values were missing. Lower panel shows the number of tree-ring series in clusters C1–C3 in
WSIB, C4–C6 in ESIB, and C7 in NESIB.
S I B E R I A N I N D I C A T O R S O F WA R M I N G 389
r 2009 Blackwell Publishing Ltd, Global Change Biology, 16, 386–398
periods) tree-ring data quantified calibration uncer-
tainty. The proxy, target, and calibration uncertainties
(all in 1C) were then compared to illustrate the relative
importance of each factor throughout time. Scaled data
and residual timeseries were occasionally smoothed
using a 10-year Gaussian weighted moving average,
or decadally averaged, to emphasize trends in the lower
frequency domain.
Results
Trends and signals in the 1990s large-scale tree-ringnetwork
To assess effects of tree-ring standardization on the
preservation of long-term trends across Siberia, we
compared the differently detrended tree-ring data after
combining the spatial clusters C1–C7. The resulting
mean timeseries revealed the RCS method retained
most low frequency variance for both TRW and MXD
data (Fig. 3). Linear fits to the timeseries displayed in
the lower panel of Fig. 3 (regression calculated using
annually resolved data; not shown) indicated that only
the MXD RCS-detrended data contained a positive
trend ( 1 0.12 index/century) since 1800. All TRW
chronologies, except for the HUG-detrended record
(�0.25 index/century), showed positive trends. Time-
series were normalized over the 1881–1940 period to
accentuate the difference between the various ap-
proaches towards the early 19th and late 20th centuries.
For TRW, the HUG-detrended data had the lowest post-
1960 values and among the highest (together with SPL)
19th century values. For MXD, SPL yielded the lowest
post-1960 levels, followed by HUG and EXP. Highest
post-1960 levels were retained with the RCS method.
These, often substantial, trend differences had little
effect on assessments of climate response, as this signal
is largely determined by high frequency associations.
Calibration of the tree-ring records against regional
temperature data revealed higher correlations for
MXD (than TRW) and for the western C1 and C2 (than
C3–C6) clusters (Fig. 4). The temperature signal for C7
was weak for the MXD data and nearly absent for TRW.
This seemed to be related to the reduced number and
coherence of the tree-ring data as well as the reduced
number and increased distance to the corresponding
instrumental stations. Correlations calculated over the
maximum period of overlap with instrumental data
were slightly higher when tree-ring data were averaged
over the clusters C1–C3 and C4–C6, and ranged from
0.47 in ESIB (TRW) to 0.84 in WSIB (MXD). These values
increased again slightly for decadally smoothed data to
0.72 (TRW) and 0.89 (MXD) in WSIB, and 0.65 (TRW)
and 0.77 (MXD) in ESIB. Importantly, pre-1941 vs. post-
1940 correlations revealed no significant change of climate
sensitivity through time. While some clusters indicated
a slight drop in correlation (up to r 5 0.2) for the late
period, other clusters and combinations of clusters
showed virtually no change or even slight increases.
Scaling the RCS-detrended tree-ring data to regional
JJA temperatures revealed that DP is not significant or
widespread across Siberia (Fig. 5). Post-1960 differences
between proxy and target data were either very small or
nonexistent (WSIB), disappeared towards the end of the
–2
–1
0
1
1800 1820 1840 1860 1880 1900 1920 1940 1960 1980
–2
0
2
–2
0
2
Year
–2
–1
0
1
z-sc
ores
z-sc
ores
Fig. 3 Effect of tree-ring detrending. Upper panel shows the cluster chronologies C1–C7 (black) and their arithmetic mean (red) of the
RCS-detrended TRW and MXD data. Lower panel shows the same arithmetic means (RCS) together with the mean timeseries derived
from HUG, EXD, and SPL detrending. All timeseries were normalized over the 1881–1940 period. RCS, regional curve standardization;
TRW, tree-ring width.
390 J . E S P E R et al.
r 2009 Blackwell Publishing Ltd, Global Change Biology, 16, 386–398
1980s (TRW in ESIB), or were of the same size as those
before 1960 (MXD in ESIB). Results from NESIB were
less significant, because of the overall lower coherence
between proxy and temperature data. These data, how-
ever, nicely illustrate the sensitivity of DP evaluation to
the period chosen for scaling. While the RCS-detrended
data, scaled over the 1941–1990 period (shown in red in
Fig. 5), indicated a sizeable positive difference before
1920, the HUG-detrended data, that were scaled over
the pre-1941 period, indicated a similar but negative
difference after 1950. The latter representing the classi-
cal notion of the DP. Besides the scaling period, the
method chosen for detrending had an influence on the
appearance of DP in some cases. For example, in WSIB
the RCS-detrended timeseries started in the 1880s
clearly below the HUG timeseries, but ended in the
1990s clearly above its counterpart. This greater positive
trend preserved in the RCS data helped to avoid artifi-
cial DP detection in this region.
Proxy update to 2000
Recent field and laboratory work allowed an update of
tree-ring data until 2000 including seven MXD and
0.0
0.2
0.4
0.6
0.8 1881–1940 1941–1990 1881–1990
Ring widthRing density
Cor
rela
tion
ClusterC1 C2 C3 C4 C5 C6 C7 C1–3 C4–6 C1 C2 C3 C4 C5 C6 C7 C1–3 C4–6
Fig. 4 Tree-ring data calibration. Pearson’s correlation coefficients between RCS-detrended tree-ring chronologies and regional JJA
temperature data for clusters C1–C7 and the arithmetic means of clusters representing WSIB (C1–C3) and ESIB (C4–C6). Instrumental
station data reached back to 1881 in WSIB, 1883 in ESIB, and 1898 in NESIB. Correlations were calculated over different time periods.
Results for other detrendings were similar, as the standardization methods applied here had virtually no effect on the high frequency
characteristics of chronologies (not shown). RCS, regional curve standardization.
Proxy vs. temperature
WSIB
Ring widthRing density
Year
ESIB
NESIB
Tem
pera
ture
ano
mal
ies
(°C
wrt
. 195
1–19
80)
–2
0
2
–2
0
2
–2
0
–2
0
2
–2
0
–2
0
2
1880 1900 1920 1940 1960 1980 1880 1900 1920 1940 1960 1980
Temperature Tree-rings
Proxy vs. proxy
Fig. 5 Decadally smoothed tree growth and temperature trends in Siberia. Differently detrended (RCS in red, HUG in blue) MXD and
TRW data are plotted together with JJA temperatures (black) derived from long instrumental station records in WSIB, ESIB, and NESIB.
Tree ring data were scaled against regional temperatures over the 1941–1990 period (RCS) and over the early period of overlap up to 1940
(HUG). Bottom panels show the smoothed differences between the RCS tree-ring and JJA temperature data (grey), and between the RCS-
and HUG-detrended tree-ring data (black). RCS, regional curve standardization; TRW, tree-ring width.
S I B E R I A N I N D I C A T O R S O F WA R M I N G 391
r 2009 Blackwell Publishing Ltd, Global Change Biology, 16, 386–398
eight TRW site chronologies in WSIB (Fig. 6). These
WSIB new records revealed very similar variations as
the mean of the C1–C3 clusters (r 5 0.97 for both MXD
and TRW, 1881–1990 period), and thus allowed a
straightforward assessment of DP over last decade of
the 20th century.
The close fit between the MXD and TRW data with JJA
temperatures indicated that there was no recent loss in
high frequency coherence nor was lower frequency diver-
gence found for the 1990s. The MXD timeseries matched
post-1990 temperatures quite closely, and the TRW time-
series showed values higher than the corresponding
temperatures in 1992, 1994, 1996, 1997, 1998, and 1999.
Proxy and climate data residuals
In order to compare proxy and instrumental (and
calibration) uncertainties, decadally averaged residuals
between the MXD and TRW data and their regional
targets were calculated (Fig. 7). These timeseries indi-
cated little trend in the proxy residuals of all regions in
Siberia. The total error is on average about 0.16 1C
smaller for MXD than for TRW, and increased from
0.51 1C in WSIB to 1.22 1C in NESIB (values indicated in
the figure).
Similarly, the uncertainty in regional temperature
data is shown in Fig. 8a. These timeseries indicated that
both positive and negative corrections up to a few
degrees Celsius were performed on the monthly station
data. Mean corrections across the network (bold lines;
Fig. 8a) generally increased back in time and were
negative for most of the records length, including
deviations of up to �0.56 1C in June 1897. The net
adjustments thus increased warming over the 20th
century in the region. The 1880s were, however, char-
acterized by positive residuals (up to 1.1 1C in August
–2–10123
1970 1975 1980 1985 1990 1995 2000
Ring width
Ring density
Year
Ring width
Ring density
z-sc
ores
JJA
tem
pera
ture
ano
mal
ies
(wrt
. 188
1–19
90)
–3–2–10123
–2–10123
WSIBTemperature WSIBnew
1880 1890 1900 1910 1920 1930 1940 1950 1960 1970 1980 1990 2000
WSIB–3–2–1012
New sites WSIBnew
–2–10123
Temperature WSIBnew Ring density
Ring width
JJA
Tem
pera
ture
ano
ma
(wrt
. 188
1–19
90)
Fig. 6 Updated WSIBnew tree-ring data and coherence with regional temperatures. Top panel shows the seven new MXD and eight
new TRW RCS-detrended site chronologies together with their mean (WSIBnew) and the mean of all records in the WSIB clusters C1-3
(WSIB). While the latter extended only until 1990, WSIBnew reached 2000. Middle panel shows the WSIB and WSIBnew tree growth data
scaled over the 1881–1990 (WSIB) and 1881–2000 (WSIBnew) periods to regional JJA temperatures. JJA and WSIB data have been
decadally smoothed. Bottom panel shows the WSIBnew MXD and TRW timeseries together with JJA temperatures over the 1970–2000
period. Details on the updated WSIBnew sites, and all other tree-ring locations, are listed in supplementary Table S2. RCS, regional curve
standardization; TRW, tree-ring width.
392 J . E S P E R et al.
r 2009 Blackwell Publishing Ltd, Global Change Biology, 16, 386–398
1881), which was biased by the drop in station records
over this early period (see Table S3). The absolute value
of the warm-season (JJA) residuals, averaged decadally,
indicated that the adjustments were significantly smal-
ler in NESIB than WSIB or ESIB (Fig. 8b). It is also
evident that certain stations, such as Ust’-Maja or
Surgut underwent changes of up to 2–3 1C. Other sta-
tions, such as Dudinka in WSIB, received no substantial
adjustments.
Aggregation of all station residuals from WSIB and
ESIB, i.e. the average of the blue and red timeseries
shown in Fig. 8b, indicate typical adjustments per-
formed on the instrumental data across Siberian (Fig.
9). We compared these instrumental adjustments with
the mean proxy residual, derived from the combined
unexplained variance of TRW and MXD averaged over
WSIB and ESIB (from Fig. 7), and the mean calibration
uncertainty, derived from the residuals between differ-
JJA temperature Ring density Ring width
Year
Tem
pera
ture
ano
mal
ies
(°C
wrt
. 195
1–19
80)
Tem
pera
ture
(°C
)–4
–2
0
2
4
012
–4
–2
0
2
4
012
–4
–2
0
2
4
12
ΔMXD = 0.51°C / ΔTRW = 0.78°C
ΔMXD = 0.72°C / ΔTRW = 0.83°C
ΔMXD = 1.13°C / ΔTRW = 1.22°C
1880 1890 1900 1910 1920 1930 1940 1950 1960 1970 1980 1990 2000
WSIB
ESIB
NESIB
Fig. 7 Tree-ring proxy vs. target temperature differences. RCS-detrended MXD and TRW timeseries scaled to regional JJA temperatures
in WSIB (over 1881–2000), ESIB (1883–1990), and NESIB (1898–1990). Periods represent the maximum overlap between proxy and target
data. The WSIB TRW and MXD records are combinations of the C1–C3 mean timeseries with the WSIBnew update until 2000 (see Fig. 6).
Curves at the bottom of the panels are the decadally averaged residuals MXD vs. temperature (red), and TRW vs. temperature (blue). D is
the average residual over the periods of overlap. RCS, regional curve standardization; TRW, tree-ring width.
–4
–3
–2
–1
0
1
2
3
JuneJulyAugust
1880 1890 1900 1910 1920 1930 1940 1950 1960 1970 1980 1990 2000
Sur
Dud
Ust
0
1
2
3
5 ESIB stations
Year
Tem
pera
ture
(°C
)
Tem
pera
ture
(°C
)2 NESIB stations
6 WSIB stations
Fig. 8 Differences between raw and adjusted (GHCN) temperature station records. Upper panel shows the single June, July, and
August adjustments of all 13 Siberian stations and their mean timeseries (bold). In the lower panel the adjustments were averaged to
mean JJA mean timeseries and sorted by stations in WSIB, ESIB, and NESIB. Negative deviations were inverted, combined with positive
values, and decadally averaged. Ust is Ust’-Maja, Sur is Surgut, and Dud is Dudinka (see Table S3).
S I B E R I A N I N D I C A T O R S O F WA R M I N G 393
r 2009 Blackwell Publishing Ltd, Global Change Biology, 16, 386–398
ently detrended and scaled TRW and MXD data in
WSIB and ESIB (from Fig. 5). NESIB data were not
included in this comparison, as the proxy records did
not correlate significantly with regional temperature
data, i.e. the proxy error appeared to be biased by the
large distance to the instrumental stations (see support-
ing information Figure S1).
The mean temperature adjustments were larger – up
to 1.3 1C for decadal means – than the proxy and
calibration residuals until the 1940s, then steadily de-
clined to about 0.1 1C until 1990, representing o5% of
the overall uncertainty. The proxy uncertainty remained
fairly stable between about 0.6 and 0.8 1C over the past
110 years, but predominated over the other uncertain-
ties after the middle of the 20th century (up to about
60% in the 1980s), largely because of the reduced
instrumental adjustments during that time. The calibra-
tion term was large at the beginning and the end of the
overlapping period, i.e. about 0.4 1C in the 1880s and
1980s. However, the relative importance increased to
about 35% in the 1980s, again mainly because of the
relatively small temperature adjustments.
Discussion
Our analysis showed that the tree-ring data representa-
tive for high latitude environments of Siberia are closely
coupled with temperature variations, and that they
particularly do not suffer from a recently increased
disassociation from regional instrumental data. This is
the case for both TRW and MXD measurements. The
proxy data can thus be utilized for long-term climate
reconstruction, and should also be helpful to estimate
the course of temperatures during earlier warm epi-
sodes such as the putative Medieval Warm Period. This
being said, the data are seemingly prone to ill definition
of late 20th century trends that can leave the erroneous
impression of DP as was shown in previous publica-
tions (Briffa et al., 1998). Our tests, however, demon-
strated that consideration of various tree-ring
detrending techniques and calibration methodologies
resolved DP in this important archive of long-term
environmental change. This conclusion was supported
through the reanalysis of a large tree-ring network
sampled in the early 1990s spanning most of Siberia,
and confirmed by an update of tree-ring data in WSIB
that revealed both TRW and MXD closely track recent
temperatures. Notably, the detrending and calibration
techniques shown to be free of the DP are those that are
a priori known to be most suitable for retaining long-
timescale information (e.g., Cook et al., 1995; Esper et al.,
2002, 2005a; Rutherford et al., 2005; Buntgen et al., 2006,
2008a; Lee et al., 2008). It seems important to note
though that not a single consideration, such as the
detrending method alone, was sufficient to avoid DP.
Rather, a combination of factors – the balance depend-
ing on the region and tree-ring parameter – influenced
20th century growth trends and degree of disassociation
from target temperature data (Esper & Frank, 2009).
The application of various detrending and calibration
techniques showed that consideration of a standardiza-
tion method that retains more low frequency variability
in tree-ring chronologies, as well as scaling of the proxy
data over the full (or recent) period of overlap with
instrumental data influenced 20th century growth
trends and coherence with post-1960 temperatures. A
Year
Tem
pera
ture
(°C
) Instrumental
0.00.20.40.60.81.01.21.4
1880 1890 1900 1910 1920 1930 1940 1950 1960 1970 1980 19900
20
40
60
80
100
Res
idua
ls (
%)
Proxy
Calibration
Instrumental
Proxy
Calibration
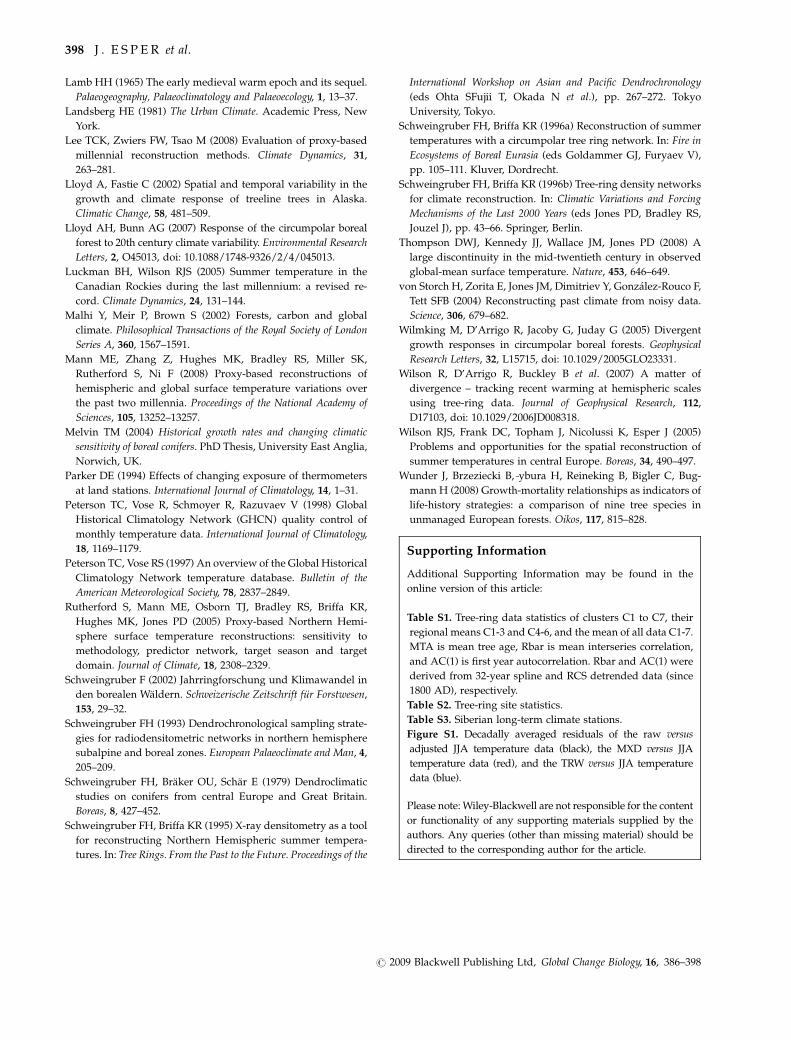
Fig. 9 Size of residuals. Upper panel shows the decadally smoothed instrumental, proxy, and calibration residuals averaged over
western and eastern Siberia. ‘Instrumental’ refers to the difference between raw and adjusted JJA temperatures, ‘proxy’ to the difference
between tree-ring and JJA temperature timeseries, and ‘calibration’ to the difference between the differently detrended (RCS,
Hugershoff) and scaled (1881–1940, 1941–1990) MXD and TRW records. All residuals were calculated for WSIB and ESIB (and TRW
and MXD), and then averaged to form larger scale estimates. Lower panel shows the same data expressed in percent. RCS, regional curve
standardization.
394 J . E S P E R et al.
r 2009 Blackwell Publishing Ltd, Global Change Biology, 16, 386–398
comparison of the residuals between proxy and target
data with the residuals between differently detrended
and scaled proxy data indicated that the uncertainty
due to methodological choices (detrending and calibra-
tion) is about half the size of the unexplained (proxy vs.
target) variance typical for the data analyzed here. A
corresponding calculation of the residuals between raw
and adjusted temperature data showed that these
changes increased from about 0 1C to 41 1C back in
time, and were largest before the 1940s. The association
of all these influences and uncertainties suggests that
more attention needs be paid to the (i) consequences of
tree-ring detrending on the low frequency signal of
mean chronologies, (ii) effect of calibrating proxy data
over different time periods, and (iii) number of instru-
mental temperature readings as well as the size and
temporally varying adjustments of these data (Frank
et al., 2007a).
Greatest low frequency preservation and highest
post-1960 tree-ring values were retained with the RCS
method. Besides this notable finding, it seemed inter-
esting that the four detrending methods tested here did
not result in the same ranking of TRW and MXD
chronologies when sorted by their low frequency load-
ing. For example, the HUG-detrended TRW data clearly
showed the lowest post-1960 values and most negative
trend over the past two centuries. However, the same
detrending applied to MXD produced post-1960 values
comparable to EXP and larger than SPL. Trends and
levels were even more heterogeneous, when smaller
geographic regions and the differing tree-ring para-
meters within these regions were considered (not
shown). Altogether it appeared obvious that the re-
moval of long-term positive trends from the tree-ring
data, as is most strongly the case with the HUG de-
trending, systematically increased the chance for diver-
gence from increasing temperatures, and is thus not
recommended for studies of long-term environmental
change or DP in the far north.
The detrending tests also indicated that RCS applied
on a site-by-site basis (Esper et al., 2007b), is a func-
tional, alternative method, as we found common long-
term trends among site chronologies and obtained the
best fit with regional temperature data. It seems im-
portant to note, however, that RCS-detrended data
generally contain greatest uncertainties, require large
datasets, and are prone to biases caused by inhomoge-
neous sample collections (Esper et al., 2002, 2003a).
Particularly relevant to the Siberian data analyzed here
could be biases due to (i) the tendency that the oldest
trees often grow most slowly (Melvin, 2004; Esper et al.,
2007b; Wunder et al., 2008), and (ii) the composition of
data from only living trees and relatively homogeneous
age-structure (Esper et al., 2007a, 2009). The former bias
is likely more relevant for TRW than MXD – because of
the greater amount of variance contained by the age-
trend (Schweingruber et al., 1979) – and would ulti-
mately increase positive long-term trends in RCS chron-
ologies. The latter bias potentially limits the
preservation of low frequency climatic information
and in particular the ability to capture 20th century
warming. More research is needed to explore these
potential and opposing sampling and age-structure
biases in data collections from living trees.
Calibration of the Siberian tree-ring data confirmed
that the climate signal is stronger in MXD than TRW,
weaker in NESIB than WSIB and ESIB, equally good
over early and late periods of overlap with instrumental
data, and effectively independent of the method chosen
for detrending. While these results were broadly in line
with previous research (Briffa et al., 1998, 2002a), the
sensitivity of DP to the period chosen for calibration, i.e.
the early pre-1940 or late post-1940 periods, seemed to
be relevant, as it indicated that the procedure chosen to
transfer proxy data into temperature units affected
recent trends and offsets. Calibration over only an early
period of overlap with instrumental data minimizes the
proxy/temperature residual over this period, and in
turn increases the chance to detect offset over some later
period. Early calibration is also problematic as the
number of early temperature readings is reduced and
uncertainty increased (Bohm et al., 2001; Frank et al.,
2007a). The latter point is quantified for Siberia by the
increasing residual between raw and adjusted station
data back in time. Additional problems may arise if the
proxy data are regressed, instead of scaled, against
temperature data (Briffa et al., 2001), as regression-based
procedures reduce the variability of the tree-ring time-
series by some fraction of the unexplained variance
(von Storch et al., 2004; Esper et al., 2005a). Such var-
iance reductions systematically increase the chance to
generate DP. Similarly, the season over which tempera-
ture data are considered might have an influence on DP,
as in most high latitude regions summer temperatures
show the weakest 20th century warming signal. Cali-
bration against wider seasons including spring and fall
months, or even winter months (e.g., annual tempera-
tures), can thus change the trend of the target data,
which in turn could contribute to DP detection.
Besides the calibration and possible seasonality influ-
ences, uncertainty in the target instrumental data adds
to the complexity of estimating 20th century tempera-
ture trends and potential divergence of proxy data. At
least some of this uncertainty has been considered here
in the residual between raw and adjusted GHCN data.
The way this term was calculated, by combining both
the positive and negative adjustments back to 1881,
yielded error estimates larger than those obtained when
S I B E R I A N I N D I C A T O R S O F WA R M I N G 395
r 2009 Blackwell Publishing Ltd, Global Change Biology, 16, 386–398
considering the difference between regional mean re-
cords integrating several stations. This is because most
of the positive and negative adjustments per station
cancel each other out when developing a regional
record, a feature inherent to GHCN adjustment metho-
dology (Peterson & Vose, 1997; Hansen et al., 1999).
Interstation comparison and correction also reduce the
number of statistically independent recordings in a
given region. On the other hand, consideration of the
residual between raw and adjusted station data, as done
here, is also somewhat conservative, as changes in
variance or step functions in the mean were often
already adjusted in the source data. Other effects such
as caused by changes of the physical properties of the
environment surrounding the stations (Landsberg,
1981), including the urban heat island effect (Hinkel
et al., 2003), are not specifically considered in the GHCN
procedure. The latter might, however, be quite large in
Siberia, as the number of inhabitants in 11 (of the 13)
villages and cities from which the long-term tempera-
ture records originate increased from about 20 000 be-
tween 1897 and 1930 (most data from a census in 1897)
to about 710 000 in the 21st century (supporting infor-
mation Table S3). No early 20th century census data
were found for Ust’-Maja in ESIB (3800 inhabitants in
1999) and Markovo NESIB (ca. 600 inhabitants in 2000).
These considerable changes, together with the reduced
number of early station data, the large distance between
individual stations particularly before 1920, and the
increased number of missing values before about 1940
made the identification and correction of nonclimatic
long-term trends over the past 120 years difficult in
Siberia. In addition, the homogenization methodologies
currently applied particularly in large-scale approaches,
have difficulties in identifying and correcting for sys-
tematic biases that simultaneously affect data across
larger regions (Parker, 1994; Frank et al., 2007a; Thomp-
son et al., 2008). If we, for example, consider the sub-
stantial changes of instrumental summer temperatures
that were recently applied to early station data in
Europe and elsewhere (see both Frank et al., 2007a;
Bohm et al., 2009, and references therein), it appears
premature to solely use early temperature readings for
proxy transfer and evaluation of DP in remote high
latitude regions.
While a recently published analysis of several thou-
sand tree-ring series from the European Alps revealed
DP to be inexistent in a major mid latitude mountain
system (Buntgen et al., 2008b), this current analysis, for
the first time, showed that DP does not affect tree
growth in a large area of high latitude Asian taiga
forests. From this perspective and the various tests
applied in this analysis, several recommendations can
be derived that might help studying 20th century
growth trends and potential DP in tree-ring data. These
include to (i) preserve low frequency variability when
detrending tree-ring data, (ii) not allow positive growth
curves to be fit in the detrending process (Hugershoff),
(iii) calibrate over the full (or late) period of overlap
with instrumental climate data, (iv) avoid regression-
based approaches for proxy transfer, (v) carefully ex-
amine early instrumental data, and not base DP on
uncertain temperature data, and (vi) consider tree-ring
sites with a clear climatic signal.
Acknowledgements
We thank F. H. Schweingruber for stimulating discussions.Supported by the European Community project Millennium(grant 017008) and the Swiss National Science Foundationthrough the National Centre for Competence in Climate Re-search (NCCR-Climate).
References
Arnfield AJ (2003) Two decades of urban climate research: a
review of turbulence, exchanges of energy and water, and
the urban heat island. International Journal of Climatology, 23,
1–26.
Barber V, Juday G, Finney B (2000) Reduced growth of Alaska
white spruce in the twentieth century from temperature-
induced drought stress. Nature, 405, 668–672.
Bohm R, Auer I, Brunetti M, Maugeri M, Nanni T, Schoner W
(2001) Regional temperature variability in the European Alps:
1760–1998 from homogenized instrumental time series. Inter-
national Journal of Climatology, 21, 1779–1801.
Bohm R, Jones PD, Hiebl J, Brunetti M, Frank D, Maugeri M
(2009) The early instrumental warm-bias: a solution for long
central European temperature series 1760–2007. Climatic
Change, in press.
Briffa KR, Jones PD, Bartholin TS et al. (1992) Fennoscandian
summers from AD 500: temperature changes on short and
long timescales. Climate Dynamics, 7, 111–119.
Briffa KR, Osborn TJ, Schweingruber FH, Harris IC, Jones PD,
Shiyatov SG, Vaganov EA (2001) Low-frequency temperature
variations from a northern tree ring density network. Journal of
Geophysical Research, 106, 2929–2941.
Briffa KR, Osborn TJ, Schweingruber FH, Jones PD, Shiyatov SG,
Vaganov EA (2002a) Tree-ring width and density data around
the Northern Hemisphere: part 1, local and regional climate
signals. The Holocene, 12, 737–757.
Briffa KR, Osborn TJ, Schweingruber FH, Jones PD, Shiyatov SG,
Vaganov EA (2002b) Tree-ring width and density data
around the Northern Hemisphere: part 2, spatio-temporal
variability and associated climate patterns. The Holocene, 12,
759–789.
Briffa KR, Schweingruber FH, Jones PD, Osborn TJ, Shiyatov SG,
Vaganov EA (1998) Reduced sensitivity of recent tree-growth
to temperature at high northern latitudes. Nature, 391, 678–682.
Brohan P, Kennedy JJ, Harris I, Tett SFB, Jones PD (2006)
Uncertainty estimates in regional and global observed tem-
396 J . E S P E R et al.
r 2009 Blackwell Publishing Ltd, Global Change Biology, 16, 386–398
perature changes: a new dataset from 1850. Journal of Geophy-
sical Research, 111, D12106, doi: 10.1029/2005JD006548.
Buntgen U, Esper J, Frank DC, Nicolussi K, Schmidhalter M
(2005) A 1052-year tree-ring proxy for Alpine summer tem-
peratures. Climate Dynamics, 25, 141–153.
Buntgen U, Frank DC, Grudd H, Esper J (2008a) Long-term
summer temperature variations in the Pyrenees. Climate Dy-
namics, 31, 615–631.
Buntgen U, Frank DC, Kaczka RJ, Verstege A, Zwijacz-Kozica T,
Esper J (2007) Growth/climate response of a multi-species
tree-ring network in the Western Carpathian Tatra Mountains,
Poland and Slovakia. Tree Physiology, 27, 689–702.
Buntgen U, Frank DC, Nievergelt D, Esper J (2006) Summer
temperature variations in the European Alps, A.D. 755–2004.
Journal of Climate, 19, 5606–5623.
Buntgen U, Frank DC, Wilson R, Carrer M, Urbinati C, Esper J
(2008b) Testing for tree-ring divergence in the European Alps.
Global Change Biology, 14, 2443–2453.
Cook ER, Briffa KR, Meko DM, Graybill DS, Funkhouser G (1995)
The ‘segment length curse’ in long tree-ring chronology devel-
opment for paleoclimatic studies. The Holocene, 5, 229–237.
Cook ER, Esper J, D’Arrigo R (2004) Extra-tropical Northern
Hemisphere temperature variability over the past 1000 years.
Quaternary Science Reviews, 23, 2063–2074.
Cook ER, Kairiukstis LA (1990) Methods of Dendrochronology –
Applications in the Environmental Science. Kluwer, Dordrecht.
D’Arrigo R, Wilson R, Liepert B, Cherubini P (2008) On the
‘divergence problem’ in northern forests: a review of the tree-
ring evidence and possible causes. Global and Planetary Change,
60, 289–305.
Driscoll W, Wiles G, D’Arrigo R, Wilmking M (2005) Divergent
tree growth response to recent climatic warming, Lake Clark
National Park and Preserve, Alaska. Geophysical Research Let-
ters, 32, L20703, doi: 10.1029/2005GL024258.
Esper J, Cook ER, Krusic PJ, Peters K, Schweingruber FH (2003a)
Tests of the RCS method for preserving low-frequency variability
in long tree-ring chronologies. Tree-Ring Research, 59, 81–98.
Esper J, Cook ER, Schweingruber FH (2002) Low-frequency
signals in long tree-ring chronologies and the reconstruction
of past temperature variability. Science, 295, 2250–2253.
Esper J, Frank D (2009) Divergence pitfalls in tree-ring research.
Climatic Change, in press.
Esper J, Frank DC, Buntgen U, Verstege A, Luterbacher J,
Xoplaki E (2007a) Long-term drought severity variations in
Morocco. Geophysical Research Letters, 34, L17702, doi: 10.1029/
2007GL030844.
Esper J, Frank DC, Wilson RJS, Briffa KR (2005a) Effect of scaling
and regression on reconstructed temperature amplitude for
the past millennium. Geophysical Research Letters, 32, doi:
10.1029/2004GL021236.
Esper J, Frank DC, Wilson RJS, Buntgen U, Treydte K (2007b)
Uniform growth trends among central Asian low and high
elevation juniper tree sites. Trees, 21, 141–150.
Esper J, Krusic P, Peters K, Frank D (2009) Exploration of long-
term growth changes using the tree-ring detrending program
Spotty. Dendrochronologia, doi: 10.1016/j.dendro.2008.07.003.
Esper J, Shiyatov SG, Mazepa VS, Wilson RJS, Graybill DA,
Funkhouser G (2003b) Temperature-sensitive Tien Shan tree
ring chronologies show multi-centennial growth trends. Cli-
mate Dynamics, 8, 699–706.
Esper J, Wilson RJS, Frank DC, Moberg A, Wanner H, Luterba-
cher J (2005b) Climate: past ranges and future changes. Qua-
ternary Science Reviews, 24, 2164–2166.
Frank D, Buntgen U, Bohm R, Maugeri M, Esper J (2007a)
Warmer early instrumental measurements versus colder re-
constructed temperatures: shooting at a moving target. Qua-
ternary Science Reviews, 26, 3298–3310.
Frank D, Esper J, Cook ER (2007b) Adjustment for proxy
number and coherence in a large-scale temperature recon-
struction. Geophysical Research Letters, 34, L16709, doi:
10.1029/2007GL030571.
Friedrichs DA, Neuwirth B, Winiger M, Loffler J (2008) Metho-
dologically induced differences in oak site classifications in a
homogeneous tree-ring network. Dendrochronologia, doi:
10.1016/j.dendro.2008.02.001.
Fritts HC (1976) Tree Rings and Climate. Academic Press, London.
Hansen J, Ruedy R, Glascoe H, Sato M (1999) GISS analysis of
surface temperature change. Journal of Geophysical Research,
104, 30997–31022.
Hantemirov RM, Shiyatov SG (2002) A continuous multimillen-
nial ring-width chronology in Yamal, northwestern Siberia.
The Holocene, 12, 717–726.
Helama S, Vartiainen M, Kolstrom T, Peltola H, Merilainen J
(2008) X-ray microdensitometry applied to subfossil tree-rings:
growth characteristics of ancient pines from the southern
boreal forest zone in Finland at intra-annual to centennial
time-scales. Vegetation History and Archaeobotany, 17, 675–686.
Hinkel KM, Nelson FE, Klene AE, Bell JH (2003) The urban heat
island in winter at Barrow, Alaska. International Journal of
Climatology, 23, 1889–1905.
Houghton RA (2003) Why are estimates of the terrestrial carbon
balance so different? Global Change Biology, 9, 500–509.
IPCC (2007) Climate Change 2007: The Physical Science Basis.
Contribution of Working Group I to the Fourth Assessment Report
of the IPCC. Cambridge University Press, Cambridge, UK and
New York.
Jacoby G, Lovelius N, Shumilov O, Raspopov O, Kurbainov J,
Frank D (2000) Long-term temperature trends and tree growth
in the Taymir region of northern Siberia. Quaternary Research,
53, 312–318.
Jacoby GC, D’Arrigo R (1995) Tree-ring width and density
evidence of climatic and potential forest change in Alaska.
Global Biogeochemical Cycles, 9, 227–234.
Jacoby GC, D’Arrigo RD (1989) Reconstructed northern hemi-
sphere annual temperature since 1671 based on high latitude
tree-ring data from North America. Climatic Change, 14, 39–59.
Karl TR, Diaz HF, Kukla G (1988) Urbanization: its detection and
effect in the United States climate record. Journal of Climate, 1,
1099–1123.
Kirdyanov A, Vaganov E, Hughes MK (2007) Separating the
climatic signal from tree-ring width and maximum. Trees, 21,
37–44.
Knorre AA, Kirdyanov AV, Vaganov EA (2006) Climatically-
induced interannual variation in aboveground biomass
productivity in the forest-tundra and northern taiga of central
Siberia. Oecologia, 147, 86–95.
S I B E R I A N I N D I C A T O R S O F WA R M I N G 397
r 2009 Blackwell Publishing Ltd, Global Change Biology, 16, 386–398
Lamb HH (1965) The early medieval warm epoch and its sequel.
Palaeogeography, Palaeoclimatology and Palaeoecology, 1, 13–37.
Landsberg HE (1981) The Urban Climate. Academic Press, New
York.
Lee TCK, Zwiers FW, Tsao M (2008) Evaluation of proxy-based
millennial reconstruction methods. Climate Dynamics, 31,
263–281.
Lloyd A, Fastie C (2002) Spatial and temporal variability in the
growth and climate response of treeline trees in Alaska.
Climatic Change, 58, 481–509.
Lloyd AH, Bunn AG (2007) Response of the circumpolar boreal
forest to 20th century climate variability. Environmental Research
Letters, 2, O45013, doi: 10.1088/1748-9326/2/4/045013.
Luckman BH, Wilson RJS (2005) Summer temperature in the
Canadian Rockies during the last millennium: a revised re-
cord. Climate Dynamics, 24, 131–144.
Malhi Y, Meir P, Brown S (2002) Forests, carbon and global
climate. Philosophical Transactions of the Royal Society of London
Series A, 360, 1567–1591.
Mann ME, Zhang Z, Hughes MK, Bradley RS, Miller SK,
Rutherford S, Ni F (2008) Proxy-based reconstructions of
hemispheric and global surface temperature variations over
the past two millennia. Proceedings of the National Academy of
Sciences, 105, 13252–13257.
Melvin TM (2004) Historical growth rates and changing climatic
sensitivity of boreal conifers. PhD Thesis, University East Anglia,
Norwich, UK.
Parker DE (1994) Effects of changing exposure of thermometers
at land stations. International Journal of Climatology, 14, 1–31.
Peterson TC, Vose R, Schmoyer R, Razuvaev V (1998) Global
Historical Climatology Network (GHCN) quality control of
monthly temperature data. International Journal of Climatology,
18, 1169–1179.
Peterson TC, Vose RS (1997) An overview of the Global Historical
Climatology Network temperature database. Bulletin of the
American Meteorological Society, 78, 2837–2849.
Rutherford S, Mann ME, Osborn TJ, Bradley RS, Briffa KR,
Hughes MK, Jones PD (2005) Proxy-based Northern Hemi-
sphere surface temperature reconstructions: sensitivity to
methodology, predictor network, target season and target
domain. Journal of Climate, 18, 2308–2329.
Schweingruber F (2002) Jahrringforschung und Klimawandel in
den borealen Waldern. Schweizerische Zeitschrift fur Forstwesen,
153, 29–32.
Schweingruber FH (1993) Dendrochronological sampling strate-
gies for radiodensitometric networks in northern hemisphere
subalpine and boreal zones. European Palaeoclimate and Man, 4,
205–209.
Schweingruber FH, Braker OU, Schar E (1979) Dendroclimatic
studies on conifers from central Europe and Great Britain.
Boreas, 8, 427–452.
Schweingruber FH, Briffa KR (1995) X-ray densitometry as a tool
for reconstructing Northern Hemispheric summer tempera-
tures. In: Tree Rings. From the Past to the Future. Proceedings of the
International Workshop on Asian and Pacific Dendrochronology
(eds Ohta SFujii T, Okada N et al.), pp. 267–272. Tokyo
University, Tokyo.
Schweingruber FH, Briffa KR (1996a) Reconstruction of summer
temperatures with a circumpolar tree ring network. In: Fire in
Ecosystems of Boreal Eurasia (eds Goldammer GJ, Furyaev V),
pp. 105–111. Kluver, Dordrecht.
Schweingruber FH, Briffa KR (1996b) Tree-ring density networks
for climate reconstruction. In: Climatic Variations and Forcing
Mechanisms of the Last 2000 Years (eds Jones PD, Bradley RS,
Jouzel J), pp. 43–66. Springer, Berlin.
Thompson DWJ, Kennedy JJ, Wallace JM, Jones PD (2008) A
large discontinuity in the mid-twentieth century in observed
global-mean surface temperature. Nature, 453, 646–649.
von Storch H, Zorita E, Jones JM, Dimitriev Y, Gonzalez-Rouco F,
Tett SFB (2004) Reconstructing past climate from noisy data.
Science, 306, 679–682.
Wilmking M, D’Arrigo R, Jacoby G, Juday G (2005) Divergent
growth responses in circumpolar boreal forests. Geophysical
Research Letters, 32, L15715, doi: 10.1029/2005GLO23331.
Wilson R, D’Arrigo R, Buckley B et al. (2007) A matter of
divergence – tracking recent warming at hemispheric scales
using tree-ring data. Journal of Geophysical Research, 112,
D17103, doi: 10.1029/2006JD008318.
Wilson RJS, Frank DC, Topham J, Nicolussi K, Esper J (2005)
Problems and opportunities for the spatial reconstruction of
summer temperatures in central Europe. Boreas, 34, 490–497.
Wunder J, Brzeziecki B, ¯ybura H, Reineking B, Bigler C, Bug-
mann H (2008) Growth-mortality relationships as indicators of
life-history strategies: a comparison of nine tree species in
unmanaged European forests. Oikos, 117, 815–828.
Supporting Information
Additional Supporting Information may be found in the
online version of this article:
Table S1. Tree-ring data statistics of clusters C1 to C7, their
regional means C1-3 and C4-6, and the mean of all data C1-7.
MTA is mean tree age, Rbar is mean interseries correlation,
and AC(1) is first year autocorrelation. Rbar and AC(1) were
derived from 32-year spline and RCS detrended data (since
1800 AD), respectively.
Table S2. Tree-ring site statistics.
Table S3. Siberian long-term climate stations.
Figure S1. Decadally averaged residuals of the raw versus
adjusted JJA temperature data (black), the MXD versus JJA
temperature data (red), and the TRW versus JJA temperature
data (blue).
Please note: Wiley-Blackwell are not responsible for the content
or functionality of any supporting materials supplied by the
authors. Any queries (other than missing material) should be
directed to the corresponding author for the article.
398 J . E S P E R et al.
r 2009 Blackwell Publishing Ltd, Global Change Biology, 16, 386–398