Trends and Zonal Variability of Extreme RainfallEvents Over East Africa During 1960-2017Moses.A Ojara
Nanjing University of Information Science and Technology https://orcid.org/0000-0002-3989-3702Yunsheng Lou ( [email protected] )
Nanjing University of Information Science and TechnologyHasssen Babaousmail
Nanjing University of Information Science and TechnologyPeter Wasswa
Makerere University
Research Article
Keywords: Rainfall extreme events, DFA, East Africa
Posted Date: March 4th, 2021
DOI: https://doi.org/10.21203/rs.3.rs-273628/v1
License: This work is licensed under a Creative Commons Attribution 4.0 International License. Read Full License
1
Trends and Zonal Variability of Extreme Rainfall events over East Africa during 1960-1
2017 2
3
4
Moses A. Ojara 1, 2, 3, Yunsheng Lou1, 2*, Hasssen Babaousmail1, 2, Peter Wasswa4 5
6
1Collaborative Innovation Center on Forecast and Evaluation of Meteorological Disasters, 7
Nanjing University of Information Science and Technology, Nanjing 210044, China 8
2Jiangsu Key Laboratory of Agricultural Meteorology, College of Applied Meteorology, Nanjing 9
University of Information Science and Technology, Nanjing 210044, China 10
3Uganda National Meteorological Authority, Plot 21, 28 Port Bell Rd, Kampala 11
P.O. Box 7025 Kampala, Uganda. 12
4Makerere University College of Geoinformation, Environment and Climate Sciences 13
14
*Corresponding Author 15
Prof. Dr Lou Yunsheng 16
Email:[email protected]
2
Abstract 18
East African countries (Uganda, Kenya, Tanzania, Rwanda, and Burundi) are prone to weather 19
extreme events. In this regard; the past occurrence of extreme rainfall events is analyzed for 25 stations 20
following the Expert Team on Climate Change Detection and Indices (ETCCDI) regression method. 21
Detrended Fluctuation Analysis (DFA) is used to show the future development of extreme events. 22
Pearson’s correlation analysis is performed to show the relationship of extreme events between different 23
rainfall zones and their association with El Niño -Southern Oscillation (ENSO and Indian Ocean dipole 24
(IOD) IOD-DMI indices. Results revealed that the consecutive wet day's index (CWD) was decreasing 25
trend in 72% of the stations analyzed, moreover consecutive dry days (CDD) index also indicated a 26
positive trend in 44% of the stations analyzed. Heavy rainfall days index (R10mm) showed a positive 27
trend at 52% of the stations and was statistically significant at a few stations. In light of the extremely 28
heavy rainfall days (R25mm) index, 56% of the stations revealed a decreasing trend for the index and 29
statistically significant trend at some stations. Further, a low correlation coefficient of extreme rainfall 30
events in the regions; and between rainfall extreme indices with the atmospheric teleconnection indices 31
(Dipole Mode Index-DMI and Nino 3.4) (r = -0.1 to r = 0.35). Most rainfall zones showed a positive 32
correlation between the R95p index and DMI, while 5/8 of the rainfall zones experienced a negative 33
correlation between Nino 3.4 index and the R95p. In light of the highly variable trends of extremes 34
events, we recommend planning adaptation and mitigation measures that consider the occurrence of such 35
high variability. Measures such as rainwater harvesting, stored and used during needs, planned settlement, 36
and improved drainage systems management supported by accurate climate and weather forecasts is 37
highly advised. 38
39
40
41
42
43
44
45
46
47
Keywords: Rainfall extreme events, DFA, East Africa 48
49
3
1. Introduction 50
East African (EA) countries (Uganda, Kenya, Tanzania, Rwanda, and Burundi) are prone to 51
climate and weather extreme events that usually expose their population to risks and vulnerability (Kilavi 52
et al. 2018). The rains are highly variable and frequently associated with extremes events such as flash 53
floods (Indeje et al. 2000; Nicholson 2017), and droughts (Gamoyo et al. 2015). These events continue to 54
increase great stress on many EA countries by disrupting food production and distribution channels in the 55
region (FAO 2017). The impact of some climate extreme events such as frequent flash floods, long dry 56
spells, frequent droughts usually result in damages to socio-economic infrastructure, food insecurity, and 57
loss of lives (Schlenker and Lobell 2010; Adhikari et al. 2015; Onyutha 2016; Pereira 2017). Extreme 58
climate events have led to the human population suffering especially in the face of more frequent droughts 59
and floods in the region (Lyon and DeWitt 2012). 60
Several parts of EA have experienced one or more extreme precipitation episodes over the last 61
decades. For example; Uganda has experienced alternating episodes of floods, droughts, or dry spells in 62
eastern and northeastern which have resulted in frequent loss of human lives, livestock, as well as the 63
destruction of socio-economic infrastructure (Onyutha 2016). And according to the World Bank report of 64
2009, Kenya experienced financial loss worth 870 million dollars during 1997/1998 ENSO/ El Niño 65
events that led to flooding in the region (Davis et al. 2009). Besides these; climate extremes events cause 66
massive loss of life of other living organisms and threaten the total extinction of some vital species 67
(Downing 1991; Omondi et al. 2013). Incidences of pests and disease occurrence with extreme climate 68
events have been examined by other authors (e.g Pascal et al. 2006; Stern et al. 2011). 69
Seasonal rainfall over EA is also regulated by the weather phenomena such as the Indian Ocean 70
dipole (IOD) (Behera et al. 2005; Onyutha 2016) and El Niño -Southern Oscillation (ENSO), which are 71
associated with the interannual variability as well as extreme rainfall events (Indeje et al. 2000; Ogwang 72
et al. 2015a; Onyutha 2016). For example; the warm phase of ENSO/ El Niño usually results in extremely 73
high rainfall in most parts of EA which normally causes occasional floods like the episode of 1997/1998 74
(Amissah et al. 2002; Takaoka 2005). Conversely, the cold phase of ENSO/ La Niña is associated with 75
extremely dry air and subsequently drought conditions of most regions of EA. 76
Standardized rainfall anomaly revealed an increase in the intensity of extreme precipitation events 77
for above normal cases over EA (Ongoma et al. 2018), and the region is expected to strongly warm and 78
rainfall extremes increased by the end of the twenty-first century (Ongoma et al. 2017). Results from 79
recent global studies indicate changes in frequencies, intensity, geographical extent, duration, and timing 80
of climate extreme events (Cai et al. 2014). An increase in rainfall extreme events such as very wet days 81
4
(R95p) and extremely wet days (R99p) predicted in the future (2021-2100) are bounds to cause the loss of 82
lives and destruction of property due to increase in flood intensities and drought frequencies (Ongoma et 83
al. 2017). 84
Moreover, incidences of upward tendencies in the length of the maximum dry spell occurring 85
during rainy months have been reported in the region (Tilya and Mhita 2007; Ojara et al. 2020), which are 86
associated with the reduction to crop production in the region. In addition to these, rainfall related extreme 87
events such as; wet days, annual total precipitation in wet days (PRCPTOT), simple daily intensity index 88
(SDII), heavy precipitation days, very heavy precipitation days, and severe precipitation, have recorded 89
significant changes over the recent decades (Bouagila et al. 2013; Gitau et al. 2018; Ongoma et al. 2018). 90
A recent study suggests that the annual trends of precipitation indices such as the number of days 91
with precipitation ≥20mm (R20mm), (R50mm), and very wet days of precipitation amounts (R95p) were 92
generally decreasing from 1981 to 2010, but positive trends in the indices are revealed under 93
representative concentration pathways (RCP4.5) future climate scenario (Nimusiima et al. 2019). 94
Considering the impacts of extreme rainfall events over EA which range from loss of human and 95
animal lives to the destruction of properties, it is important to fully understand previous climate events 96
and their impacts to make more accurate and reliable forecasts to alleviate their impact (Ogwang et al., 97
2015b; Onyutha 2016). While we acknowledge previous attempts aimed at generating information on 98
extreme rainfall events over EA (e.g Hague 2010; Ogwang et al. 2015b; Ongoma and Chen 2018; Kilavi 99
et al. 2018; Nimusiima et al. 2019; Nkunzimana et al. 2019), in-depth and regular comprehensive analysis 100
of rainfall extremes events which are required to support adaptation and mitigation of impacts are still 101
inadequate. The present study analyses daily observed rainfall data to show the recent past occurrence of 102
extreme rainfall events and their consistency for future development in EA. 103
The remaining subsequent sections of the present study are structured as follows: Section 2 104
describes the study domain, datasets, and methods. This is followed by section 3 presenting the main 105
results. Section 4 elucidates the conclusion and recommendations based on the findings of this research. 106
107
2 Data and Methodology 108
2.1 Study Area 109
The study domain is East Africa (EA) comprising 5 countries located in the eastern part of the 110
African continent (Fig.1). The region is enclosed within the geographical latitudes 5.1º N to 11.74º S and 111
longitudes 28.86º E to 41.91º E. The main physical features in the region include open water bodies, 112
valleys, and high mountains with a maximum altitude of 5882 meters above sea level (Fig.1b). 113
5
114
Fig.1: Shows map of Africa (a), showing East Africa right (b), and meteorological stations (red dots). 115
Normally; EA experiences two main rainy seasons; the first season occurs in months of March-116
April and May (MAM), usually referred to as the ‘’long rains’’ (Camberlin and Philippon 2002; Gamoyo 117
et al. 2015; Ogwang et al. 2016; Ongoma and Chen 2017), and this is frequently termed as the Borel 118
spring. This season follows the Inter-tropical convergence zone (ITCZ) migration to the northern 119
hemisphere, and the second season usually referred to as “short rains’’ (Kizza et al. 2009) occurs during 120
October to December (OND) resulting from the movement of the ITCZ from the north to Southern 121
hemisphere. The rains are also influenced by atmospheric phenomena such as El-Nino Southern 122
Oscillation (ENSO) (Indeje et al. 2000; Ntale and Gan 2004) and the Indian Ocean Dipole (IOD) (Behera 123
6
et al. 2005). The El Niño Southern Oscillation (ENSO) phenomena are strongly associated with the inter-124
annual variability of rainfall in this region (Indeje et al. 2000). 125
126
2.2 Data 127
2.2.1 In situ datasets 128
Daily and monthly rainfall datasets from meteorological agencies namely; Uganda National 129
Meteorological Authority, Kenya Meteorological Department. Rwanda Meteorology Agency, and 130
Geographical Institute of Burundi and Tanzania Meteorological Authority were sourced. Detail 131
geographical and rainfall statistical information for each meteorological station are presented in table 1. 132
Table 1: Show the details of the Meteorological stations used in this study 133
Station name
Long (Deg)
Lat (Deg)
Elevation (Meters)
Data Period
Annual rainfall (mm) Min Max Mean
RF zone (R1-R8)
Wajir 41.9 3.9 271.0 1960-2016 80.5 1129.1 334.1 1
Garissa 40.1 1.8 246.1 1957-2016 102.9 369.8 208.1 1
Marsabit 38.0 2.3 1283.2 1960-2016 99.7 1469.4 725.0 1
DAR 39.1 -6.8 156.2 1980-2017 585.0 1990.2 1139.2 2
Dagoretti 36.8 -1.3 1830.0 1961-2016 258.1 1028.3 478.6 3
Narok 35.9 -1.1 1950.4 1964-2016 695.2 867.4 413.0 3
Namulonge 32.6 0.5 1128.1 1963-2017 676.3 1475.6 1120.0 4
Tororo 34.2 0.7 1176.2 1970-2017 1032.4 2160.4 1522.2 4
Soroti 33.6 1.7 1115.1 1961-2014 1011.1 1726.6 1347.6 4
Jinja 33.1 0.5 1175.0 1961-2017 914.0 1700.0 1286.9 4
Lira 32.9 2.3 1120.4 1971-2017 1106.3 1873.1 1501.7 4
Serere 33.5 1.5 1098.2 1961-2017 850.1 2380.2 1356.0 4
Kiige 33.0 1.1 1089.1 1971-2017 735.4 1968.3 1322.0 4
Bukoba 31.8 -3.4 1144.0 1960-2016 1523.6 2736.1 2071.4 5
Mbeya 33.5 -8.9 1791.5 1960-2017 617.4 1287.5 931.0 5
Kisumu 34.8 -0.1 1154.3 1960-2016 178.5 1366.4 936.1 6
Kampala 32.6 0.3 1162.2 1980-2016 223.4 1295.3 783.7 6
Entebbe 32.6 0.5 1117.7 1951-2016 271.7 1592.1 1073.1 6
Mbarara 30.4 -0.1 1408.3 1950-2016 183.4 933.2 451.3 7
Kasese 30.1 0.1 931.0 1964-2016 179.7 975.4 502.2 7
Masindi 31.4 1.4 1136.2 1960-2016 276.0 1298.7 445.1 7
Kabale 29.6 -1.2 1743.1 1960-2016 136.1 1039.6 745.6 8
Gitega 30.1 -2.0 1524.4 1970-2017 381.0 1129.1 413.3 8
Nyagatare 30.3 -1.3 1366.2 1970-2017 203.3 804.0 209.3 8
Nyanza lac 29.6 -4.3 874.0 1970-2017 192.1 1227.1 933.4 8
Gisenyi 29.3 -1.7 1591.8 1970-2017 193.0 995.4 589.1 8
134
The duration for all country datasets was taken varying from 1950 to 2017. The data was collected 135
from manual rain gauges. The stations were selected to represent homogenous rainfall zones of EA 136
7
(Fig.1). Preliminary quality assessment of data at source includes; checks control to identify the negative 137
precipitations values, typing errors to identify gaps in the dataset, false zeros. Thereafter statistical quality 138
assessments were performed on the datasets as described in the methodology section. 139
2.1.3 Atmospheric Indices. 140
Two main climate indices are used to show the influence of major atmospheric indices on rainfall 141
variability in EA. The indices were selected based on the relevancy demonstrated in past studies 142
explaining the variation in rainfall over EA (Indeje et al. 2000; Behera et al. 2005; Onyutha 2016). First; 143
the El Nino-Southern Oscillation (ENSO), Nino3.4 index which is of monthly temporal resolution 144
represents the interaction between the atmosphere and the Ocean in the Tropical Pacific which 145
periodically causes variation below-normal or above-normal sea surface temperatures and dry and wet 146
conditions over a few years. ENSO climate index was accessed from the link; 147
https://www.esrl.noaa.gov/psd/gcos_wgsp/Timeseries/Data/nino34.long.anom.data 148
The IOD is the anomalous SST difference between the western (50∘-70∘E and 10∘S-10∘N) and 149
south-eastern (90∘-110∘E and 10∘S-0∘N) of the Indian Ocean (Onyutha 2016). It is an interannual climate 150
pattern exhibited across the tropical Indian Ocean (Saji et al.1999; Behera et al. 2005). Saji et al. (1999) 151
suggest that cooler than normal water and warmer than normal water in the tropical western Indian Ocean 152
characterizes the positive IOD period. On the other hand, a negative IOD period is shown by the positive 153
conditions at the same location in the ocean. The monthly IOD time series data can be downloaded from 154
the NOAA official website (https://www.esrl.noaa.gov). These two indices were selected based on the 155
relevancy demonstrated in past studies explaining the variability of rainfall over EA (Indeje et al. 2000; 156
Behera et al. 2005; Onyutha 2016). 157
158
2.1.4 Climate Hazards Group Infrared Precipitation with Stations datasets (CHIRPS) 159
To examine recent spatial variability in extreme events, the CHIRPS gridded dataset of high 160
resolution (0.05°x 0.05°) for 1981 to date was selected. CHIRPS data is one of the best datasets compared 161
to ground observation datasets that have been greatly used for variability studies in East Africa (e.g 162
Gebrechorkos et al. 2019). Lack of well-distributed and managed rain-gauges in the region is a challenge 163
to spatial analysis of climate data (Nicholson et al. 2018; Wainwright et al. 2019), which can only be 164
overcome by the use of satellite or reanalysis datasets. This dataset was developed by merging three types 165
of information of high resolution including global climatology, satellite estimates, and in situ 166
observations, which greatly improved the rainfall products. More details of CHIPRPS data can be found 167
8
from Funk et al. (2015). The performances of Satellite dataset (CHIRPS) using statistical matrices such as 168
correlation coefficient (R), root mean square error (RMSE) and Bias present a good representation of 169
rainfall with station observations over the region except over a few areas (Table S2). 170
171
2.3. Methodology 172
2.3.1 Missing, Outlier, Normality and Homogeneity test 173
Some stations had few gaps which were filled based on the recommendation that data gaps can be 174
filled if there are no more than 5 consecutive missing days or less than 10 days throughout the monthly 175
data (WMO 2013). The estimation of missing data was performed using linear regression methods as it is 176
simple to compute and gives good results (Kizza et al. 2009). 177
Outlier test was performed using Grubb’s test and the results showed 2 outliers in Jinja stations 178
which were found to be due to data entry error after verification with (WMO) form 49A for rainfall data 179
entry. The remaining stations did not show outliers. 180
A normality test was performed using Shapiro-Wilk tests for the distribution type at a 5% 181
significance level. All data were found to be approximately normally distributed. This was followed by 182
the homogeneity test to ensure that variation in the climate data is due to climatic factors only (Aguilar et 183
al. 2003). The test helps in avoiding wrong results leading to bias interpretations and conclusions about 184
the data (Costa and Soares 2009). The data were tested for homogeneity using two methods; Standard 185
normal homogeneity test (SNHT) and Buishand's test at a 5 % significant level. The null hypothesis was 186
that the data were homogenous. Reference can be drawn from (Buishand 1982; Aguilar et al 2003) for a 187
detailed discussion about the homogeneity test. This preliminary result is presented in Table S3. 188
189
2.3.4 Occurrence of extreme rainfall events. 190
Statistical metrics for analyzing extreme events in climate indices compiled by the Expert Team 191
on Climate Change Detection Indices (ETCCDI) group have been computed. The method developed by 192
the ETCCDI group to extract moderate climate indices is a regression approach. Typical of these climate 193
indices are well described in (Zhang 2011; Sillmann et al. 2013), these tend to examine only “moderate 194
event” in rainfall and are typically occurring at least once a year (Zhang et al. 2011). In total, 11 rainfall 195
related indices from the ETCCDI lists were extracted using the RClimDex tool (Zhang et al. 2005). The 196
most important factor with this tool is that it is designed to perform quality checks and data harmonization 197
process before the actual analysis is done. The indices are deemed important for this study based on the 198
literature analysis from other authors (Mubiru et al. 2012; Ongoma and Chen. 2017). Descriptions, code 199
9
names of each rainfall extreme indices are well-described (Table S1) and more detailed mathematical 200
expression can be obtained from the website for ETCCDI; 201
(http://etccdi.pacificclimate.org/list_27_indices.shtml). 202
203
2.3.5 Relationship between extreme rainfall events with synoptic-scale teleconnections 204
To show the relationship between extreme rainfall indices and two main synoptic-scale 205
teleconnections; ENSO and IOD within the 8 rainfall zones were established using a correlation 206
coefficient. First; rainfall data for each meteorological station in given rainfall zones were aggregated and 207
extreme rainfall indices were computed. Correlation analysis was perfumed to show the relationship 208
between extreme rainfall indices within any two given rainfall zones (R1-R8), as well as establish the 209
influence of two atmospheric indices (ENSO-Nino3.4) and Indian Ocean Dipole (DMI) in each of the 210
rainfall zones, Pearson’s correlation analysis was performed and the correlation coefficient (r’) plotted in 211
a correlation diagrams for some key rainfall indices 212
2.3.6 Detrended fluctuation analysis (DFA) 213
Detrended fluctuation analysis (DFA) is a correlation analysis based on a long-range power-law 214
method developed in recent years for the study of Deoxyribonucleic acid (DNA), but it is also suitable for 215
nonstationary time series (Peng et al. 1994). The development of DFA techniques have been accepted and 216
widely used in many studies of the long-range correlation in natural science and systems. For example; Li 217
and Zhang (2007) used the DFA method to quantify fraction dynamics of groundwater systems in a small 218
agricultural watershed and observed that fluctuations of groundwater levels and base flow are dynamic 219
responses of the groundwater system to its recharge e.tc, 220
Varotsos et al. (2006) used the same approach in the study of the global Aerosol Index (AI) to find 221
self-similarity properties in their values extracted from satellite measurement during 1979-2003. In more 222
directly related research, the approach was employed in the scaling of near-surface air temperature 223
fluctuations and its geographical distribution analyzed in the simulation of the current climate with a 224
complex atmosphere-ocean model (Fraedrich and Blender 2003). Recently; DFA techniques were used to 225
analyze the trends and extreme values in extreme temperature and precipitation events in Inner Mongolia 226
(China) during 1960–2017 by Tong et al. (2019) 227
In this study, DFA was used to predict future development trends in extreme climate indices. DFA 228
is computed following Step-wise procedure for calculation of trends in precipitation extremes (Tong et al. 229
2019), given below; 230
10
First, for precipitation sequence (xk, k =1, 2… N), N is the length of the precipitation extreme sequence, 231
x
is the mean value, and the accumulative deviation sequence of the original sequence is determined by 232
equation (1) below; 233
1
( )N
kk
y i x x
, where; 1 2 3( , , ....... )i N (1) 234
Thereafter, the new sequence y(i) was divided into Ns series of non-overlapping sub-intervals with a 235
length of s: 236
(N / s)s
N int (2) 237
In this computation the sequence is not precisely divisible, thus to ensure the integrity of the information, 238
the sequence is divided once more in the reverse direction so that a total of 2Ns sub-intervals could be 239
obtained. The value of ‘s’ was selected according to the length of the sequence and the operational 240
requirements. 241
This was followed by a polynomial fitting on the data of each sub-interval v(v = 1, 2, …….…2Ns), and a 242
local trend function yv(i) was obtained. Then the trend of the original sequence is eliminated in the sub-243
function to strain out the trend in the sequence as ys(i) 244
sy ( ) ( ) ( )
vi y i y i 1 2 3( , , ....... )i N (3) 245
yv(i) can be first order, second order, or higher order polynomial; the second-order polynomial is used 246
here. After the elimination of the trend, the variance in each interval was calculated as follows: 247
212 1
1
{ }( , )s
F v s y v s i y ivs i
(4) 248
, where 1 2 3( , , ....... )i N 249
212
1
{ }( , )s
sF v s y N v N s i y i
vs i
(5) 250
and 1 2 3 2( , , ....... )s s s s
i N N N N 251
The second-order wave function of the whole sequence was determined as follows: Fs 252
1 2F2 1
( ) ( , )s
ss F v s
N v
(6) 253
Finally, power-law correlations of F(s) and s changes were analyzed by the equation (7): 254
11
F( ) as s: or In F( )s a lns + b (7) 255
In this double logarithmic coordinate, the data were fitted by the least square method and the slope ‘a’ of 256
the linear trend is the scaled DFA index. If slope a = 0.5, shows that the sequence is random and is an 257
independent random process. But, if 0 < a < 0.5, then the values of the sequence are not independent and 258
therefore represent a short-range correlation or anti-persistence, which symbolizes that the data series has 259
the opposite trend relative to that of the previous time series. However, if 0.5 < a < 1, then the process is 260
continuous and the future trend is consistent with the previous trend. The closer the value is to 1, the 261
greater the tendency of this consistency. 262
263
3. Results and Discussion 264
3.1 Normality and Homogeneity test. 265
The results of the homogeneity test using the Standard Normal Homogeneity Test (SNHT) showed 266
that all the stations are approximately homogeneous, while the Buishand test at a 5% significance level 267
shows that only 2 stations are inhomogeneous in 2 different months. These two stations are; Kotido and 268
Nakasongola station were dropped from further analysis. Rainfall data for most stations in the region were 269
also found to be homogenous (Mugume et al. 2016: Ongoma et al. 2018). Preliminary of this quality 270
control analysis is presented in Table S2 at the Appendix. 271
272
3.3 Spatial distribution and trends of extreme rainfall events 273
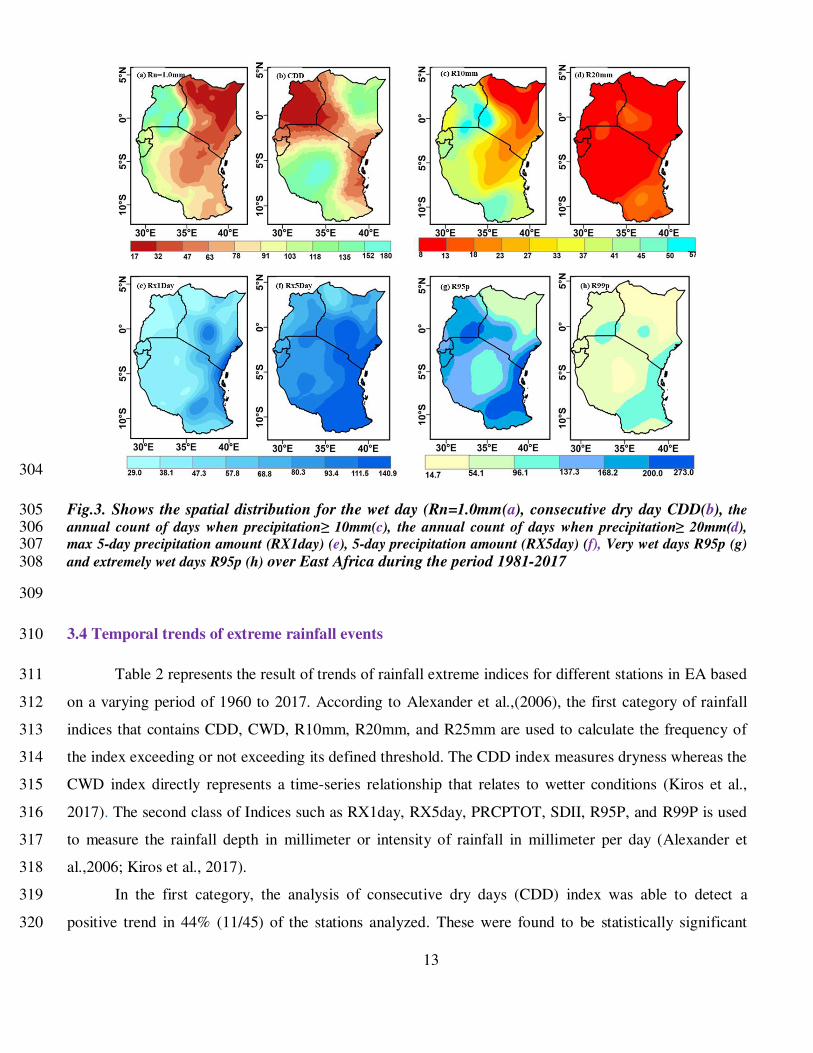
Figure 3 shows the spatial distribution of 8 main rainfall indices over East Africa during the recent 274
period (1981-2017). Results showed that the total number of rainy days index (Rn=1.0mm) in most parts 275
of EA including rainfall zone 4,6,7 and Western Kenya towards Mount Elgon, experienced more numbers 276
of rainy days ranging from 118 to 180 days in a year (Fig.3a). The number of rainy-day patterns shows a 277
reduction towards the highlands of Rwanda, Burundi, and western Tanzania receiving about 91 to 118 278
days of rainfall. In reference to the pattern of consecutive dry days, (CDD) the entire Uganda, Rwanda 279
and Burundi, Western Kenya to northwestern Kenya, Mountain Kenya areas (rainfall zone 3) extending to 280
most parts of rainfall zone 2, and the coastal area along rainfall zone 5 experienced the lowest number of 281
dry days (CDD) ranging from 17 to 91 days, while northeastern Kenya in rainfall zone 1(R1), and most of 282
Southwestern, Western and Central parts of Tanzania, covering a large proportion of rainfall zone 5 (R5) 283
received the highest number of CDD days ranging from 91 to 180 days (Fig.3b). 284
12
For heavy rainfall days (R10mm), a higher number of days (45-57 days) are observed to be 285
concentrated around Lake Victoria and Mount Elgon, to most parts of northern Uganda, Southwestern 286
Tanzania, and Burundi in rainfall zone 8. With exception of northern Kenya in rainfall zone1 which 287
received less than 20 days of heavy rainfall days (R10mm), the majority of EA received about 18 to 37 288
days of heavy rainfall days (R10mm). (Fig.3c). The result indicated that the entire EA received less than 289
20 days (8 -18 days) of very heavy rainfall days (R20mm) during the period 1981-2017(Fig.3d). 290
Throughout the analysis (1981-2017), the highest rainfall amount in the one day (RX1day) range 291
from 29.0 mm to 140.0 mm, the largest portion of EA showed a range of 29.0 to 80.0 mm. relatively 292
higher values (68.8-140.0mm) are experienced in Mount Kenya located in rainfall zone 3, to the coast 293
bordering the Indian Ocean (Fig.3e). A similar pattern is recorded for the highest rainfall amount in five 294
consecutive days (Rx5day), however; the lowest amount of rainfall recorded for Rx5day is relatively 295
higher than those from RX1day ranging 68.8-140.0mm (Fig.3f). 296
For a very wet day's index (R95p), the highest amount of rainfall (200-273.0 mm) is received in 297
spots around lake Victoria and the coastal region bordering the Indian Ocean and southeastern Tanzania. 298
The majority of EA received between 137.3 to 200.0 mm except the vast portion of ASAL and central 299
Tanzania which received between 54.1 to 137.3 mm of rainfall (Fig.3g). Extremely wet days index 300
(R99p) showed that a large part of EA had 54.1- 96.1mm, followed by 14.1-54.1 mm in the ASAL area 301
and spot in central Tanzania, least by the highest values of 96.1- 137.3 mm in Lake Victoria and the 302
coastal region bordering the Indian Ocean and southeastern Tanzania (Fig.3h). 303
13
304
Fig.3. Shows the spatial distribution for the wet day (Rn=1.0mm(a), consecutive dry day CDD(b), the 305 annual count of days when precipitation≥ 10mm(c), the annual count of days when precipitation≥ 20mm(d), 306 max 5-day precipitation amount (RX1day) (e), 5-day precipitation amount (RX5day) (f), Very wet days R95p (g) 307 and extremely wet days R95p (h) over East Africa during the period 1981-2017 308
309
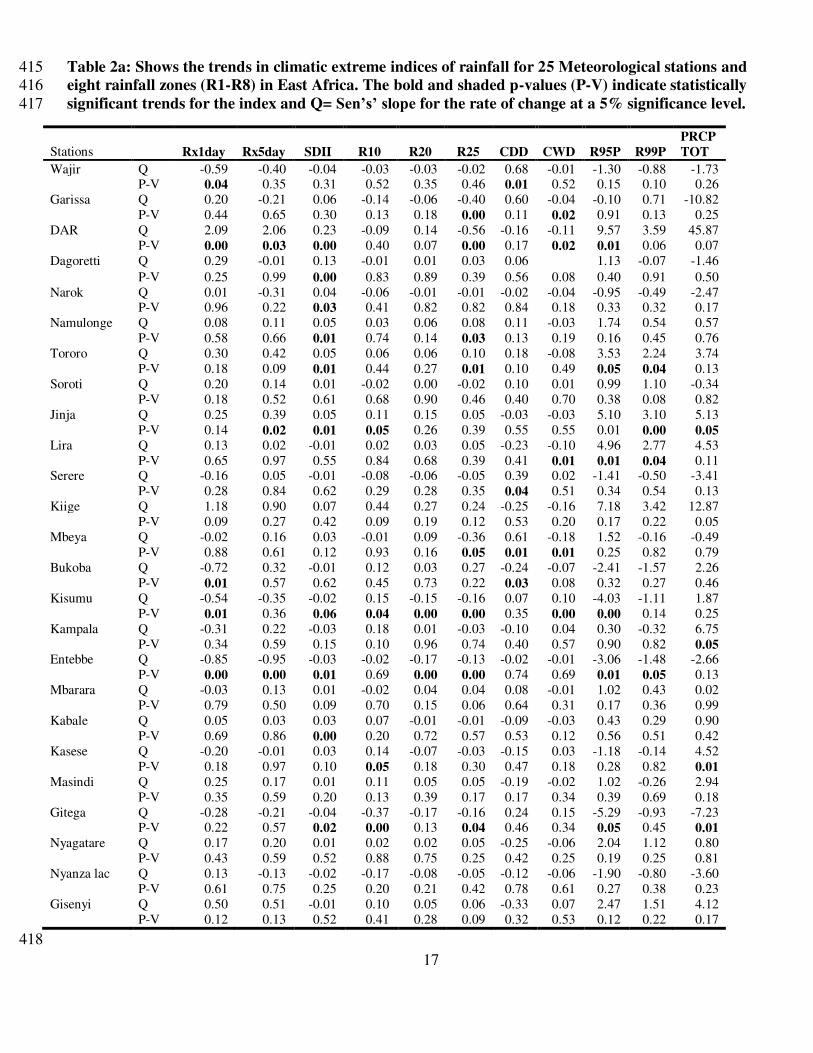
3.4 Temporal trends of extreme rainfall events 310
Table 2 represents the result of trends of rainfall extreme indices for different stations in EA based 311
on a varying period of 1960 to 2017. According to Alexander et al.,(2006), the first category of rainfall 312
indices that contains CDD, CWD, R10mm, R20mm, and R25mm are used to calculate the frequency of 313
the index exceeding or not exceeding its defined threshold. The CDD index measures dryness whereas the 314
CWD index directly represents a time-series relationship that relates to wetter conditions (Kiros et al., 315
2017). The second class of Indices such as RX1day, RX5day, PRCPTOT, SDII, R95P, and R99P is used 316
to measure the rainfall depth in millimeter or intensity of rainfall in millimeter per day (Alexander et 317
al.,2006; Kiros et al., 2017). 318
In the first category, the analysis of consecutive dry days (CDD) index was able to detect a 319
positive trend in 44% (11/45) of the stations analyzed. These were found to be statistically significant 320
14
trends at 3 stations including; Wajir station in the Arid and Semi-Arid region (ASAL) of Kenya in rainfall 321
zone (R11), Serere station in rainfall zone 4 (R4), and Mbeya station in rainfall zone 5(R5). In each case, 322
the rate of increase was; 0.7 days/year, 0.4 days/year, and 0.61 days/year respectively. The increasing 323
tendencies of CDD in the first regions (R1) corresponds to the decreasing trends in precipitation recently 324
reported (Mumo et al., 2019), while for the second rainfall zone (R4), the drying pattern has been 325
observed (Mubiru et al., 2012; Kansiime et al., 2013). Similarly; the length of maximum dry spells is 326
revealed to be significantly increased in rainfall zone 4 (R4) over the last 2 decades (Ojara et al., 2020). 327
The consecutive wet day's index (CWD) shows a decreasing trend in 72% (18/25) of the stations 328
analyzed and the trend is statistically significant for Garissa, DAR, and Lira and Mbeya stations in the 329
rainfall zone 1, 2, 4, and 5 respectively. For the few stations (28%) (7/25) that indicated a positive pattern 330
in the CWD index, only the Kisumu station in the rainfall 6 showed a statistically significant trend for the 331
index. The increasing trend of CDD and decreasing trend in CWD in the Greater Horn of Africa (GHA) 332
has also been observed by other recent studies (Omondi et al. 2013). EA is reported to be experiencing a 333
decreasing trend in precipitation especially in the main season) (Lyon and Dewitt 2012; Rowell et al. 334
2015), which is most likely that indices related to precipitation measure will show such a negative trend. 335
Additionally, heavy rainfall days (R10mm) show a positive trend at 52% (13/25) of the stations 336
but the trend is statistically significant at only 3 stations; Jinja, Kisumu, and Kasese stations each 337
increasing at a rate of 0.11 days/year, 0.15 day/year, and 0.142 days/year respectively. The remaining 338
48% (12/25) stations portrayed an insignificance positive trend for the (R10mm) index. Among the 339
stations which revealed a negative trend for heavy rainfall days (R10mm) index; only the Gitega station in 340
rainfall zone 8 showed statistical significance results with a rate of change of -0.365mm/year. Similar 341
results have been observed by other authors linking such an incidental trend to the changing climate in EA 342
(Ongoma et. al 2018). Contrary to this, 60% (15/25) of the stations analyzed revealed a statistical 343
insignificance positive trend for very heavy rainfall days (R20mm) index, and 40% (10/25) indicated a 344
negative trend in the R20mm index with two stations; Kisumu and Entebbe in rainfall zone 6 showing a 345
statistically significant decreasing trend at similar rates of -0.146 day/year and -0.168 day/year 346
respectively. 347
Similarly; extremely heavy rainfall days (R25mm) revealed a decreasing trend in 56%1(4/25) of 348
the stations. Stations such as Kisumu, Entebbe showed a statistically significant trend with a rate of 349
decrease of -0.164mm/year, -0.129mm/year, and -0.157 mm/year respectively. The very heavy rainfall 350
days (R20mm) and extremely heavy rainfall days (R25mm) index are associated to flash floods in the 351
region (Ongoma and Chen 2018). 352
15
Rainfall indices related to the depth or intensity of rainfall including; (RX1day, RX5day, SDII, 353
R95P R99P, and PRCPTOT also show varied results. The results show that the index; the highest rainfall 354
amount in the one-day (RX1day) was decreasing trend in 40% (10/25) stations and the trends were 355
statistically significant at Wajir; Kisumu, Bukoba, and Entebbe station. The rates of decrease of rainfall in 356
these stations were; -0.59 mm/year, -0.72mm/year, -0.54 mm/year respectively. Besides, rainfall indices 357
showing the highest rainfall amount in five consecutive days (Rx5day) showed a decreasing trend in 36% 358
(9/25) stations but the trend is statistically significant at Entebbe, changing at a rate of -0.95 mm/year. In 359
this case; the remaining 64% (16/25) of the stations revealed positive trends but statistically significant at 360
Dar-es-salaam (DAR) and Jinja stations; each increasing at the rate of 2.06 mm/year and 0.39 mm/year. 361
Simple daily intensity index (SDII) indicated positive trends 60% (15/25) of stations with stations 362
like Namulonge, Jinja, Tororo, Serere in rainfall zone 4, and Kabale stations in rainfall 8 showing a 363
statistically significant trend. SDII index was observed to be changing at s rate of -0.042 to 0.62 mm/year 364
between stations. Stations like Namulonge, Jinja, and Kabale are located within the Lake Victoria basin 365
were found to show the highest increase in SDII values (Ongoma and Chen 2018). SDII revealed a 366
decreasing trend in 40% (10/25) of the stations analyzed, and statistically significant negative trends are 367
observed at Entebbe and Gitega stations, each changing at -0.031mm/year, and -0.042 mm/year 368
respectively. 369
Regarding the trend of very wet days (R95p); 60% (15/25) of the stations showed an increasing 370
trend with 4 stations; Dar-es-salaam (DAR), Tororo, Jinja, and Lira showed statistically significant 371
positive trends, increasing at; 9.57 mm/year, 3.53 mm/year, 5.1mm/year, and 4.96 mm/year respectively 372
(Table 2). The last 3 stations; Tororo, Jinja, and Lira are located in the low-lying area of lake Kyoga Basin 373
in Uganda which is prone to high frequent flask floods and drought events in recent decades (Onyutha 374
2016). The remaining 40% (10/25) stations indicated a negative trend in the very wet day’s (R95p) index; 375
but the most notable stations with a significant statistical trend include; Kisumu; Entebbe. For these 3 376
stations; the rates of decrease in (R95p) index over period of analysis are; -4.03 mm/year, -3.06 mm/year; 377
-5.29 mm/year respectively. 378
Besides; (R99p) indicated a negative trend in 52% (13/25) stations although only one station 379
(Entebbe station) was statistically significant while the remaining 48% (12/25) of the stations showed an 380
increasing tendency for the trend of extremely wet days (R99p), but a significant statistical at some few 381
stations such as Tororo, Jinja, and Lira station. The rate of change at these stations was; 2.24 mm/year, 382
3.1mm/year, and 2.77 mm/year respectively (Table 2). 383
16
Finally, the index wet-day annual total rainfall (PRCPTOT), 60% (15/25) of the stations showed 384
positive trends in the total annual precipitation, and 2 stations Kampala, Jinja, Kiige, and Kasese stations 385
were statistically significant; increasing at 6.75 mm/year, 12.87 mm/year, and 4.52 mm/year respectively. 386
For the remaining 40% (12/25) of stations which indicated a negative trend; only Gitega station was 387
found to be statistically significantly decreasing at the rate of -7.23 mm/year. 388
Results of trends of extreme rainfall events in EA have shown varied results for different indices 389
analyzed for each rainfall zones. This showed the natural heterogeneity of the rainfall in the region that is 390
brought about by much complex association of large-scale controls variables like topography, lakes, and 391
the maritime influence, and seasonal dynamics of tropical circulation, etc. (Nicholson 2017). Generally, 392
the indices showed both negative and positive trends which are either statistically significant or 393
insignificant throughout the analysis, which is in a closed agreement with other studies of extremes in the 394
region (Omondi et al., 2013; Ongoma et al. 2018; Nkunzimana et al. 2019). The most notable negative 395
results have been revealed in consecutive wet day's index (CWD) which showed a decreasing trend in 396
72% (18/25) of the stations analyzed especially in rainfall zone 1(R1) covering parts of north and 397
northeastern Kenya where a reduction in rainfall have been proven (Mumo et al. 2019 and East and 398
northeastern Uganda where rainfall reduction with occasional floods have been reported (Mubiru et al. 399
2012; Nimusiima et al., 213). 400
Simple daily intensity index (SDII) indicated a positive change and was statistically significant on 401
many occasions, perhaps the anticipated pronouncement of the intensity of precipitation in tropical 402
regions as a result of the global warming is now coming to foreplay (Owor et al. 2009), which need to be 403
proven. 404
405
406
407
408
409
410
411
412
413
414
17
Table 2a: Shows the trends in climatic extreme indices of rainfall for 25 Meteorological stations and 415
eight rainfall zones (R1-R8) in East Africa. The bold and shaded p-values (P-V) indicate statistically 416
significant trends for the index and Q= Sen’s’ slope for the rate of change at a 5% significance level. 417
Stations
Rx1day Rx5day SDII R10 R20 R25 CDD CWD R95P R99P
PRCP TOT
Wajir Q -0.59 -0.40 -0.04 -0.03 -0.03 -0.02 0.68 -0.01 -1.30 -0.88 -1.73
P-V 0.04 0.35 0.31 0.52 0.35 0.46 0.01 0.52 0.15 0.10 0.26
Garissa Q 0.20 -0.21 0.06 -0.14 -0.06 -0.40 0.60 -0.04 -0.10 0.71 -10.82
P-V 0.44 0.65 0.30 0.13 0.18 0.00 0.11 0.02 0.91 0.13 0.25
DAR Q 2.09 2.06 0.23 -0.09 0.14 -0.56 -0.16 -0.11 9.57 3.59 45.87
P-V 0.00 0.03 0.00 0.40 0.07 0.00 0.17 0.02 0.01 0.06 0.07
Dagoretti Q 0.29 -0.01 0.13 -0.01 0.01 0.03 0.06 1.13 -0.07 -1.46
P-V 0.25 0.99 0.00 0.83 0.89 0.39 0.56 0.08 0.40 0.91 0.50
Narok Q 0.01 -0.31 0.04 -0.06 -0.01 -0.01 -0.02 -0.04 -0.95 -0.49 -2.47
P-V 0.96 0.22 0.03 0.41 0.82 0.82 0.84 0.18 0.33 0.32 0.17
Namulonge Q 0.08 0.11 0.05 0.03 0.06 0.08 0.11 -0.03 1.74 0.54 0.57
P-V 0.58 0.66 0.01 0.74 0.14 0.03 0.13 0.19 0.16 0.45 0.76
Tororo Q 0.30 0.42 0.05 0.06 0.06 0.10 0.18 -0.08 3.53 2.24 3.74
P-V 0.18 0.09 0.01 0.44 0.27 0.01 0.10 0.49 0.05 0.04 0.13
Soroti Q 0.20 0.14 0.01 -0.02 0.00 -0.02 0.10 0.01 0.99 1.10 -0.34
P-V 0.18 0.52 0.61 0.68 0.90 0.46 0.40 0.70 0.38 0.08 0.82
Jinja Q 0.25 0.39 0.05 0.11 0.15 0.05 -0.03 -0.03 5.10 3.10 5.13
P-V 0.14 0.02 0.01 0.05 0.26 0.39 0.55 0.55 0.01 0.00 0.05 Lira Q 0.13 0.02 -0.01 0.02 0.03 0.05 -0.23 -0.10 4.96 2.77 4.53
P-V 0.65 0.97 0.55 0.84 0.68 0.39 0.41 0.01 0.01 0.04 0.11
Serere Q -0.16 0.05 -0.01 -0.08 -0.06 -0.05 0.39 0.02 -1.41 -0.50 -3.41
P-V 0.28 0.84 0.62 0.29 0.28 0.35 0.04 0.51 0.34 0.54 0.13
Kiige Q 1.18 0.90 0.07 0.44 0.27 0.24 -0.25 -0.16 7.18 3.42 12.87
P-V 0.09 0.27 0.42 0.09 0.19 0.12 0.53 0.20 0.17 0.22 0.05
Mbeya Q -0.02 0.16 0.03 -0.01 0.09 -0.36 0.61 -0.18 1.52 -0.16 -0.49
P-V 0.88 0.61 0.12 0.93 0.16 0.05 0.01 0.01 0.25 0.82 0.79
Bukoba Q -0.72 0.32 -0.01 0.12 0.03 0.27 -0.24 -0.07 -2.41 -1.57 2.26
P-V 0.01 0.57 0.62 0.45 0.73 0.22 0.03 0.08 0.32 0.27 0.46
Kisumu Q -0.54 -0.35 -0.02 0.15 -0.15 -0.16 0.07 0.10 -4.03 -1.11 1.87
P-V 0.01 0.36 0.06 0.04 0.00 0.00 0.35 0.00 0.00 0.14 0.25
Kampala Q -0.31 0.22 -0.03 0.18 0.01 -0.03 -0.10 0.04 0.30 -0.32 6.75
P-V 0.34 0.59 0.15 0.10 0.96 0.74 0.40 0.57 0.90 0.82 0.05
Entebbe Q -0.85 -0.95 -0.03 -0.02 -0.17 -0.13 -0.02 -0.01 -3.06 -1.48 -2.66
P-V 0.00 0.00 0.01 0.69 0.00 0.00 0.74 0.69 0.01 0.05 0.13
Mbarara Q -0.03 0.13 0.01 -0.02 0.04 0.04 0.08 -0.01 1.02 0.43 0.02
P-V 0.79 0.50 0.09 0.70 0.15 0.06 0.64 0.31 0.17 0.36 0.99
Kabale Q 0.05 0.03 0.03 0.07 -0.01 -0.01 -0.09 -0.03 0.43 0.29 0.90
P-V 0.69 0.86 0.00 0.20 0.72 0.57 0.53 0.12 0.56 0.51 0.42
Kasese Q -0.20 -0.01 0.03 0.14 -0.07 -0.03 -0.15 0.03 -1.18 -0.14 4.52
P-V 0.18 0.97 0.10 0.05 0.18 0.30 0.47 0.18 0.28 0.82 0.01 Masindi Q 0.25 0.17 0.01 0.11 0.05 0.05 -0.19 -0.02 1.02 -0.26 2.94
P-V 0.35 0.59 0.20 0.13 0.39 0.17 0.17 0.34 0.39 0.69 0.18
Gitega Q -0.28 -0.21 -0.04 -0.37 -0.17 -0.16 0.24 0.15 -5.29 -0.93 -7.23
P-V 0.22 0.57 0.02 0.00 0.13 0.04 0.46 0.34 0.05 0.45 0.01 Nyagatare Q 0.17 0.20 0.01 0.02 0.02 0.05 -0.25 -0.06 2.04 1.12 0.80
P-V 0.43 0.59 0.52 0.88 0.75 0.25 0.42 0.25 0.19 0.25 0.81
Nyanza lac Q 0.13 -0.13 -0.02 -0.17 -0.08 -0.05 -0.12 -0.06 -1.90 -0.80 -3.60
P-V 0.61 0.75 0.25 0.20 0.21 0.42 0.78 0.61 0.27 0.38 0.23
Gisenyi Q 0.50 0.51 -0.01 0.10 0.05 0.06 -0.33 0.07 2.47 1.51 4.12
P-V 0.12 0.13 0.52 0.41 0.28 0.09 0.32 0.53 0.12 0.22 0.17
418
18
Table 2a: Shows the trends in climatic extreme indices for average rainfall for eight rainfall zones 419
(R1-R8) in East Africa 420
421
R1 Q -0.19 -0.31 0.01 -0.08 -0.04 -0.21 0.64 -0.03 -0.70 -0.08 -6.28
P-V 0.24 0.50 0.30 0.32 0.26 0.23 0.06 0.27 0.53 0.12 0.26
R2 Q 2.09 2.06 0.23 -0.09 0.14 -0.56 -0.16 -0.11 9.57 3.59 45.87
P-V 0.00 0.03 0.00 0.40 0.07 0.00 0.17 0.02 0.01 0.06 0.07
R3 Q 0.15 -0.16 0.08 -0.04 0.00 0.01 0.02 -0.04 0.09 -0.28 -1.96
P-V 0.62 0.11 0.04 0.20 0.41 0.43 0.45 0.07 0.73 0.12 0.33
R4 Q 0.37 0.45 0.14 0.16 0.14 0.15 -0.03 0.02 3.81 2.10 4.50
P-V 0.30 0.48 0.03 0.45 0.39 0.25 0.31 0.38 0.16 0.02 0.29
R5 Q -0.02 0.16 0.03 -0.01 0.09 -0.36 0.61 -0.18 1.52 -0.16 -0.49
P-V 0.88 0.61 0.12 0.93 0.16 0.05 0.01 0.01 0.25 0.82 0.79
R6 Q -0.57 -0.36 -0.03 0.10 -0.10 -0.11 -0.02 0.04 -2.26 -0.97 1.99
P-V 0.05 0.18 0.03 0.36 0.00 0.00 0.55 0.35 0.01 0.10 0.19
R7 Q 0.03 0.08 0.02 0.12 -0.01 0.01 -0.17 0.01 -0.08 -0.20 3.73
P-V 0.27 0.78 0.15 0.13 0.28 0.23 0.32 0.26 0.34 0.76 0.18
R8 Q 0.27 0.19 -0.01 -0.01 0.00 0.02 -0.23 -0.02 0.87 0.61 0.44
P-V 0.39 0.49 0.43 0.50 0.41 0.26 0.51 0.46 0.19 0.28 0.40
Implications of such trends of extreme rainfall events are most likely to be diverse as both positive 422
and negative trends have been revealed from the analysis in different regions. For instance, regions such 423
as northeastern Kenya in the rainfall zone 1(R1) which showed negative trends in CWD, PRCPTOT, and 424
a positive trend in CDD are most likely to suffer socioeconomic hardship as agriculture will probably 425
going to be affected by such trend. Measures for improving water availability and management such as 426
rainwater harvesting, stored and used for crops and livestock are possibly the best options for these 427
regions. Conversely; there are possibilities of other areas experiences continued flooding as a result of an 428
increase in indices such as R25mm, R95p, R99p, and PRCPTOT as in rainfall zone 4 (R4) already 429
reported (Barasa et al. 2015). This is also common in hilly areas of rainfall zone 8 like in Kigali as it has 430
been reported to cause economic loss (Tsinda et al. 2014). Urban cities like Nairobi, Kampala, etc, have 431
reported floods as results of very heavy rain days and very wet days (R95p), and extremely wet days 432
(R99p) (Kilavi et al. 2018). For these locations and regions, the use of accurate forecasts for flood disaster 433
risk reduction, preparation of response action, and most importantly proper planning of city drainage 434
systems will reduce the vulnerability of the population 435
436
437
438
19
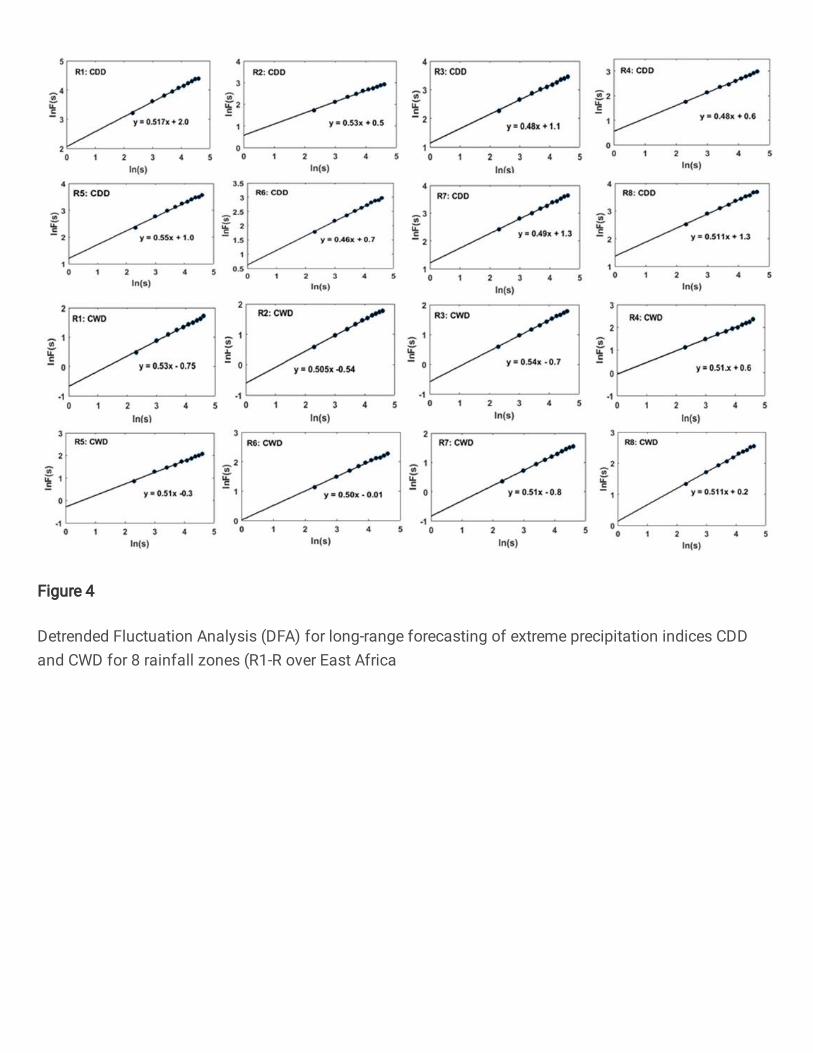
3.7 Detrended fluctuation analysis (DFA) 439
Table 3 presents the results for DFA for individual meteorological stations in EA. Results showed 440
a scaling exponent ‘a’ for Rx1day index satisfying the condition; 0.5 < a < 1 for most stations with 441
exception of Garissa, Dar es Salaam, Mbeya, and Nyanza-Lac with 0.49 each. For all the stations with 442
DFA scaling component ‘a’ in the range of 0.5 < a < 1, the values of each sequence were not independent, 443
and all exhibit long-range correlation, indicating that the future trend in each station was consistent with 444
the change in trend over the past years analyzed (1960-2017). This implies that the Rx1day index will 445
continue to decrease or increase at these stations as previously obtained by statistical analysis (Table 2). 446
Perhaps, it is important to note that the Rx1day index revealed a statistically significant negative trend at 447
Wajir and Entebbe stations in rainfall zone 1 and 6 respectively. Conversely; Rx5day indicated a scaling 448
component fulfilling the conditions; 0.5 < a < 1 for all the stations. The most notable scaling exponent of 449
0.55 is obtained at Dagoretti station which had previously shown a negative trend (Table 2); pointing that 450
the current observed negative trend is most likely to persist at Dagoretti station than any other station. 451
Similarly; the SDII index also indicated DFA scaling component “a” in the range of; 0.5 < a < 1 for most 452
stations except at Marsabit and Jinja stations. This also implies the currently observed trends at the 453
stations will remain except for those two stations. Most importantly, the latter station had previously 454
expressed a positive statistically significant trend for the SDII index (Table 2). 455
For the case of CDD and CWD indices, most stations also showed DFA scaling exponent “a” in 456
the range of 0.5 < a < 1. Few stations including; Narok, Namulonge, Tororo, Kiige, Kampala indicated a 457
DFA scaling component showed that; 0 < a < 0.5, for CDD index, while for CWD index; stations like 458
Garissa, Wajir, Namulonge, Soroti, and Masindi showed the same trend as the latter stations, this implies 459
the values of the sequence are not independent and therefore represent a short-range correlation or anti-460
persistence, which symbolizes that the data series has the opposite trend relative to that of the previous 461
results (Table 2). 462
Further; for rainfall Indices; R10mm, R20mm, and R25mm, the currently observed trends are 463
bounds to persist at most stations as indicated by DFA scaling exponent “a” which are in the range of; 0.5 464
< a < 1. In the case of the R10mm index, conditions of non-future persistence are exhibited at Kiige and 465
Kampala stations. Meanwhile; Jinja, Entebbe, and Mbarara will not experience the persistence of current 466
trends in the R20mm Index. Likewise, only Dagoretti, Lira, Mbeya, and Kisumu stations showed no 467
future persistence of current trends in the R25mm Index as the DFA scaling exponent of their previous 468
trend showed the condition of opposite trend (0 < a < 0.5) (Table 2), 469
20
For the remaining indices that measure the rainfall depth; R95P, R99P, and PRCPTOT; results 470
showed DFA scaling exponent “a” in the range of 0.5 < a < 1 in nearly all stations except Kiige and 471
Mbarara with; 0 < a < 0.5. For R99p; the trend is similar to the R95p in which a few stations showed 472
scaling exponent “a” in range of; 0 < a < 0.5. These include; Dar es salaam, Dagoretti, Tororo, Soroti, 473
and Mbeya. And a nearly equal number of stations showed scaling exponent “a” 0.5 < a < 1 and a half 474
other stations revealed the scaling exponent ‘a’ in the range of; 0 < a < 0.5 for PRCPTOT (Table 2). 475
476
Table 3. Shows DFA scaling exponent of extreme rainfall indices for 26 stations taken at individual and as an 477 average over 8 rainfall zones over EA. DFA scaling exponent ‘a’ showing; 0.5 < a < 1, implies that the current 478 observed trend in the index (Table 2) will persist, while those DFA values in the range 0 < a < 0.5 (bold in 479
Asterik*), opposite trend relative to that of the previous time series. 480
Stations Rx1day Rx5day SDII R10mm R20mm R25mm CDD CWD R95P R99P PRCPTOT
Wajir 0.50 0.52 0.52 0.51 0.53 0.51 0.51 0.47* 0.53 0.51 0.49*
Garissa 0.49* 0.52 0.53 0.51 0.52 0.52 0.50 0.48* 0.52 0.55 0.52
Marsabit 0.51 0.50 0.49* 0.51 0.51 0.53 0.52 0.55 0.51 0.51 0.51
DAR 0.49* 0.53 0.51 0.51 0.53 0.51 0.54 0.52 0.51 0.47* 0.52
Dagoretti 0.53 0.55 0.52 0.53 0.51 0.49* 0.52 0.52 0.50 0.48* 0.51
Narok 0.51 0.51 0.51 0.51 0.51 0.50 0.49* 0.51 0.51 0.53 0.52
Namulonge 0.51 0.53 0.52 0.53 0.54 0.52 0.49* 0.49* 0.52 0.54 0.50
Tororo 0.50 0.52 0.54 0.51 0.60 0.54 0.49* 0.50 0.51 0.47* 0.48*
Soroti 0.50 0.52 0.53 0.52 0.51 0.51 0.53 0.49* 0.50 0.48* 0.52
Jinja 0.52 0.52 0.47* 0.51 0.49* 0.53 0.51 0.51 0.53 0.52 0.55
Lira 0.51 0.51 0.50 0.51 0.50 0.49* 0.51 0.51 0.52 0.54 0.51
Serere 0.53 0.53 0.54 0.53 0.49* 0.50 0.52 0.53 0.52 0.54 0.51
Kiige 0.52 0.51 0.50 0.49* 0.54 0.56 0.49* 0.54 0.47* 0.51 0.48*
Mbeya 0.49* 0.54 0.52 0.56 0.50 0.48* 0.51 0.51 0.51 0.47* 0.52
Bukoba 0.53 0.50 0.50 0.52 0.54 0.52 0.51 0.53 0.52 0.53 0.54
Kisumu 0.50 0.52 0.53 0.53 0.51 0.49 0.50 0.52 0.51 0.52 0.52
Kampala 0.51 0.50 0.52 0.49* 0.50 0.52 0.48* 0.55 0.50 0.50 0.48*
Entebbe 0.52 0.51 0.51 0.53 0.46* 0.52 0.50 0.51 0.50 0.52 0.55
Mbarara 0.52 0.52 0.53 0.53 0.49* 0.51 0.54 0.51 0.49* 0.50 0.52
Kabale 0.52 0.52 0.53 0.50 0.52 0.53 0.52 0.54 0.51 0.52 0.52
Kasese 0.54 0.51 0.51 0.51 0.50 0.54 0.53 0.51 0.51 0.52 0.51
Masindi 0.53 0.51 0.54 0.52 0.52 0.52 0.53 0.49* 0.52 0.50 0.49*
Gitega 0.52 0.52 0.52 0.51 0.52 0.51 0.54 0.53 0.55 0.53 0.48*
Nyagatare 0.52 0.54 0.50 0.50 0.51 0.51 0.52 0.50 0.54 0.55 0.49*
Nyanza lac 0.49* 0.50 0.51 0.53 0.56 0.53 0.52 0.54 0.51 0.52 0.51
Gisenyi 0.50 0.51 0.53 0.50 0.52 0.51 0.50 0.51 0.54 0.58 0.54
481
482
483
21
3.7 Detrended fluctuation analysis (DFA) for rainfall zones (R1-R8). 484
To examine the changing trend in future extreme precipitation events; a long-range correlation 485
(DFA) was performed based on key rainfall indices of significant importance. Results for r95p and r99p 486
indices for the 8 rainfall zones of EA are presented in (Fig.3). The result showed that the DFA scaling 487
exponent ‘a’ in r95p and r99p indices varied from one region to the other. For r95p index, the results for 8 488
regions (R1-R8) were; 0.46, 0.515, 0.53, 0.518, 0.512, 0.517, 0.0504, and 0.524 respectively. In this case, 489
with exception of R1, the remaining sequence was not independent, and all exhibit long-range correlation, 490
indicating that the future trend in each region is consistent with the change in trend over the past years 491
analyzed. This implies that r95p will continue to decrease or increase in the regions as previously 492
obtained by statistical analysis (Table 2). 493
Similarly; for the r99p index for all rainfall zones (R1-R8) shown in the lower parts of Fig. 3, the DFA 494
scaling exponent ‘a’ were; 0.519, 0.53, 0.49, 0.48, 0.54; 0.517, 0.513, and 0.528 respectively. Like in the 495
case of r95p, all the regions with the scaling factor ‘a’ >5 will continue to decrease or increase as 496
previously obtained for the past years (1960-2017) by statistical analysis of trend presented in Table 2. 497
22
498
Fig.3. Shows Detrended Fluctuation Analysis (DFA) for long-range forecasting of extreme 499
precipitation indices (r95p) and r99p for 8 rainfall zones (R1-R8) over East Africa. 500
In other related precipitation Indices such as CDD and CWD (Fig 4); DFA scaling exponent was 501
able to reveal consistent results in some regions while others were not consistent. For example; scaling 502
component ‘a’ for CDD shown on the upper part of Fig.4 for rainfall zones (R1-R8) were; 0.517, 0.53, 503
0.48, 0.48, 0.55, 0.46, 0.49, and 0.511 respectively. The results show that half of the region (R1, R2, R5, 504
and R8), had a DFA scaling component ‘a’ is greater than 0.5 or 0.5 < a < 1, the values of each of this 505
sequence were therefore not independent, and all these regions had a long-range correlation with previous 506
years, meaning that the future trend in CDD index was consistent with the change in trend over the past 507
years analyzed (19650–2017). This implies that CDD will continue to decrease or increase in the regions 508
as previously obtained by statistical analysis of historical CDD over EA as shown in Table 2. 509
23
510
Fig.4. Detrended Fluctuation Analysis (DFA) for long-range forecasting of extreme precipitation 511
indices CDD and CWD for 8 rainfall zones (R1-R over East Africa 512
The results for R10mm and R20mm rainfall indices presented in upper Fig.5 also show varied 513
DFA scaling component ‘a’ in both Indices. For example; for R10 index, the factors were; 0.513, 0.53, 514
0.502, 0.55, 0.506, 0.51, 0.50, and 0.51 respectively. All regions, therefore, show that the values of each 515
sequence were therefore not independent, and all had long-range correlation, meaning that the future trend 516
in the DFA index was consistent with the change in trend over the past years analyzed (1960–2017). This 517
implies that R10mm will continue to decrease or increase in the regions as previously obtained by 518
statistical analysis of historical of DFA over EA. 519
The results for R20mm rainfall indices presented in the lower part of (Fig.5) also show varied DFA 520
scaling component ‘a’ in different regions. The scaling component ‘a’ were; 0.514, 0.512, 0.520, 0.500, 521
0.53, 0.52, 0.47, and 0.49 respectively. The first 6 regions (R1-R6), therefore, show that the values of 522
each sequence were therefore not independent, and all had long-range correlation, meaning that the future 523
trend in the DFA index was consistent with the change in trend over the past years analyzed (19650–524
24
2017). This implies that R20mm will continue to decrease or increase in the regions as previously 525
obtained by statistical analysis of the historical trends over EA as presented in Table 2. 526
527
Fig.5. Detrended Fluctuation Analysis (DFA) for long-range forecasting of extreme precipitation 528
indices R10mm and R20mm for 8 rainfall zone (R1-R) over East Africa. 529
The results for RX1day indices presented in the upper part of (Fig.6) also show varied DFA 530
scaling component ‘a’ for the period analyzed. The scaling component ‘a’ were; 0.52, 0.52, 0.51, 0.500, 531
0.53, 0.52, 0.50, and 0.48 respectively. The first 7 regions (R1-R7) regions, therefore, show that the 532
values of each sequence were therefore not independent, and all had long-range correlation, meaning that 533
the future trend in the DFA index was consistent with the change in trend over the past years analyzed 534
(19650–2017). This implies that RX1day will continue to decrease or increase in the regions as previously 535
obtained by statistical analysis of historical of DFA over EA (see Table 2). 536
The results for RX5day indices presented in the lower part of (Fig.6) also show varied DFA scaling 537
component ‘a’ for the period analyzed. The scaling component ‘a’ were; 0.52, 0.52, 0.52, 0.46, 0.52, 0.48, 538
0.53, and 0.51 respectively. With exception of R4 and R7, the remaining region (R1-R3, R5, and R8) 539
25
regions, therefore, show that the values of each sequence were therefore not independent, and all had a 540
long-range correlation, meaning that the future trend in the DFA index was consistent with the change in 541
trend over the past years analyzed (1960–2017). This implies that RX5day will continue to decrease or 542
increase in the regions as previously obtained by statistical analysis of historical DFA over EA. 543
544
Fig.6. Detrended Fluctuation Analysis (DFA) curves for long-range forecasting of extreme 545
precipitation indices RX1day and RX5 days for 8 rainfall zone (R1-R) over East Africa 546
547
Figure.7. Shows the correlation coefficient diagram between rainfall extreme indices and the 548
atmospheric teleconnections indices (DMI and Nino 3.4) over EA. Results showed a low correlation of 549
extreme rainfall events in the regions; i.e there is no close relationship between an extreme event 550
occurring in one region to the other. For instance, for PRCPTOT, the best correlation coefficient (0.47) is 551
shown between rainfall zone 3 (R3) and rainfall Zone 1(R1), followed by 0.41 between R1 and R5. The 552
existence of a low correlation coefficient of extreme events between rainfall zones (R1-R8) is common in 553
26
all rainfall extreme events. This implies that the development of appropriate adaptation and mitigation 554
strategies should be done location-specific as there are low chances of regions experiencing similar 555
extreme events. 556
3.8 Zonal variability of extreme rainfall events and the relationship ENSO and IOD 557
Figure 7 shows the correlation coefficient diagram between rainfall extreme indices and the 558
atmospheric teleconnections indices (DMI and Nino 3.4) over eight rainfall zones (R1-R8) in EA. Results 559
showed a low correlation of extreme rainfall events in the regions; i.e there is no close relationship 560
between extreme events occurring in one region to the other. For instance, for PRCPTOT, the best 561
correlation coefficient (0.47) is shown between rainfall zone 3 (R3) and rainfall Zone 1(R1), followed by 562
0.41 between R1 and R5. The existence of a low correlation coefficient of extreme events between rainfall 563
zones (R1-R8) is common in all the rainfall extreme events (Fig.7). This implies that the development of 564
appropriate adaptation and mitigation strategies should be done location-specific as there are low chances 565
of regions experiencing similar extreme events due to inhomogeneity of rainfall events. 566
Regarding the relationship between extreme indices and the two atmospheric teleconnections, 567
results showed both negative and positive correlations in the rainfall zones (Table 4). For instance, most 568
rainfall zones showed a positive correlation between PRCPTOT and IOD (Dipole Mode Index-DMI) 569
except R2, while an equal number of positive and negative correlations revealed between ENSO-(Nino 570
3.4) and the same Index in the rainfall zones. The highest correlation (r =0.35) is between DMI and 571
PRCPTOT index in rainfall zone 7(R7). Similarly, most rainfall zones showed a positive correlation 572
between the R95p index and DM, while 5 out of 8 rainfall zones experienced a negative correlation 573
between ENSO-Nino 3.4 index and R95p, with r=0.33 as the highest correlation still obtained in R7. For 574
all remaining indices, R20mm, RX5day, CDD, and CWD, similar trends are observed where a more 575
positive correlation is revealed between DMI and negative results with ENSO-Nino 3.4 Index. 576
577
578
579
580
581
27
Table 4: Show a summary of the correlation coefficient (r) of different extreme rainfall index and 582
two atmospheric teleconnections (DMI and Nino 3.4) in the eight rainfall zones (R1-R8) in EA 583
RF PRCPTOT r95p R20 mm RX5day CDD CWD Zone DMI Nino3.4 DMI Nino3.4 DMI Nino3.4 DMI Nino3.4 DMI Nino3.4 DMI Nino3.4
R1 0.17 0.05 0.31 -0.07 0.19 -0.01 0.31 -0.03 -0.05 -0.07 0.23 -0.04
R2 -0.02 -0.06 0.24 0.07 0.20 0.09 -0.09 0.17 -0.15 -0.05 -0.05 0.23
R3 0.18 0.18 0.34 0.21 0.29 0.22 0.26 0.07 0.31 -0.03 -0.07 -0.09
R4 0.12 0.05 0.22 -0.07 0.26 -0.02 0.04 0.22 0.07 -0.06 0.11 0.00 R5 0.14 -0.04 -0.02 -0.01 0.20 -0.06 -0.18 -0.11 -0.04 0.23 -0.23 -0.21
R6 0.17 -0.01 0.03 -0.06 -0.02 -0.10 0.02 -0.07 -0.04 0.25 0.21 -0.01
R7 0.35 0.09 0.33 -0.01 0.14 0.04 0.17 -0.06 -0.10 0.01 0.00 -0.15 R8 0.12 -0.11 0.09 0.02 0.16 0.19 0.24 0.13 0.03 0.38 0.25 -0.11
584
28
585
586
Fig. 7 shows the correlations plots for annual total wet-day precipitation (PRCPTOT) (a), very heavy rainfall 587 (r95p) (b), annual count of days when precipitation≥ 20mm(c), max 5-day precipitation amount (RX5day) (d), 588 consecutive wet days (CWD) (e), consecutive dry days (CCD)(f). (Note DMI= Dipole Mode Index and N3.4 = 589 Nino 3.4 index). 590
591
592
593
594
29
4.0 Conclusions 595
This study examined changes in the occurrence of extreme rainfall events using long-term 596
observed rainfall records for 25 stations varying from 1960-2017. The spatial distribution of extreme 597
rainfall events was generated by geographical information System (GIS) through the Krigging 598
Interpolation technique. Future development of extreme rainfall events was computed using Detrended 599
Fluctuation Analysis (DFA). Results revealed that the consecutive wet day's index (CWD) was a 600
decreasing trend in 72% of the stations analyzed. Moreover, the consecutive dry days (CDD) index also 601
indicated a positive trend in 44% of the stations analyzed especially in the Arid and Semi-Arid region 602
(ASAL) of Kenya in R1. 603
Additionally, heavy rainfall days (R10mm) show a positive trend at 52% of the stations but the 604
trend is statistically significant at only 3 stations; Jinja, Kisumu, and Kasese stations. The remaining 48% 605
stations portrayed an insignificance negative trend for the R10mm index. Moreover; all the 60% (15/25) 606
of the stations analyzed revealed a positive trend for very heavy rainfall days (R20mm) index did not 607
present any statistical significance in the study area, for the remaining stations 40%, a statistically 608
significant negative trend in the R20mm index, were revealed at Entebbe and Kampala. In light of the 609
extremely heavy rainfall days (R25mm) index, 56% of the stations revealed a decreasing trend for the 610
index where stations such as Kisumu, Entebbe in rainfall zone 6 and Gitega in rainfall zone 8 showed a 611
statistically significant trend with a rate of decrease of -0.164 mm/year, -0.129 mm/year, and -0.157 612
mm/year respectively. It can be observed that there is an increasing tendency in all two indices that relates 613
to heavy rainfall days (R10mm), and very heavy rainfall days (R20mm) which are associated to flash 614
floods. Statistically insignificant negative and positive trends are also revealed for the very wet day's 615
index (R95p), and extremely wet days index (R99p), and the most important results have been noticed in 616
rainfall zone 4 where numerous floods and drought events are reported in the area. 617
Results showed a low correlation coefficient of extreme rainfall events in the regions; i.e there is 618
no strong relationship between extreme events occurring in one region to the other. Similarly, the 619
correlation coefficient between rainfall extreme indices and the atmospheric teleconnections indices (DMI 620
and Nino 3.4) were generally low. For instance, most rainfall zones showed a positive correlation between 621
PRCPTOT and IOD (Dipole Mode Index-DMI) except R2, while an equal number of positive and 622
negative correlations revealed between ENSO-(Nino 3.4) and the same Index in the rainfall zones. The 623
highest correlation (r = 0.35) is between DMI and PRCPTOT index in rainfall zone 7(R7). Similarly, most 624
rainfall zones showed a positive correlation between the R95p index and DM, while 5 out of 8 rainfall 625
zones experienced a negative correlation between ENSO-Nino 3.4 index and R95p, with r = 0.33 as the 626
30
highest correlation still obtained in R7. The impacts of highly variable trends of extremes events 627
correspond to highly variable rainfall reported in EA which usually impacts adversely on the livelihood of 628
the communities. DFA showed varied results, however most of the stations that the current trends is 629
most likely to persist. 630
Based on these diverse results, we recommend that the development of appropriate adaptation and 631
mitigation strategies be done location-wise as there are low chances of regions experiencing similar 632
extreme events due to heterogeneity of rainfall events. The study provides some important information 633
required for planning mitigation and adaptation strategies, especially in disaster preparedness. Future 634
studies on the influence of atmospheric teleconnections on extreme events may include other variables 635
such as North Atlantic Oscillation (NAO) index, and several high-pressure systems (e.g Mascarene, St. 636
Hellena, Azores and Arabian Ridge, etc.) whose influence is not well known especially under the current 637
changing climate. 638
639
Conflict of Interest 640
There is no conflict of interest in this paper. 641
Acknowledgments 642
The first and second authors also wish to acknowledge the support from the Chinese Scholarship 643
Council (CSC), the National Natural Science Foundation of China (41875177; 41375159), and Nanjing 644
University of information science and technology. The Authors of this work acknowledge the 645
contributions of the previous Authors cited in this paper. The authors would like to acknowledge all 646
institutions for providing precipitation data used for analysis. 647
648
649
650
651
652
653
31
Reference 654
Adhikari, U., Nejadhashemi, A.P., Woznicki, S.A., 2015. Climate change and eastern Africa : a review of 655
impact on major crops. Food Energy Secur. 4, 110–132. https://doi.org/10.1002/fes3.61 656
Aguilar, E., Auer, I., Brunet, M., Peterson, T.C., Wieringa, J., 2003. Guidelines on Climate Metadata and 657
Homogenization, WMO/TD No. 1186. World Meteorological Organisation, Geneva., World 658
Meteorological Organization. 659
Alexander, L. V., Zhang, X., Peterson, T.C., Caesar, J., Gleason, B., Klein Tank, A.M.G., Haylock, M., 660
Collins, D., Trewin, B., Rahimzadeh, F., Tagipour, A., Rupa Kumar, K., Revadekar, J., Griffiths, G., 661
Vincent, L., Stephenson, D.B., Burn, J., Aguilar, E., Brunet, M., Taylor, M., New, M., Zhai, P., 662
Rusticucci, M., Vazquez-Aguirre, J.L., 2006. Global observed changes in daily climate extremes of 663
temperature and precipitation. J. Geophys. Res. Atmos. 111, 1–22. 664
https://doi.org/10.1029/2005JD006290 665
Ayugi, B.O., Tan, G., Ongoma, V., Mafuru, K.B., 2018. Circulations Associated with Variations in 666
Boreal Spring Rainfall over Kenya. Earth Syst. Environ. 2, 421–434. https://doi.org/10.1007/s41748-667
018-0074-6 668
Barasa, B., Vincent, K., Frank, M., 2015. International Journal of Environmental Comparison of extreme 669
weather events and streamflow from drought indices and a hydrological model in River Malaba, 670
Eastern Uganda. Int. J. Environ. Stud. 70, 932–943. https://doi.org/10.1080/00207233.2013.862463 671
Behera, S.K., Luo, J.J., Masson, S., Delecluse, P., Gualdi, S., Navarra, A., Yamagata, T., 2005. 672
Paramount impact of the Indian Ocean dipole on the East African short rains: A CGCM study. J. 673
Clim. 18, 4514–4530. https://doi.org/10.1175/JCLI9018.1 674
Bouagila, B., Sushama, L., 2013. On the Current and Future Dry Spell Characteristics over 675
Africa. Atmosphere 4: 272–298. https://doi.org/10.3390/atmos4030272 676
Costa, A.C., Soares, A., 2009. Homogenization of climate data: Review and new perspectives using 677
geostatistics. Math. Geosci. 41, 291–305. https://doi.org/10.1007/s11004-008-9203-3 678
Davis, R., Gichere, S., Mogaka, H., Hirji, R., 2009. Climate Variability and Water Resources in Kenya: 679
The Economic Cost of inadequate Management; Water P-Notes, No. 22; World Bank: Washington, 680
DC, USA, 4p. 681
32
Drago, A.F., Boxall, S.R., 2002. Use of the wavelet transform on hydro-meteorological data. Phys. Chem. 682
Earth 27, 1387–1399. https://doi.org/10.1016/S1474-7065(02)00076-1 683
FAO, 2017. The future of food and agriculture: Trends and challenges, Food and Agriculture 684
Organization of the United Nations.Rome, Italy. 685
Kilavi, M., MacLeod, D., Ambani, M., Robbins, J., Dankers, R., Graham, R., Helen, T., Salih, A.A.M., 686
Todd, M.C., 2018. Extreme rainfall and flooding over Central Kenya Including Nairobi City during 687
the long-rains season 2018: Causes, predictability, and potential for early warning and actions. 688
Atmosphere (Basel). 9. https://doi.org/10.3390/atmos9120472 689
Fraedrich, K., Blender, R., 2003. Scaling of Atmosphere and Ocean Temperature Correlations in 690
Observations and Climate Models. Phys. Rev. Lett. 90, 4. 691
https://doi.org/10.1103/PhysRevLett.90.10850 692
Gamoyo, M., Reason, C., Obura, D, 2015. Rainfall variability over the East African coast. Theor Appl 693
Climatol 120:311–322. https://doi.org/10.1007/s00704-014-1171-6 694
Gebrechorkos, S.H., Hülsmann, S., Bernhofer, C., 2019. Long-term trends in rainfall and temperature 695
using high-resolution climate datasets in East Africa. Sci. Rep. 9, 1–9. 696
https://doi.org/10.1038/s41598-019-47933-8 697
Gitau, W., Camberlin, P., Ogallo, L., Bosire, E., 2018. Trends of intraseasonal descriptors of wet and dry 698
spells over. Int. J. Climatol. 38, 1189–1200. https://doi.org/10.1002/joc.5234 699
Hague, T., 2010. Projected Changes in Mean and Extreme Precipitation in Africa under Global Warming. 700
Part II : East Africa 3718–3733. https://doi.org/10.1175/2010JCLI2883.1 701
Indeje, M., Semazzi, F.H.M., Ogallo, L.J., 2000. ENSO Signals in East African rainfall seasons. Int. J. 702
Climatol. 46, 19–46. https://doi.org/10.1002/(SICI)1097-0088(200001)20:1<19::AID-703
JOC449>3.0.CO;2-0 704
Kansiime, M.K., Wambugu, S.K., Shisanya, C.A., 2013. Perceived and Actual Rainfall Trends and 705
Variability in Eastern Uganda : Implications for Community Preparedness and Response. J. Nat. Sci. 706
Res. 3, 179–195. 707
Kilavi, M., MacLeod, D., Ambani, M., Robbins, J., Dankers, R., Graham, R., Helen, T., Salih, A.A.M., 708
33
Todd, M.C., 2018. Extreme rainfall and flooding over Central Kenya Including Nairobi City during 709
the long-rains season 2018: Causes, predictability, and potential for early warning and actions. 710
Atmosphere (Basel). 9. https://doi.org/10.3390/atmos9120472 711
Kizza, M., Rodhe, A., Xu, C.-Y., Ntale, H.K., Halldin, S., 2009. Temporal rainfall variability in the Lake 712
Victoria Basin in East Africa during the twentieth century. Theor. Appl. Climatol. 98, 119–135. 713
https://doi.org/10.1007/s00704-008-0093-6 714
Kiros, G., Shetty, A., Nandagiri, L., 2017. Extreme rainfall signatures under changing climate in semi-715
arid northern highlands of Ethiopia. Cogent Geosci. 3, 1–20. 716
https://doi.org/10.1080/23312041.2017.1353719 717
Lyon, B., Dewitt, D.G., 2012. A recent and abrupt decline in the East African long rains 39, 1–5. 718
https://doi.org/10.1029/2011GL050337 719
Mubiru, D.N.; Komutunga, Everline; Agona, Ambrose; Apok, Anne; Ngara, T., 2012. Characterising 720
agrometeorological climate risks and uncertainties : Crop production in Uganda. S. Afr. J. Sci. 721
108(3–4), 108–118. https://doi.org/10.4102/sajs.v108i3/4.470 722
Mumo, L., Yu, J., Ayugi, B.O., 2019. Evaluation of spatiotemporal variability of rainfall over Kenya from 723
1979 to 2017. J. Atmos. Solar-Terrestrial Phys. 194, 105097. 724
https://doi.org/10.1016/j.jastp.2019.105097 725
Nicholson, S.E., 2017. Climate and climatic variability of rainfall over eastern Africa. Rev. Geophys. 55, 726
590–635. https://doi.org/10.1002/2016RG000544 727
Nimusiima, A., Basalirwa, C.P.K., Majaliwa, J.G.M., Otim-Nape, W., Okello-Onen, J., Rubaire-Akiiki, 728
C., Konde-Lule, J..Ogwal-Byenek, S., 2013. Nature and dynamics of climate variability in the 729
Uganda cattle corridor. African J. Environ. Sci. Technol. 7, 770–782. 730
https://doi.org/10.5897/AJEST2013.1435 731
Nkunzimana, A., Bi, S., Jiang, T., Wu, W., Abro, M.I., 2019. Spatiotemporal variation of rainfall and 732
occurrence of extreme events over Burundi during 1960 to 2010. Arab. J. Geosci. 12, 0–22. 733
https://doi.org/10.1007/s12517-019-4335-y 734
Ogwang, B.A., Chen, H., Tan, G., Ongoma, V., Ntwali, D., 2015a. Diagnosis of East African climate and 735
the circulation mechanisms associated with extreme wet and dry events: A study based on RegCM4. 736
34
Arab. J. Geosci. 8, 10255–10265. https://doi.org/10.1007/s12517-015-1949-6 737
Ogwang, B.A., Ongoma, V., Gitau, W., 2016. Contributions of atlantic ocean to June-August rainfall over 738
Uganda and Western Kenya. J. Earth Sp. Phys. 41, 131–140. 739
Ogwang, B.A., Ongoma, V., Xing, L., Ogou, F.K., 2015b. Influence of Mascarene high and Indian Ocean 740
dipole on East African extreme weather events. Geogr. Pannonica 19, 64–72. 741
https://doi.org/10.18421/GP19.02-05 742
Ojara, M.A., Lou, Y., Aribo, L., Namumbya, S., Uddin, M.J., 2020. Dry spells and probability of rainfall 743
occurrence for Lake Kyoga Basin in Uganda, East Africa. Nat. Hazards 100, 493–514. 744
https://doi.org/10.1007/s11069-019-03822-x 745
Omondi, P.A., Awange, J.L., Forootan, E., Ogallo, L.A., Barakiza, R., Girmaw, G.B., Fesseha, I., 746
Kululetera, V., Kilembe, C., Mbati, M.M.M., Kilavi, M., King’uyu, S.M., Omeny, P.A., Njogu, A., 747
Badr, E.M., Musa, T.A., Muchiri, P., Bamanya, D., Komutunga, E., Aming, P., Awange, J.L., 748
Forootan, E., Ogallo, A., Girmaw, B., Fesseha, I., Kululetera, V., Mbati, M.M.M., Kilavi, M., King, 749
M., Adek, P., Njogu, A., Badr, M., Musa, A., Muchiri, P., Komutunga, E., 2013. Changes in 750
temperature and precipitation extremes over the Greater Horn of Africa region from 1961 to 2010. 751
Int. J. Climatol. 34, 1262–1277. https://doi.org/10.1002/joc.3763 752
Ongoma, V., Chen, H., Gao, C., Chena, H., Gaoa, C., 2017. Projected changes in mean rainfall and 753
temperature over East Africa based on CMIP5 models. Int. J. Climatol. 38, 1375–1392. 754
https://doi.org/10.1002/joc.5252 755
Ongoma Victor, Haishan Chen, G.W.O., 2018. Variability of extreme weather events over the equatorial 756
East Africa, a case study of rainfall in Kenya and Uganda. Theorectical Appl Climatol. 295–308. 757
https://doi.org/10.1007/s00704-016-1973-9 758
Onyutha, C., 2016. Geospatial trends and decadal anomalies in extreme rainfall over Uganda, East Africa. 759
Adv. Meteorol. 2016. https://doi.org/10.1155/2016/6935912 760
Owor, M., Taylor, R.G., Tindimugaya, C., Mwesigwa, D., 2009. Rainfall intensity and groundwater 761
recharge : empirical evidence from the. Environ. Res. Lett. 4(3):035009 762
https://doi.org/10.1088/1748-9326/4/3/035009 763
Peng, C.K., Buldyrev, S.V., Havlin, S., Simons, M., Stanley, H.E., Goldberger, A.L., 1994. Mosaic 764
35
organization of DNA nucleotides. Phys. Rev. E 49 (2), 1685–1689 765
Schlenker, W., Lobell, D.B., 2010. Robust negative impacts of climate change. Environ. Res. Lett. 5. 766
014010 (8pp). https://doi.org/10.1088/1748-9326/5/1/014010 767
Sillmann, J., Kharin, V. V., Zhang, X., Zwiers, F.W., Bronaugh, D., 2013. Climate extremes indices in the 768
CMIP5 multimodel ensemble: Part 1. Model evaluation in the present climate. J. Geophys. Res. 769
Atmos. 118, 1716–1733. https://doi.org/10.1002/jgrd.50203 770
Rowell, D., Booth, B., Nicholson.S, Good, P., 2015. Reconciling Past and Future Rainfall Trends over 771
East Africa. J. Clim. 28: 9768–9788. https://doi.org/10.1175/JCLI-D-15-0140.1 772
Takaoka, S., 2005. Impact of the 1997 – 1998 El Niño Rains on Farms in the Mount Kenya Region. Int. 773
Mt. Soc. 25, 326–331. https://doi.org/doi.org/10.1659/0276-4741(2005)025[0326:IOTENR]2.0.CO;2 774
Tilya, F.F., Mhita, M.S.,2007 Frequency of Wet and Dry Spells in Tanzania. In: Sivakumar MVK, 775
Ndiang’ui N. (eds) Climate and Land Degradation. Environmental Science and Engineering 776
(Environmental Science). Springer, Berlin, Heidelberg. p197-204. https://doi.org/10.1007/978-3-777
540-72438-4_10 778
Tong, S., Li, X., Zhang, J., Bao, Yuhai, Bao, Yongbin, Na, L., Si, A., 2019. Spatial and temporal 779
variability in extreme temperature and precipitation events in Inner Mongolia (China) during 1960–780
2017. Sci. Total Environ. 649, 75–89. https://doi.org/10.1016/j.scitotenv.2018.08.262 781
Tsinda, A, Kind, C, H.J.., 2014. Estimating damage costs of flooding on small- and medium-sized 782
enterprises in Kigali, Rwanda. J. Disaster Risk Stud. 11, 1–11. 783
Varotsos, C.A., Ondov, J.M., Cracknell, A.P., Efstathiou, M.N., Assimakopoulos, M.N., 2006. Long-784
range persistence in global Aerosol Index dynamics. Int. J. Remote Sens. 27, 3593–3603. 785
https://doi.org/10.1080/01431160600617236 786
WMO, 2013. Guide to climatological practices (3rd edition). World Meteorological Organization 787
(WMO), Geneva 788
Yang, W., Seage, R., Cane, M.A., Lyon, B., 2014. The East African Long Rains in Observations and 789
Models. J. Clim. 7185–7202. https://doi.org/10.1175/JCLI-D-13-00447.1 790
Zhang, X., Alexander, L., Hegerl, G.C., Jones, P., Tank, A.K., Peterson, T.C., Trewin, B., Zwiers, F.W., 791
36
2011. Indices for monitoring changes in extremes based on daily temperature and precipitation data 792
2. https://doi.org/10.1002/wcc.147 793
37
Table S1: Shows the codes, indicator names,5`8 and descriptions of 11 rainfall indices 794
795
796
797
798
799
Code Indicator name Description of Indicator Units
SDII Simple Daily Intensity Index Mean precipitation amount that is registered on wet days mm
Rx1day Max 1-day precipitation amount Maximum 1-day precipitation total mm
Rx5day Max 5-day precipitation amount Maximum 5-day precipitation total mm
CDD Consecutive dry days Maximum number of consecutive days with RR<1 mm Days
R10 mm Annual count of days Number of days with more than 10 mm of precipitation days Days
R20mm Annual count of days Annual count of days when PRCP≥ 20mm Days
R25mm Annual count of days Annual count of days when PRCP≥ 25mm Days
CWD Consecutive wet days Maximum number of consecutive days with RR >=1 mm Days
R95p Very wet days Annual total PRCP when RR>95th percentile mm
R99p Extremely wet days Annual total PRCP when RR > 99th percentile mm
PRCPTOT Annual total wet-day precipitation Annual total PRCP in wet days (RR >=1 mm) mm
38
Table S2. Shows the statistical metrics for evaluation of the performance of satellite datasets(CHIRPS), 800
over 8 rainfall zones of EA(R1-R8). (R= correlation coefficient, RMSD is the root mean squared 801
difference, BIAS is the statistical bias) 802
Rainfall R RMSD BIAS
R1 0.92 24.93 -1.32
R2 0.9 39.41 -14.18
R3 0.91 22.99 0.42
R4 0.83 36.77 -16.46
R5 0.94 32.02 17.03
R6 0.9 31.4 -18.33
R7 0.83 30.24 -3.86
8 0.95 21.37 -0.29
Table S2 Shows preliminary quality control result for rainfall datasets for 25 station. The p-values for 803
the Shapiro-Wilk normality test (htest), Grubbs outlier test (qgrubbs), Standard Normal Homogeneity 804
Test (SNHT), and Buishand range test (BR) 805
Station Longitude Latitude Elevation Period "htest qgrubbs SNHT BR
Wajir 41.9 3.9 271 1960-2016 0.085 0.072 0.233 0.464
Garissa 40.1 1.8 246 1957-2016 0.084 0.074 0.135 0.387
Marsabit 38.02 2.31 1283 1960-2016 0.9 0.054 0.139 0.257
DAR 39.12 -6.8 156 1960-2017 0.941 0.278 0.15 0.282
Dagoretti 36.75 -1.31 1830 1961-2016 0.109 0.291 0.193 0.124
Narok 35.91 -1.1 1950 1964-2016 0.285 0.43 0.247 0.513
Namulonge 32.6 0.51 1128.1 1963-2017 0.893 0.149 0.163 0.073
Tororo 34.21 0.71 1176.2 1970-2017 0.096 0.128 0.243 0.12
Soroti 33.6 1.7 1115 1961-2017 0.059 0.03 0.228 0.173
Jinja 33.11 0.51 1175 1961-2017 0.571 0.092 0.122 0.061
Lira 32.9 2.32 1120.4 1971-2017 0.317 0.242 0.173 0.083
Serere 33.5 1.5 1098.2 1961-2017 0.07 0.232 0.169 0.209
Kiige 33 1.1 1089.1 1971-2017 0.07 0.054 0.11 0.405
Bukoba 31.82 -3.37 1144 1960-2017 0.609 0.981 0.137 0.081
Mbeya 33.47 -8.93 1791 1980-2017 0.083 0.924 0.066 0.335
Kisumu 34.8 -0.1 1154 1980-2016 0.866 0.129 0.26 0.278
Kampala 32.62 0.32 1162 1980-2016 0.893 0.149 0.163 0.203
Entebbe 32.62 0.53 1117 1951-2016 0.423 0.134 0.085 0.12
Mbarara 30.41 -0.13 1408 1950-2016 0.052 0.09 0.583 0.143
Kasese 30.06 0.1 931 1964-2016 0.623 0.182 0.312 0.301
Masindi 31.43 1.41 1136 1960-2016 0.063 0.16 0.501 0.131
Kabale 29.6 -1.15 1743 1960-2016 0.085 0.34 0.887 0.271
Gitega 30.06 -1.95 1524 1970-2018 0.356 0.074 0.316 0.296
Nyagatare 30.31 -1.28 1366 1970-2018 0.343 0.036 0.298 0.066
Nyanza lac 29.62 -4.32 874 1970-2018 0.969 0.118 0.239 0.319
Gisenyi 29.26 -1.66 1591 1970-2018 0.65 0.072 0.495 0.491
806
Figures
Figure 1
Shows map of Africa (a), showing East Africa right (b), and meteorological stations (red dots). Note: Thedesignations employed and the presentation of the material on this map do not imply the expression ofany opinion whatsoever on the part of Research Square concerning the legal status of any country,
territory, city or area or of its authorities, or concerning the delimitation of its frontiers or boundaries. Thismap has been provided by the authors.
Figure 2
Shows the spatial distribution for the wet day (Rn=1.0mm(a), consecutive dry day CDD(b), the annualcount of days when precipitation≥ 10mm(c), the annual count of days when precipitation≥ 20mm(d),max 5-day precipitation amount (RX1day) (e), 5-day precipitation amount (RX5day) (f), Very wet daysR95p (g) and extremely wet days R95p (h) over East Africa during the period 1981-2017 Note: Thedesignations employed and the presentation of the material on this map do not imply the expression ofany opinion whatsoever on the part of Research Square concerning the legal status of any country,territory, city or area or of its authorities, or concerning the delimitation of its frontiers or boundaries. Thismap has been provided by the authors.
Figure 3
Shows Detrended Fluctuation Analysis (DFA) for long-range forecasting of extreme precipitation indices(r95p) and r99p for 8 rainfall zones (R1-R8) over East Africa.
Figure 4
Detrended Fluctuation Analysis (DFA) for long-range forecasting of extreme precipitation indices CDDand CWD for 8 rainfall zones (R1-R over East Africa
Figure 5
Detrended Fluctuation Analysis (DFA) for long-range forecasting of extreme precipitation indices R10mmand R20mm for 8 rainfall zone (R1-R) over East Africa.
Figure 6
Detrended Fluctuation Analysis (DFA) curves for long-range forecasting of extreme precipitation indicesRX1day and RX5 days for 8 rainfall zone (R1-R) over East Africa
Figure 7
shows the correlations plots for annual total wet-day precipitation (PRCPTOT) (a), very heavy rainfall(r95p) (b), annual count of days when precipitation≥ 20mm(c), max 5-day precipitation amount (RX5day)(d), consecutive wet days (CWD) (e), consecutive dry days (CCD)(f). (Note DMI= Dipole Mode Index andN3.4 = Nino 3.4 index).