TRENDS IN CUMULATIVE MARGINAL TAX RATES FACING LOW-INCOME FAMILIES, 1997-2007
Gizem KosarRobert A. Moffitt
Working Paper 22782http://www.nber.org/papers/w22782
NATIONAL BUREAU OF ECONOMIC RESEARCH1050 Massachusetts Avenue
Cambridge, MA 02138October 2016
The views expressed herein are those of the authors and do not necessarily reflect the views of the Federal Reserve Bank of New York, the Federal Reserve System, or the National Bureau of Economic Research. This paper is prepared for the NBER Tax Policy and the Economy Conference, September 22, 2016. The authors would like to thank Daniel Feenberg, Linda Giannarelli, Gwyn Pauley, and Kosali Simon for assistance with several program rules and statistics, and Harry Wheeler for excellent research assistance.
NBER working papers are circulated for discussion and comment purposes. They have not been peer-reviewed or been subject to the review by the NBER Board of Directors that accompanies official NBER publications.
Trends in Cumulative Marginal Tax Rates Facing Low-Income Families, 1997-2007Gizem Kosar and Robert A. MoffittNBER Working Paper No. 22782October 2016JEL No. I38
ABSTRACT
We present new calculations of cumulative marginal tax rates (MTRs) facing low income families participating in multiple welfare programs over the period 1997-2007, the period after 1996 welfare reform but before the program expansions of the Great Recession. Our calculations are for nondisabled, nonelderly families who pay federal and state income taxes and the payroll tax but receive benefits from up to four different transfer programs—Medicaid, Food Stamps, subsidized housing, and Temporary Assistance for Needy Families. The results show enormous variation in MTRs across families who participate in different combinations of welfare programs, who have different family structures, and who have earnings in different ranges. For families who participate in either no or fewer than two welfare programs, which constitutes the large majority of low income families, MTRs are either negative or positive but modest in magnitude. But families participating in two or more programs, while still facing negative or modest positive rates at low earnings, usually face considerably higher MTRs at higher earnings ranges, often up to 80 percent and even occasionally over 100 percent. While the fraction of families in this category is not large, they constitute about one-fifth of single parent families.
Gizem KosarMicroeconomic StudiesFederal Reserve Bank of New York33 Liberty StreetNew York, NY 10045 [email protected]
Robert A. MoffittDepartment of EconomicsJohns Hopkins University3400 North Charles StreetBaltimore, MD 21218and IZAand also [email protected]
3
The level of marginal tax rates in transfer programs has long been a concern for policy
makers as well as a topic of research and study for economists. Going back at least to Milton
Friedman and his proposals for a negative income tax, economists have generally emphasized the
importance of keeping tax rates modest in size to preserve work incentives. One part of the issue
that Friedman emphasized even in his earliest writings was what is now called the problem of
“cumulative” marginal tax rates facing families who participate in multiple programs. Even if
rates are relatively low in individual programs, cumulative rates can be considerably higher when
summed across multiple programs in which a family participates.
The landscape of transfer programs has been radically transformed since Friedman’s first
writings in the early 1960s, and some of the transformations have tended to increase marginal
rates while others have tended to decrease them. While the only major transfer program in 1960
was the Aid to Families with Dependent Children (AFDC) program, with its 100 percent
marginal tax rate at that time, the great expansions of the welfare system in the 1960s and 1970s
which introduced or expanded the Food Stamp, Medicaid, and subsidized housing programs
increased multiple receipt and hence cumulative marginal rates for many families. The Medicaid
program was also extended to many more families in the 1980s and 1990s, and the recipiency
rate in the Food Stamp program (now called the Supplemental Nutrition Assistance Program, or
SNAP) has grown significantly, adding to the marginal rates facing newly enrolled families. On
the other hand, the AFDC program was dramatically reformed in 1996—and renamed the
Temporary Assistance for Needy Families (TANF) program--leading to greatly reduced
caseloads and lower marginal tax rates for those remaining on the program. The caseload
reduction reduced the incidence of multiple program receipt and hence lowered cumulative
marginal rates for a large fraction of the low income population. The expansion of the Earned
4
Income Tax Credit (EITC) in the late 1980s and early 1990s also greatly reduced marginal taxes
for the lowest earners and the subsequent creation of the Child Tax Credit (CTC) did likewise.
Marginal rates in the federal income tax were reduced in 1986 as well as in the 2000s for many
low-income families.
This paper presents new calculations of cumulative marginal tax rates for families
participating in multiple as well as single programs over the period 1997-2007. We begin in
1997 because we wish to only consider the modern transfer system, and that system was very
different before the 1996 reform of the AFDC program. We stop in 2007 because the Great
Recession began the next year and a number of temporary changes in transfer programs were
made which were not representative of long-term trends and, indeed, most (but not all) of those
changes have been phased out. We do not consider the post-recession period because that would
require incorporating the rate changes resulting from the Affordable Care Act, which are
complex and still being implemented. However, we do remark on the probable effects of the
Act on the rates we calculate in our final section.
Compared to most past work, our contributions are five-fold. First, we are
comprehensive in scope, computing marginal rates for all family types and for the four major
means-tested transfer programs for the nonelderly and nondisabled. Second, we examine time
trends, albeit only over an 11-year period, unlike most past work. Third, we include Medicaid
and subsidized housing, two important programs that are usually not examined, and we adjust for
their in-kind, non-cash nature. Fourth, we compute rates for all possible different combinations
of transfer program receipt and we show data on which combinations are most commonly
received, in reality, and therefore which cumulative rates are most important in the population.
Fifth, we compute rates for all 51 states and jurisdictions, which some past work has also done
5
but not all.
Our first section briefly describes the tax and transfer programs we examine and
summarizes our methods and how they compare to other recent calculations. We then present
our results, which show that MTRs vary widely in the low income population across program
combinations, family types, and earnings ranges. While the majority of the nondisabled,
nonelderly low income population faces low or modest rates, a fraction of the population,
particularly those at higher earnings levels and those participating in several programs, face very
high rates. A short summary and conclusions end the paper.
The Programmatic Landscape and Recent Other Calculations
To make the exercise manageable, we restrict its scope by considering only means-tested
transfer programs and not social insurance programs--hence we exclude the Social Security
retirement and disability programs, Medicare, Unemployment Insurance, and Workers’
Compensation--and we consider only means-tested programs for the non-disabled and the non-
aged--hence we exclude the Supplemental Security Income program. What remain are four
major means-tested transfer programs: the SNAP (Food Stamp) program, Medicaid, TANF, and
subsidized housing.1 On the tax side, we incorporate payroll taxes and federal and state income
taxes, including the Earned Income Tax Credit (EITC) and Child Tax Credit (CTC).
The marginal tax rates (henceforth, MTRs) on these individual programs are simple in
principle and complex in practice. We capture all their major features related to MTRs but
inevitably do not capture many of the smaller features of the benefit formulas which are unlikely
1 We do not include child care subsidies because those subsidies arise from a variety of
6
to change our conclusions. A summary of the MTRs in each transfer and tax program follows.2
The SNAP program has a nominal 30 percent MTR but it is effectively 24 percent
because of an earnings exclusion provision, and it has other deductions as well that are positively
correlated with earnings (e.g., for housing expenditures). However, it has a gross income limit
which limits beneficiaries to having income below a certain level regardless of the level of
deductions, and this generates a notch with an MTR greater than 100 percent at a single point.
The benefit formula has seen little change since 1997, although the caseload has grown
enormously, even prior to the Great Recession; it grew by 15 percent from 1997 to 2007, our
period of study.
The Medicaid program provides essentially free medical care to low-income adults and
children, to the elderly and disabled, and for long-term care, and is by far the largest program in
the country in terms of expenditure and caseload. The program has essentially no copays for
recipients but has a zero percent MTR until the point of income eligibility is reached, after which
all benefits are lost, creating a cliff, or notch, in the benefit schedule where the MTR exceeds 100
percent. While the benefit structure at this general a level has remained essentially unchanged
for most of its history, it has undergone major expansions in eligibility and significant changes in
income eligibility points. From its inception in the 1960s to the 1980s, it was mostly (although
not completely exclusively) tied to receipt of AFDC benefits, which restricted its caseload. In
the 1980s and continuing for several years thereafter, eligibility was extended to families with
children not on AFDC whose income fell below specific levels, but those levels were above
those of the AFDC program and hence higher income families were made eligible. These
different funding sources and there is no reliable data on how they are related to income.
2 A comprehensive discussion of the rules of each of these transfer programs can be found in Moffitt (2016).
7
changes reduced MTRs at low incomes (where the AFDC cutoff had been) but created a new 100
percent notch further up the income distribution. After 1996, adults in low income families with
children were made eligible in all states but income eligibility levels were kept quite low and
participation rates were modest; but over the rest of the1990s and 2000s, many states increased
their maximum income limits and participation rates among adults subsequently rose. Again,
this tended to lower MTRs at lower incomes and push the notch to higher incomes. In addition,
the creation of the Children’s Health Insurance Program (CHIP) in 1997 led many states to
extend coverage to children further, often with even higher income eligibility cutoffs than
families with children had had previously.3
The TANF program provides cash assistance for general consumption needs for low
income families (mostly single mothers and children) but its caseload is highly restricted by
work requirements, time limits, and by a block-grant financing structure whose grant amount has
been fixed in nominal dollars since 1996--it is not an entitlement program, for families can only
be served if funds are available. The MTRs in the program are less than 100 percent in most
states and the modal value is around 50 percent, but a few even have 0 percent MTRs coupled
with maximum income limits. There have been no major changes in MTRs over the 1997 to
2007 period.
Subsidized housing programs in the U.S. provide housing vouchers to low-income
families, subsidized rent in public housing projects, and support for construction of low-income
housing. We are not able to capture the effects of the third of these, but the first two provide an
implicit subsidy by charging a rent which is below the market value of the unit. Both charge a
rent equal to the maximum of 30 percent of income after deductions or 10 percent of gross
3 A handful of states also extended benefits to childless families, which we do not
8
income, and hence the MTR in the program is one of these two values. Again, no major change
has occurred in the MTRs over the period we study but the program, while large in terms of
expenditure because housing is expensive, is not one of the largest programs in terms of
caseload. This is because, like TANF, it is not an entitlement program and the number of
available units is severely limited by funds available. There are, in fact, long waiting lists to
obtain a housing unit or voucher.
For federal taxes, we include the employee portion of the payroll tax, the federal income
tax, and state income taxes. We capture the main features of the federal income tax including the
Earned Income Tax Credit (EITC) and the Child Tax Credit (CTC). The EITC offers refundable
tax credits to families with children (and a very small credit to childless families and individuals)
which is phased in over a low range of earnings and then phased out over a higher range. The
phase-in rate varies with the number of children and can be quite high, up to 45 percent. The
phase-out rate is lower, about 21 percent, which also implies that the credit extends fairly high up
into the earnings distribution. Treated as a welfare program--which we treat it here as such
regardless of how it is viewed by the public--it is the second-largest program in terms of
expenditure in the country, second only to Medicaid. While there were no major changes in the
EITC between 1997 and 2007, there were across-the-board reductions in federal income tax rates
in the 2000s as a result of Congressional legislation. The CTC, which began in 1998, provides a
small tax credit for low income families with children but it is only partially refundable for
families with no federal tax liability, with the refundability portion set as a modest percent of
earnings (e.g., 15 percent) but only of earnings over a threshold which was quiet high during our
sample period, meaning that few of the poorest families were able to receive a refundable
consider.
9
portion. The credit is also capped and the maximum began at $500 in 1998 but has since risen to
$1,000. The non-refundability means that the MTR is zero over low earnings ranges then
becomes negative (i.e., a subsidy) after positive tax liability is obtained. The credit has a slow
taper rate (i.e., MTR) and is consequently phased out completely only at very high earnings
levels (e.g., $75,000-$110,000). The CTC was created by 1997 Congressional legislation but
only took effect in 1998, and the credit cap was small but then gradually expanded. Our sample
period will capture both its introduction and its gradual liberalization. We also include state
income taxes, using schedules calculated by NBER TAXSIM. Many states offer EITCs part of
their income taxes, usually stated as a fraction of the federal EITC. We include these as well.
Cumulative marginal tax rates for families who participate in multiple programs, and
with the addition of positive taxes, are not always equal to the simple sum of the MTRs across
programs because of interactions among them. Most transfer programs allow some kind of
deduction for positive taxes paid, thereby offsetting their effect. But most also do not tax EITC
or CTC refunds at all. The SNAP, Medicaid, and subsidized housing programs count cash
income from most transfer programs as income, meaning that TANF is included if the family
participates in that program, but how Medicaid treats other program income is at state option.
That lowers the cumulative MTR from what it would be if the MTRs were simply summed.
Some states reduce TANF grants if a family is receiving subsidized housing, thereby implicitly
taxing its receipt. None of the transfer programs we study are included in taxable income by the
federal or state governments.
Past Work. While there have been several calculations of cumulative MTRs in the
country’s welfare system over the years, two recent calculations have provided perhaps the best
insights into their levels. Maag et al. (2012) calculated cumulative MTRs in 2008 for a single
10
parent with two children participating in TANF, Food Stamps, and paying federal and state
income taxes and the employee portion of payroll taxes. They calculated the MTRs for such a
family when moving from zero earnings to earnings at one-half the poverty line, then to the
poverty line, then to one-and-a-half times the poverty line, and then to twice the poverty line, and
they performed calculations separately for all 51 states and jurisdictions. They found average
MTRs of 2.4, 17.9, 50.5, and 47.3 percent when moving across the four ranges, respectively.
Cumulative MTRs therefore begin low but rise and eventually tail off slowly. However,
because there is such large cross-state variation in TANF MTRs, they found large cross-state
variation in cumulative MTRs as well. When moving from no earnings to earnings at half the
poverty line, the MTR could be as low as -27.9 percent (compared to the 2.4 average), while
moving from earnings at the poverty line to one-and-one-half the poverty line, the MTR could be
as high as 104.7 percent (compared to the 50.5 average). Above one-and-one-half the poverty
line, the cross-state variation becomes very small because families are off TANF and all
variation is only a result of state income tax variation.4
The U.S. Congressional Budget Office (CBO) (2012, 2015) has provided a variety of
different cumulative MTR calculations for the years 2012 and 2016, respectively. One set of
calculations provided MTRs for a families participating in the SNAP program and paying all
federal and state income taxes and payroll taxes in 2012. The median MTR for the same four
poverty-line ranges examined by Maag et al. were 13, 24, 32, and 31 percent, respectively.
These rates are higher at the bottom range than those of Maag et al. probably because the latter
were for a hypothetical single parent family while those for the CBO are the medians across the
4 The authors perform separate calculations for families who are on welfare only part of
the year, and they provide some calculations when Medicaid is included and valued at government cost. Their paper contains a useful review of prior work on cumulative MTR
11
U.S. population of families with incomes at those levels, and the population varies by family size
and other characteristics that affect the MTRs.5 The CBO MTRs are lower than those for Maag
et al. at the upper earnings ranges as well. But, like Maag et al., the CBO found rates to rise as
income rises, and found there to be major dispersion across families, some negative MTRs at low
earnings to rates as high as 61 percent at higher earnings ranges, although the variation in this
case is not so much from program variation as from variation in family characteristics. The CBO
(2015) report updated the estimates reported above to 2016 (and including the same set of
programs), with similar results.
Our Contribution. We make several contributions to this literature. First, we include
Medicaid in all our calculations, unlike Maag et al. or the CBO.6 Medicaid is the largest means-
tested transfer program in the country and has undergone changes in eligibility and in maximum
income limits, including over our study period 1997-2007. However, rather than valuing
Medicaid at government cost, we discount that cost because the subsidy is partly shared by
providers. Finkelstein et al. (2015) estimate that discount to be between .20 and .40. We use the
midpoint estimate of .30 and conduct sensitivity analyses to this value.
Second, we likewise include subsidized housing in our calculations, which is usually
ignored. But here, too, we discount its value because it, like Medicaid, is an in-kind transfer and
is not equivalent to cash income. There are no extant estimates of the appropriate discount factor
for housing in the same way there are for Medicaid, so we used a modified version of the Census
calculations as well. Steuerle (2015) provided updated estimates.
5 In Figure 2 of CBO (2012), some hypothetical single parent MTRs were also presented assuming participation in TANF as well as SNAP. These MTRs were considerably higher.
6 As noted in n.4 above, Maag et al. provided a sample additional calculation including Medicaid, valuing it at government cost. They also emphasized the importance of including health benefits. The CBO showed income eligibility cutoffs for Medicaid but did not include them in their MTR calculations.
12
Bureau “fungibility” approach, which values the subsidy as the amount of funds released for
other uses (Short,2015). But we assume that some of the subsidy will be used for housing and
hence we discount it by .70, the approximate budget share for non-housing goods assumed by
Census. We also conduct sensitivity analyses to this figure.7
Third, we conduct an analysis of historical MTRs going back to 1997, and we also
provide trend analyses, albeit only over the 1997-2007 period. Prior work has not focused on
trends.
Fourth, we explicitly examine how cumulative MTRs vary depending on how many
programs a family participates in, and in which ones, by calculating rates for all possible
combinations of program participation. In addition, we examine actual data on the numbers of
families who participate in different combinations and we use those results to assess which of the
cumulative MTRs we calculate are most important for large numbers of families.8 We also
provide an illustrative calculation of “average” MTRs in the low income population as a whole,
derived by taking a weighted average of MTRs across that population, with the MTRs in each
program combination weighted by the fraction of the population participating in that
combination.
Fifth, our analysis is comprehensive in terms of family types, unlike most past work. We
separately examine single parent and married parent families, those with different numbers of
children, and childless families both married and unmarried. The cumulative MTRs are often
7 We do not discount the third in-kind transfer, SNAP, because most analysts regard it as
approximately equivalent to cash. Note that Short (2015) caps the value of the housing subsidy at the share of the poverty threshold allocated to housing costs. We do not find outlier estimates of the subsidy and hence do not cap its value.
8 The CBO did show figures for participation rates in different combinations of programs but their main MTR calculations were only for families participating in SNAP. Maag et al.’s main calculations were only for families participating in TANF and SNAP.
13
quite different over the same earnings range for different family types.
In other respects, we follow past work. We calculate MTRs for moving from one
discrete earnings level to another--specifically, fractions of the federal poverty line--rather than
for one extra dollar of earnings. The latter is misleading if families decide whether to work some
discrete number of hours such as working part-time or full-time. Most workers do not or are not
allowed to change their work effort by single-hours and hence small-dollar amounts.9 We also
make calculations for every state and jurisdiction in the U.S. for all our years, although we, as in
much past work, begin by illustrating MTRs only for a few sample states. For our calculations
of all states, we give a sense of the range as well as the central tendency.
Results
We first address the issue of participation in means-tested transfer programs in the U.S.
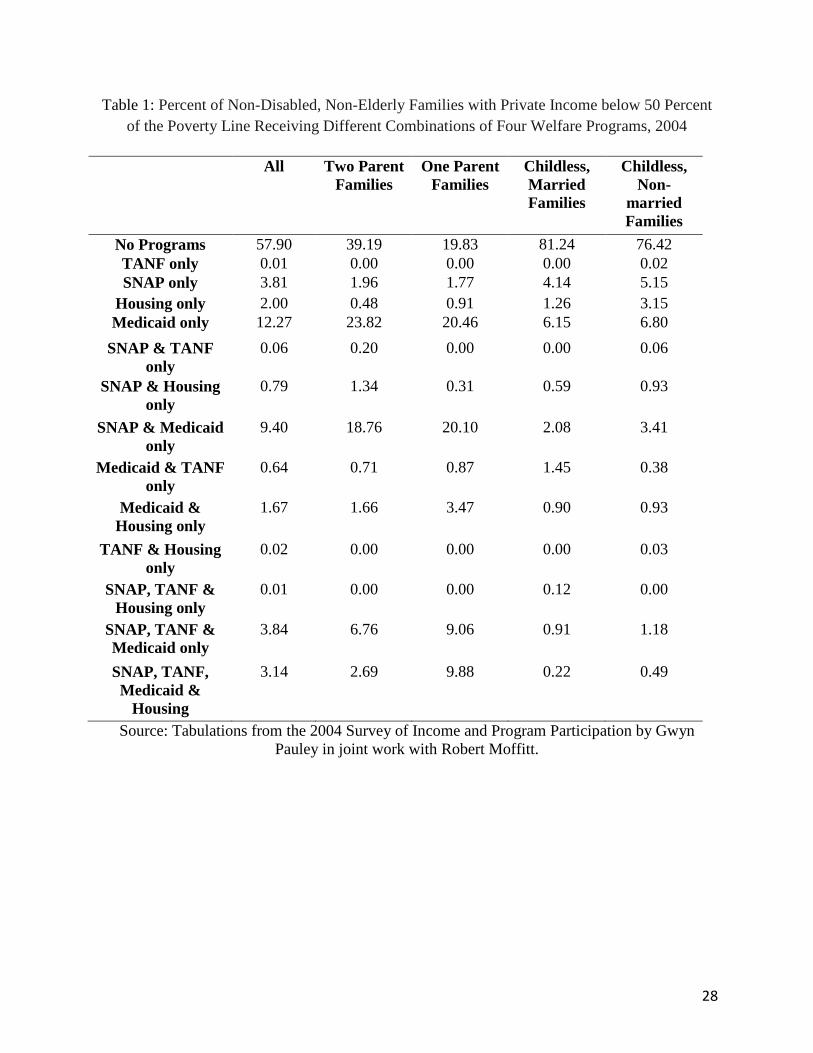
low income population and rates of multiple benefit receipt. Table 1 shows participation rates of
very poor nonelderly nondisabled families—those with private incomes (mainly earnings)
between 0 and one-half of the poverty line—in our four welfare programs in 2004, a year within
our study period. Among all such families, almost 58 percent received none of the four; hence a
minority of families participate in any program. The most common program combination
received was, in fact, a single program—Medicaid—which was expanded greatly during our
period, as noted previously. For multiple programs, the most common combination was
Medicaid and SNAP, where over 9 percent received both benefits. For combinations involving
9 The sample estimates provided by Maag et al. (2012) and Steuerle (2015) which
include Medicaid, however, do only calculate one-dollar MTRs, as do many of the CBO estimates. However, their results cited above for both their results are for discrete earnings changes as a percent of the poverty line.
14
three or all four programs, receipt was much smaller, no more than 3 and 4 percent.10
Some program combinations were much more commonly received among families with
children, however. About a fifth of all one-parent families received both Medicaid and SNAP
and another fifth received Medicaid only. Between 9 and 10 percent received benefits from three
and four programs, respectively. Receipt rates were generally lower for two-parent families but
still higher than for the general population, and were higher than those for one-parent families for
the receipt of Medicaid alone. However, even for families with children, most of the possible
receipt combinations were quite rare. Childless families, as should be expected, have much
lower rates of receipt. However, this group is of policy interest because there have been
proposals for expanding the EITC for them and there have been ongoing discussions of the
conditions under which they can receive SNAP benefits.
Why receipt of any program and of various combination of programs is so low is a
natural question. One possibility is that many families do not meet the asset tests for these
programs, and asset data in many surveys are quite poor and are not taken into account in Table
1. Low rates of receipt of subsidized housing and TANF are also likely a result of their non-
entitlement nature, which means that many families who are financially eligible are not able to
receive benefits. Yet another reason is that it is widely known that many families do not
participate in entitlement programs for which they appear to be financially eligible. Take up
rates of financial eligibles (including assets) in SNAP were only 60 percent in 2004, for example
(Barrett and Poikolainen, 2006). Common explanations for a failure to participate are the
possible stigma to being a welfare recipient, or high time and hassle costs required to comply
10 Some combinations are not shown in the table. Their participation rates were very low.
Note that participate rates at income levels above 50 percent of the poverty line are always lower because families gradually become income-ineligible for some of the benefits.
15
with the many rules and regulations of the programs, or both.
Whatever the reason, it is clear that many program combinations are received so rarely as
to be not worth considering. In what follows, we present cumulative MTRs only for
combinations for which at least 2 percent of all families or of any demographic group shown in
Table 1 participate. In addition to the obvious no-program category, this includes single-
program receipt of Medicaid, SNAP, and housing; two-program receipt of Medicaid and SNAP
as well as of Medicaid and housing; three-program receipt of Medicaid, SNAP, and TANF; and
four-program receipt of Medicaid, SNAP, TANF, and housing. We present results first for
single parent families with two children, the group with the highest participation rates and
consider how the MTRs differ for other demographic groups subsequently. We also begin, as
previously noted, by showing MTRs for only three selected states: Mississippi, New York, and
Ohio. These states represent, very roughly speaking, states with low benefits on average (at least
those under the control of the state), high benefits, and medium-level benefits, respectively.
Figure 1 illustrates how we will present most of our findings. The figure shows MTRs
for a family which participates in none of the four transfer programs and only pays positive taxes
but excluding the EITC and CTC, and shows the rates for both our initial and our final years,
1997 and 2007. A family in Mississippi moving from complete non-work to work with earnings
at one-half of the government poverty line in 1997 would pay a MTR of about 11 percent, arising
from the payroll tax and the state income tax (it would pay no federal tax in this earnings range).
Doubling earnings to reach the poverty line would lead to an MTR of 22 percent because the
federal income tax would kick in. Moving to earnings at 150 percent of the poverty line or 200
percent would lead to slightly higher MTRs—about 27 percent--because of the progressive tax
structure at the federal and state levels. MTRs are lower almost everywhere in 2007 because of
16
federal income tax reductions in the late 1990s and early 2000s. Rates are slightly higher in New
York and slightly lower in Ohio because their state income tax rates were a bit higher and a bit
lower, respectively, than those in Mississippi.
Figures 2-9 show how these MTRs change with progressively different combinations of
means-tested transfer program participation and with the addition of the EITC and CTC. The
last of these is illustrated in Figure 2, which shows that the addition of these two tax credits
markedly reduces MTRs at low earnings and raises them at higher earnings levels. This must be
the case since subsidies given at low earnings must eventually be phased out. In Mississippi, the
MTRs in the lowest two earnings intervals in 1997 fall from 11 percent and 22 percent,
respectively, to -29 percent and 9 percent but rates in the higher two earnings intervals rise from
22 and 27 percent, respectively, to 48 and 49 percent.11 Thus MTRs were quite high at earnings
just above the poverty line, almost 50 percent in 1997, even without any welfare program
participation. Again, Mississippi rates were slightly lower in 2007 but are reduced even more
than before because of the introduction and increased generosity of the CTC over this period
(rates even become negative for earnings just below the poverty line). Ohio rates are not far
different, but New York had both lower rates for earnings below the poverty line (as low as -40
percent at the bottom in 2007) and higher MTRs for earnings above the poverty line (up to 56
percent) because that state had its own EITC over this period.
Relative to this base no-transfer-program case, participating in welfare programs can only
increase rates. MTRs at the bottom of the distribution should be expected to become less
negative or positive and those at higher earnings ranges should be expected to be higher than 48-
56 percent. Figures 3-5 show the magnitudes for a family participating in only one program,
11 Note that the vertical scale of the graphs differs in each Figure. Putting them all on the
17
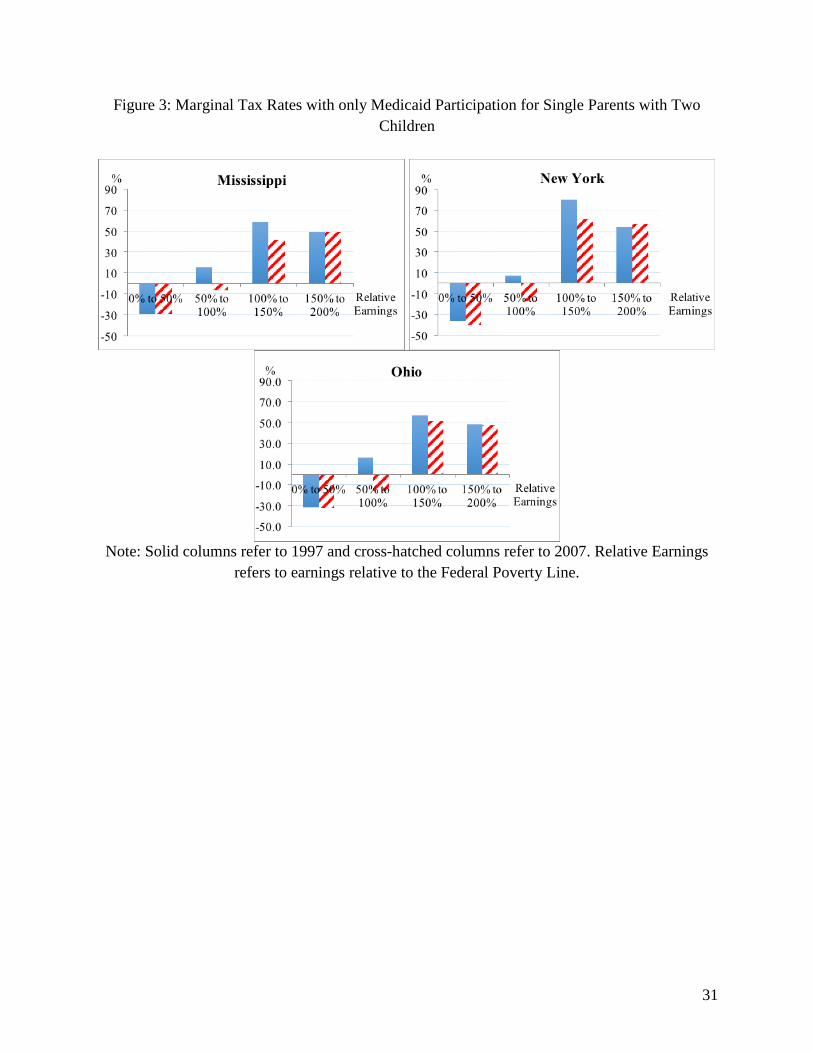
either Medicaid (Figure 3)—by far the most commonly received category, as shown in Table 1—
or SNAP (Figure 4)—the next highest among single-program receipt--or subsidized housing
(Figure 5). Adding Medicaid, as in Figure 3, affects MTRs by the introduction of notches. States
have two separate notches, one for adults and one for children but the former generally occurs at
lower earnings levels. So, example, Mississippi, whose adult program has a relatively low cutoff,
experiences an increase in the MTR in the earnings interval just below the poverty line, from 9
percent to 15 percent, whereas New York has no change in its MTR in that interval because it
has a higher income cutoff for adult Medicaid. The MTR in New York instead increases rates in
the earnings interval just below the poverty line, from 7 percent to 19 percent. The state income
eligibility cutoffs for children increase rates just above the poverty line or increase rates at
earnings levels higher than twice the poverty line. Thus MTRs often increase by as much as 10
percentage points in earnings interval just above the poverty line, although sometimes by less.
There are also slight changes from 1997 as many states raised Medicaid income eligibility levels,
which tended to push down MTRs in relatively lower earnings ranges and raise them in higher
ranges. But the highest MTRs now are only slightly higher than the maximums in Figure 2 and
reach close to 60 percent in the top earnings interval.
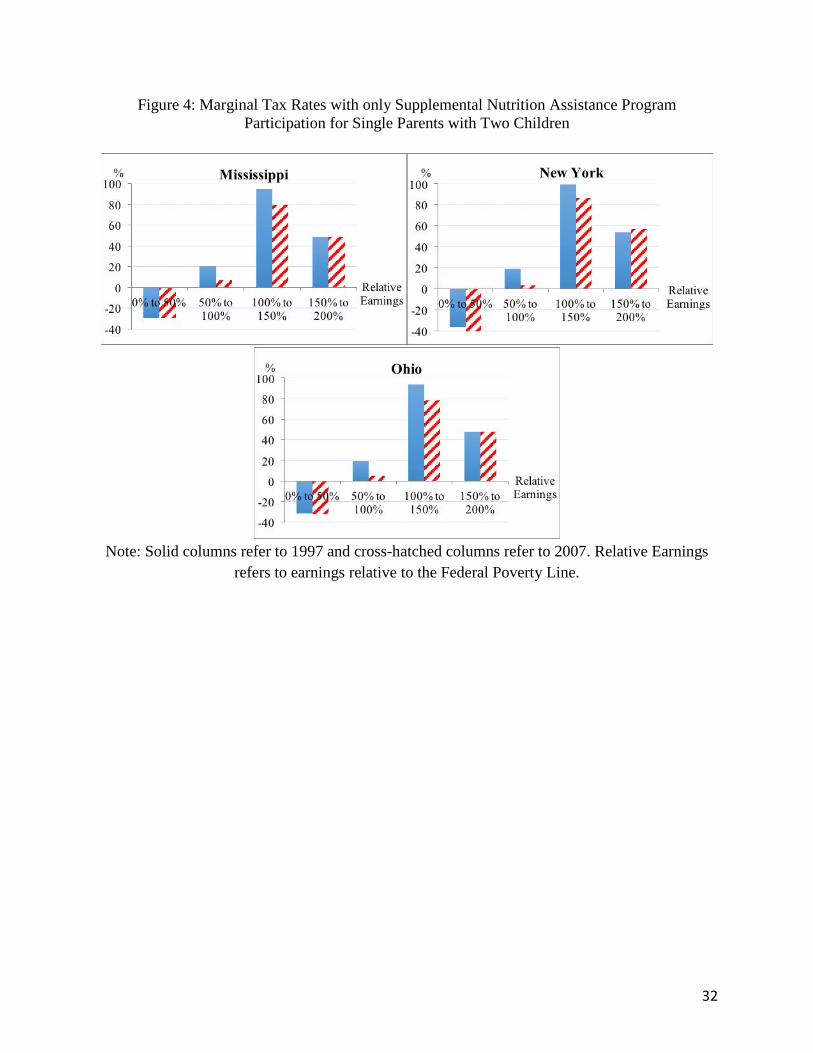
Recipients of SNAP (Figure 4) have higher MTRs as well than in Figure 2 as well,
although because of earnings deductions, the rates for the poorest families are all still negative.
However, they are all now positive for earnings just below the poverty line and are higher in the
upper earnings ranges. The largest increases tend to occur in the 100% to 150% range, where
SNAP adds between 38 and 44 percentage points to the MTR, depending on the year and the
state, hence reaching levels of 90 percent or a bit below or above. These high MTRs are the
same vertical scale would make it difficult to ascertain variations when MTRs are relatively low.
18
result of hitting the SNAP gross income test, which adds onto the top of the high Figure 2 MTRs
in that range arising from various positive taxes and from the EITC and CTC phase-out. There
are no major cross-state differences in this factor because SNAP is a federal program.
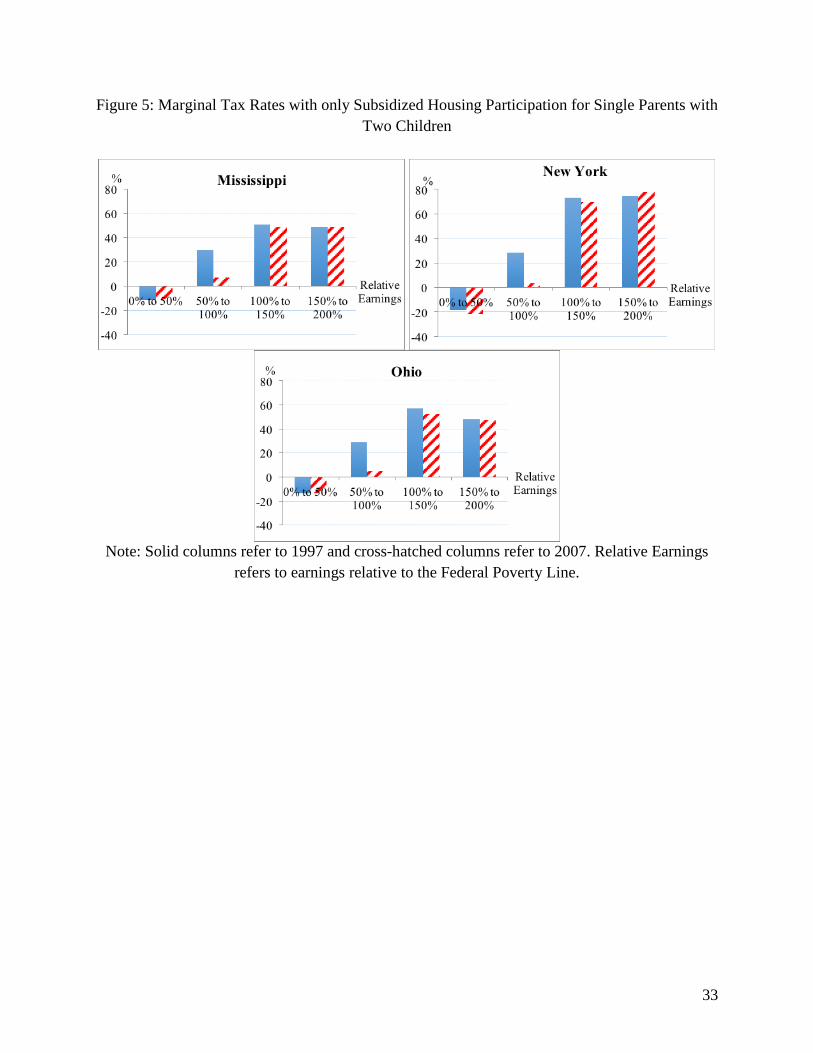
Recipients of subsidized housing (Figure 5) experience higher MTRs than those in Figure
2 but which are more evenly spread out than those of Medicaid or SNAP. In Mississippi and
Ohio, which are relatively low housing cost states and hence where the subsidy amount is
modest, MTRs for earnings below the poverty line rise by about 14 percentage points. They
have little effect on earnings above the poverty line in Mississippi because the family becomes
ineligible, but only phase out in Ohio in the top earnings range. But in New York, with its larger
housing subsidies, the increase in MTRs is higher in general, adding about 20 percentage points
to the MTR, and is phased out only at earnings slightly above 200 percent of the poverty line.
Top rates in the upper earnings range when housing is added are around 75 percent and all occur
in New York.
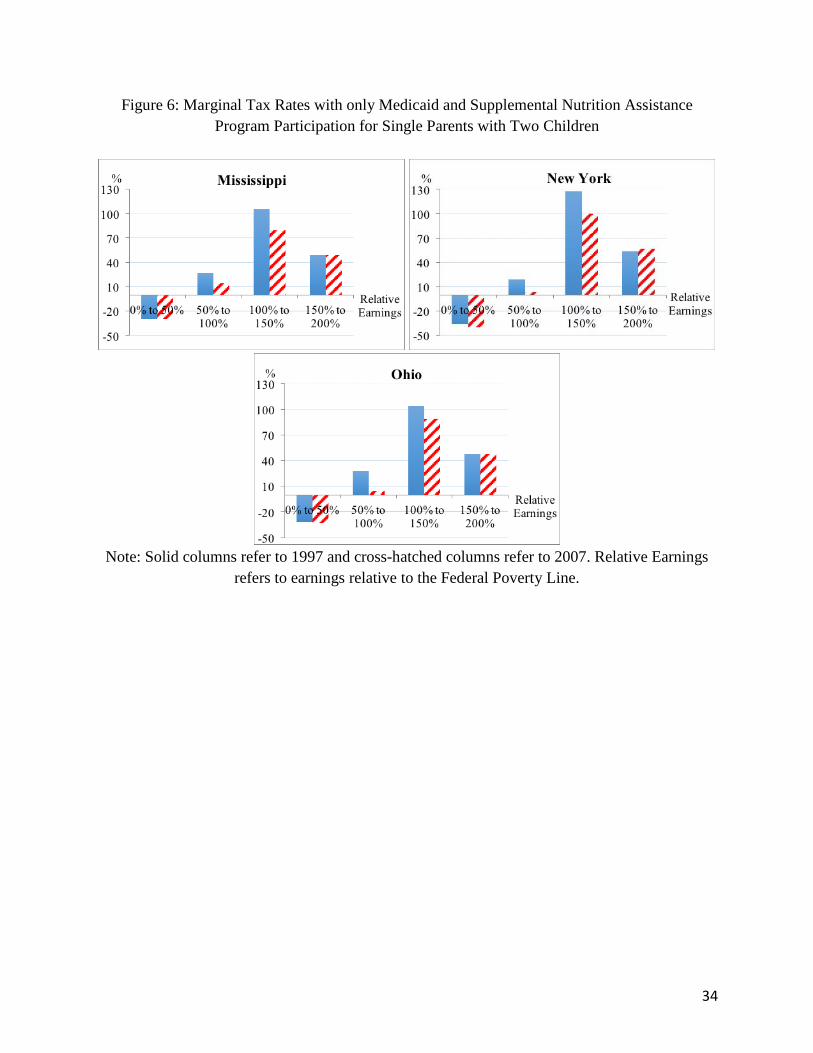
Figures 6-9 show MTRs for multiple program receipt and are necessarily higher. The
most common combination is Medicaid and SNAP only (Figure 6). Since the two programs do
not interact, the MTRs are just the sum of those from the two programs separately. As already
noted, Medicaid only affects MTRs at the point of eligibility loss whereas SNAP increases
MTRs throughout and particularly around the point where the gross income test eliminates
eligibility, which is typically just above the poverty line. Thus MTRs for earnings below the
poverty line remain negative or positive but modest in magnitude, but rates above the poverty
line are particularly high, reaching over 100 percent in all three states in 1997 for earnings just
above the poverty line. MTRs in the top earnings range are little changed from those in Figure 2
because both programs are phased out by then. When Medicaid and subsidized housing are
19
received, on the other hand (these programs also do not interact), rates are typically not so high
because housing, as noted previously, phases its subsidy out smoothly and does not have the
notch that SNAP does. The top rates are 62 to 67 percent in Mississippi and Ohio because of
their relatively modest housing subsidies and are 83 to 101 percent in New York because of its
higher-valued subsidy.
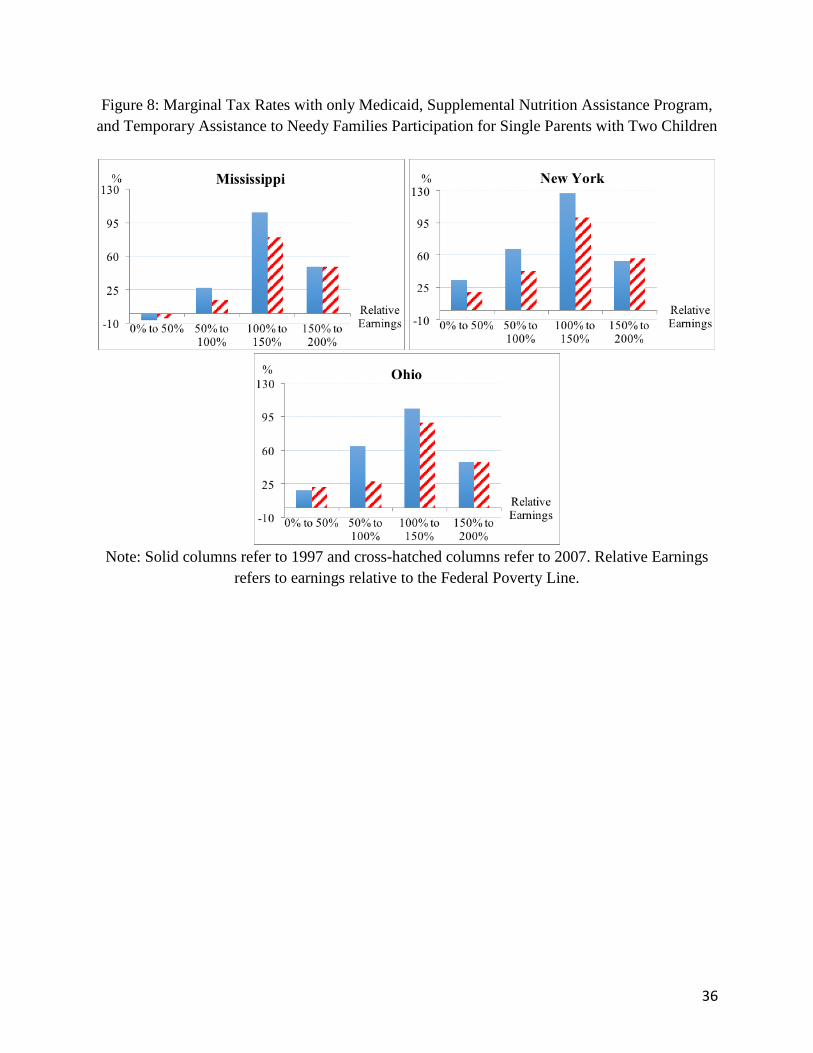
The last two combinations, of three and four program receipt, are shown in Figures 8 and
9, respectively, are each received by less than 10 percent of the low income single-parent
population; however, they increase MTRs for those who participate. But the TANF program has
very low income cutoffs, almost always below the poverty line and sometimes below 50 percent
of the poverty line, as in Mississippi. Hence the MTR increase from participating in TANF as
well as SNAP and Medicaid has no effect on the top MTRs in earnings ranges above the poverty
line. Below them, the increase is somewhat moderated by the fact that SNAP includes TANF in
its countable income, but MTR increases vary greatly between states, from an increase of about
23 percentage points in Mississippi in the lowest earnings category to almost 60 percentage
points in New York for earnings just below the poverty line, and MTRs are mostly positive
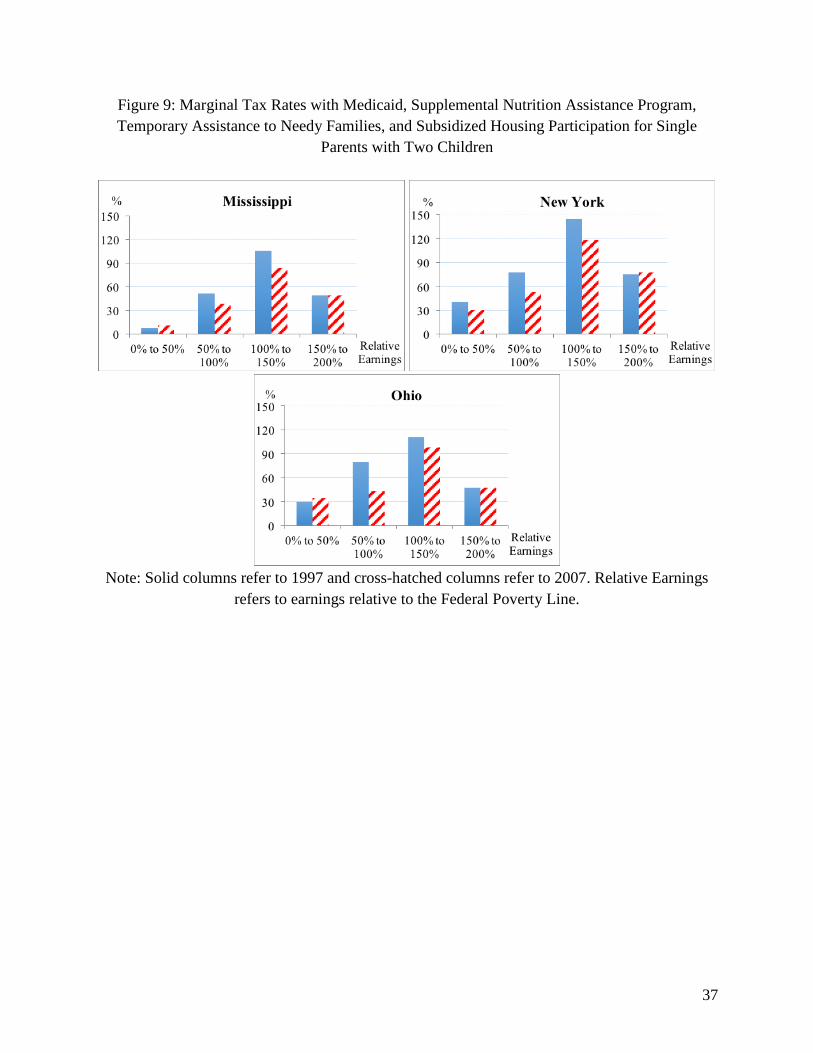
below the poverty line. Participating in these three programs plus subsidized housing (Figure 9)
leads to increments to the MTRs in all earnings ranges, ameliorated by the inclusion of TANF in
countable income for computing housing benefits. Rates in the 50-100% range now can as high
as 79 percent and as high as 145 percent in the 100-150% range. Rates for the poorest families
are modest in Mississippi, only a little over 35 percent in 2007, but are considerably higher in
New York and Ohio, where they range from 40 to 50 percent.
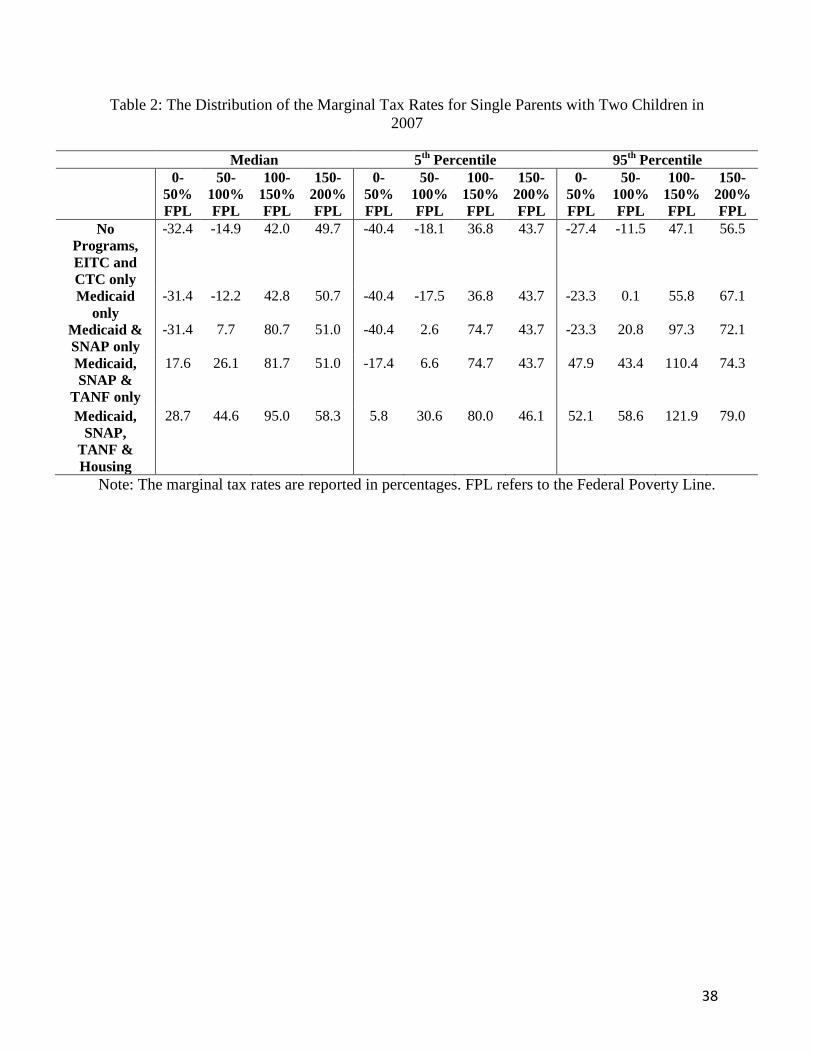
Going beyond these three illustrative states, Table 2 provides a sense of the distribution
of MTRs across all 51 states and jurisdictions. Only rates for 2007 are shown, and only for the
20
five most common program combinations for single parent families. The medians are not far
different than those for the three states just discussed. Medians MTRs for those with the lowest
earnings are always negative unless TANF and housing are received, in which case they rise to
18 to 29 percent; but rates in the higher earnings intervals are greater, particularly if SNAP is
received. Indeed, the receipt of SNAP causes the single largest increase in MTRs in the table,
often raising them by almost 40 percentage points for earnings just above the poverty line, taking
the medians to around 80 percent. This arises because of the SNAP notch, as noted previously.
The other two panels in the table show the 5th and 95th percentile points of the MTR distribution,
respectively. The range of MTRs between these points depends on whether the benefits in
question are state-specific or not. When Medicaid is the only state-specific program received,
the range from the 5th to 95th points is about 20 percentage points, which is not a large range
compared to, say, how much MTRs vary across the earnings distribution, to take one
comparison. But when either or both of two other state-specific programs—TANF and
housing—are added, the range often rises to 30 or 40 percentage points for earnings just below
or just above the poverty line, and up to 70 percentage points in the lowest earnings interval.
Interestingly, the dispersion falls slightly when both TANF and housing are received, partly
because the variance of housing benefits across the states is smaller than that of TANF and
because housing programs include TANF benefits in countable income.
Looking over all program combinations and percentile points when at least one transfer
program is received, MTRs in the lowest earnings interval can be as low as -40 percent and as
high as 52 percent; rates for earnings just below the poverty line range from -18 percent to 59
percent; and rates for earnings just above the poverty line range from 37 to 122 percent.
Other Family Structures. We started with tax rates for single mothers because that
21
demographic group has the highest participation rates in the four means-tested transfer programs
we consider. But, conditional on participation, differences in MTRs for other family types in the
population are often not very different and, where they are, the differences are for obvious
reasons. Childless families, for example, are not eligible for TANF or Medicaid (in most states)
and are not eligible for the CTC and only eligible for a small EITC subsidy. Married families
with children often face the same rates as single parent families if the amount of income is the
same as well.
Table 3 illustrates differences in MTRs across different family types in one state, Ohio, in
2007. In the absence of any transfer program, as illustrated in the first panel of the table, having
one child rather than two children affects rates a bit, with lower subsidies at low earnings ranges
and lower positive tax rates at higher earnings ranges. This arises almost entirely through the
EITC and CTC, which are more generous (and hence phase out less as well) for two children
than for one child (there are also small income tax differences). Married families have almost
the same MTRs for the same number of children as single parents with the exception of the 50-
to100 percent range, and this is largely an artifact of the fact that the poverty line for a two-
parent family is greater than that of a single parent family, and this translates into a higher level
of earnings at any given ratio to the poverty line. Childless families who receive no transfer
programs only experience income and payroll tax rates, and these are, again, higher at lower
earnings and lower at higher earnings than for families with children.
Table 3 also illustrates differences by family type for the two most common transfer
program participation combinations, Medicaid alone and Medicaid and SNAP alone, again only
for Ohio. As expected from the discussion above, the main effect of Medicaid is to raise MTRs
around the notch where the adult eligibility ends, and this typically raises MTRs at earnings just
22
below or just above the poverty line. The change is not too far different for one-child and two-
child families. Rates rise more for married than single families because we are assuming that
both parents receive Medicaid coverage, and this means higher MTRs when benefits are lost
because benefits are larger. Rates for childless families are unaffected by Medicaid because they
are ineligible. Adding SNAP to the program receipt combination again raises rates, more for
married families than for single because earnings are greater at any given poverty line ratio
point; but the addition of SNAP raises rates for those who have one and two children by
approximately the same amount. Childless families receiving SNAP face higher MTRs at low
earnings than families with children but lower MTRs at high earnings levels because their SNAP
benefits phase out sooner and they are less likely to hit the notch arising from the gross income
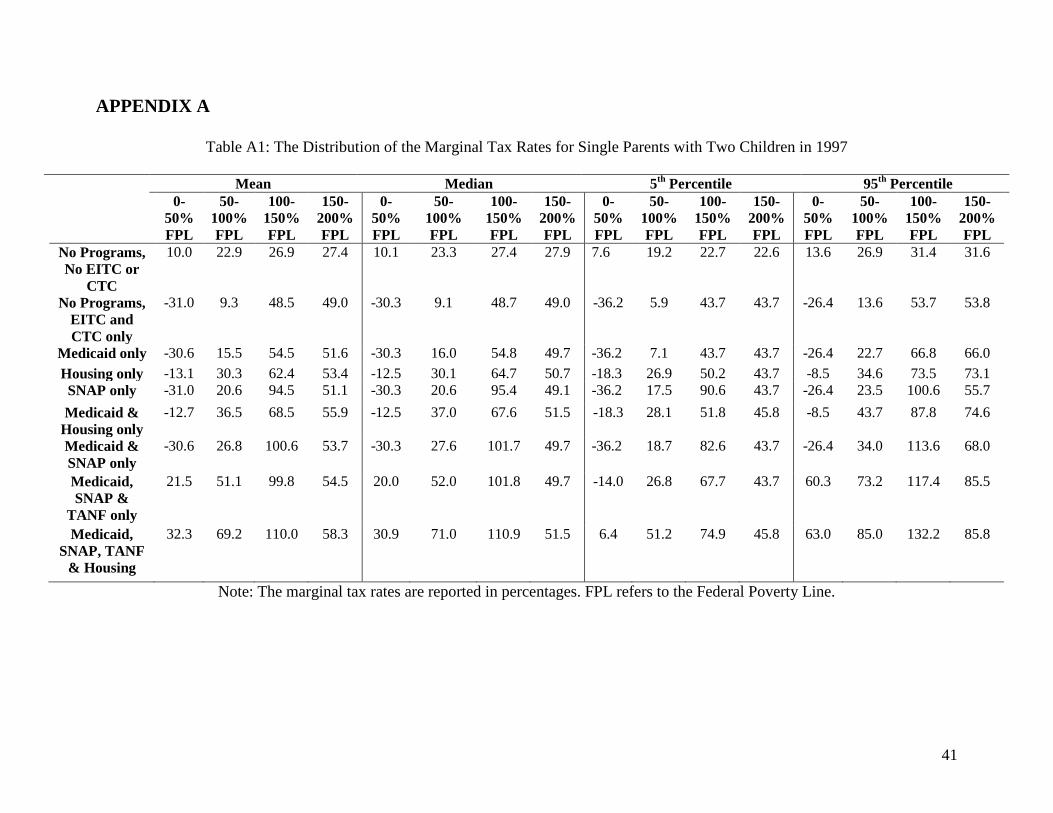
test. Median and 5th and 95th percentile points distributions for other family types, as well as
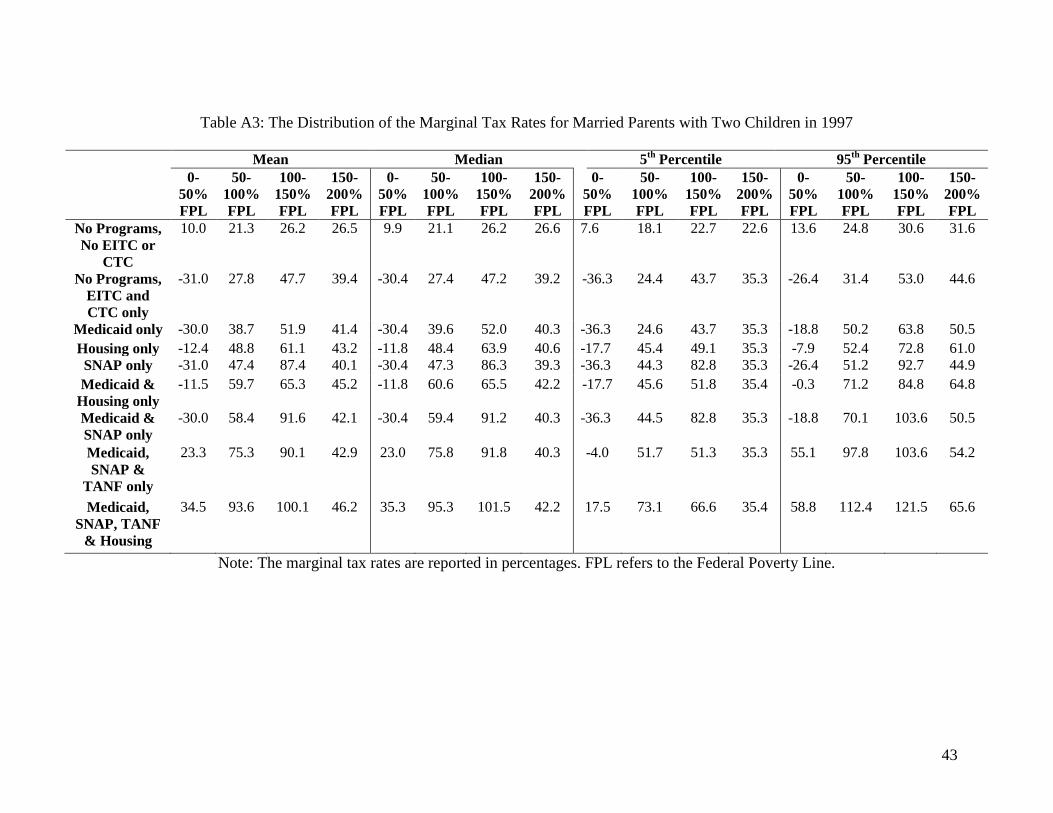
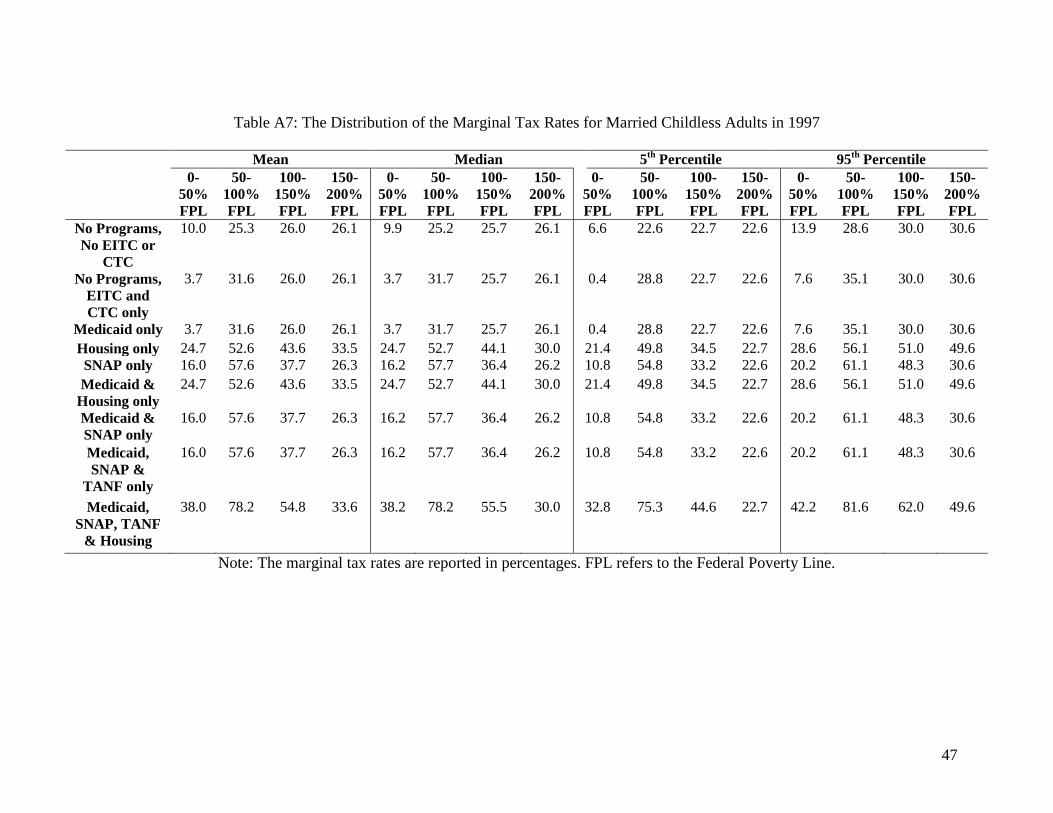
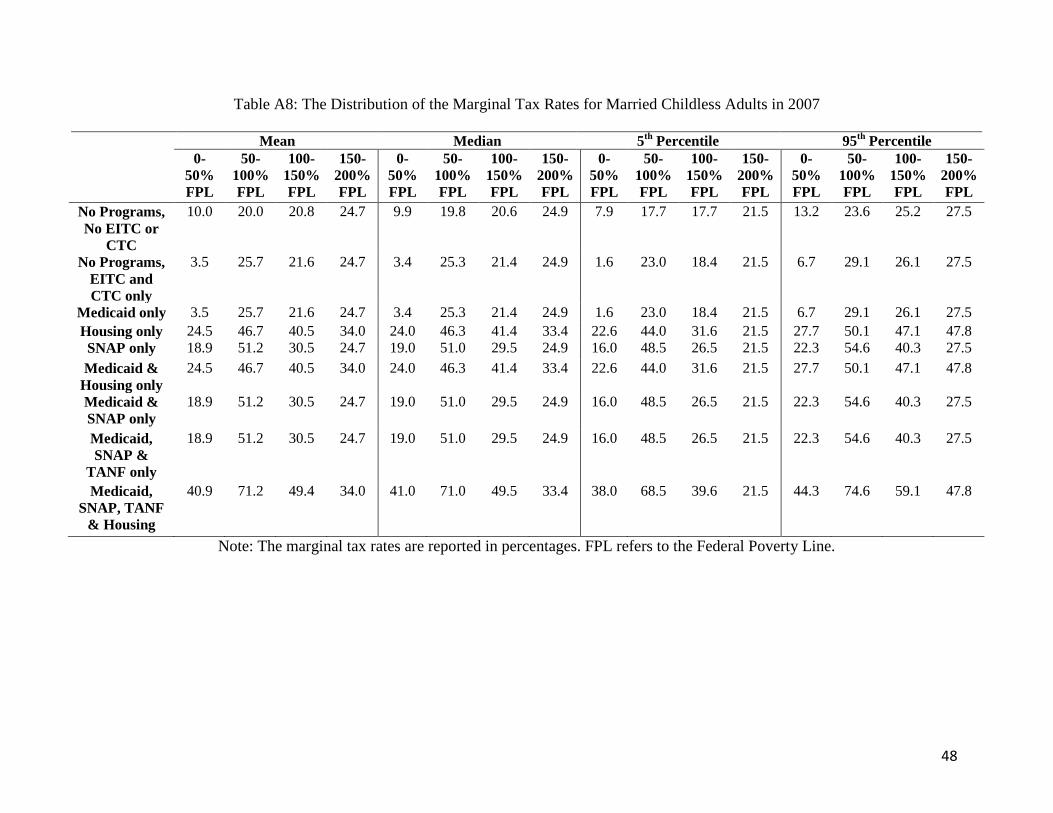
means, across all states are shown in Appendix Tables A1 to A8. The medians for different
types and program combinations vary in a pattern similar to those for Ohio. For married parents
with two children, for example, when the same program combinations shown in Table 2 are
considered, MTRs in the lowest interval range can be as low as -36 percent and as high as 59
percent; rates for earnings just below the poverty line range from 18 percent to 112 percent; and
rates for earnings just above the poverty line range from 44 to 122 percent. These ranges are
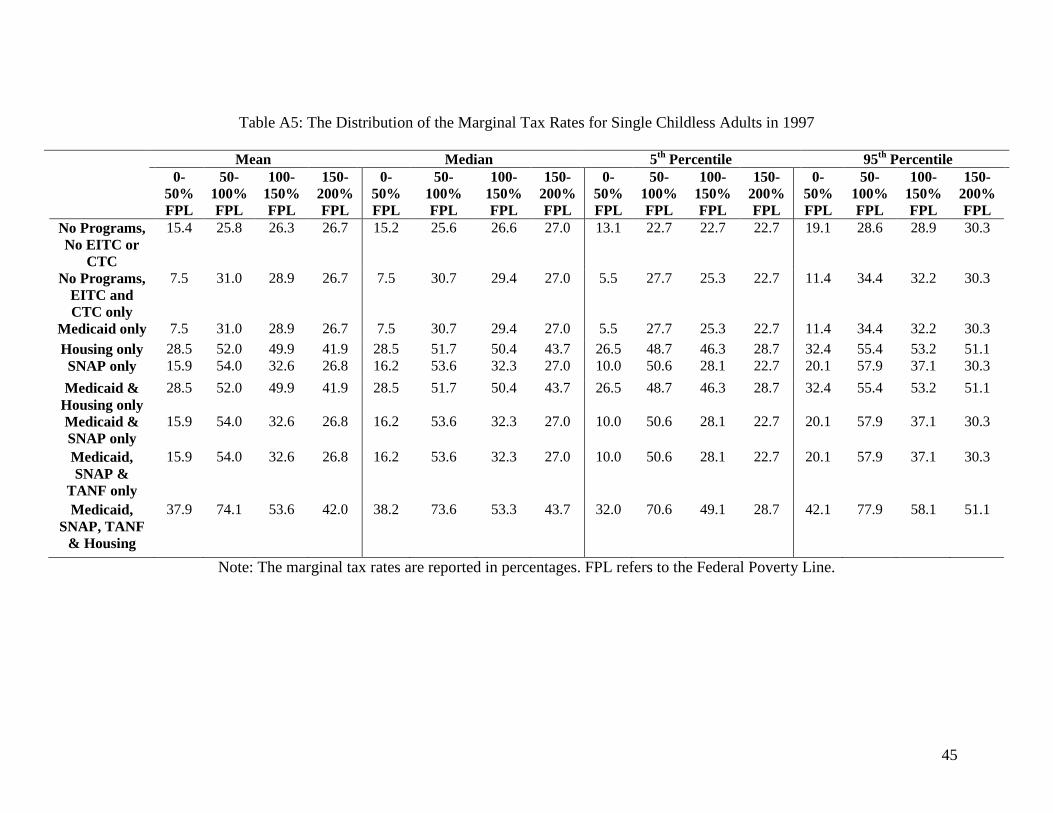
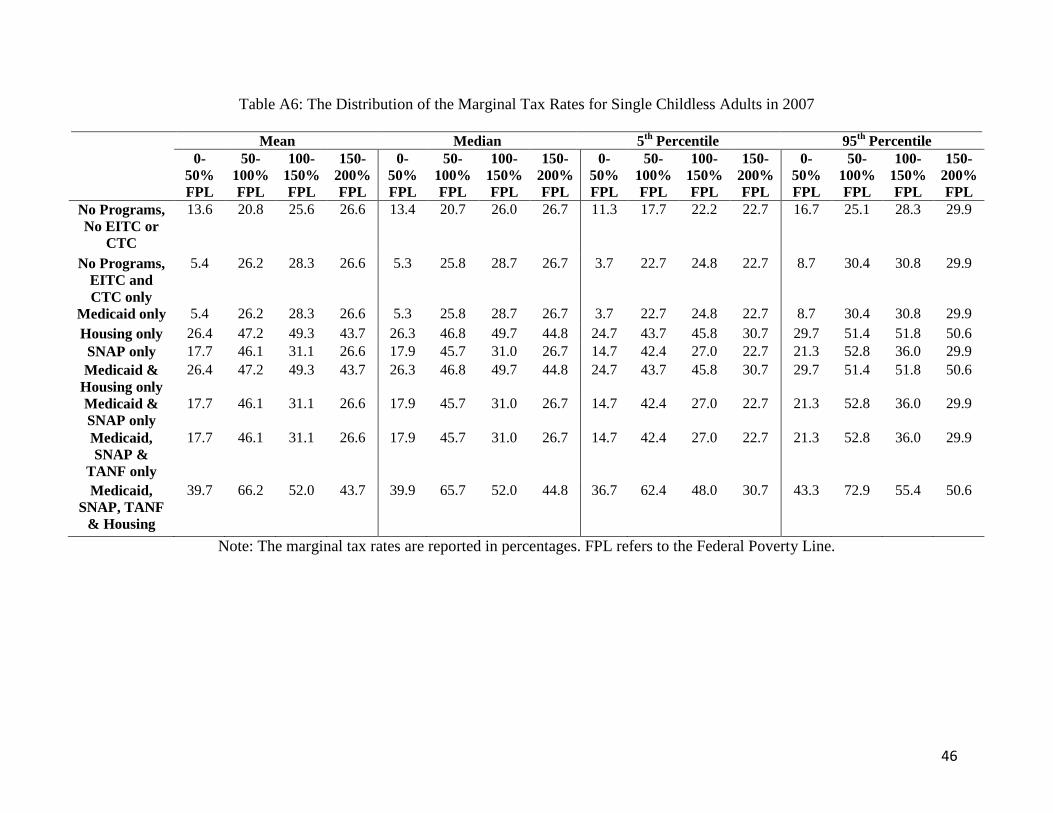
somewhat higher than those for single parent families. For childless families MTRs are always
positive and MTRs in the lowest interval range can be as low as 6 percent and as high as 43
percent; while rates for earnings just below the poverty line range from 23 to 81 percent; and
rates for earnings just above the poverty line range from 18 to 62 percent.
Weighted Marginal Tax Rates. As repeatedly emphasized in this paper, rates vary
enormously across families participating in different program combinations and the fraction of
23
families in each demographic group who participate in different combinations also varies
significantly. One way to incorporate this consideration is to construct a weighted average of the
MTRs in different earnings ranges, using the participation rates for each demographic group
shown in Table 1. Those participation rates were for the nation as a whole, however, not by
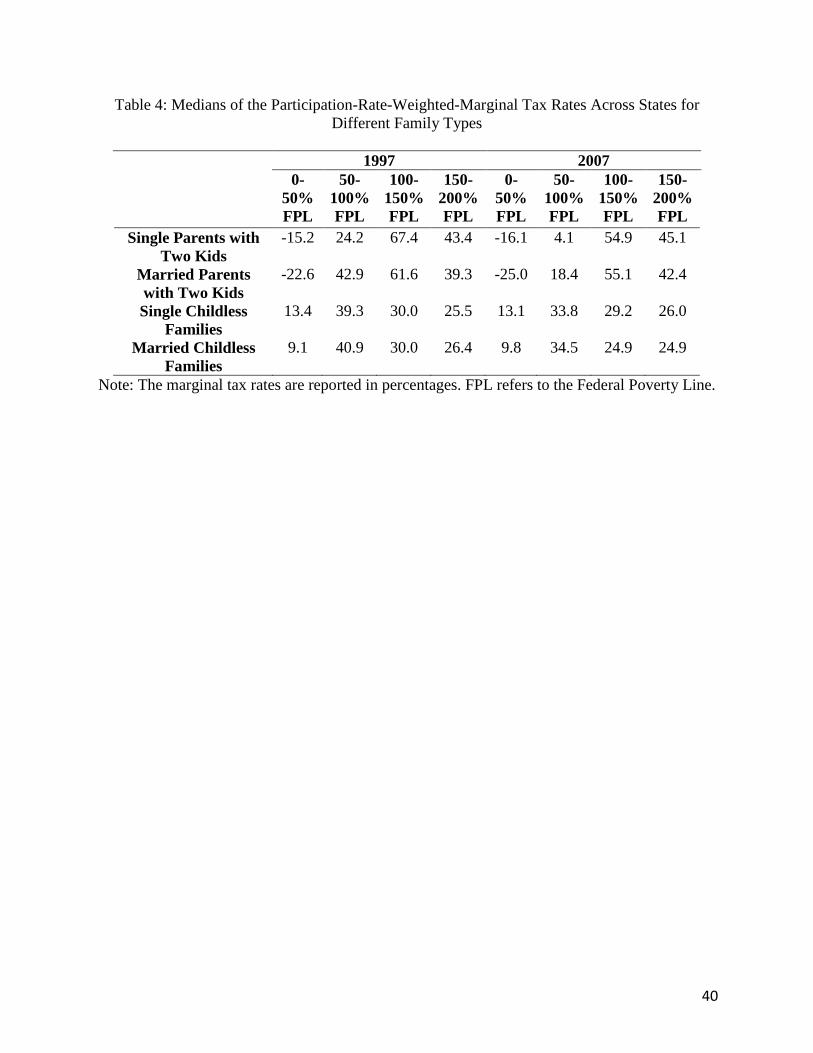
state, so these calculations can only be regarded as a rough approximation. Nevertheless, Table
4 shows the medians of such weighted MTRs in 1997 and 2007 for different groups. These
medians are all below those we have shown in previous tables, in absolute value, because the
fraction of the population not receiving any transfer program is included in the calculation, and
those fractions can be quite high for some groups (see Table 1 again). For single parents with
two children, the median state MTR in the lowest earnings interval is -15 percent and that in the
earnings interval just above the poverty line—where MTRs are typically the highest—is never
more than 67 percent. These lower rates serve mainly to illustrate that the problem of high
MTRs for the low income population only occur for some demographic groups in some regions
of earnings, and not for most families.
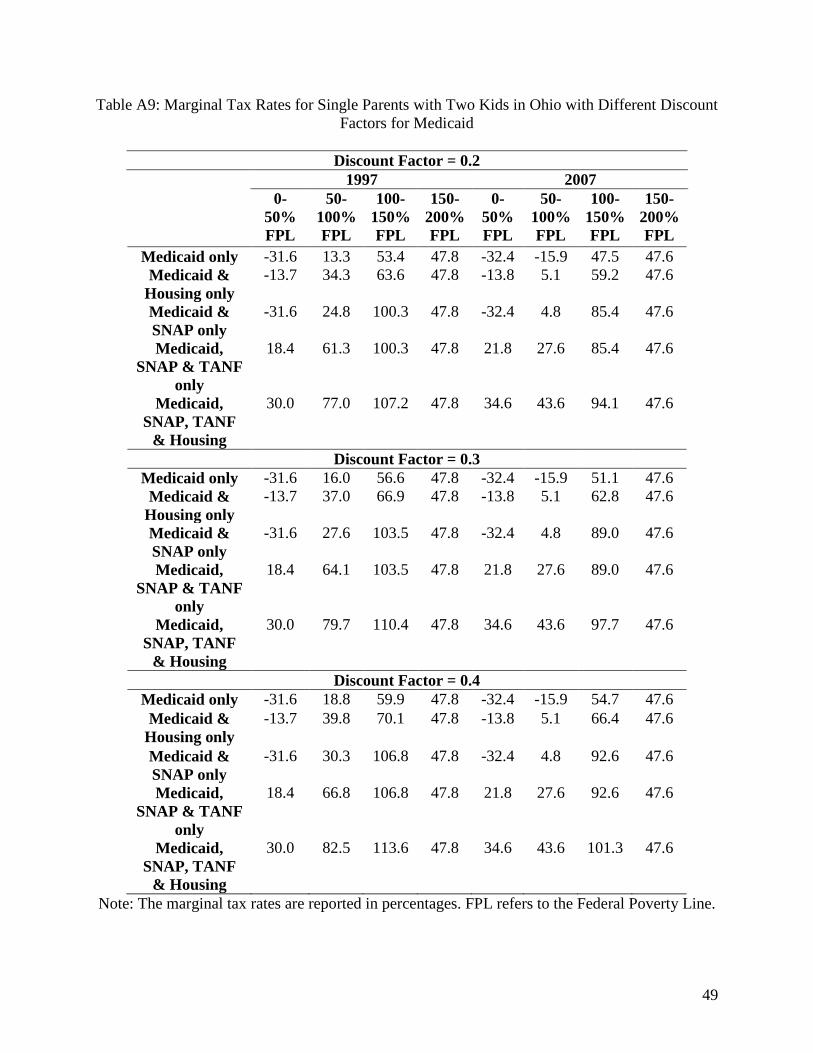
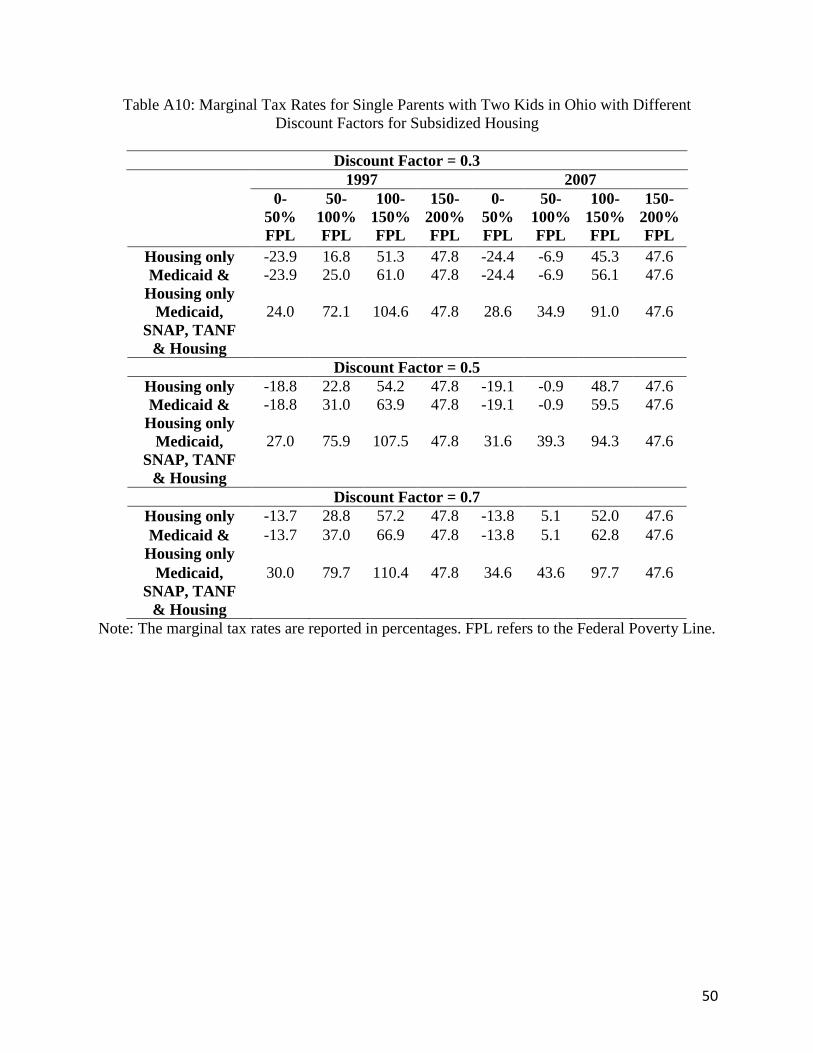
Discounting of Medicaid and Housing Benefits. Finally, we consider the sensitivity of
our results to our assumed discount rates for Medicaid and housing benefits, of .30 and .70,
respectively. We illustrate the impact of these assumptions by considering Medicaid discount
rates of .20 and .40 and housing discount rates of .30 and .50. The effects of these alternative
assumptions on MTRs for single parent families with two children in Ohio in 1997 and 2007 are
shown in Appendix Tables A9 and A10. Only program combinations involving receipt of
Medicaid and housing are shown. Interestingly, discount rate variation in this range has very
little effect on MTRs. For Medicaid, it will only affect MTRs in the range where eligibility ends,
for MTRs are zero in all other ranges. The range of MTRs from the highest to the lowest
24
discount rate is never more than 7 or 8 percentage points. For program combinations involving
the receipt of subsidized housing benefits, the range is sometimes larger in some earnings
intervals, up to 10 percentage points. However, even with these variations, the pattern of how
MTRs vary with program combinations and over different ranges of earnings, which has been
the main focus of the discussion in this paper, is unchanged.
Summary and Conclusions
A conclusion from this analysis of marginal tax rates facing the low income population
from major tax and transfer programs in the 1997-2007 period is their enormous variation across
families. This point has been made in prior work, but the analysis here emphasizes the
contributions to that variation arising from three sources: variation across different levels of
earnings--from those of very poor families with earnings far below the poverty line up to
families with earnings just above the poverty line—variation across different demographic
groups, and variation across families participating in different numbers and groups of transfer
programs. Concerning the first of these, we find a very strong pattern of relatively low MTRs
for families at very low levels of earnings, but with rates that rise and reach high levels most
often for earnings just above the poverty line. Concerning demographic groups, we find rates to
be the lowest in the first case, and highest in the second case, for families with children. And
concerning the third factor, we find that the majority of low income families either do not
participate in any transfer program or participate in only one. For those families, MTRs are
generally modest at all levels of earnings. But for families participating in two or more
programs, MTRs are higher both at lower earnings levels and at higher earnings levels, and can
approach or exceed 100 percent for earnings just above the poverty line. While most
25
demographic groups do not participate in more than one program, about 20 percent of single
parent families do, and for them these high marginal rates should be a source of concern as well
as for the smaller fraction of families from other demographic groups who also participate in
multiple programs.
This paper is not concerned with policy solutions but it should be noted that simply
lowering some of the high marginal rates to more acceptable levels will both increase
government expenditures as well as raise marginal rates higher up in the earnings distribution.
And if government expenditure is held fixed, lowering rates in one region of the earnings
distribution will require increasing them in some other region. That means that smoothing out
notches, for example, will have no necessary direction of effect on average work incentives. In
any case, however, the right framework for analyzing this problem is the familiar literature on
optimal taxation, which seeks to optimize welfare and not just to minimize aggregate work
disincentives. The classic Mirrlees model showed that a negative income tax structure was
generally optimal and later work (e.g., Saez, ) has shown that an earnings subsidy can be
optimal at low earnings, it is hard to find worked-out examples in this literature where rates in
excess of 100 percent in some ranges of earnings are optimal.
Marginal tax rates at the current time are likely to differ from those we have calculated
for 1997-2007 for two reasons. The less important is that some of the increases in benefit
generosity enacted by the federal government in the Great Recession have not been phased out
but have been made essentially permanent. This includes some alterations in the EITC and CTC
and some changes in asset test rules in SNAP. The more important is the introduction of the
Affordable Care Act, whose implications for Medicaid have been extensively discussed
elsewhere. For those states adopting the ACA’s Medicaid expansions, the legislation will tend to
26
increase MTRs for some families and decrease them for others. The legislation mandated, for
example, income eligibility thresholds for adults which are considerably above those that many
states had previously had, which will lower MTRs in lower earnings ranges and increase them in
higher ranges. However, the cliff will be mostly eliminated to the extent that the exchanges
provide coverage smoothly just above the Medicaid eligibility limits, although increased MTRs
as those subsidies are phased out will also be generated (states which do not adopt the Medicaid
expansions in the ACA will provide lower MTRs to work up to the exchange level). But for
groups for whom the ACA will extend Medicaid coverage for the first time, such as childless
families in many states, the beneficial effect of health insurance coverage will necessarily be
accompanied by a new positive MTR at the point of benefit cutoff. On the other hand, childless
families, as demonstrated in this paper, face modest MTRs from the welfare system at the current
time because of their low rates of participation in most transfer programs. These issues will
undoubtedly receive much attention in future work on marginal tax rates in the low income
population.
Analytically, the major limitation of the present analysis is its static nature. All transfer
programs have asset tests and we have calculated marginal tax rates for families whose assets put
them below levels specified by the programs to establish eligibility. In a dynamic framework,
asset tests also impose a tax on saving and asset accumulation. Drawing the implications of asset
tests for marginal tax rates in a dynamic framework would be a suitable topic for further work.
27
References
Barrett, A. and A. Poikolainen. 2006. Food Stamp Program Participation Rates: 2004. Alexandria, VA: U.S. Food and Nutrition Service, Department of Agriculture. Finkelstein, A.; N. Hendren; and E.F.P. Luttmer. 2015. “The Value of Medicaid: Interpreting Results from the Oregon Health Insurance Experiment.” Working Paper 21308. Cambridge, MA: National Bureau of Economic Research. Maag, E.; C. E. Steuerle; R. Chakravarti; and C. Quakenbush. 2012. “How Marginal Tax Rates Affect Families at Various Levels of Poverty.” National Tax Journal 65 (4): 759-782. Moffitt, R., ed. 2016. Economics of Means-Tested Transfer Programs in the U.S. University of Chicago Press. Saez, E. 2002. “Optimal Income Transfer Programs: Intensive Versus Extensive Labor Supply Responses.” Quarterly Journal of Economics 117 (August): 1039-1073. Short, K. 2015. “The Supplemental Poverty Measure: 2014.” Current Population Report P60-254. Washington: Bureau of the Census. Steuerle, C. E. 2015. “Marginal Tax Rates and 21st Century Social Welfare Reform.” Statement to the Subcommittee on Human Resources, Committee on Ways and Means and Subcommittee on Nutrition, Committee on Agriculture. U.S. Congressional Budget Office. 2012. Effective Marginal Tax Rates for Low- and Moderate-Income Workers. Washington: U.S. Congress. U.S. Congressional Budget Office. 2015. Effective Marginal Tax Rates for Low- and Moderate-Income Workers in 2016. Washington: U.S. Congress.
28
Table 1: Percent of Non-Disabled, Non-Elderly Families with Private Income below 50 Percent of the Poverty Line Receiving Different Combinations of Four Welfare Programs, 2004
All Two Parent Families
One Parent Families
Childless, Married Families
Childless, Non-
married Families
No Programs 57.90 39.19 19.83 81.24 76.42 TANF only 0.01 0.00 0.00 0.00 0.02 SNAP only 3.81 1.96 1.77 4.14 5.15
Housing only 2.00 0.48 0.91 1.26 3.15 Medicaid only 12.27 23.82 20.46 6.15 6.80
SNAP & TANF only
0.06 0.20 0.00 0.00 0.06
SNAP & Housing only
0.79 1.34 0.31 0.59 0.93
SNAP & Medicaid only
9.40 18.76 20.10 2.08 3.41
Medicaid & TANF only
0.64 0.71 0.87 1.45 0.38
Medicaid & Housing only
1.67 1.66 3.47 0.90 0.93
TANF & Housing only
0.02 0.00 0.00 0.00 0.03
SNAP, TANF & Housing only
0.01 0.00 0.00 0.12 0.00
SNAP, TANF & Medicaid only
3.84 6.76 9.06 0.91 1.18
SNAP, TANF, Medicaid &
Housing
3.14 2.69 9.88 0.22 0.49
Source: Tabulations from the 2004 Survey of Income and Program Participation by Gwyn Pauley in joint work with Robert Moffitt.
29
Figure 1: Marginal Tax Rates with No Program Participation, no Earned Income Tax Credit, and no Child Tax Credit for Single Parents with Two Children
Note: Solid columns refer to 1997 and cross-hatched columns refer to 2007. Relative Earnings
refers to earnings relative to the Federal Poverty Line.
30
Figure 2: Marginal Tax Rates with only Earned Income Tax Credit and Child Tax Credit Participation for Single Parents with Two Children
Note: Solid columns refer to 1997 and cross-hatched columns refer to 2007. Relative Earnings
refers to earnings relative to the Federal Poverty Line.
31
Figure 3: Marginal Tax Rates with only Medicaid Participation for Single Parents with Two Children
Note: Solid columns refer to 1997 and cross-hatched columns refer to 2007. Relative Earnings
refers to earnings relative to the Federal Poverty Line.
32
Figure 4: Marginal Tax Rates with only Supplemental Nutrition Assistance Program Participation for Single Parents with Two Children
Note: Solid columns refer to 1997 and cross-hatched columns refer to 2007. Relative Earnings
refers to earnings relative to the Federal Poverty Line.
33
Figure 5: Marginal Tax Rates with only Subsidized Housing Participation for Single Parents with Two Children
Note: Solid columns refer to 1997 and cross-hatched columns refer to 2007. Relative Earnings
refers to earnings relative to the Federal Poverty Line.
34
Figure 6: Marginal Tax Rates with only Medicaid and Supplemental Nutrition Assistance Program Participation for Single Parents with Two Children
Note: Solid columns refer to 1997 and cross-hatched columns refer to 2007. Relative Earnings
refers to earnings relative to the Federal Poverty Line.
35
Figure 7: Marginal Tax Rates with only Medicaid and Subsidized Housing Participation for Single Parents with Two Children
Note: Solid columns refer to 1997 and cross-hatched columns refer to 2007. Relative Earnings
refers to earnings relative to the Federal Poverty Line.
36
Figure 8: Marginal Tax Rates with only Medicaid, Supplemental Nutrition Assistance Program, and Temporary Assistance to Needy Families Participation for Single Parents with Two Children
Note: Solid columns refer to 1997 and cross-hatched columns refer to 2007. Relative Earnings
refers to earnings relative to the Federal Poverty Line.
37
Figure 9: Marginal Tax Rates with Medicaid, Supplemental Nutrition Assistance Program, Temporary Assistance to Needy Families, and Subsidized Housing Participation for Single
Parents with Two Children
Note: Solid columns refer to 1997 and cross-hatched columns refer to 2007. Relative Earnings
refers to earnings relative to the Federal Poverty Line.
38
Table 2: The Distribution of the Marginal Tax Rates for Single Parents with Two Children in 2007


![Weber’s Rare & Well-Done Books Various & Historic · Barlow and Stoop], historiated initials, head and tail pieces; pl. facing p. 59 with marginal tear; vol. II, pp. 111-2 + facing](https://static.documents.pub/doc/80x56/5fd856db4206c76278114f4a/weberas-rare-well-done-books-various-historic-barlow-and-stoop-historiated.jpg)


