17
Trends in in DHS Forecast Programs Prepared by Minnesota Department of Human Services Office of Management and Budget April 2008
| Date post: | 18-Dec-2015 |
| Category: |
Documents |
| Upload: | theodore-hamilton |
| View: | 217 times |
| Download: | 1 times |

Trends inin DHS Forecast Programs
Prepared by Minnesota Department of Human Services
Office of Management and BudgetApril 2008

What is a forecast program?
• A program for which the state has a legal obligation to provide a benefit or service to an eligible person.
• Estimates of these current law obligations are included in the state’s forecast projections and reflected in fund balance statements.
• Through the budget process, appropriations are adjusted to ensure that adequate resources are available to pay for “forecast” programs.

Data source: DHS February 2008 Forecast and Department of Finance February 2008 Fund Balance Analysis
DHS’ General Fund-financed Forecast Programs in FY 2008-09
($ reflect state share and are in millions) FY 2008 FY 2009 FY 2008-09
Health Care Programs
Long Term Care Facilities $505 $511 $1,016
Long Term Care Waivers $927 $1,049 $1,976
Elderly and Disabled Basic Care $993 $1,107 $2,100
Families with Children Basic Care $753 $846 $1,599
General Assistance Medical Care $258 $287 $545
Chemical Dependency Entitlement $89 $102 $191
Economic Assistance and Housing Programs
Minnesota Family Investment Program Cash/Food $87 $74 $161
MFIP/TY Child Care Assistance $49 $61 $110
General Assistance $40 $44 $84
Group Residential Housing $84 $97 $181
Minnesota Supplemental Aid $31 $31 $62
Total, General Fund-financed forecast programs $3,816 $4,209 $8,025
Total, DHS General Fund Budget $4,622 $4,993 $9,615
Percent of DHS GF Budget Composed of Forecast Programs 82.57% 84.30% 83.47%

Long Term Care: Chronic health care services, long-term care in residential
settings, at-home care and social services for the elderly and people with disabilities.
Data Source: DHS February 2008 Forecast
Long Term Care: FY 2008-09 vs. FY 2010-11($ in millions; state share only)
$0
$500
$1,000
$1,500
$2,000
$2,500
$3,000
$ in M
illions
FY 2008-09
FY 2010-FY 11

Data source: DHS February 2008 Forecast
Long Term Care Average Monthly Recipients
-
10,000
20,000
30,000
40,000
50,000
60,000
70,000
80,000
Facilities
Waivers & Home Care

Data source: DHS February 2008 Forecast
Long Term Care Waiver Monthly Average Recipients
0
2,500
5,000
7,500
10,000
12,500
15,000
17,500
20,000
22,500
25,000
Mon
thly
Ave
rage
Wai
ver R
ecip
ient
s
DevelopmentalDisabilitiesElderly
CADI
CAC
TBI

Data source: DHS February 2008 Forecast
Average Monthly Costs in Long Term Care Facilities and Waivers & Home Care
$0
$500
$1,000
$1,500
$2,000
$2,500
$3,000
$3,500
$4,000
$4,500
$5,000
Ave
rage
Mon
thly
Cos
t
Facilities
Waivers & Home Care

Data source: DHS February 2008 Forecast
Long Term Care Waiver Monthly Cost
0
1,000
2,000
3,000
4,000
5,000
6,000
7,000
8,000
Mon
thly
Cos
t
DevelopmentalDisabilitiesElderly
CADI
CAC
TBI
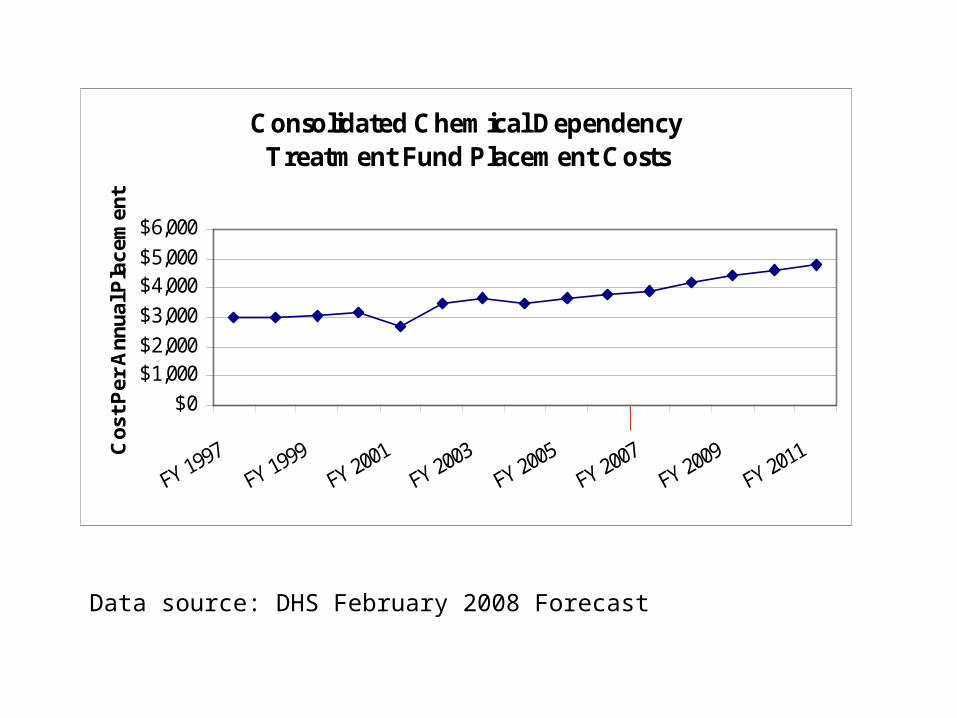
Consolidated Chemical Dependency Treatment Fund Placement Costs
$0$1,000$2,000$3,000$4,000$5,000$6,000
Cos
t Pe
r A
nnu
al P
lac
emen
t
Data source: DHS February 2008 Forecast

Data Source: DHS February 2008 Forecast
Basic Health Care: Primary and acute care health services for low-income
adults, families with children, elderly and people with disabilities.
Basic Health Care Costs FY 2008-09 vs. FY 2010-11($ in Millions; State Share Only)
0
500
1,000
1,500
2,000
2,500
3,000
MA Families MA Elderly and
Disabled
GAMC MinnesotaCare
$ in M
illions
FY 2008-09
FY 2010-11

Data source: DHS February 2008 forecast
Basic Health Care Average Monthly Enrollment
-
50,000
100,000
150,000
200,000
250,000
300,000
350,000
400,000
450,000
Ave
rage
Mon
thly
Elig
ible
s
MA Families
MA Elderly andDisabledGAMC
MinnesotaCare

Data source: DHS February 2008 Forecast
Basic Health Care Programs Average Monthly Payments
$0
$200
$400
$600
$800
$1,000
$1,200
$1,400
Ave
rage
Mon
thly
Pay
men
ts
MA Families
MA Elderly andDisabledGAMC
MNCare

Data source: DHS February 2008 Forecast
Children and Family Services Forecast Programs FY 2008-09 vs. FY 2010-11 (all funds; $ in millions)
$0
$100
$200
$300
$400
$500
$600
$700
MFIP Cash/Food MFIP/TY Child
Care
General
Assistance
Group
Residential
Housing
Minnesota
Supplemental
Aid
Dollar
s in
Millions
FY 2008-09
FY 2010-11

Data source: DHS February 2008 Forecast
Minnesota Family Investment Program Cash/Food and MFIP/Transition Year Child Care
0
10,000
20,000
30,000
40,000
50,000
Aver
age
Mon
thly
Cas
es
MFIP
CCAP

Data source: DHS February 2008 Forecast
Minnesota Family Investment Program and MFIP/Transition Year Child Care
$0
$200
$400
$600
$800
$1,000
$1,200
Mon
thly
Ave
rage
Pay
men
t
MFIPChild Care

Data source: DHS February 2008 Forecast
General Assistance, Minnesota Supplemental Aid and
Group Residential Housing Monthly Average
Enrollment
0
10,000
20,000
30,000
40,000
Mon
thly
Ave
rage
Rec
ipie
nts
MSA
GRH
GA

Data source: DHS February 2008 Forecast
General Assistance, Minnesota Supplemental Aid and Group Residential Housing Monthly Average Payment
$0
$100
$200
$300
$400
$500
$600
Month
ly A
vera
ge P
aym
ent
GA
MSA
GRH


![MFSRC Ask DHS-SIR Presentation.pptx [Read-Only] DHS-SIR.pdf · 9/20/2018 1 2018 ANNUAL CONFERENCE MINNESOTA FAMILY SUPPORT & RECOVERY COUNCIL Ask DHS-SIR Online Resources for Child](https://static.documents.pub/doc/80x56/5ed71e4bc30795314c173b39/mfsrc-ask-dhs-sir-read-only-dhs-sirpdf-9202018-1-2018-annual-conference-minnesota.jpg)


