Copyright (c) 2014 CompTIA Properties, LLC. All Rights Reserved. | CompTIA.org Carolyn April, Sr. Director, Industry Analysis CompTIA June 2016 Trends in Managed Services: The Art & Science of the MSP Business Carolyn April Sr. Director, Industry Analysis CompTIA
Transcript
Copyright (c) 2014 CompTIA Properties, LLC. All Rights Reserved. | CompTIA.org
Carolyn April, Sr. Director, Industry Analysis
CompTIA
June 2016
Trends in Managed Services: The Art & Science of the MSP Business
Carolyn AprilSr. Director, Industry AnalysisCompTIA
On Tap Today
Why Managed Services?
Internal Operations
Strategic Planning
Wrap Up & Q&A
2
65%
33%
2% By the numbers…
• 77% of the smallest
channel firms (2-9 employees) described themselves as “skilled experts” at managed services, compared to roughly 6 in 10 respondents from larger firms.
Self-Assessment of Managed Services Capabilities Today
Early On/Too Soon to Tell
Skilled Expert
Competent/Getting Better
Source: CompTIA’s Trends in Managed Services 2016: Base: n=400 IT channel firms
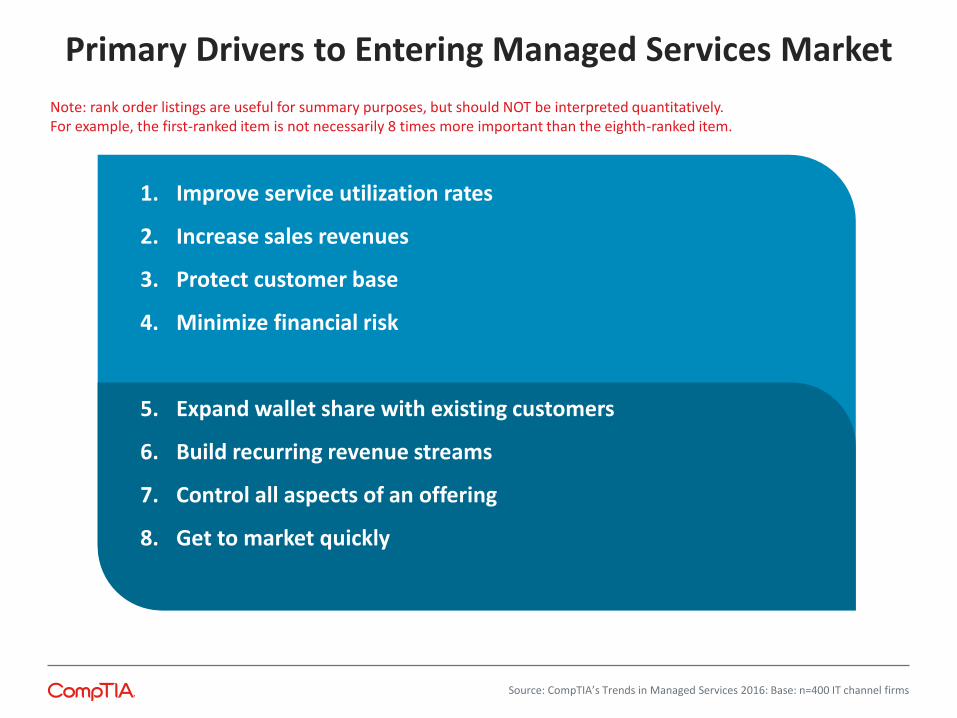
Primary Drivers to Entering Managed Services Market
1. Improve service utilization rates
2. Increase sales revenues
3. Protect customer base
4. Minimize financial risk
5. Expand wallet share with existing customers
6. Build recurring revenue streams
7. Control all aspects of an offering
8. Get to market quickly
Note: rank order listings are useful for summary purposes, but should NOT be interpreted quantitatively. For example, the first-ranked item is not necessarily 8 times more important than the eighth-ranked item.
Source: CompTIA’s Trends in Managed Services 2016: Base: n=400 IT channel firms
Channel Business Lines: Which Two Drive Most Revenue?
IT Solutions/Projects
44% rank this LOB as
top revenue generator. 12% rank it No. 2
Managed Services
29% rank this LOB
as top revenue generator. 21%
rank it No. 2
Top LOB by company size:• Small firms: 31% • Medium firms: 25% • Large firms: 34%
Top LOB by company size• Small firms: 31% • Medium firms: 43% • Large firms: 61%
Source: CompTIA’s Trends in Managed Services 2016: Base: n=400 IT channel firms
Copyright (c) 2014 CompTIA Properties, LLC. All Rights Reserved. | CompTIA.org
Expectations for Managed Services Business Next Two Years
4%
36%
61%
1%
52%
47%
4%
44%
52%
Flat growth: Remains at currentlevels
Medium growth: Comprisingincreasing part of revenue (50% or
more)
High growth: Comprising majority ofrevenue (75% or more)
Large
Medium
Small
Source: CompTIA’s Trends in Managed Services 2016: Base: n=400 IT channel firms
Copyright (c) 2014 CompTIA Properties, LLC. All Rights Reserved. | CompTIA.org
Small firms Medium firms
Large firms
Product sales( hardware, software,peripherals)
31% 20% 36%
One-off project-centric work 39% 39% 14%
Pure consulting services 18% 27% 26%
Other (e.g. referrals, extended warranties, etc.
1% 3% 3%
Other areas remain status quo 3% 5% 8%
All of the above 7% 5% 13%
Which Revenue Lines Decline as Managed Services Grows?
Source: CompTIA’s Trends in Managed Services 2016: Base: n=400 IT channel firms
Managed Services’ Portfolios Cut Wide Swath
Managed Services Currently Offer
Plan to Offer
Security (firewall management)
74% 24%
Server management 74% 24%
Storage 72% 27%
Network management/monitor
71% 28%
Desktop management 70% 28%
Business continuity/DR 70% 28%
Backup as a service 69% 28%
Software management (patch) 69% 29%
Database management 68% 30%
Help desk 67% 31%
Email 67% 29%
Virtual desktop 66% 30%
Managed print services 65% 32%
Source: CompTIA’s Trends in Managed Services 2016: Base: n=400 IT channel firms
28%
59%
3%
10%
Increase overall
Staysame
Mix bagDecrease overall
Services mix in the next year will…
MSP Approach to Offering Cloud-based Services
54%
44%
3%
Strategic part of MSPcatalog
Supported at customers'request
Not part of MSP catalog
Source: CompTIA’s Trends in Managed Services 2016: Base: n=400 IT channel firms
Internal Operations
Copyright (c) 2014 CompTIA Properties, LLC. All Rights Reserved. | CompTIA.org
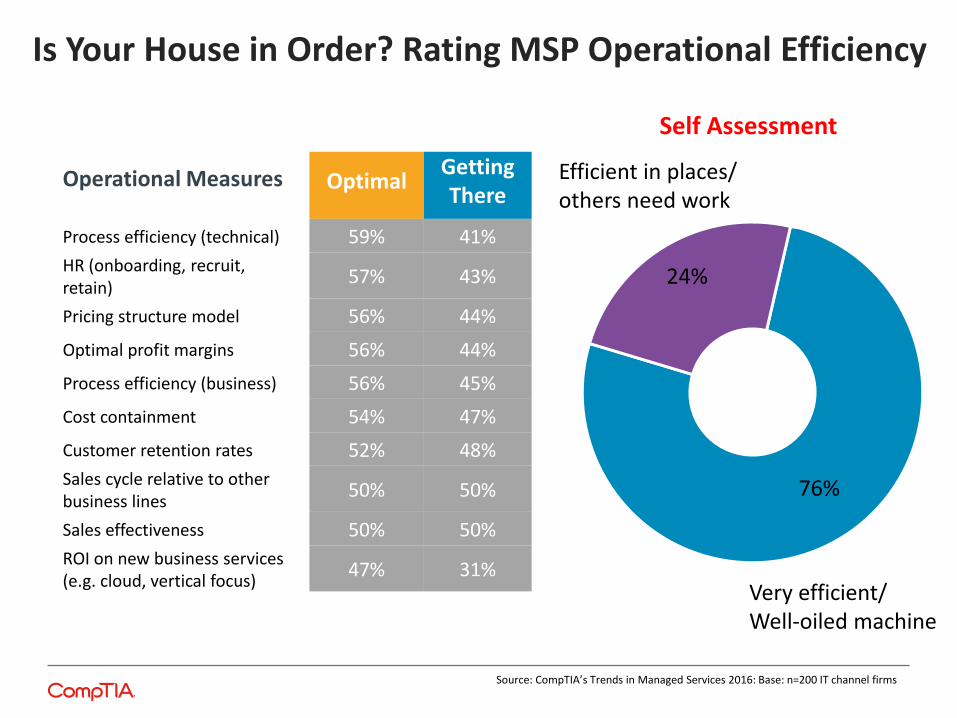
Is Your House in Order? Rating MSP Operational Efficiency
Operational Measures OptimalGetting There
Process efficiency (technical) 59% 41%
HR (onboarding, recruit, retain)
57% 43%
Pricing structure model 56% 44%
Optimal profit margins 56% 44%
Process efficiency (business) 56% 45%
Cost containment 54% 47%
Customer retention rates 52% 48%
Sales cycle relative to other business lines
50% 50%
Sales effectiveness 50% 50%
ROI on new business services (e.g. cloud, vertical focus)
47% 31%
Source: CompTIA’s Trends in Managed Services 2016: Base: n=200 IT channel firms
76%
24%
Efficient in places/others need work
Very efficient/Well-oiled machine
Self Assessment
Copyright (c) 2014 CompTIA Properties, LLC. All Rights Reserved. | CompTIA.org
NoChallenge
Minor Challenge
MajorChallenge
Cost of retraining (technical) 11% 39% 45%
Restructuring sales comp models 11% 47% 42%
Cost of retraining (business) 17% 43% 40%
Automating IT functions 14% 46% 40%
Setting pricing structure 15% 46% 40%
Recruiting/hiring right talent 13% 48% 38%
Operational Challenges in Adopting Managed Services
Source: CompTIA’s Trends in Managed Services 2016: Base: n=200 IT channel firms
Copyright (c) 2014 CompTIA Properties, LLC. All Rights Reserved. | CompTIA.org
24%26% 23%
13% 10%
Per device Per user Based on userconsumption
Fixed, recurringfee
Fixed, recurringfee for standard
services
MSP Pricing: The Ongoing Enigma
Source: CompTIA’s Trends in Managed Services 2016: Base: n=200 IT channel firms
Copyright (c) 2014 CompTIA Properties, LLC. All Rights Reserved. | CompTIA.org
Employee Retention Remains a Challenge for MSPs
17%
47%
37%
8%
51%
41%
23%
48%
29%
Not a challenge
Minor challenge
Major challenge
Large MSPs
Medium MSPs
Small MSPs
Source: CompTIA’s Trends in Managed Services 2016: Base: n=200 IT channel firms
Leaving the Fold?
80% of MSP
respondents report that at least one of their staff technicians resigned last year to join an end-user organization’s IT department.
Copyright (c) 2014 CompTIA Properties, LLC. All Rights Reserved. | CompTIA.org
Initial Steps Taken to Launch an MSP Practice
27%
38%
48%
49%
49%
53%
56%
63%
Invested in commercial softwareapplications
Retrained technical staff
Obtained credit/access to capital
Restructured sales comp model
Contracted with third-party NOC
Retrained existing sales reps
Invested in building a NOC
Hired new sales reps with MSP experience
Source: CompTIA’s Trends in Managed Services 2016: Base: n=200 IT channel firms
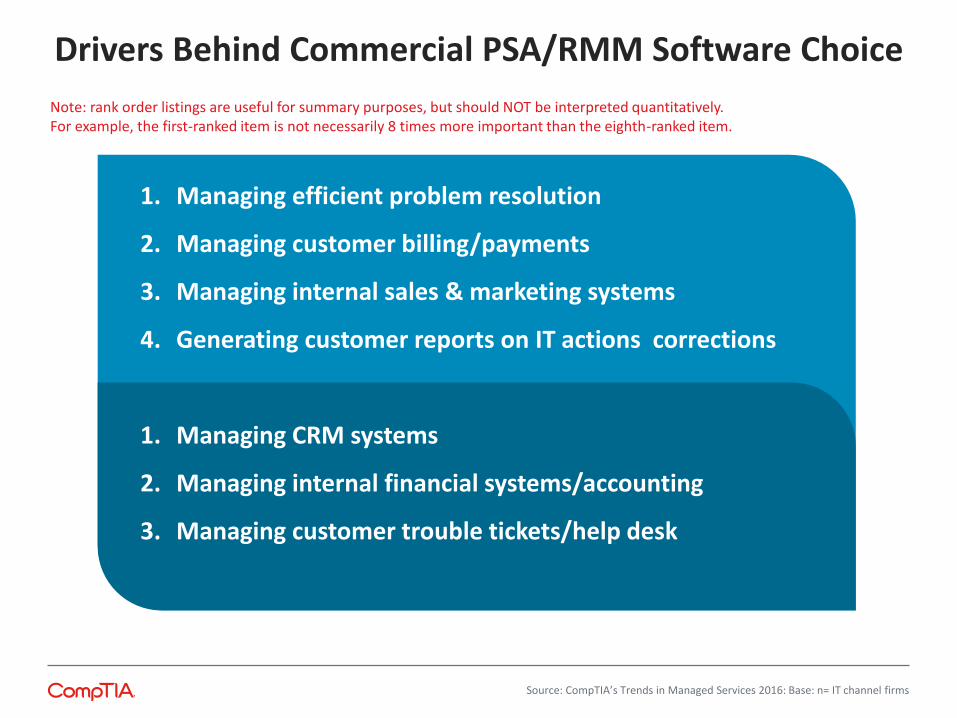
Drivers Behind Commercial PSA/RMM Software Choice
1. Managing efficient problem resolution
2. Managing customer billing/payments
3. Managing internal sales & marketing systems
4. Generating customer reports on IT actions corrections
1. Managing CRM systems
2. Managing internal financial systems/accounting
3. Managing customer trouble tickets/help desk
Note: rank order listings are useful for summary purposes, but should NOT be interpreted quantitatively. For example, the first-ranked item is not necessarily 8 times more important than the eighth-ranked item.
Source: CompTIA’s Trends in Managed Services 2016: Base: n= IT channel firms