report no. 2/11 I Trends in oil discharged with aqueous effluents from oil refineries in Europe 2005 and 2008 survey data Prepared by: P. Baldoni-Andrey A. Girling (Consultant) E. Garcia Biosca K. Struijk F. de Borman R. Smith I. Kitow J. Negroni G. Neal K. den Haan (Technical Coordinator) Reproduction permitted with due acknowledgement CONCAWE Brussels March 2011
Transcript
report no. 2/11
I
Trends in oil discharged with aqueous effluents from oil refineries in Europe
2005 and 2008 survey data
Prepared by: P. Baldoni-Andrey A. Girling (Consultant) E. Garcia Biosca K. Struijk F. de Borman R. Smith I. Kitow J. Negroni G. Neal K. den Haan (Technical Coordinator) Reproduction permitted with due acknowledgement
CONCAWE Brussels March 2011
report no. 2/11
II
ABSTRACT
This report summarises data gathered by CONCAWE in surveys of effluent water quantity, oil content and treatment processes for refinery locations situated in the EU-27 countries and those in Norway and Switzerland for the years 2005 and 2008. Data obtained in previous surveys are included for comparison.
The number of refinery locations reporting in 2008 has increased to 125. The results of the surveys show that the trend for lower volumes of effluent discharge relative to refinery capacity and throughput has continued. Changes in the total amounts of discharged oil, ammonia, total nitrogen (TN), phenols, BOD, COD and TOC are related to the increase in the number of refineries reporting in these years. The associated slight increases in the ratios of oil, TN, phenol, BOD and COD discharged relative to refining capacity and/or throughput may reflect the inclusion of additional refineries in countries that joined the EU in that period and whose performance may not have been at the same level as those previously surveyed.
The results show that 89% of the refineries surveyed in 2005 had at least one stage of biological treatment in their wastewater treatment facilities. For 2008, this number rose to 94% for the reporting refineries.
A different system of refinery complexity classification has been adopted for the 2005 and 2008 surveys. The Nelson Complexity Index (NCI) is an industry standard measure that takes account of each piece of refinery equipment on a refinery site. The 2005 and 2008 NCI scores show that the trend towards more complex refineries that was evident in the data set for the years 1969 to 2000 continues.
KEYWORDS
Ammonia, BOD, COD, TOC, effluent oil in water, TOD, phenols, refinery, treatment, waste water
INTERNET
This report is available as an Adobe pdf file on the CONCAWE website (www.concawe.org).
NOTE Considerable efforts have been made to assure the accuracy and reliability of the information contained in this publication. However, neither CONCAWE nor any company participating in CONCAWE can accept liability for any loss, damage or injury whatsoever resulting from the use of this information. This report does not necessarily represent the views of any company participating in CONCAWE.
This report summarises information on European oil refineries' effluent water quantity, quality and treatment processes obtained in a survey for the year 2005. The survey area was the EU-27 countries and those in Norway and Switzerland. Data are also reported for oil-in-water concentrations and loads for the year 2008.
The data have been compared with those obtained in previous CONCAWE surveys conducted since 1969. The main conclusions drawn from the survey results are as follows:
In 2005, 96 refinery locations reported compared to 84 in 2000. The throughput of the reporting refineries was 690 million tonnes compared to 524 million tonnes in 2000. In 2008, 125 refinery locations reported a throughput of 745 million tonnes.
For the 2005 and 2008 surveys a different system of classification has been adopted for refineries on the basis of their complexity. The Nelson Complexity Index (NCI) is an industry standard measure that takes account of each piece of refinery equipment on a refinery site. A refinery’s NCI is obtained by summing NCI values for each piece of equipment on the refinery site. For this report the resulting refineries have been assigned to one of six classes based on their summed scores. The 2005 and 2008 NCI scores show a continuation of the trend towards more complex refineries that was evident in the data set for the years 1969 to 2000.
The 2005 survey used slightly modified categories to describe waste water treatment systems that have been utilised by the refineries. The surveys that were conducted between 1969 and 2000 showed a trend towards the adoption of more complex effluent treatment systems in existing refineries. Between 2000 and 2005 the percentage (89%) of refineries reported using biological treatment as part of their waste water treatment system remained similar. For 2008, this value rose to 94% and 14 refineries reported that their effluents were given biological treatment in external multi-user waste water treatment facilities, most commonly after partial on-site treatment.
The reported discharge of effluents decreased from a figure of 2,543 million tonnes in 2000 to 790 million tonnes in 2005. This is a very significant reduction – in the order of 69% - and it is attributed to a change in the questionnaire that explicitly asked for the treated refinery effluent streams. Hence, the 2005 effluent data only consider the treated effluents and does no longer include once through cooling water from closed systems. Possibly a more meaningful indicator is the volume of effluent per tonne of capacity or throughput. These were 1.1 and 1.2 tonnes effluent/tonne crude, respectively in 2005 representing significant reductions compared with previous years.
The 2005 survey returns show that a wide variety of analytical methods are still being used to quantify the hydrocarbon content (oil-in-water) of refinery effluents. Although these different analytical methods can lead to large differences in the observed oil emissions, it remains very informative to follow the trend of the overall European emissions over the years.
report no. 2/11
V
Compared with the 2000 data, the more recent data show a slight increase in the amount of oil discharge in 2005 and a further decrease in 2008. The 2005 increase in the total amounts of discharged oil appears to be related to the increase in the number of refineries reporting. In 2008, these relative discharge values decreased below the 2000 values.
The total tonnages of ammonia, total nitrogen (TN) and phenols discharged in 2005 are higher than in 2000. This can be attributed in part to the higher number of refineries covered by the 2005 survey. However, there is also an increase in the amount of total N and phenol released per tonne of throughput.
The total quantities of Biological Oxygen Demand (BOD), Chemical Oxygen Demand (COD) and Total Organic Carbon (TOC) released by the refineries surveyed for 2005 are significantly higher than for 2000. Although the increase can largely be attributed to the increase in the number of refineries covered in the more recent survey, there were also increases in the amounts of BOD and COD discharged relative to the throughput of the refineries.
report no. 2/11
VI
report no. 2/11
1
1. INTRODUCTION
CONCAWE has obtained data on oil refinery effluent water quantity, quality and treatment processes for 2005 from replies to questionnaires sent to all CONCAWE’s Membership refineries in the EU-27 countries and those in Norway and Switzerland in 2006. The questionnaire was returned by 96 refineries representing over 90% of the refining capacity located in the survey area in that year. Throughout the report the number of refineries mentioned is the number of unique locations with crude oil refining activities, including speciality and bitumen plants, having independent discharges into a receiving environment or transfer their discharges to an external and often commercial Waste Water Treatment Plant (WWTP) for final treatment.
Additional data are also presented for oil-in-water concentrations and loads for the year 2008 covering 125 sites
1 and 100% of the refinery capacity of the CONCAWE
members. These data were collected in support of the CONCAWE REACH activities that focused on product related refinery discharges, therefore, no data on effluent discharges of analytes other than oil-in-water were requested in this survey.
This report shows the continued development of the refining industry in Europe in terms of refinery type, waste water treatment systems, and the amounts of wastewater and associated oil and other selected effluent constituents that are discharged. Wherever possible, relevant data have been compared with those obtained from previous CONCAWE surveys conducted in 1969 [1], 1974 [2], 1978 [3], 1981 [4], 1984 [5], 1987 [6], 1990 [7], 1993 [8], 1997 [9] and 2000 [10].
The increase in the number of refineries reporting for 2005 (96) compared with 2000 (84) reflects the way the industry has been reorganised following a number of mergers and refinery closures and the inclusion of additional existing refineries as a result of new countries joining the EU.
The number of refineries in this survey reporting on any specific parameter varies. Throughout this report calculations have therefore been based on the actual throughputs of only those refineries reporting the relevant data. Consequently, the throughputs used in the calculations may differ from those given in Table 1 below. It is also the case that some refineries have reported data for more than one effluent discharge from the same refinery. The number of data sets for a given parameter does therefore not necessarily correspond with the number of refineries.
Unlike the years up to 1997, the surveys were not carried out in conjunction with the OSPAR Commission for the Protection of the Environment of the North East Atlantic (OSPAR) but by CONCAWE alone. OSPAR have concluded that because of the reductions in discharges from refineries, they had no further requirement for regular surveys. It is obvious that these OSPAR surveys are replaced by the European Pollutant Release and Transfer Register (E-PRTR) [11]. Therefore, CONCAWE will continue and expand their effluent quality and discharge surveys in 2010 to provide their membership with benchmarks and a platform to compare the refining industry data included into the E-PRTR and other effluent parameters reportable under other legislation like the Water Framework Directive, 2000/60/EC (WFD) [12].
1 The number of sites differs from the EUROPIA 2010 White Paper on EU Refining that reported the
number of 98 mainstream refineries in the EU-27+ that excludes bitumen and speciality plants and reports refineries as management units, even when these comprise of more than one independently operating sites.
report no. 2/11
2
2. REFINERIES REPORTING
A total of 96 refineries responded to the survey for 2005. This figure represents 14% more than the 84 refineries that responded for 2000. Some refineries reported data relating to more than one discharge and consequently the total number of discharges covered by the survey was 113.
The change in the numbers between 2000 and 2005 reflects the way the industry had been reorganised following a number of mergers and refinery closures and the inclusion of additional refineries as a result of new countries joining the EU.
The survey data for 2008 that was performed to support CONCAWE’s REACH activities is based upon responses from 125 refinery locations. These represent 100% of the refining capacity of the CONCAWE Membership and over 99% of the total EU-27+3
2 refining capacity.
2.1. CRUDE OIL REFINING CAPACITY AND THROUGHPUT
The numbers of refineries which have reported refining capacity and throughput data in each year of the survey are given in Table 1.
Table 1 Crude oil refining capacity / throughput
Year of survey
Number of refineries
reporting in each survey
Reported capacity (million tonne/yr)
Reported throughput (million
tonne/yr)
1969 82 400 no data a
1974 112 730 no data a
1978 111 754 540
1981 105 710 440
1984 85 607 422
1987 89 587 449
1990 95 570 511
1993 95 618 557
1997 105 670 627
2000 84 566 524
2005 94 (capacity) 96 (throughput)
730 670
2008 125 840 745
2008 (& 2005)b
96 670 610
2008 (only)c
29 170 135
a) These data were not requested in these surveys b) These data are the 2008 values for those sites that reported in both surveys. c) These data represent the 2008 sites that did not report in 2005.
2 The other three Countries are Croatia, Norway and Switzerland.
report no. 2/11
3
For the 94 refineries that refining reported capacity data for 2005 the total figure was 730 million tonnes/yr. This represents ca. 85% of the total EU refining capacity as calculated from the BP Statistical Review of World Energy [13] after correcting for the different area of coverage. The total reported throughput, crude and other feeds, for the 96 refineries that provide information for the same period was 670 million tonnes.
The comparable figures for 2008 were a refining capacity of 840 million tonnes/yr and throughput of 745 million tonnes for the 125 refinery locations. The reported capacity represents 100 % of the capacity of the CONCAWE Membership in the EU-27+3 and includes the amounts processed in mainstream and speciality refineries.
2.2. REFINERY COMPLEXITY
In previous reports in this series the complexity of refineries has been expressed relative to the following type classes:
Type I: Simple (non-conversion) refinery: composed of crude oil distillation; reforming, treatment of distillate products, including desulphurisation and/or other quality improvement processes (i.e. isomerisation or speciality manufacturing).
Type II: Type I plus catalytic cracking and/or thermal cracking and/or hydrocracking.
Type III: Type II plus steam cracking and/or lubricant production within the refinery fence.
Type IV: Refineries not in above categories, e.g. those producing only bitumen, lubricating oils, etc. which import their feedstocks from other sources.
Table 2 Classification of refineries
Year
Number of refineries reporting
these data
Type I Type II Type III Type IV
No. % No. % No. % No. %
1969 81 34 42 31 38 16 20 - -
1974 110 49 45 40 36 21 19 - -
1978 111 50 45 36 32 25 23 - -
1981 105 38 36 44 42 23 22 - -
1984 85 18 22 47 54 20 24 - -
1987 89 12 13 53 60 19 22 5 5
1990 95 9 9 53 56 22 23 11 12
1993 95 7 7 54 57 22 23 12 13
1997 105 12 11 55 52 25 24 13 12
2000 81 10 12 45 56 17 21 9 11
The data in Table 2 show that the complexity of refineries, expressed according to these type classes, has increased for many years. This increase is associated with the installation of additional conversion units, e.g. thermal crackers, catalytic
report no. 2/11
4
crackers and hydrocrackers, to reduce fuel oil production and to meet the demand for a higher yield of gasoline and/or middle distillates.
The number of simple (Type I) refineries has decreased, either through closures or through upgrading into Type II by installation of conversion facilities. The apparent increase In Type I refineries in 1997 was entirely the result of the number of refineries reporting for the first time. There does not seem to have been a significant change between 1997 and 2000. Type IV refineries have emerged since 1984 - largely as an adaptation of plants which have partially closed.
For the 2005 and 2008 surveys, a different system of classification has been adopted that is assumed to be a more realistic representation of the refinery complexity classification and is based upon the Nelson Complexity Index (NCI) [14] that provides a standard measure of the complexity of a refinery. The NCI assigns a complexity factor to each major piece of refinery equipment based on its complexity and replacement cost in comparison to crude distillation, which is assigned a complexity factor of 1.0. The complexity of each piece of refinery equipment is then calculated by multiplying its complexity factor by its throughput ratio as a percentage of crude distillation capacity. A refinery’s NCI is obtained by summing the complexity values for each piece of equipment, including crude distillation.
For the analysis of the refineries covered by the 2005 survey the NCI values were derived from the Oil and Gas Journal refining capacity and layout listing of December 2004 (Data as of January 1, 2005 [15]). A similar analysis is presented for the refineries surveyed in 2008 based on the Oil and Gas Journal refining capacity and layout listing of December 2009 [16]. No attempt has been made to verify these NCIs with the CONCAWE Member due to changes in ownership and because today’s lay-out may have altered due to changing strategies and major investments that have taken place.
CONCAWE has derived the following six classes of refinery based on NCI:
Class 1: NCI < 4
Class 2: 4 < NCI ≤ 6
Class 3: 6 < NCI ≤ 8
Class 4: 8 < NCI ≤ 10
Class 5: NCI >10
Class 6: Refineries for speciality lubricants and bitumen production.
The 2005 and 2008 NCI classifications for all EU-27+ based CONCAWE Membership refinery locations are shown in Figure 1.
report no. 2/11
5
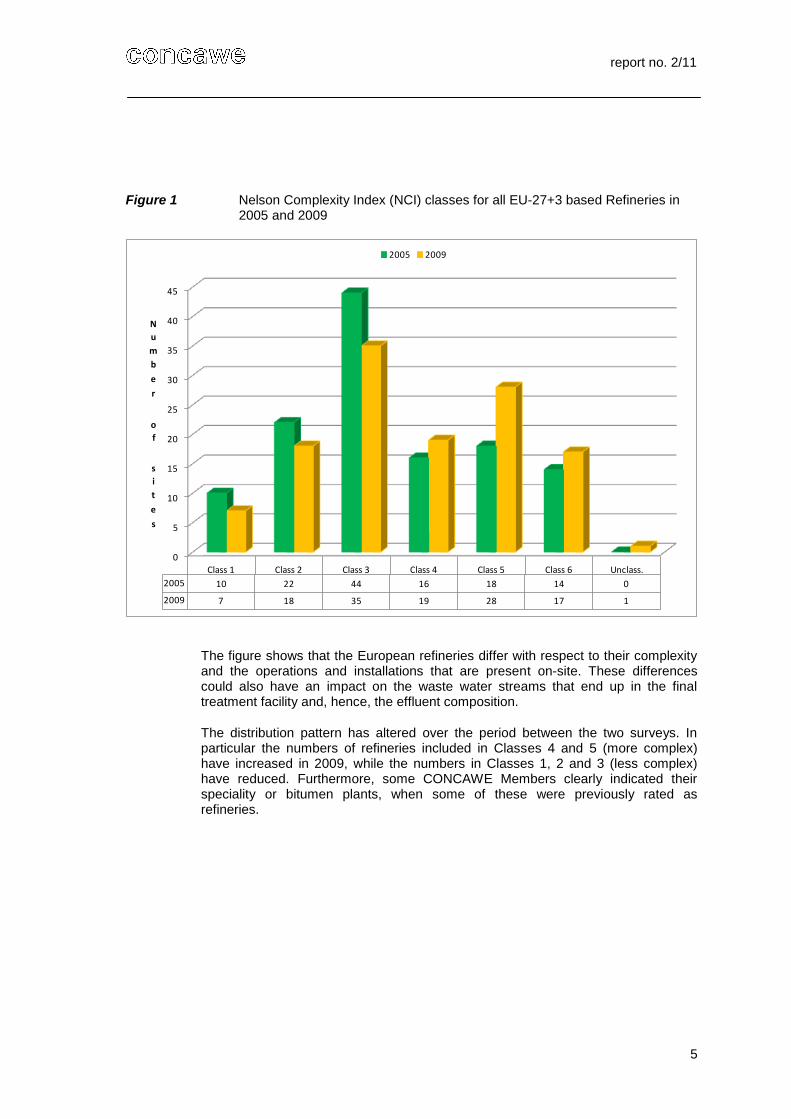
Figure 1 Nelson Complexity Index (NCI) classes for all EU-27+3 based Refineries in 2005 and 2009
0
5
10
15
20
25
30
35
40
45
Class 1 Class 2 Class 3 Class 4 Class 5 Class 6 Unclass.
2005 10 22 44 16 18 14 0
2009 7 18 35 19 28 17 1
N
u
m
b
e
r
o
f
s
i
t
e
s
2005 2009
The figure shows that the European refineries differ with respect to their complexity and the operations and installations that are present on-site. These differences could also have an impact on the waste water streams that end up in the final treatment facility and, hence, the effluent composition.
The distribution pattern has altered over the period between the two surveys. In particular the numbers of refineries included in Classes 4 and 5 (more complex) have increased in 2009, while the numbers in Classes 1, 2 and 3 (less complex) have reduced. Furthermore, some CONCAWE Members clearly indicated their speciality or bitumen plants, when some of these were previously rated as refineries.
report no. 2/11
6
3. WASTE WATER TREATMENT SYSTEMS
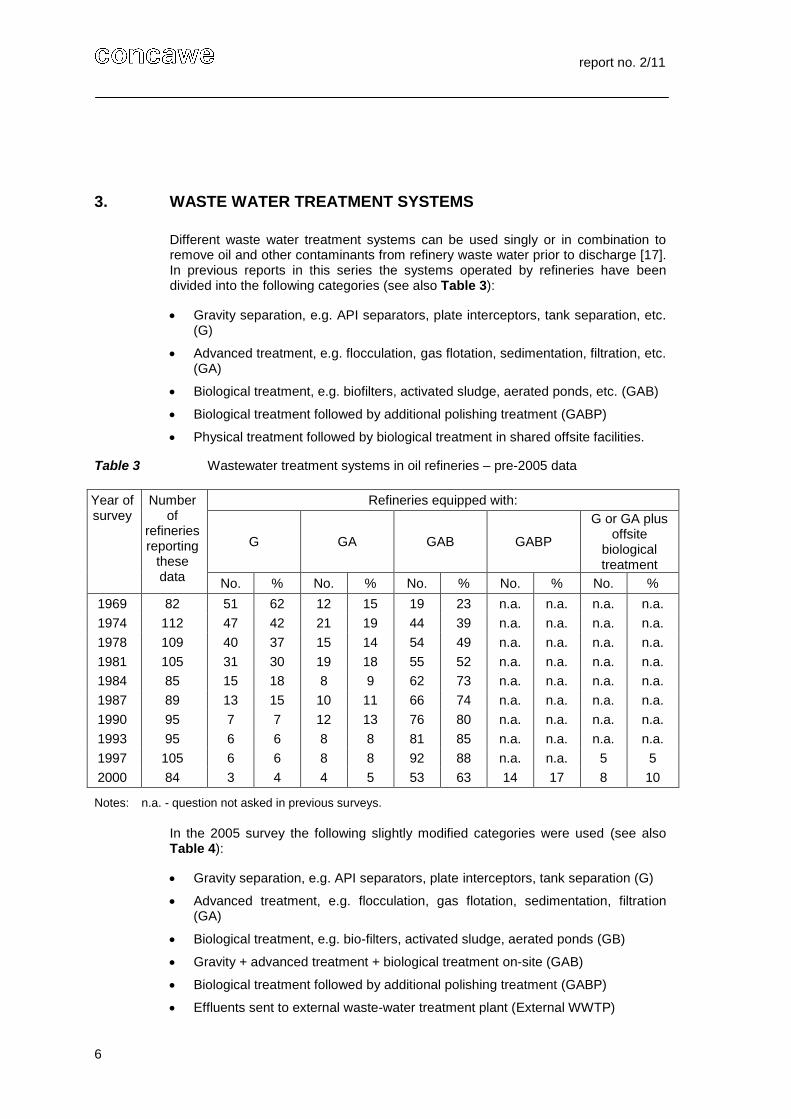
Different waste water treatment systems can be used singly or in combination to remove oil and other contaminants from refinery waste water prior to discharge [17]. In previous reports in this series the systems operated by refineries have been divided into the following categories (see also Table 3):
Gravity separation, e.g. API separators, plate interceptors, tank separation, etc. (G)
Advanced treatment, e.g. flocculation, gas flotation, sedimentation, filtration, etc. (GA)
Biological treatment, e.g. biofilters, activated sludge, aerated ponds, etc. (GAB)
Biological treatment followed by additional polishing treatment (GABP)
Physical treatment followed by biological treatment in shared offsite facilities.
Table 3 Wastewater treatment systems in oil refineries – pre-2005 data
Year of survey
Number of
refineries reporting
these data
Refineries equipped with:
G GA GAB GABP
G or GA plus offsite
biological treatment
No. % No. % No. % No. % No. %
1969 82 51 62 12 15 19 23 n.a. n.a. n.a. n.a.
1974 112 47 42 21 19 44 39 n.a. n.a. n.a. n.a.
1978 109 40 37 15 14 54 49 n.a. n.a. n.a. n.a.
1981 105 31 30 19 18 55 52 n.a. n.a. n.a. n.a.
1984 85 15 18 8 9 62 73 n.a. n.a. n.a. n.a.
1987 89 13 15 10 11 66 74 n.a. n.a. n.a. n.a.
1990 95 7 7 12 13 76 80 n.a. n.a. n.a. n.a.
1993 95 6 6 8 8 81 85 n.a. n.a. n.a. n.a.
1997 105 6 6 8 8 92 88 n.a. n.a. 5 5
2000 84 3 4 4 5 53 63 14 17 8 10
Notes: n.a. - question not asked in previous surveys.
In the 2005 survey the following slightly modified categories were used (see also Table 4):
Gravity separation, e.g. API separators, plate interceptors, tank separation (G)
Advanced treatment, e.g. flocculation, gas flotation, sedimentation, filtration (GA)
Biological treatment, e.g. bio-filters, activated sludge, aerated ponds (GB)
Biological treatment followed by additional polishing treatment (GABP)
Effluents sent to external waste-water treatment plant (External WWTP)
report no. 2/11
7
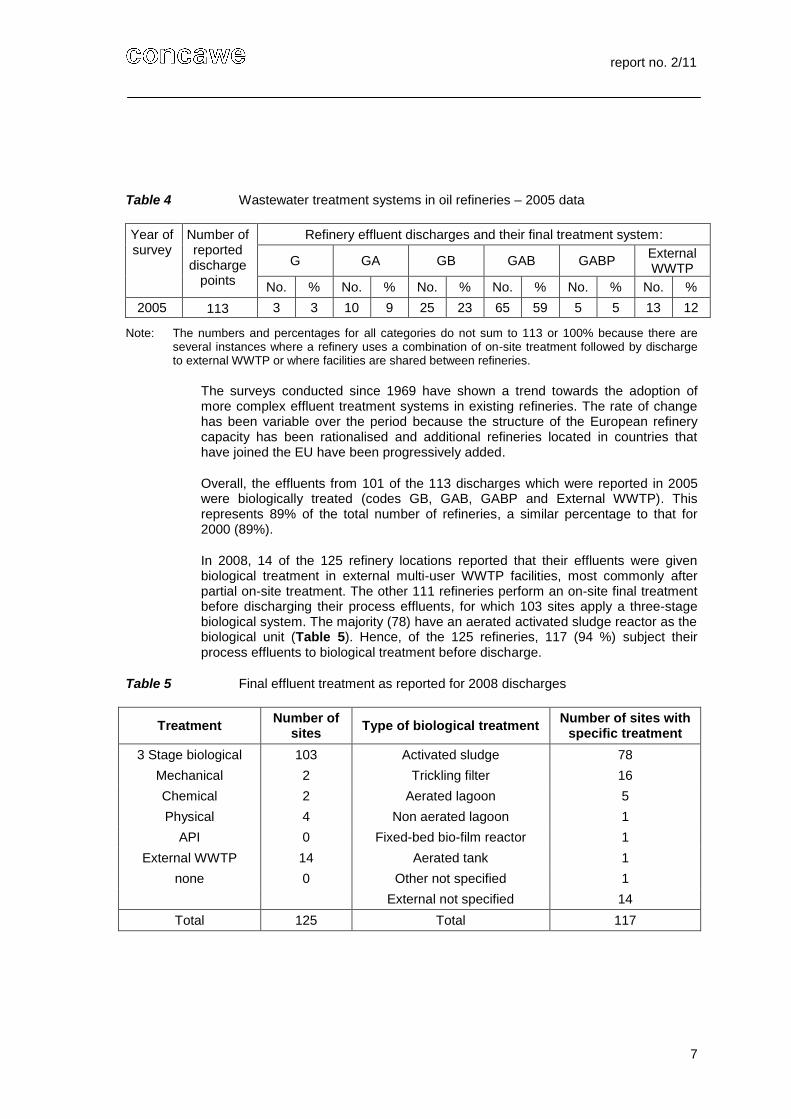
Table 4 Wastewater treatment systems in oil refineries – 2005 data
Year of survey
Number of reported
discharge points
Refinery effluent discharges and their final treatment system:
G GA GB GAB GABP External WWTP
No. % No. % No. % No. % No. % No. %
2005 113 3 3 10 9 25 23 65 59 5 5 13 12
Note: The numbers and percentages for all categories do not sum to 113 or 100% because there are several instances where a refinery uses a combination of on-site treatment followed by discharge to external WWTP or where facilities are shared between refineries.
The surveys conducted since 1969 have shown a trend towards the adoption of more complex effluent treatment systems in existing refineries. The rate of change has been variable over the period because the structure of the European refinery capacity has been rationalised and additional refineries located in countries that have joined the EU have been progressively added.
Overall, the effluents from 101 of the 113 discharges which were reported in 2005 were biologically treated (codes GB, GAB, GABP and External WWTP). This represents 89% of the total number of refineries, a similar percentage to that for 2000 (89%).
In 2008, 14 of the 125 refinery locations reported that their effluents were given biological treatment in external multi-user WWTP facilities, most commonly after partial on-site treatment. The other 111 refineries perform an on-site final treatment before discharging their process effluents, for which 103 sites apply a three-stage biological system. The majority (78) have an aerated activated sludge reactor as the biological unit (Table 5). Hence, of the 125 refineries, 117 (94 %) subject their process effluents to biological treatment before discharge.
Table 5 Final effluent treatment as reported for 2008 discharges
Treatment Number of
sites Type of biological treatment
Number of sites with specific treatment
3 Stage biological 103 Activated sludge 78
Mechanical 2 Trickling filter 16
Chemical 2 Aerated lagoon 5
Physical 4 Non aerated lagoon 1
API 0 Fixed-bed bio-film reactor 1
External WWTP 14 Aerated tank 1
none 0 Other not specified 1
External not specified 14
Total 125 Total 117
report no. 2/11
8
4. AQUEOUS EFFLUENTS DISCHARGED FROM REFINERIES
Aqueous effluent discharge data for the survey years between 1969 and 2005 are summarised in Table 6.
Table 6 Aqueous effluent discharge data
Year of survey Number of reporting refineries
Total aqueous effluent
(million tonne/yr)
Aqueous effluent (tonne/tonne
capacity)
Aqueous effluent (tonne/tonne
oil throughput)
1969 80 3,119 8.0 n.d.
1974 108 3,460 4.9 n.d.
1978 111 2,938 3.9 5.4
1981 104 2,395 3.4 5.4
1984 85 1,934 3.2 4.6
1987 89 1,750 3.0 3.9
1990 95 1,782 3.0 3.5
1993 95 2,670 4.3 4.8
1997 105 2,942 4.4 4.7
2000 84 2,543 4.5 4.9
2005 96 790 1.1 1.2
2008 125 612 (1,112) 0.73 (1.33) 0.82 (1.49)
2008 (& 2005)a
96 462 (900) 0.69 (1.34) 0.76 (1.48)
2008 (only)b
29 150 (212) 0.88 (1.25) 1.11 (1.57)
Note: Until 2000 the total aqueous effluent in the table refers to the sum of process effluents, cooling water and other flows such as lightly contaminated rain water. For the 2008 survey, there is the distinction between treated process water and other streams that are discharged at the same or separate emission points. The values between brackets are based upon the sum of all reported discharges. a) These data are the 2008 values for those sites that reported in both surveys. b) These data represent the 2008 site that did not report in 2005.
In 2005, the reported discharge of effluents decreased from 2,543 million tonnes/ year in 2000 to 790 million tonnes/year. This is a very significant reduction – in the order of 69% - that is attributed to a change in the questionnaire that explicitly asked for the treated refinery effluent streams. Hence, the 2005 effluent data only consider the treated effluents and no longer includes once through cooling water from closed systems.
Possibly a more meaningful indicator is the volume of effluent per tonne of capacity or throughput. These were 1.1 and 1.2 tonnes/tonne capacity and throughput, respectively in 2005, representing significant reductions compared with previous years. For 2008, these values are 0.73 and 0.82 for the treated process water streams and 1.33 and 1.49 for all reported discharges.
Exact comparisons with previous years are not possible but previous reports in this series have noted that the reduction in effluent discharge relative to capacity that was evident between 1969 and 1974 was attributable to the increased use of air cooling, re-circulating cooling water systems and more extensive re-use of water. Likewise, the further reductions that were evident between 1974 and 1978 were
report no. 2/11
9
mainly noted in the older refineries constructed during or before 1960 and that had subsequently been upgraded. The surveys from 1981 to 1990 showed further reductions due to a combination of plant closures and further modifications to cooling systems. Conversely, the large increases in total aqueous effluent and effluent discharge relative to capacity and throughput reported in 1993, 1997 and 2000 compared with 1990 were attributed to the inclusion of refineries which had not previously reported.
report no. 2/11
10
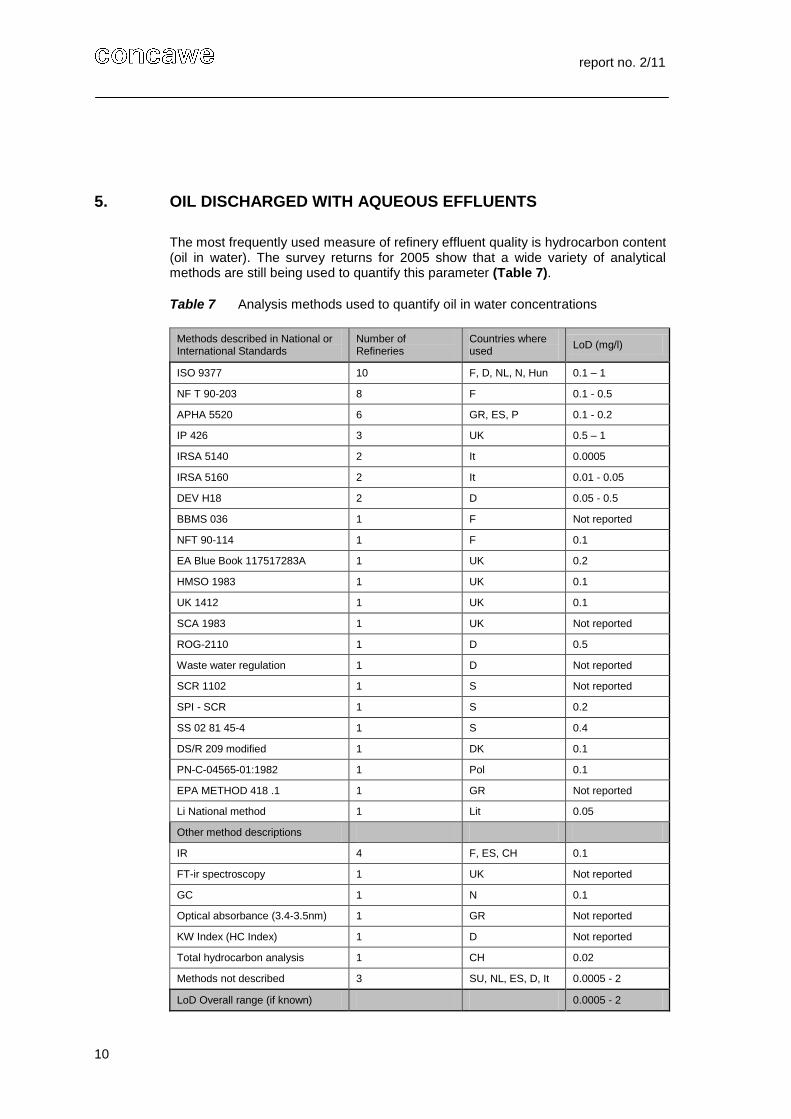
5. OIL DISCHARGED WITH AQUEOUS EFFLUENTS
The most frequently used measure of refinery effluent quality is hydrocarbon content (oil in water). The survey returns for 2005 show that a wide variety of analytical methods are still being used to quantify this parameter (Table 7).
Table 7 Analysis methods used to quantify oil in water concentrations
Methods described in National or International Standards
Number of Refineries
Countries where used
LoD (mg/l)
ISO 9377 10 F, D, NL, N, Hun 0.1 – 1
NF T 90-203 8 F 0.1 - 0.5
APHA 5520 6 GR, ES, P 0.1 - 0.2
IP 426 3 UK 0.5 – 1
IRSA 5140 2 It 0.0005
IRSA 5160 2 It 0.01 - 0.05
DEV H18 2 D 0.05 - 0.5
BBMS 036 1 F Not reported
NFT 90-114 1 F 0.1
EA Blue Book 117517283A 1 UK 0.2
HMSO 1983 1 UK 0.1
UK 1412 1 UK 0.1
SCA 1983 1 UK Not reported
ROG-2110 1 D 0.5
Waste water regulation 1 D Not reported
SCR 1102 1 S Not reported
SPI - SCR 1 S 0.2
SS 02 81 45-4 1 S 0.4
DS/R 209 modified 1 DK 0.1
PN-C-04565-01:1982 1 Pol 0.1
EPA METHOD 418 .1 1 GR Not reported
Li National method 1 Lit 0.05
Other method descriptions
IR 4 F, ES, CH 0.1
FT-ir spectroscopy 1 UK Not reported
GC 1 N 0.1
Optical absorbance (3.4-3.5nm) 1 GR Not reported
KW Index (HC Index) 1 D Not reported
Total hydrocarbon analysis 1 CH 0.02
Methods not described 3 SU, NL, ES, D, It 0.0005 - 2
LoD Overall range (if known) 0.0005 - 2
report no. 2/11
11
Methods for the determination of the oil content of aqueous effluents based on infrared (IR) spectrophotometry are used by most refineries. However, although the majority currently still use IR techniques, there are differences between refineries in the solvents and wavelengths used, and in the number of wavelengths measured. The oil extraction solvents have changed over the years initially because of health concerns over carbon tetrachloride and, more recently, environmental concerns regarding the Freon-CFC that replaced it. The diversity of methods used and the differences in their limits of detection and quantification have a significant bearing on the comparability of data for the different refineries.
It should be noted that the methods used are still largely determined by the requirements of the authorities that monitor and regulate refinery discharges at the national and local level. The adoption of standardised methods is considered by CONCAWE to be a very desirable objective but it will require harmonisation of reporting requirements by the various regulatory jurisdictions throughout the EU countries. The requirements of the Water Framework Directive [12] and the QA/QC Directive 2009/90/EC [18] may be a positive stimulus for achieving this objective. In the past, CONCAWE has encouraged refineries to adopt a standardised three wavelength infrared method to improve comparability of the data. However, more recent developments in analytical techniques may render GC-FID methods to be more adequate for this purpose.
Given the very low concentrations of oil now discharged from most refineries, it is possible that oil content might cease to be used as a parameter for control, which may not be advisable in some regions in Europe. Substitute effluent control parameters could be chemical oxygen demand (COD) or total organic carbon (TOC), that provide a sum measure of all the organic compounds that are present. However, even these can be measured using a variety of methods so that complete comparability of data may still not be possible without the adoption of a standard approach.
Since there is currently no accepted method of converting results obtained using different analytical methods to a common standard, oil discharge data are used as reported.
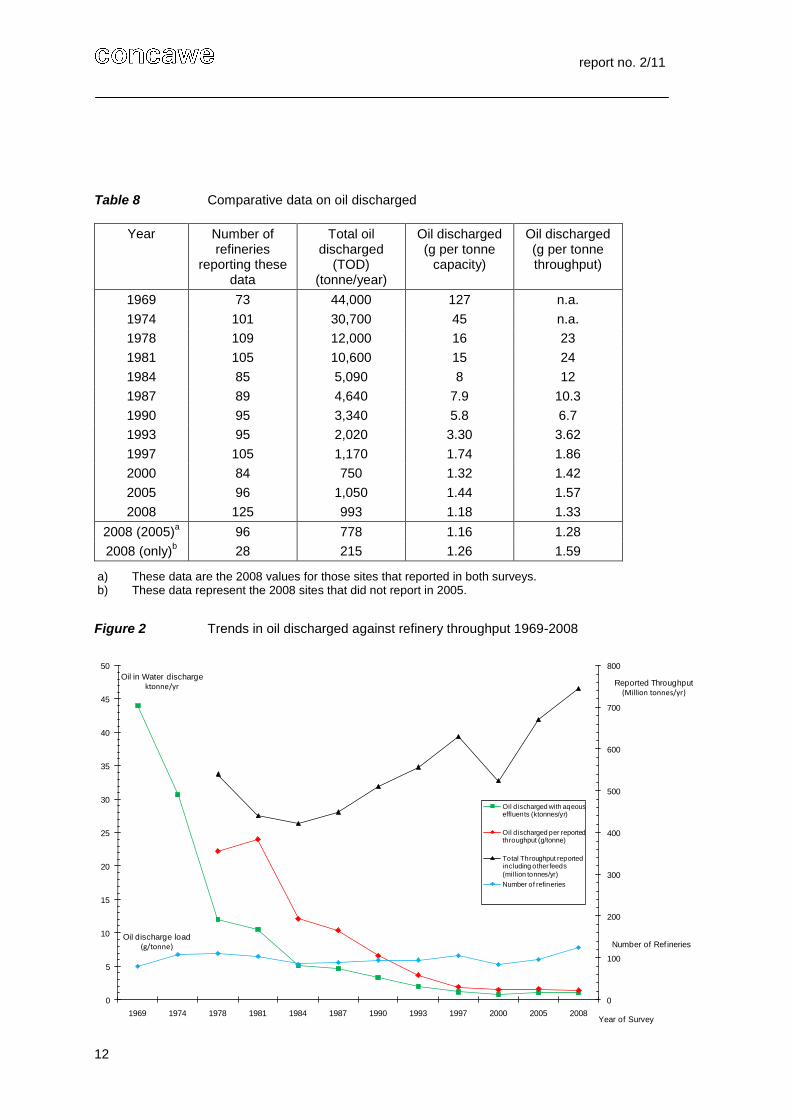
In the years between 1969 and 2000, there has been a continuous reduction in the amount of total oil discharged (TOD) with refinery aqueous effluents from about 44000 tonnes from 73 refineries in 1969 to 750 tonnes from 84 refineries in 2000 (Table 8, Figure 2). This figure has increased since 2000 with 1050 tonnes being discharged from 96 refineries in 2005 and 993 tonnes
3 from 125 refinery sites in
2008. The ratio of oil discharged relative to the refining capacity reduced continuously from 1969 to 2008, with a minor discontinuity in 2005 when a slight increase compared to 2000 was observed. The increases in the total amount of oil discharged in 2005 and 2008, compared to 2000, are attributed to the increase in the number of refineries reporting in these years.
Except for the slightly higher value in 2005, it has to be noticed that the average discharge loads reported remain to be decreasing and have been consistently below the OSPAR Recommendation 89/5 of 3 g/tonne of processed oil [19], since 1997.
3 The total amounts of oil discharges for 2008 are estimated as the sum of the reported treated
effluent loads (745 tonnes), the effluent transfer loads to external WWTPs corrected with a WWTP removal efficiency of 90% (10% of 588 tonnes is 60 tonnes) and the sum of other reported Oil in Water discharges (188 tonnes).
report no. 2/11
12
Table 8 Comparative data on oil discharged
Year Number of refineries
reporting these data
Total oil discharged
(TOD) (tonne/year)
Oil discharged (g per tonne
capacity)
Oil discharged (g per tonne throughput)
1969 73 44,000 127 n.a.
1974 101 30,700 45 n.a.
1978 109 12,000 16 23
1981 105 10,600 15 24
1984 85 5,090 8 12
1987 89 4,640 7.9 10.3
1990 95 3,340 5.8 6.7
1993 95 2,020 3.30 3.62
1997 105 1,170 1.74 1.86
2000 84 750 1.32 1.42
2005 96 1,050 1.44 1.57
2008 125 993 1.18 1.33
2008 (2005)a
96 778 1.16 1.28
2008 (only)b
28 215 1.26 1.59
a) These data are the 2008 values for those sites that reported in both surveys. b) These data represent the 2008 sites that did not report in 2005.
Figure 2 Trends in oil discharged against refinery throughput 1969-2008
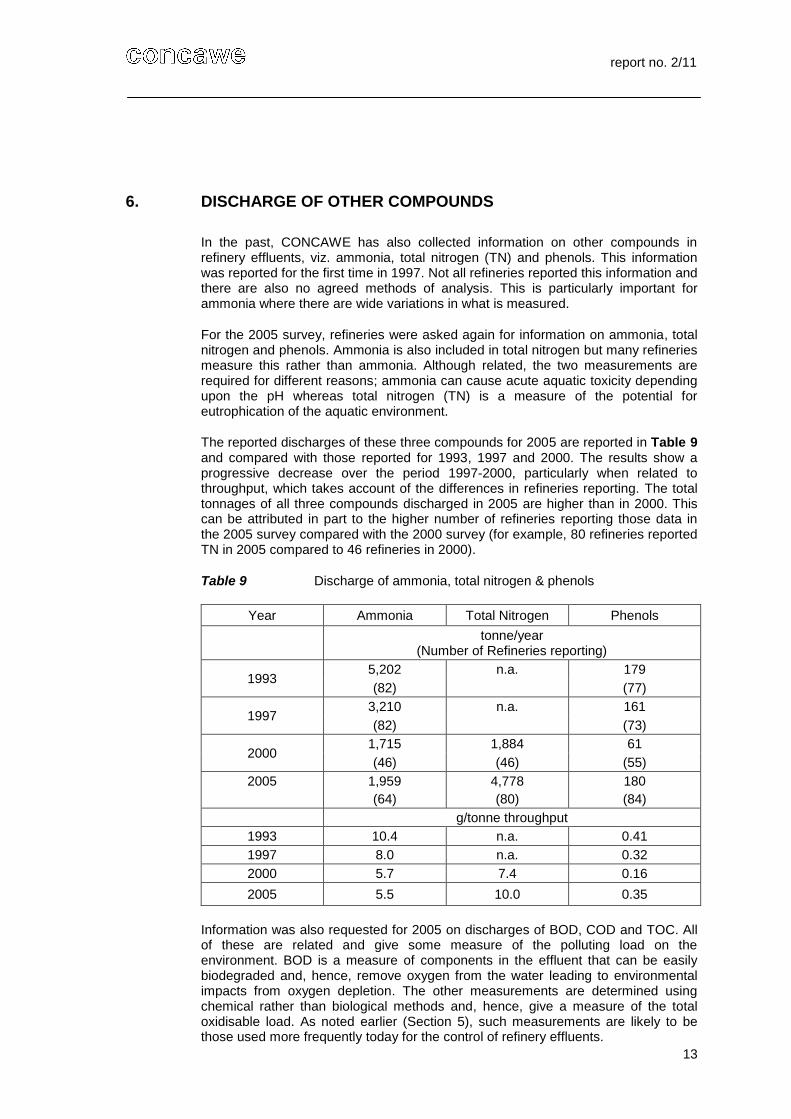
In the past, CONCAWE has also collected information on other compounds in refinery effluents, viz. ammonia, total nitrogen (TN) and phenols. This information was reported for the first time in 1997. Not all refineries reported this information and there are also no agreed methods of analysis. This is particularly important for ammonia where there are wide variations in what is measured.
For the 2005 survey, refineries were asked again for information on ammonia, total nitrogen and phenols. Ammonia is also included in total nitrogen but many refineries measure this rather than ammonia. Although related, the two measurements are required for different reasons; ammonia can cause acute aquatic toxicity depending upon the pH whereas total nitrogen (TN) is a measure of the potential for eutrophication of the aquatic environment.
The reported discharges of these three compounds for 2005 are reported in Table 9 and compared with those reported for 1993, 1997 and 2000. The results show a progressive decrease over the period 1997-2000, particularly when related to throughput, which takes account of the differences in refineries reporting. The total tonnages of all three compounds discharged in 2005 are higher than in 2000. This can be attributed in part to the higher number of refineries reporting those data in the 2005 survey compared with the 2000 survey (for example, 80 refineries reported TN in 2005 compared to 46 refineries in 2000).
Table 9 Discharge of ammonia, total nitrogen & phenols
Year Ammonia Total Nitrogen Phenols
tonne/year (Number of Refineries reporting)
1993 5,202 n.a. 179
(82) (77)
1997 3,210 n.a. 161
(82) (73)
2000 1,715 1,884 61
(46) (46) (55)
2005 1,959
(64)
4,778
(80)
180
(84)
g/tonne throughput
1993 10.4 n.a. 0.41
1997 8.0 n.a. 0.32
2000 5.7 7.4 0.16
2005 5.5 10.0 0.35
Information was also requested for 2005 on discharges of BOD, COD and TOC. All of these are related and give some measure of the polluting load on the environment. BOD is a measure of components in the effluent that can be easily biodegraded and, hence, remove oxygen from the water leading to environmental impacts from oxygen depletion. The other measurements are determined using chemical rather than biological methods and, hence, give a measure of the total oxidisable load. As noted earlier (Section 5), such measurements are likely to be those used more frequently today for the control of refinery effluents.
report no. 2/11
14
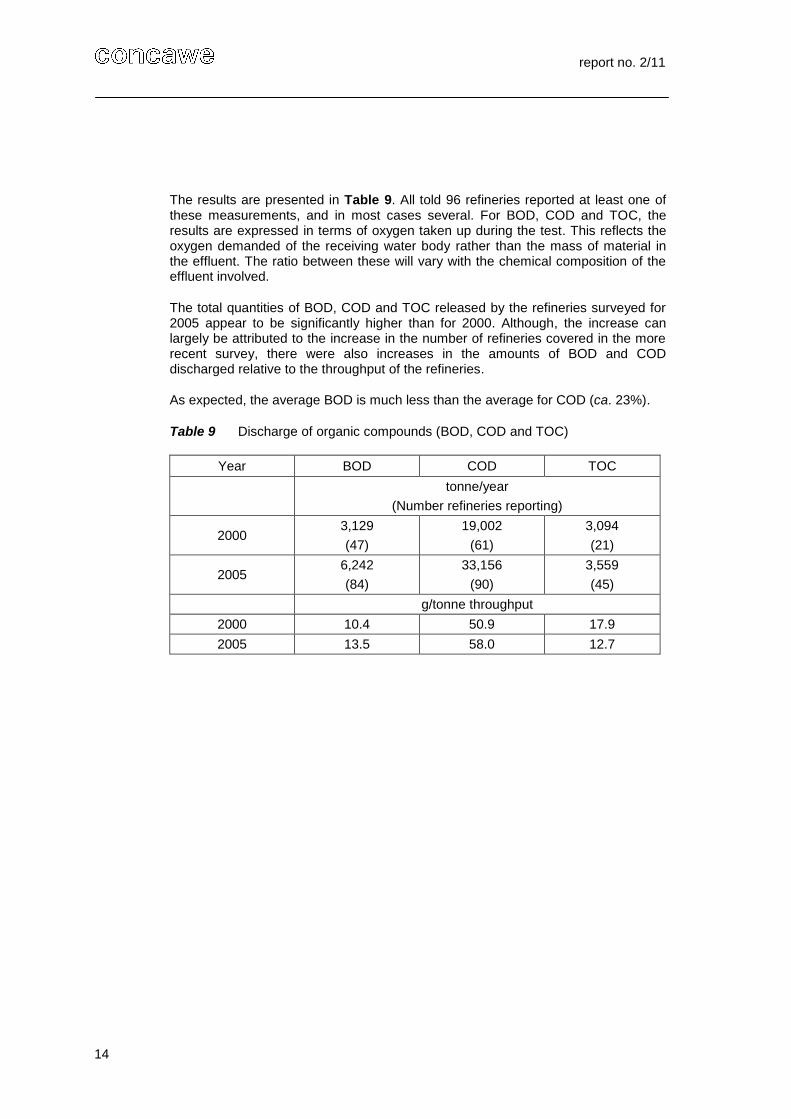
The results are presented in Table 9. All told 96 refineries reported at least one of these measurements, and in most cases several. For BOD, COD and TOC, the results are expressed in terms of oxygen taken up during the test. This reflects the oxygen demanded of the receiving water body rather than the mass of material in the effluent. The ratio between these will vary with the chemical composition of the effluent involved.
The total quantities of BOD, COD and TOC released by the refineries surveyed for 2005 appear to be significantly higher than for 2000. Although, the increase can largely be attributed to the increase in the number of refineries covered in the more recent survey, there were also increases in the amounts of BOD and COD discharged relative to the throughput of the refineries.
As expected, the average BOD is much less than the average for COD (ca. 23%).
Table 9 Discharge of organic compounds (BOD, COD and TOC)
Year BOD COD TOC
tonne/year
(Number refineries reporting)
2000 3,129
(47)
19,002
(61)
3,094
(21)
2005 6,242
(84)
33,156
(90)
3,559
(45)
g/tonne throughput
2000 10.4 50.9 17.9
2005 13.5 58.0 12.7
report no. 2/11
15
7. LIST OF ABBREVIATIONS
API American Petroleum Institute
BOD Biochemical Oxygen Demand
CFC Chloro-Fluoro-Carbon
COD Chemical Oxygen Demand
E-PRTR European Pollutant Release and Transfer Register
G Gravity separation
GA Gravity separation and advanced treatment
GAB Gravity separation and biological treatment
GABP Gravity separation and biological treatment followed by polishing treatment
GC Gas Chromatography
IR Infra Red
FID Flame Ionisation detector
LoD Limit of Detection
NCI Nelson Complexity Index
OiW Oil in Water
OSPAR Oslo Paris Convention on the protection of the marine environment of the North-East Atlantic
QA/QC Quality Assurance / Quality Control
REACH Registration, Evaluation, Authorisation and restriction of CHemicals
THC Total Hydrocarbon Content
TOC Total Organic Carbon
TOD Total Oil Discharged
TN Total Nitrogen
WWTP Waste Water Treatment Plant
report no. 2/11
16
8. REFERENCES
1. CONCAWE (1970) Survey on quality of refinery effluents in Western Europe. Report No. 17/70. Brussels: CONCAWE
2. CONCAWE (1977) Survey on quality of refinery effluents in Europe – a comparison between 1969 and 1974 performances. Report No. 4/77. Brussels: CONCAWE
3. CONCAWE (1982) Quality of aqueous effluents discharged by oil refineries in Western Europe. Paper presented by Dr. H.J. Somerville at OAPEC Symposium, Tunis, 13-15 September, 1982. Document P. 8203. Brussels: CONCAWE
4. CONCAWE (1984) Trends in oil discharged with aqueous effluents from oil refineries in Western Europe. Report No. 4/84. Brussels: CONCAWE
5. CONCAWE (1985) Trends in oil discharged with aqueous effluents from oil refineries in Western Europe - 1984 survey. Report No. 8/85. Brussels: CONCAWE
6. CONCAWE (1988) Trends in oil discharged with aqueous effluents from oil refineries in Western Europe - 1987 survey. Report No. 3/89. Brussels: CONCAWE
7. CONCAWE (1992) Trends in oil discharged with aqueous effluents from oil refineries in Western Europe - 1990 survey. Report No. 1/92. Brussels: CONCAWE
8. CONCAWE (1994) Trends in oil discharged with aqueous effluents from oil refineries in Western Europe - 1993 survey. Report No. 3/94. Brussels: CONCAWE
9. CONCAWE (1998) Trends in oil discharged with aqueous effluents from oil refineries in Western Europe - 1997 survey. Report No. 8/98. Brussels: CONCAWE
10. CONCAWE (2004) Trends in oil discharged with aqueous effluents from oil refineries in Western Europe – 2000 survey. Report No. 4/04. Brussels: CONCAWE
11. EU (2006) Regulation (EC) No. 166/2006 of the European Parliament and of the Council of 18 January 2006 concerning the establishment of a European Pollutant Release and Transfer Register and amending Council Directives 91/689/EEC and 96/61/EC. Official Journal of the European Union No. L33, 04.02.2006
12. EU (2000) Directive 2000/60/EC of the European Parliament and of the Council of 23 October 2000 establishing a framework for Community action in the field of water policy. Official Journal of the European Communities No. L327, 22.12.2000
13. BP (2005) Annual BP statistical review of world energy. London: British Petroleum Company http://www.bp.com/liveassets/bp_internet/globalbp/globalbp_uk_english/publications/energy_reviews_2005/STAGING/local_assets/downloads/pdf/statistical_review_of_world_energy_full_report_2005.pdf
14. Nelson, W.L. (1976) The concept of refinery complexity. Oil & Gas J, Sept. 27, 1976
15. Oil & Gas Journal (2004) Worldwide refining survey 2004. Oil & Gas J 102, 47, 1-39
16. Oil & Gas Journal (2009) Worldwide refining survey 2009. Oil & Gas J 107, 47, 1-62
17. CONCAWE (1979) The environmental impact of refinery effluents. Report No. 5/79. Brussels: CONCAWE
18. EU (2009) Commission Directive 2009/90/EC of 31 July 2009 laying down, pursuant to Directive 2000/60/EC of the European Parliament and of the Council, technical specifications for chemical analysis and monitoring of water status. Official Journal of the European Union No. L201, 01.08.2009
19. OSPAR (1989) PARCOM Recommendation 89/5 of 22 June 1989 concerning refineries. London: OSPAR Commission http://www.ospar.org/v_measures/get_page.asp?v0=pr89-05e.doc&v1=4 http://www.ospar.org/v_measures/get_page.asp?v0=pr89-5.doc&v1=2