Trends in seismic instrumentation Based on the book Instrumentation in Earthquake Seismology Jens Havskov, Institute of Solid Earth Physics University of Bergen Norway and Gerardo Alguacil Instituto Andaluz de Geofisica University of Granada Spain
Transcript
Trends in seismic instrumentation
Based on the book
Instrumentation
in
Earthquake Seismology
Jens Havskov, Institute of Solid Earth Physics
University of Bergen
Norway
and
Gerardo Alguacil
Instituto Andaluz de Geofisica
University of Granada
Spain
Before:
-Seismographs were specially made
-Few standard components were used
- Very specialized software
Now:
-Stations and networks are mainly made with standard industrial components
-Digital technology used throughout
-More standardized software
-Sensors currently the most specialized element
-Now possible to build a seismic station with mainly off the shelf products
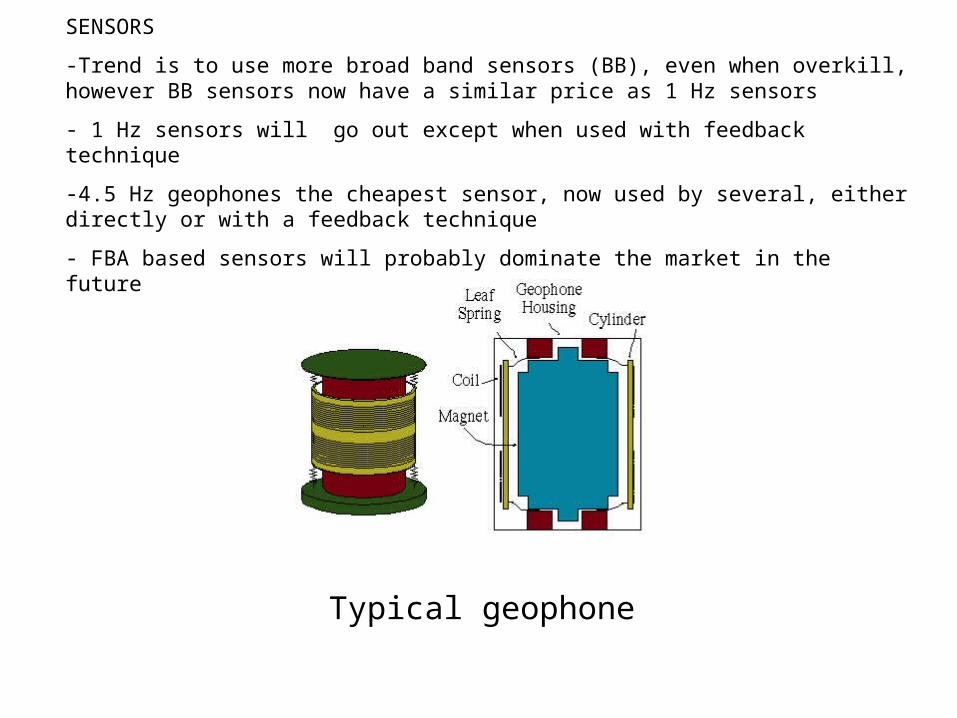
SENSORS
-Trend is to use more broad band sensors (BB), even when overkill, however BB sensors now have a similar price as 1 Hz sensors
- 1 Hz sensors will go out except when used with feedback technique
-4.5 Hz geophones the cheapest sensor, now used by several, either directly or with a feedback technique
- FBA based sensors will probably dominate the market in the future
Typical geophone
Displacement transducer
Spring
Volt out ~ AccelerationForce coil R
C
Mass
Simplified principle behind Force Balanced Accelerometer. The displacement transducer normally uses a capacitor C, whose capacitance varies with the displacement of the mass. A current, proportional to the displacement
transducer output, will force the mass to remain stationary relative to the frame.
The FBA can have the digitizer integrated in feedback loop
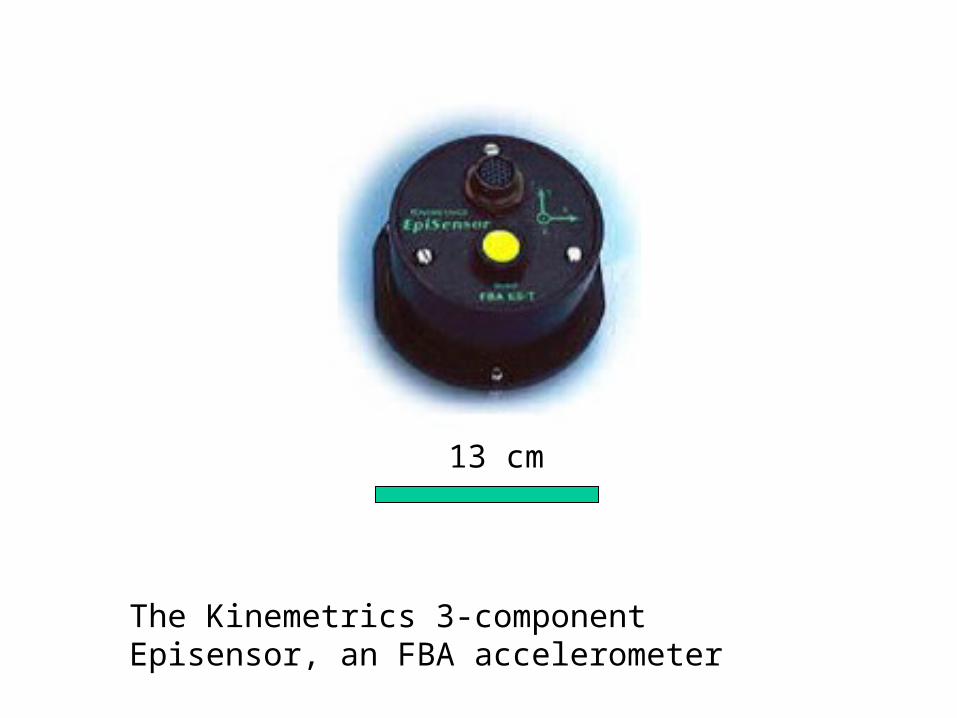
13 cm
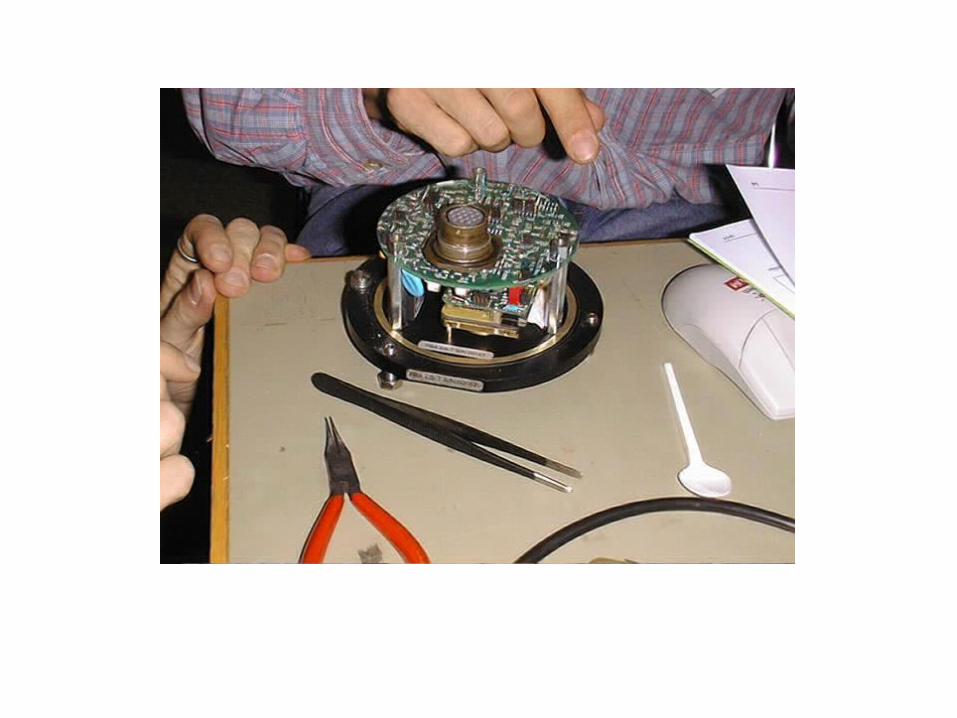
The Kinemetrics 3-component Episensor, an FBA accelerometer
Principal elements of a MEMS (micro electro mechanical systems) accelerometer with capacitive transducer. The mass is the upper mobile capacitor plate which can rotate around the torsion bars. The displacement, proportional to acceleration, is sensed with the variance in the capacitance. For high sensitive applications, a feedback circuit is added which controls a restoring electrostatic force, thus we have a FBA.
The size of the sensor above is about 2 mm. Figure from www.silicondesigns.com/tech.html.
---------------- 2 mm ------------
Acceleration and displacement. The seismograms in the figure show the first few seconds of a P-wave of a small earthquake. On the site there is also an accelerometer installed (A) next to the seismometer (S). The top traces show the original records in counts. The signal from the seismometer is similar to the accelerometer signal, but with higher frequency contents for this later, and the amplitudes are different. The middle traces show the two signals converted to accelerations and the bottom traces, converted to displacement (frequency band 1-20 Hz). The signals are now very similar and of the same amplitude. This example clearly demonstrates that with modern instrument and processing techniques, we can use both accelerometers and (velocity-sensitive) seismometers and get the same result.
A small window of the common traces for Z-channels. The numbers above the traces to the right are max amplitude in counts and the numbers to the left, the DC offset in counts.
Raw traces for different sensors
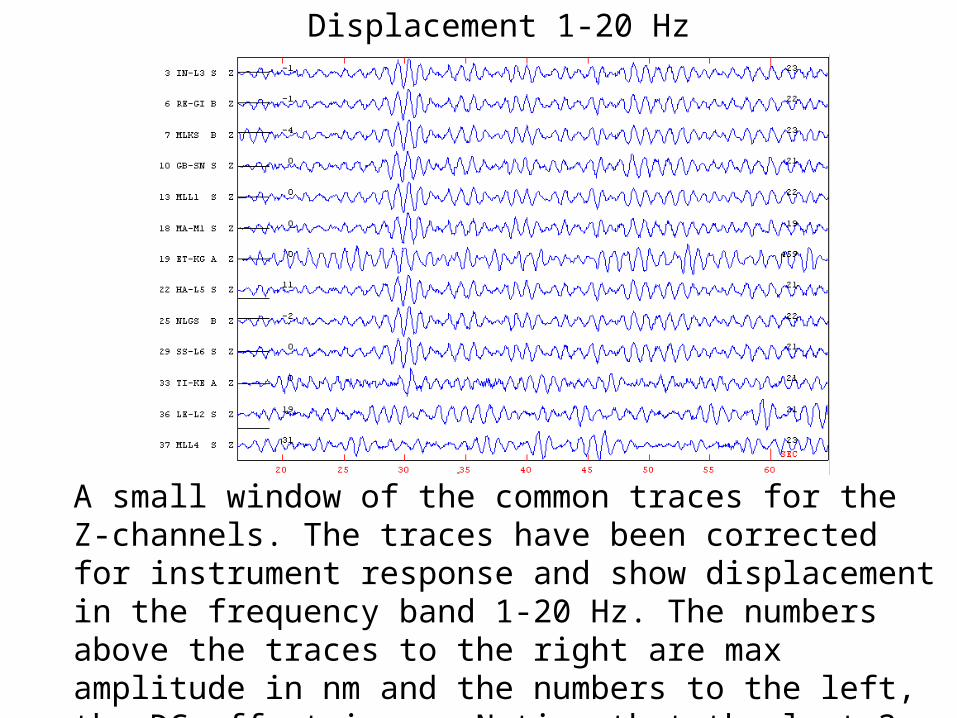
A small window of the common traces for the Z-channels. The traces have been corrected for instrument response and show displacement in the frequency band 1-20 Hz. The numbers above the traces to the right are max amplitude in nm and the numbers to the left, the DC offset in nm. Notice that the last 3 traces are not from the same time window.
Displacement 1-20 Hz
A small window of the common traces for the Z-channels. The traces have been corrected for instrument response and show displacement in the frequency band 0.2-1.0 Hz. The numbers above the traces to the right are max amplitude in nm and the the numbers to the left, the DC offset in nm
Displacement 0.2-1.0 Hz
Computer Data storageAnalog to
Digitalconverter
Powersupply
GPS
Communication
Sensor
input
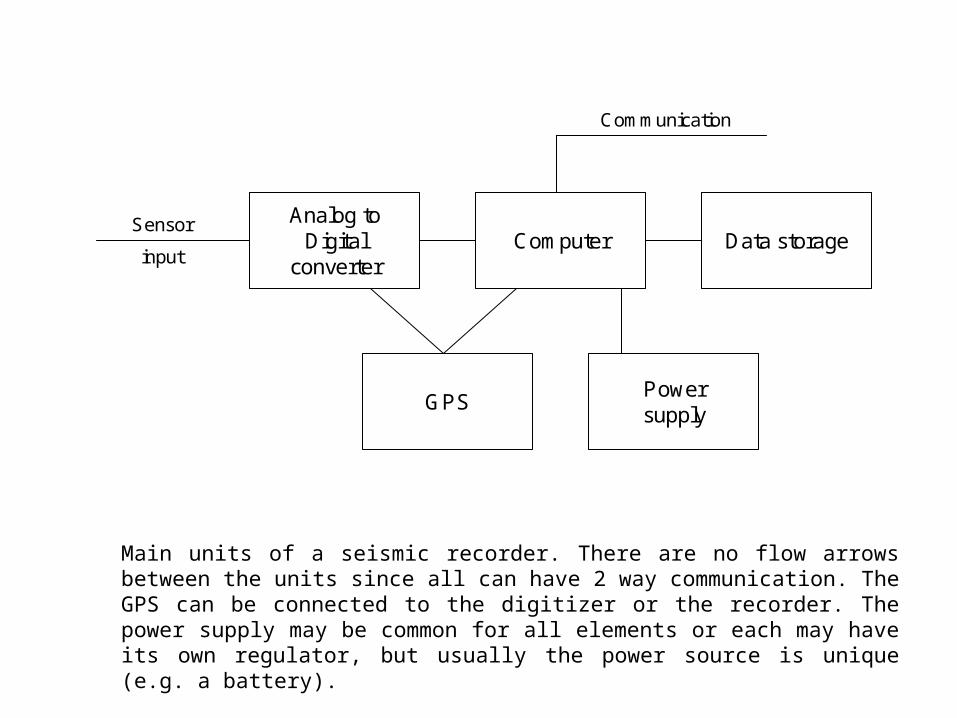
Main units of a seismic recorder. There are no flow arrows between the units since all can have 2 way communication. The GPS can be connected to the digitizer or the recorder. The power supply may be common for all elements or each may have its own regulator, but usually the power source is unique (e.g. a battery).
The current trend in the development of the different elements of the portable recorders is:
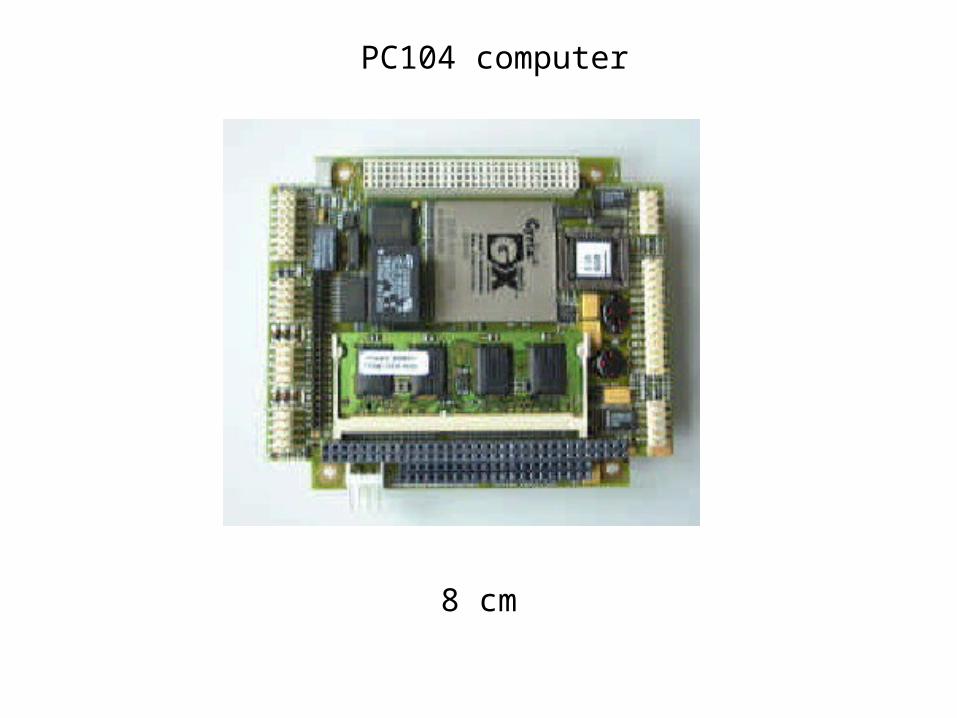
Computer: Based on a standard computer and operating system:
-Linux seems to be the favorite operating system, but Windows NT/2000 is also used.
-Single board PC’s with low power consumption.
Communication and data transfer:
-RS232
-Ethernet
-USB + others
Sample rate, dynamic range and sensitivity:
-Sample rates from 1-1000 Hz,
-Dynamic range of at least 22 bit
- LSB (least significant bit) resolution of 0.1 μV.
Standard Data acquisition software:
Power consumption: Below 2 W.
PC104 computer
8 cm
13cm x 18cm x 34cm
Seismic networks, 2 types:
Physical seismic network: Closely linked remote seismic stations The remote stations detect the ground motion send data in real time to a
central recording station for event detection and recording.
Virtual seismic network: Consists of stations selected among many stations connected to the global communication network or a public phone system. The remote stations must be capable of event detection and local recording and data is normally not sent to a central recording system in real time.
SensorCentralrecorder
SensorPermanent
connection
Sensor
Sensor
Sensor
Sensor
A physical seismic network. The sensors are connected to a central recorder through a permanent physical connection like a wire or radio link. In this example, transmission is analog and digitization takes place centrally, but the analog to digital converter could also have been placed with the sensor and transmission would then be digital.
Computer withdata collection
software
Seismicrecorder
Communication network
Seismicrecorder
Seismicrecorder
Seismicrecorder
A virtual seismic network. The thick line is the communication network, which can have many physical solutions. The data collection computer can collect data from some or all of the recorders connected to the network provided that it knows the protocol used by the recorder.
Field station
All detections
det stat 1................det stat 2det stat 2det stat 3det stat 1………….det stat 3det stat 3det stat 1det stat 1
Network detections
Virtual data logger
net det1 wav2 + wav3 + wav 1net det2 wav3 + wav 1
Logging progress
Copy detections
Declare events
Copy waveform data
Field station
Field station
Ring buffer
10 min
10 min
10 min
etc ....
det 1 wav 1det 2 wav 2det 3 wav 3
... ... det n wav n
Field station details
Typical virtual data logger. The field station (right) has a ring buffer with files or segments 10 min long. It also has a list of detection times with associated parameters (det 1, det 2, etc) and corresponding waveform files (wav 1, wav 2, etc). The virtual data logger (left) has the following logging process: First get a copy of the detection times from all stations (det stat 1, det stat 2, etc, ... indicate a longer time window), which are time ordered. Based on these, network detections are made if at least 2 detections occur within a short time window (net det 1 and net det 2). Finally, the waveform files are copied. In this example, the ring buffer is not used
TCP/IP based datacollection system forreal time data and
triggeed data
Sensors
Internet and/or local area network
BridgeRS232 to TCP/IP
Digitizer
RS232
Field station
Router
ISDN
Dial up PPP
modemField station
Router
Modem
Router
ISDN
Router
ISDN
Field station Field station
Router
Modem
Field station
Router
Modem
Field station
NetworkWindows
Field station
Broad bandLinux
SensorsSensors
Dial up connection
Different ways of getting a TCP/IP connection to a central data collection system. The thick solid lines indicate permanent Ethernet connections.