17
Trends in Smart City Procurement: Using Technology and Innovation to Gain Efficiency Paul Irby, Onvia Market Analyst Prepared for the Smart Cities Council , June 3, 2015
Trends in Smart City Procurement: Using Technology and Innovation to
Gain Efficiency
Paul Irby, Onvia Market Analyst
Prepared for the Smart Cities Council, June 3, 2015
Introduction
Onvia’s database (bids, RFPs, awards, budget documents) provides access to a wide range of information about procurement trends and what cities are buying from vendors.
Today’s Agenda: Trends related to smart city projects
• Why cities are buying (i.e. why make strategic investments?)
• How cities are buying (changes in the procurement process)
• What cities are buying (focusing on three example areas)
3
Why Smart Cities Purchase Newer Technologies
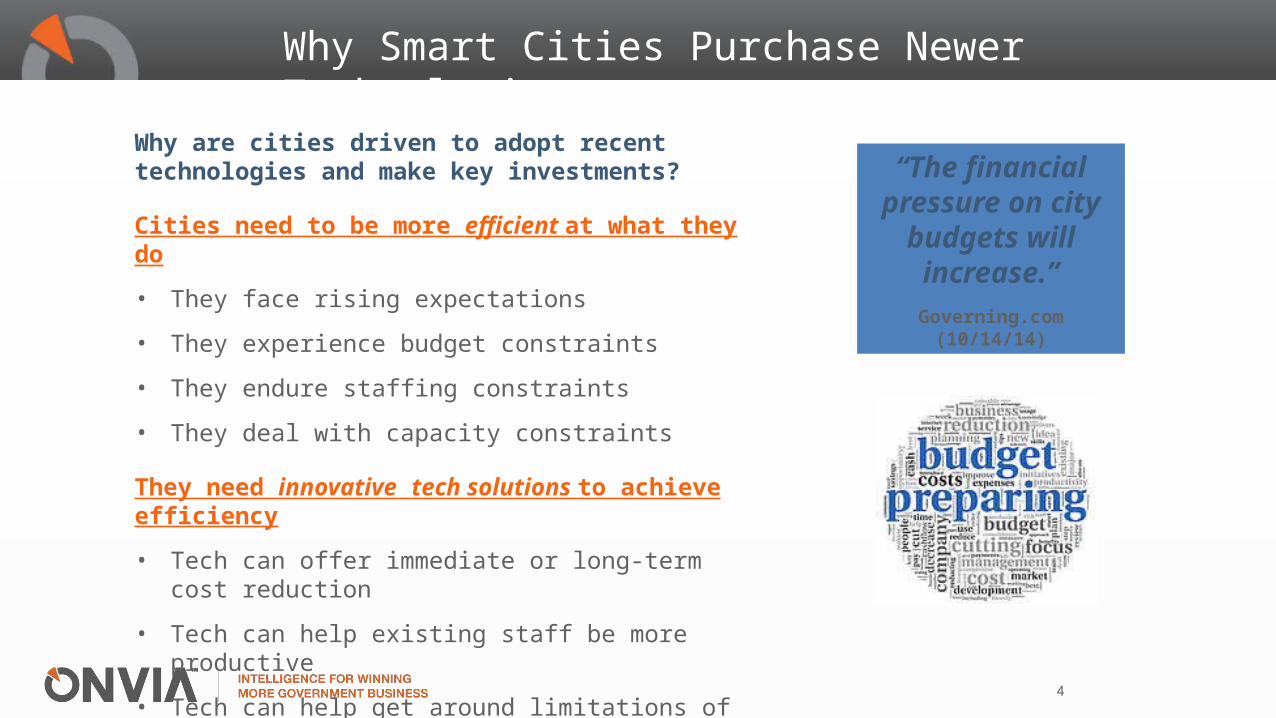
Why are cities driven to adopt recent technologies and make key investments?
Cities need to be more efficient at what they do
• They face rising expectations
• They experience budget constraints
• They endure staffing constraints
• They deal with capacity constraints
They need innovative tech solutions to achieve efficiency
• Tech can offer immediate or long-term cost reduction
• Tech can help existing staff be more productive
• Tech can help get around limitations of capacity
“The financial pressure on city budgets
will increase.”Governing.com
(10/14/14)
4
Shift in Perspective: Efficiency and Innovation
4000
4500
5000
5500
6000
6500
7000
2013 Jan-Apr 2014 Jan-Apr 2015 Jan-Apr
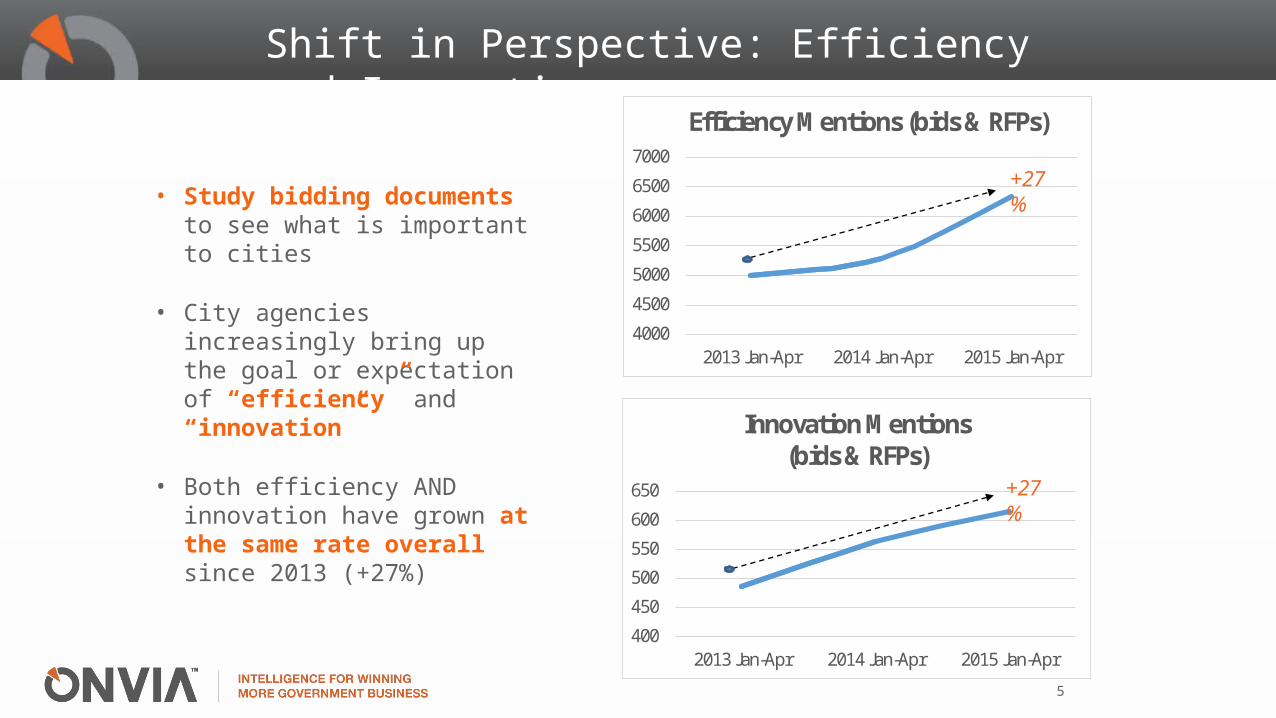
Efficiency Mentions (bids & RFPs)
• Study bidding documents to see what is important to cities
• City agencies increasingly bring up the goal or expectation of “efficiency” and “innovation”
• Both efficiency AND innovation have grown at the same rate overall since 2013 (+27%)
+27%
400
450
500
550
600
650
2013 Jan-Apr 2014 Jan-Apr 2015 Jan-Apr
Innovation Mentions (bids & RFPs)
+27%
5
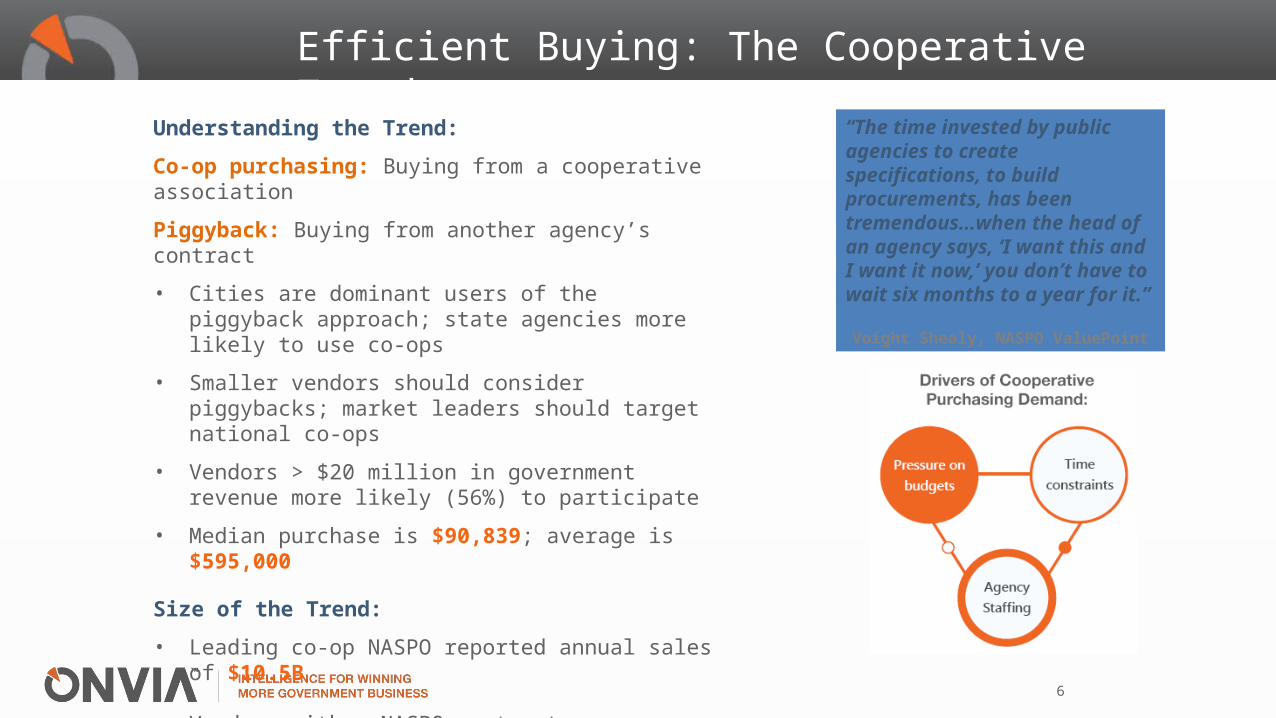
Efficient Buying: The Cooperative Trend
“The time invested by public agencies to create specifications, to build procurements, has been tremendous…when the head of an agency says, ‘I want this and I want it now,’ you don’t have to wait six months to a year for it.”
Voight Shealy, NASPO ValuePoint
Understanding the Trend:
Co-op purchasing: Buying from a cooperative association
Piggyback: Buying from another agency’s contract
• Cities are dominant users of the piggyback approach; state agencies more likely to use co-ops
• Smaller vendors should consider piggybacks; market leaders should target national co-ops
• Vendors > $20 million in government revenue more likely (56%) to participate
• Median purchase is $90,839; average is $595,000
Size of the Trend:
• Leading co-op NASPO reported annual sales of $10.5B
• Vendors with a NASPO contract average $180M in five years with hundreds or thousands of “sales”
6
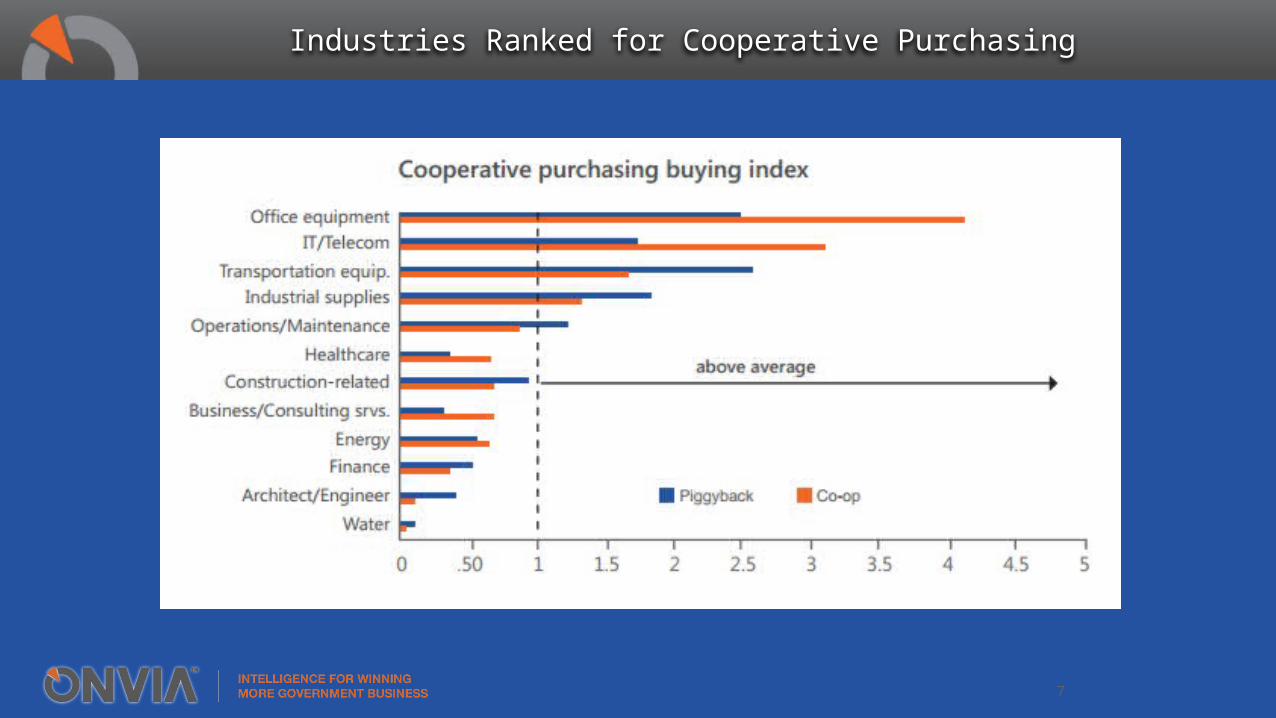
Industries Ranked for Cooperative Purchasing
7
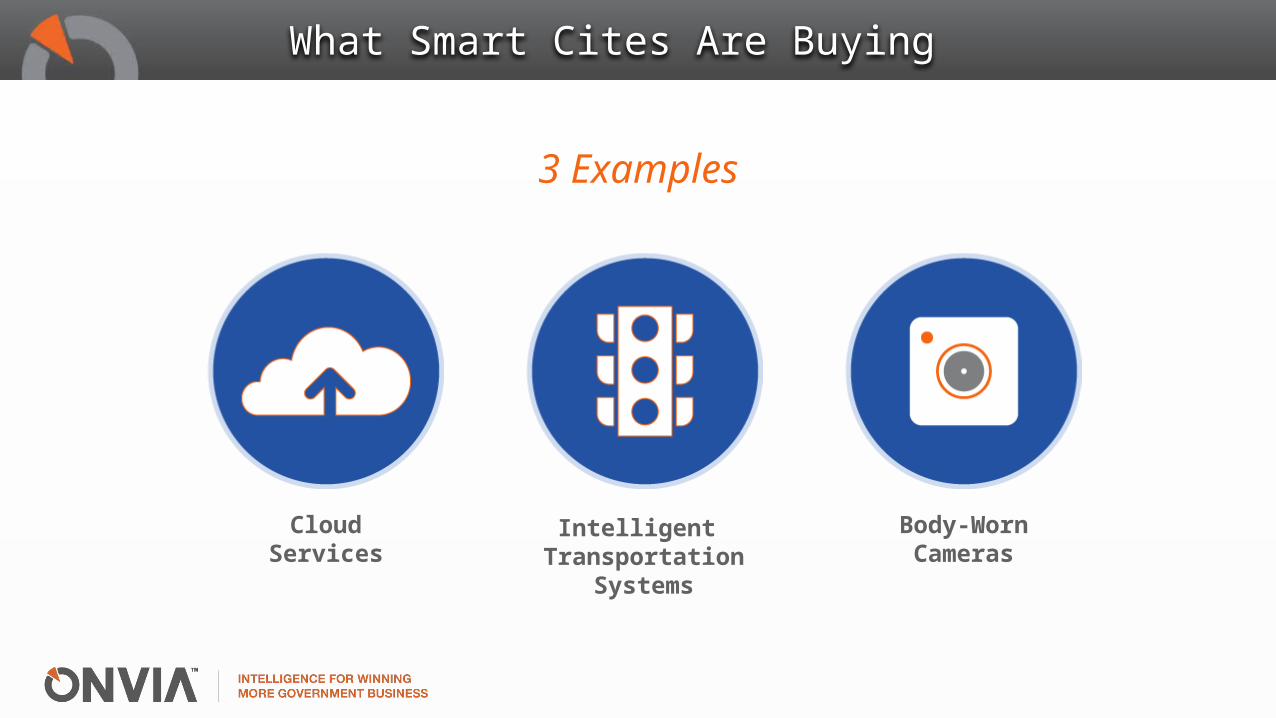
What Smart Cites Are Buying
Intelligent Transportation
Systems
Body-WornCameras
CloudServices
3 Examples
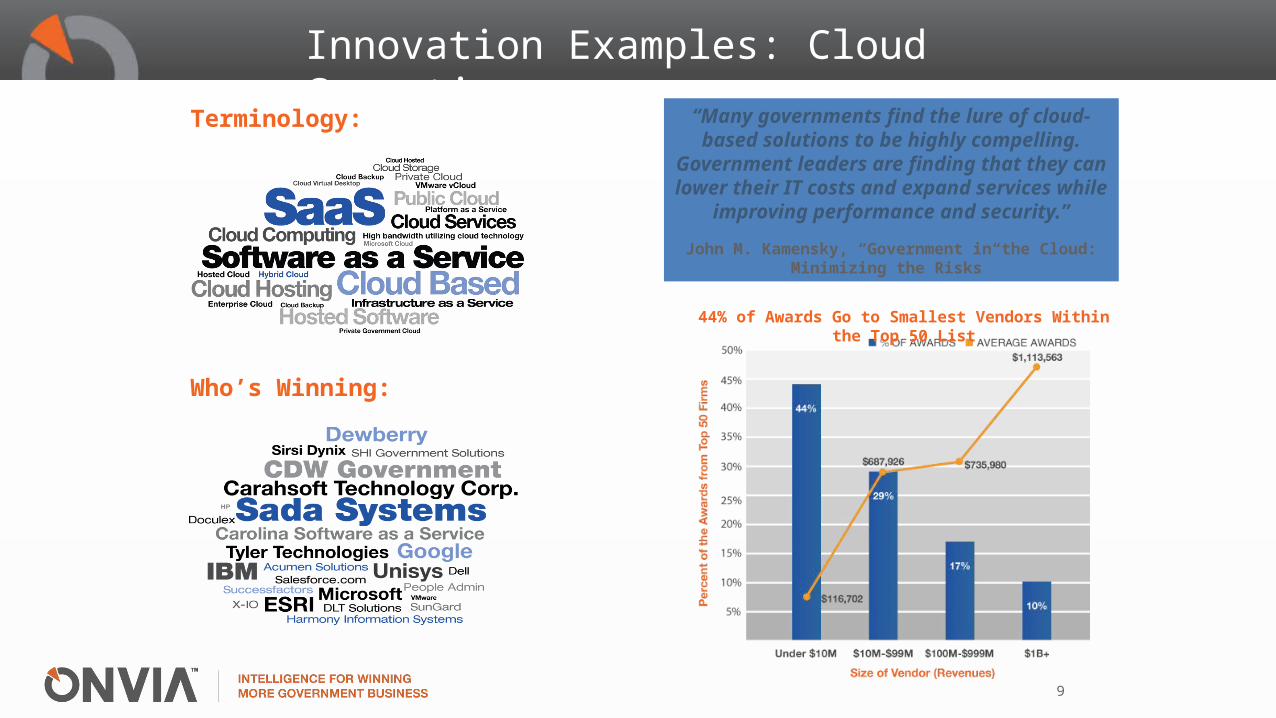
Innovation Examples: Cloud Computing
Terminology:
Who’s Winning:
“Many governments find the lure of cloud-based solutions to be highly
compelling. Government leaders are finding that they can lower their IT
costs and expand services while improving performance and security.”
John M. Kamensky, “Government in the Cloud:
Minimizing the Risks”
44% of Awards Go to Smallest Vendors Within the Top 50 List
9
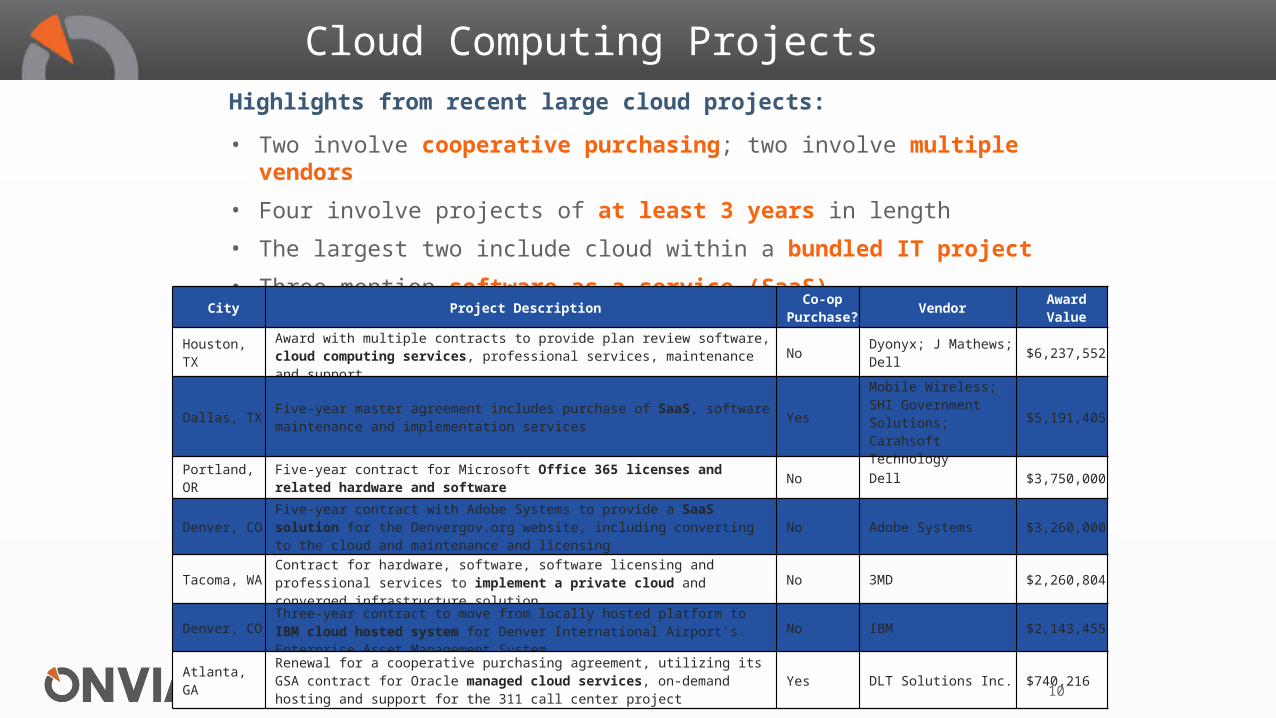
Cloud Computing ProjectsHighlights from recent large cloud projects:
• Two involve cooperative purchasing; two involve multiple vendors
• Four involve projects of at least 3 years in length
• The largest two include cloud within a bundled IT project
• Three mention software-as-a-service (SaaS)
City Project DescriptionCo-op
Purchase?
Vendor Award Value
Houston, TXAward with multiple contracts to provide plan review software, cloud computing services, professional services, maintenance and support No
Dyonyx; J Mathews; Dell $6,237,552
Dallas, TXFive-year master agreement includes purchase of SaaS, software maintenance and implementation services Yes
Mobile Wireless; SHI Government Solutions;Carahsoft Technology
$5,191,405
Portland, OR
Five-year contract for Microsoft Office 365 licenses and related hardware and software No Dell $3,750,000
Denver, COFive-year contract with Adobe Systems to provide a SaaS solution for the Denvergov.org website, including converting to the cloud and maintenance and licensing
No Adobe Systems $3,260,000
Tacoma, WAContract for hardware, software, software licensing and professional services to implement a private cloud and converged infrastructure solution
No 3MD $2,260,804
Denver, COThree-year contract to move from locally hosted platform to IBM cloud hosted system for Denver International Airport's Enterprise Asset Management System
No IBM $2,143,455
Atlanta, GARenewal for a cooperative purchasing agreement, utilizing its GSA contract for Oracle managed cloud services, on-demand hosting and support for the 311 call center project
Yes DLT Solutions Inc. $740,216
10
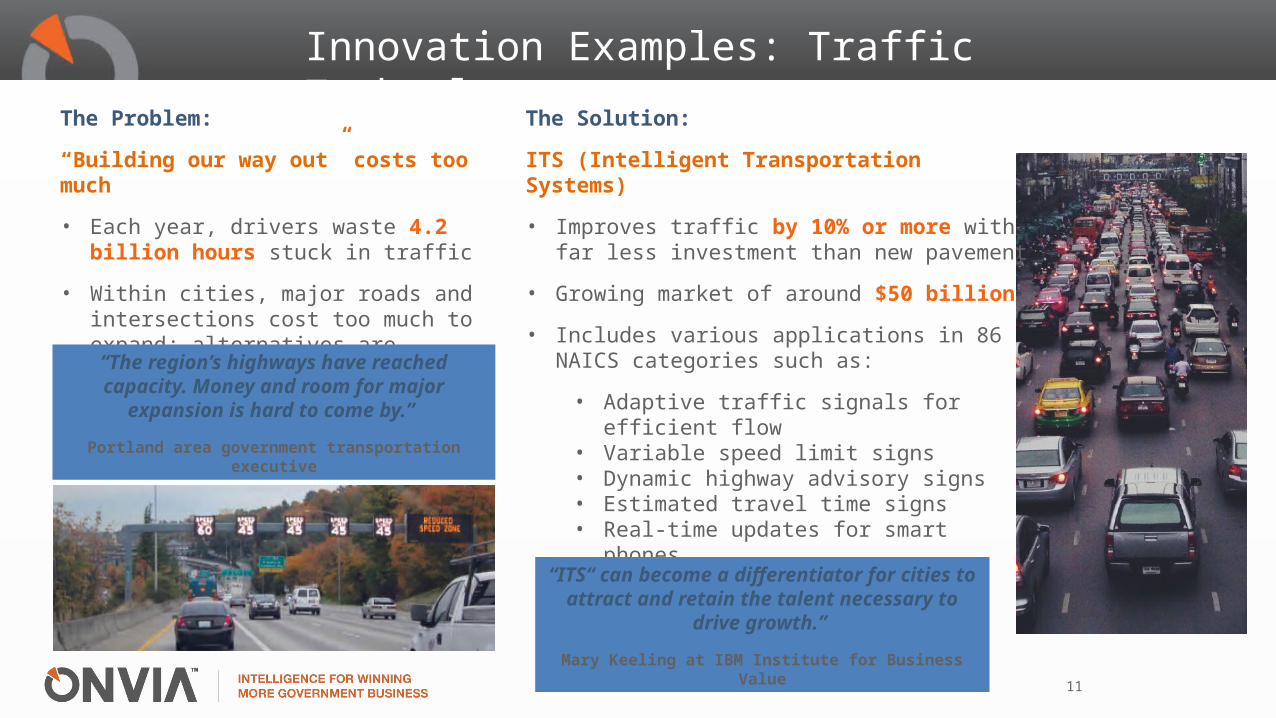
Innovation Examples: Traffic Technology
The Problem:
“Building our way out” costs too much
• Each year, drivers waste 4.2 billion hours stuck in traffic
• Within cities, major roads and intersections cost too much to expand; alternatives are needed.
“The region’s highways have reached capacity. Money and room
for major expansion is hard to come by.”
Portland area government transportation executive
11
The Solution:
ITS (Intelligent Transportation Systems)
• Improves traffic by 10% or more with far less investment than new pavement
• Growing market of around $50 billion
• Includes various applications in 86 NAICS categories such as:
• Adaptive traffic signals for efficient flow• Variable speed limit signs• Dynamic highway advisory signs• Estimated travel time signs• Real-time updates for smart phones• Central traffic control monitoring
systems• On ramp freeway metering
“ITS“ can become a differentiator for cities to attract and retain the talent
necessary to drive growth.”
Mary Keeling at IBM Institute for Business Value
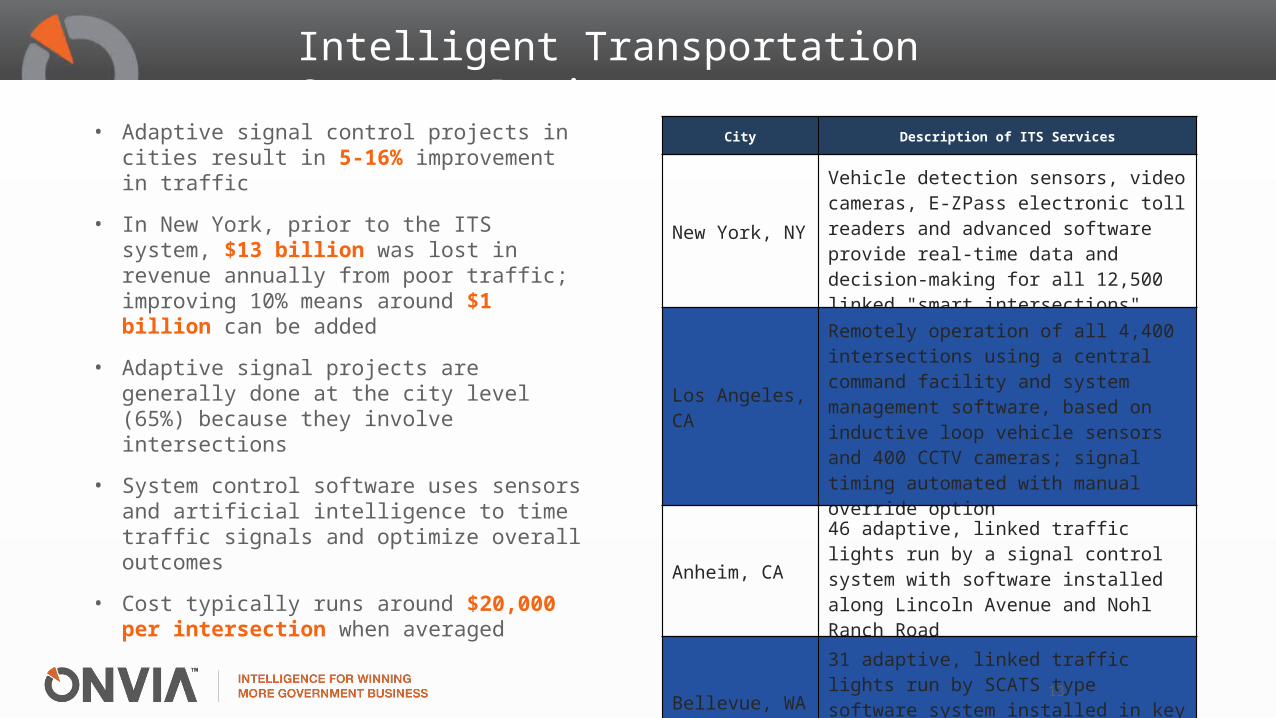
Intelligent Transportation Systems Projects
• Adaptive signal control projects in cities result in 5-16% improvement in traffic
• In New York, prior to the ITS system, $13 billion was lost in revenue annually from poor traffic; improving 10% means around $1 billion can be added
• Adaptive signal projects are generally done at the city level (65%) because they involve intersections
• System control software uses sensors and artificial intelligence to time traffic signals and optimize overall outcomes
• Cost typically runs around $20,000 per intersection when averaged
City Description of ITS Services
New York, NY
Vehicle detection sensors, video cameras, E-ZPass electronic toll readers and advanced software provide real-time data and decision-making for all 12,500 linked "smart intersections"
Los Angeles, CA
Remotely operation of all 4,400 intersections using a central command facility and system management software, based on inductive loop vehicle sensors and 400 CCTV cameras; signal timing automated with manual override option
Anheim, CA
46 adaptive, linked traffic lights run by a signal control system with software installed along Lincoln Avenue and Nohl Ranch Road
Bellevue, WA
31 adaptive, linked traffic lights run by SCATS type software system installed in key intersections in the Downtown and Factoria districts.
13
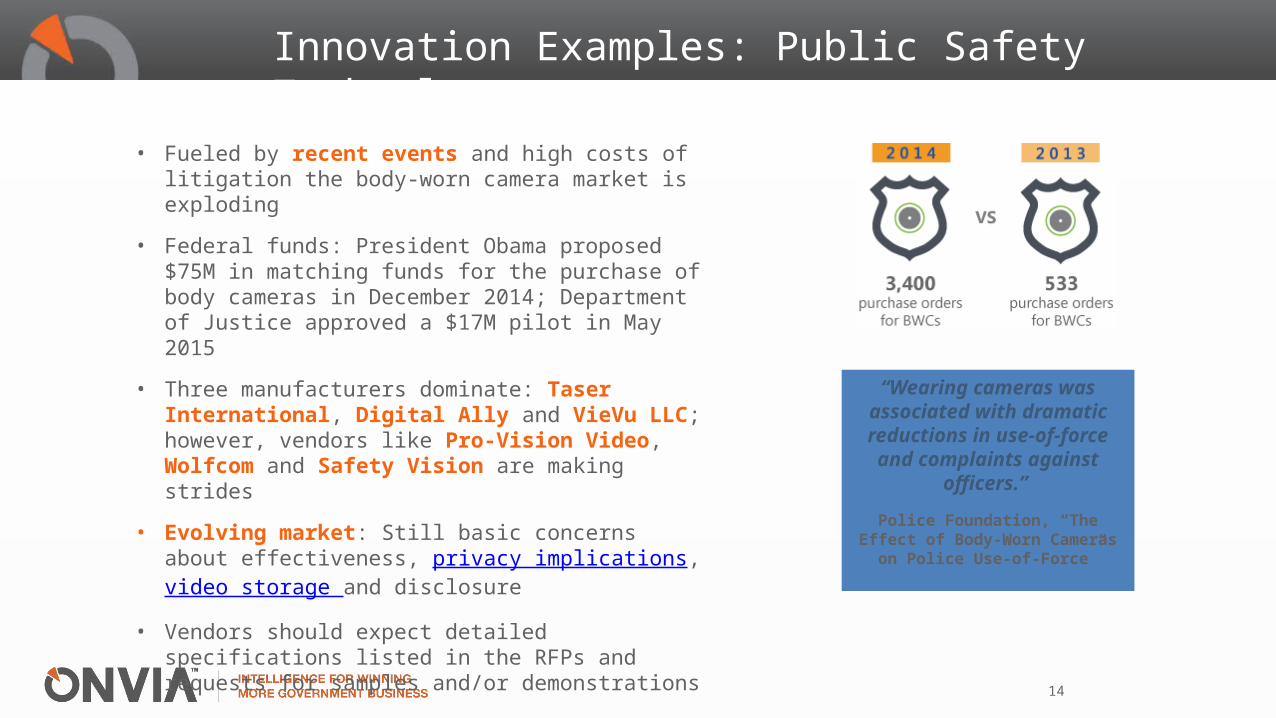
Innovation Examples: Public Safety Technology
• Fueled by recent events and high costs of litigation the body-worn camera market is exploding
• Federal funds: President Obama proposed $75M in matching funds for the purchase of body cameras in December 2014; Department of Justice approved a $17M pilot in May 2015
• Three manufacturers dominate: Taser International, Digital Ally and VieVu LLC; however, vendors like Pro-Vision Video, Wolfcom and Safety Vision are making strides
• Evolving market: Still basic concerns about effectiveness, privacy implications, video storage and disclosure
• Vendors should expect detailed specifications listed in the RFPs and requests for samples and/or demonstrations
“Wearing cameras was associated with
dramatic reductions in use-of-force and
complaints against officers.”
Police Foundation, “The Effect of Body-Worn Cameras on
Police Use-of-Force”
14
Public Safety Technology Projects
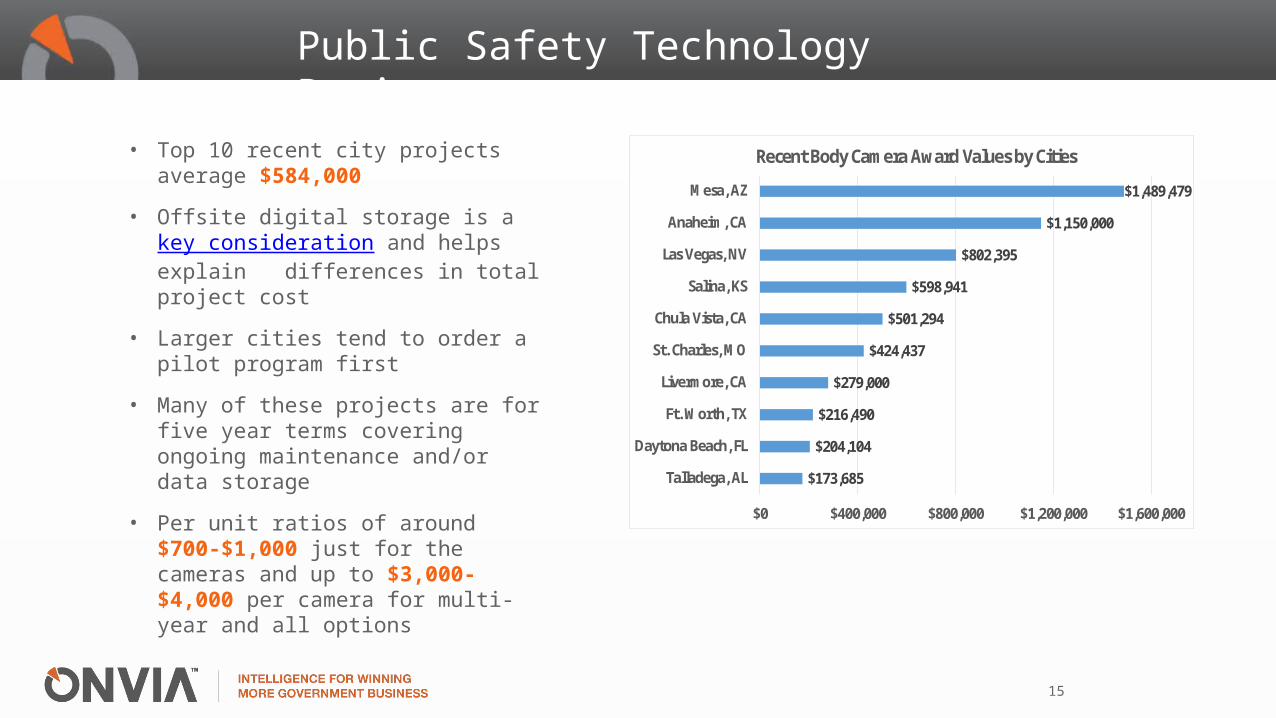
• Top 10 recent city projects average $584,000
• Offsite digital storage is a key consideration and helps explain differences in total project cost
• Larger cities tend to order a pilot program first
• Many of these projects are for five year terms covering ongoing maintenance and/or data storage
• Per unit ratios of around $700-$1,000 just for the cameras and up to $3,000-$4,000 per camera for multi-year and all options
15
$173,685
$204,104
$216,490
$279,000
$424,437
$501,294
$598,941
$802,395
$1,150,000
$1,489,479
$0 $400,000 $800,000 $1,200,000 $1,600,000
Talladega, AL
Daytona Beach, FL
Ft. Worth, TX
Livermore, CA
St. Charles, MO
Chula Vista, CA
Salina, KS
Las Vegas, NV
Anaheim, CA
Mesa, AZ
Recent Body Camera Award Values by Cities
Conclusion
• In an overall better economy, city agencies remain cautious with budget pressures at the line item level
• Challenges also include: Rising expectations and staffing & capacity constraints
• As a result, the goal is efficiency and using innovation to achieve it
• Cities will also try to save money in how it’s purchased, through group discounts and issuing fewer competitive opportunities - the cooperative trend
• There is a strong demand for technology solutions such as cloud computing, intelligent traffic management and body-worn cameras that can mitigate city problems, address difficult constraints and ultimately improve efficiency in government.
16

Contact Onvia
15
Ronit CohnSales Manager,
OnviaFor questions or more information about the research provided in this presentation, contact Paul Irby at [email protected], 206.373.9120
Paul IrbyMarket Analyst,
OnviaTo learn more about Onvia’s services in the public sector, contact Ronit Cohn at [email protected], 206.373.9418
Onvia has the intelligence companies need to win more government business. Visit www.onvia.com to learn more or feel free to contact us directly.

More Valuable Resources from Onvia
16
Download Onvia’s latest content on current and future state & local procurement trends:
• Leverage Cooperative Purchasing to Grow Your Government Saleshttp://www.onvia.com/business-resources/white-papers/leverage-cooperative-purchasing-to-grow-your-government-sales
• Onvia Government Contractors Survey Results: Selling into the B2G Market in 2015:www.onvia.com/business-resources/white-papers/onvia-government-contractors-survey-results-selling-b2g-market-2015
• Onvia’s State & Local Procurement Snapshots: www.onvia.com/tags/onvia-state-local-procurement-snapshot
For more on the latest government contracting tips and trends:
White Papers
www.onvia.com/business-resources/white-pap
ers
Blog
www.onvia.com/blog
Articles
www.onvia.com/business-resources/white-p
apers
17
ABOUT ONVIAOnvia specializes in providing business intelligence solutions to vendors to grow their government business, helping them get ahead of the bid and RFP process. Active vendors in the government market that need timely, comprehensive and unique insights in their industry vertical, key buyers and competitive landscape should visit www.onvia.com and request a demo to speak with a Business Development Manager in their industry. Onvia helps clients strategically growtheir government business with solutions for project intelligence, agency intelligence and vendor intelligence in the public sector.
Disclaimer:The information contained in this Onvia publication has been obtained from publicly available federal, state and local and government data sources. These data sources are reviewed and updated periodically to better reflect activity in the public sector. Changes in opportunity volume due to source changes are generally not material enough to affect research findings, but may be material in some instances. The number of calendar working days in a given period may differ slightly each year, which can also affect volume. Onvia disclaims all warranties as to the accuracy, completeness or adequacy of such information. The views and opinions expressed in this publication are those of Onvia’s research organization or contributors and are subject to change.
For More InformationOnvia - www.onvia.com(800) 575-1736


