Trends in the base oil landscape- changes and opportunities Tribology Days, Nynäs Havsbad, October 7&8 2015 Dr. Luis Bastardo-Zambrano Prof. Thomas Norrby Nynas AB, Naphthenics TechDMS, Nynashamn, Sweden
Transcript
Trends in the base oil landscape- changes and opportunities Tribology Days, Nynäs Havsbad, October 7&8 2015 Dr. Luis Bastardo-Zambrano Prof. Thomas Norrby Nynas AB, Naphthenics TechDMS, Nynashamn, Sweden
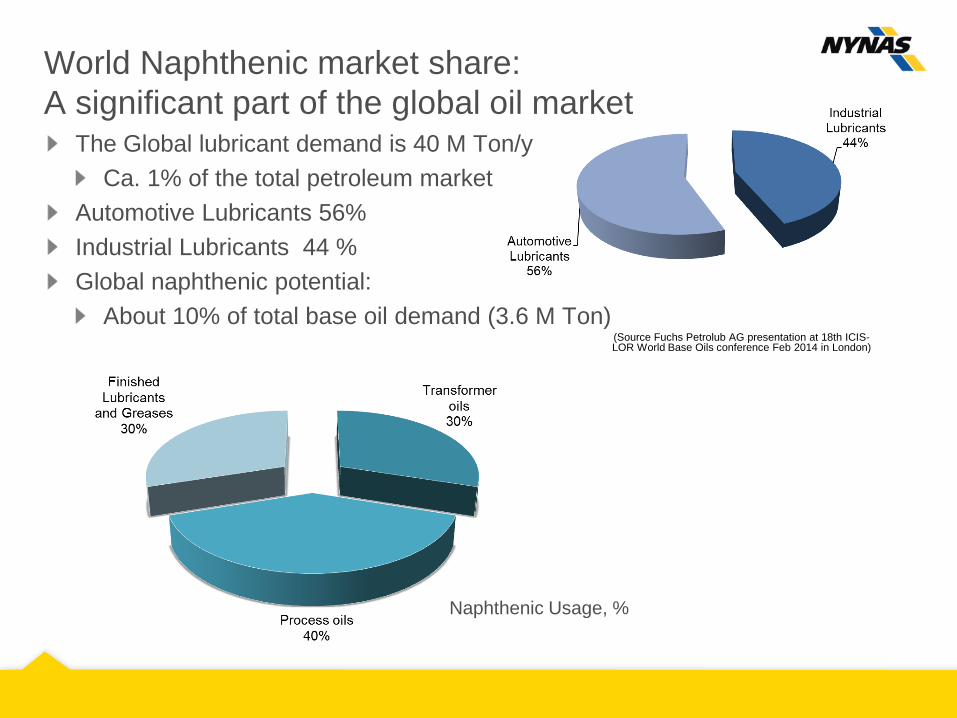
World Naphthenic market share: A significant part of the global oil market
The Global lubricant demand is 40 M Ton/y Ca. 1% of the total petroleum market
Automotive Lubricants 56% Industrial Lubricants 44 % Global naphthenic potential:
About 10% of total base oil demand (3.6 M Ton) (Source Fuchs Petrolub AG presentation at 18th ICIS-LOR World Base Oils conference Feb 2014 in London)
Naphthenic Usage, %
Main applications of naphthenic oils (I)
Lubricant Industry (30%) Lubricating greases Metal Working Fluids (MWF) As a component in other industrial lubricants (hydraulic fluids, gear oils, etc.)
Electrical Industry (ELI) (30%)
Insulating oils for industrial transformers Finished products for direct end use
Main applications of naphthenic oils (II)
Process oils (40%) Adhesives and sealants Printing inks Battery separators Insoluble sulfur (as oil dispersion) Antifoams
Tyre Industry
Used as extender oil in tyre rubber Oil extended polymers
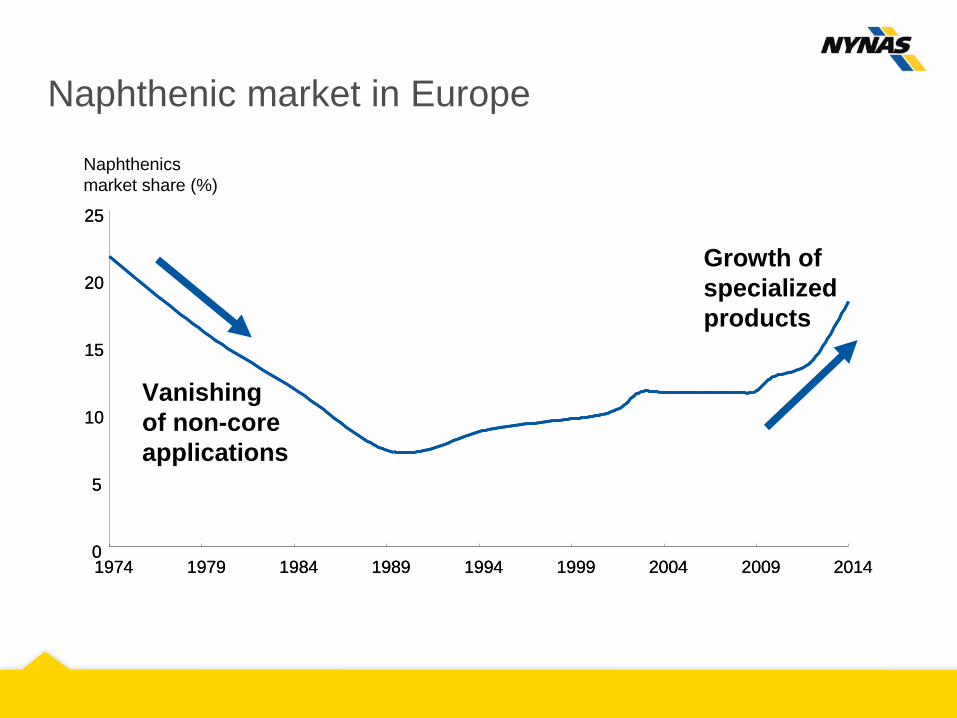
Naphthenic market in Europe
Naphthenics market share (%)
0
5
10
15
20
25
1974 1979 1984 1989 1994 1999 2004 2009 20140
5
10
15
20
25
1974 1979 1984 1989 1994 1999 2004 2009 2014
Vanishing of non-core applications
Growth of specialized products
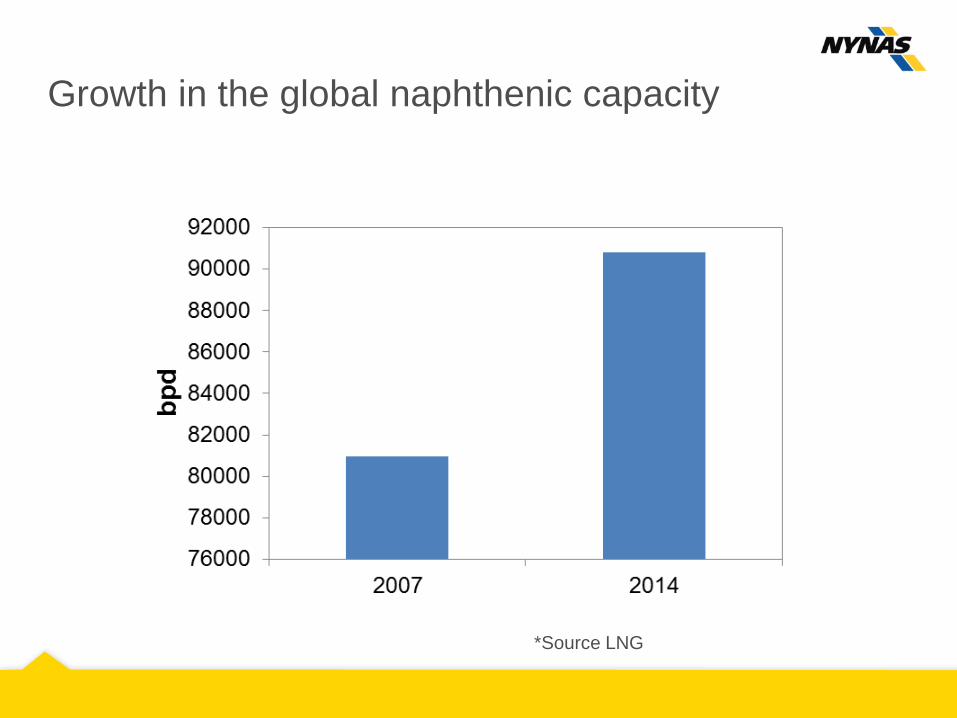
Growth in the global naphthenic capacity
*Source LNG
Evolution of the global base oil pool
51% 28%
11%
1% 9%
2012
Group IGroup IIGroup IIIPAONaphthenic
44%
34%
11%
1% 10%
2014
Group IGroup IIGroup IIIPAONaphthenic
26%
48%
13%
1% 12%
2019 f’cast
Group IGroup IIGroup IIIPAONaphthenic
Source. SBA Consulting
The global base oil demand scenario is here assumed to remain around 36 M mt/pa for the period
What is driving the change?
Several supply related factors – external to the lubricant industry – have a negative impact on Group I plants:
Crude oil cost and availability Volatile, long term trend?
Refining economics Of scale and of method/technology
“Technological paradox” Gr I more expensive to make On the demand side, as Group II and III oils are more suited than Group I oils to meet the quality demand of the automotive industry Thus, the Group II and III market is growing at the expenses of Group I oils, which are required for industrial use
However, the demand growth will not match the supply growth
Independently of the way the demand will develop, without closures we are heading towards a period of overcapacity The demand outlook will only determine the size of the oversupply In the most optimistic growth scenario the excess capacity would reach 6 M mt/y In the most realistic growth scenario the excess capacity would be over 10 M mt/y
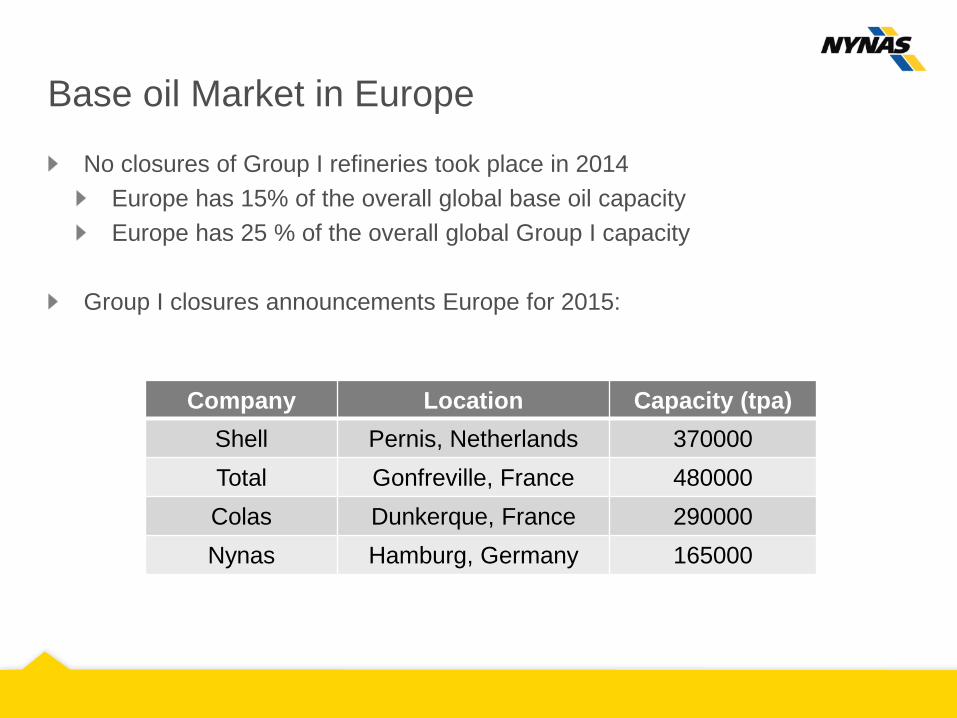
Base oil Market in Europe
No closures of Group I refineries took place in 2014 Europe has 15% of the overall global base oil capacity Europe has 25 % of the overall global Group I capacity
Group I closures announcements Europe for 2015:
Company Location Capacity (tpa) Shell Pernis, Netherlands 370000 Total Gonfreville, France 480000 Colas Dunkerque, France 290000 Nynas Hamburg, Germany 165000
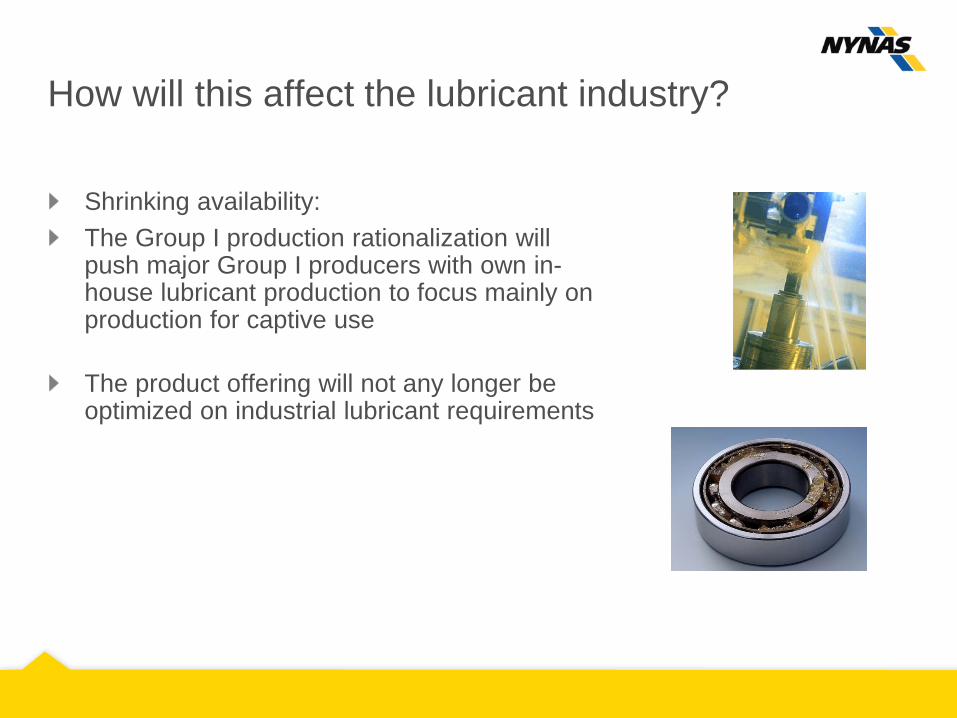
How will this affect the lubricant industry?
Shrinking availability: The Group I production rationalization will push major Group I producers with own in-house lubricant production to focus mainly on production for captive use The product offering will not any longer be optimized on industrial lubricant requirements
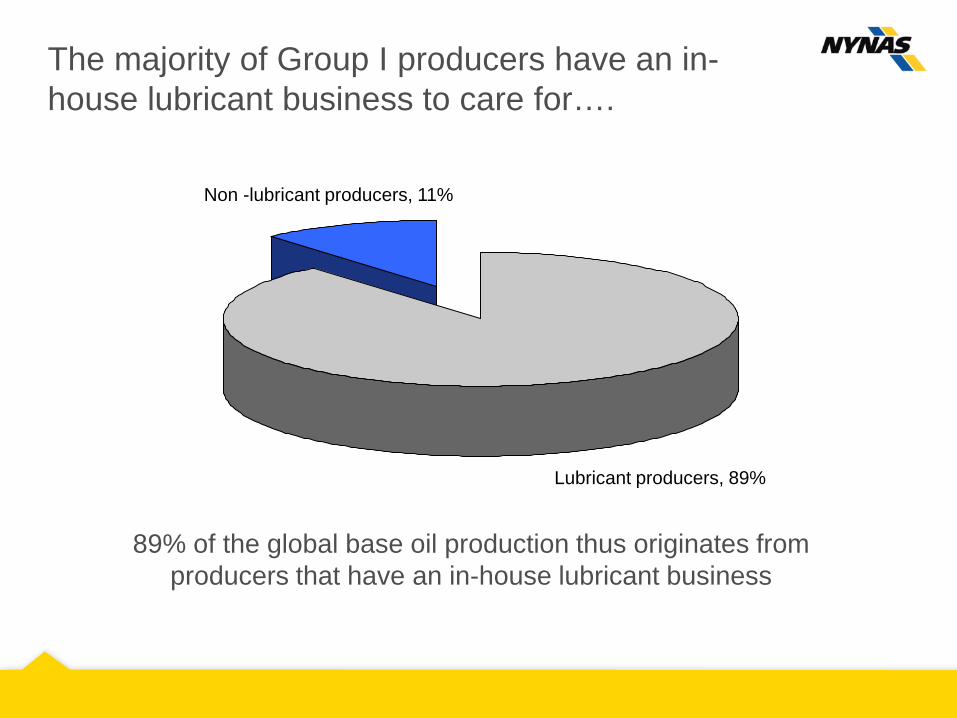
The majority of Group I producers have an in-house lubricant business to care for….
Lubricant producers, 89%
Non -lubricant producers, 11%
89% of the global base oil production thus originates from producers that have an in-house lubricant business
The “collateral damage” of the paraffinic quality shift
Group II and III paraffinic oils are excellent base stocks for the formulation of modern engine oils However, Group II and III paraffinic oils display lower solvency compared to Group I paraffinic oils Moreover, there is a limitation in the maximum viscosity that can be reached in Group II and III plants Therefore, the shift from Group I to Group II and III paraffinic oils will pose challenges to industrial lubricant formulators, as it will lead to a loss of solvency and viscosity range availability
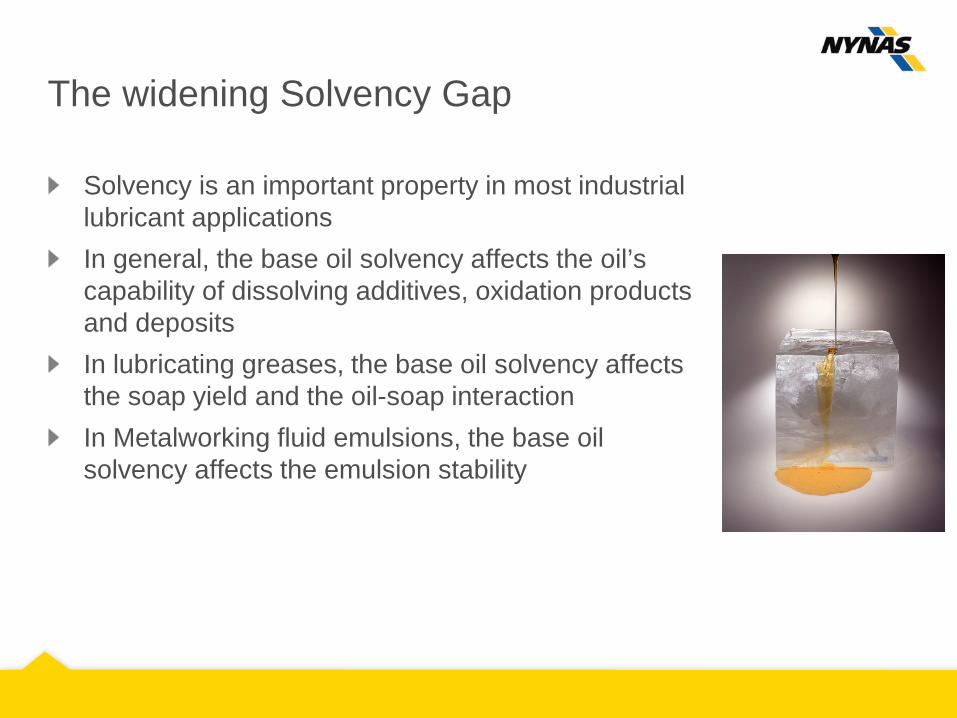
The widening Solvency Gap
Solvency is an important property in most industrial lubricant applications In general, the base oil solvency affects the oil’s capability of dissolving additives, oxidation products and deposits In lubricating greases, the base oil solvency affects the soap yield and the oil-soap interaction In Metalworking fluid emulsions, the base oil solvency affects the emulsion stability
The growing high viscosity deficiency
API group Light neutral Medium neutral Heavy neutral Bright stock
Group I 38% 13% 33% 16%
Group II 55% 25% 20% none
Group III 80% 20% none none
The ongoing shift in capacity will generate availability issues for heavy neutrals and for bright stocks
How is the market going to move away from Group I?
Conversion to Group II or Group III?
Conversion to Naphthenics ?
Conversion to Group II/III – Naphthenic blends?
Nynas Oils and Group I Replacement – the new speciality base oil range
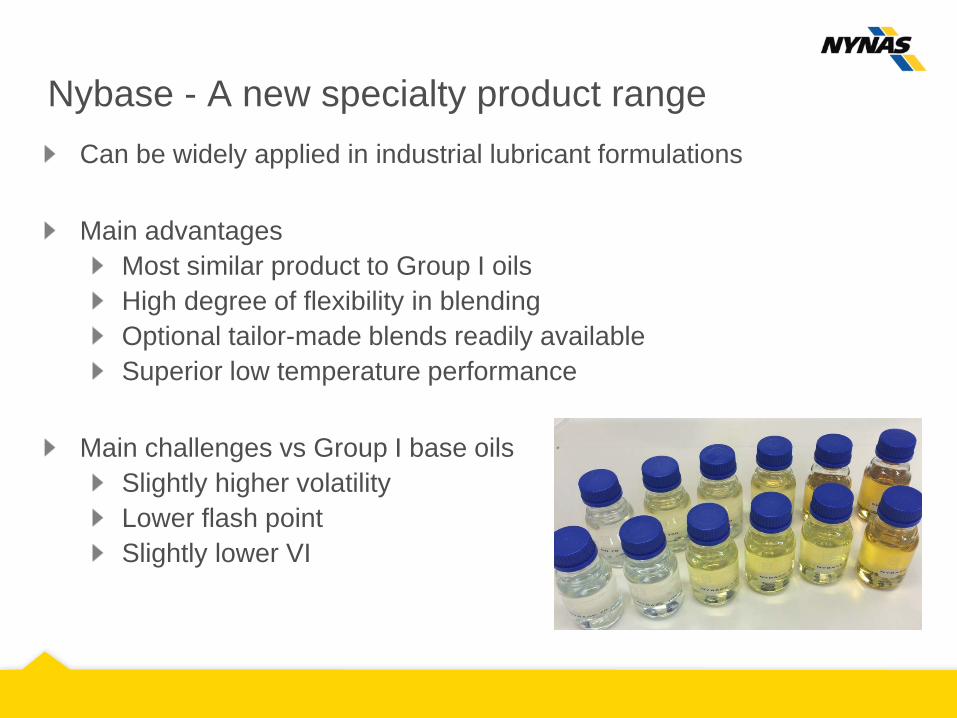
Nybase - A new specialty product range Can be widely applied in industrial lubricant formulations Main advantages
Most similar product to Group I oils High degree of flexibility in blending Optional tailor-made blends readily available Superior low temperature performance
Main challenges vs Group I base oils
Slightly higher volatility Lower flash point Slightly lower VI
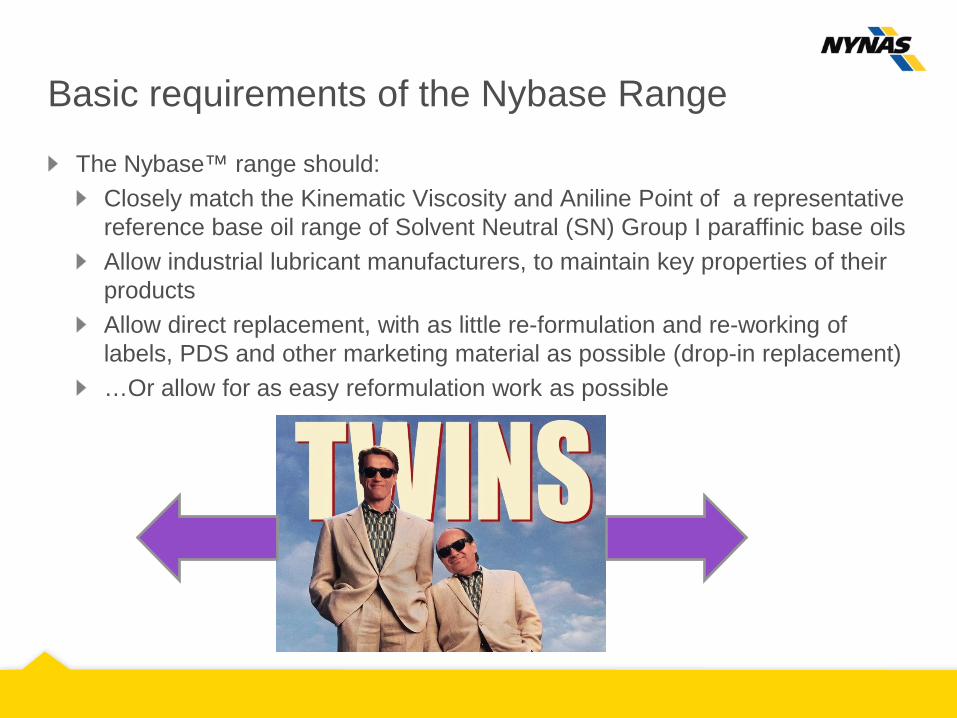
Basic requirements of the Nybase Range
The Nybase™ range should: Closely match the Kinematic Viscosity and Aniline Point of a representative reference base oil range of Solvent Neutral (SN) Group I paraffinic base oils Allow industrial lubricant manufacturers, to maintain key properties of their products Allow direct replacement, with as little re-formulation and re-working of labels, PDS and other marketing material as possible (drop-in replacement) …Or allow for as easy reformulation work as possible
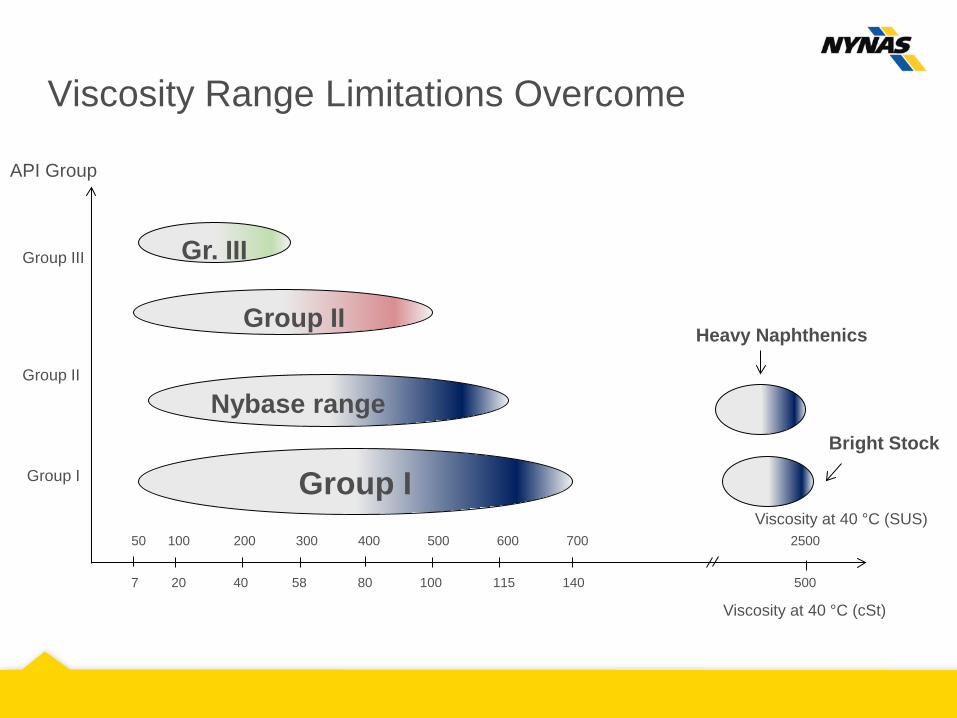
Viscosity Range Limitations Overcome
Viscosity at 40 °C (cSt)
API Group
Group III
Group II
Group I
50 100 200 300 400 500 600 700 2500
Gr. III
Group II
Group I Viscosity at 40 °C (SUS)
7 20 40 58 80 100 115 140 500
Nybase range
Heavy Naphthenics
Bright Stock
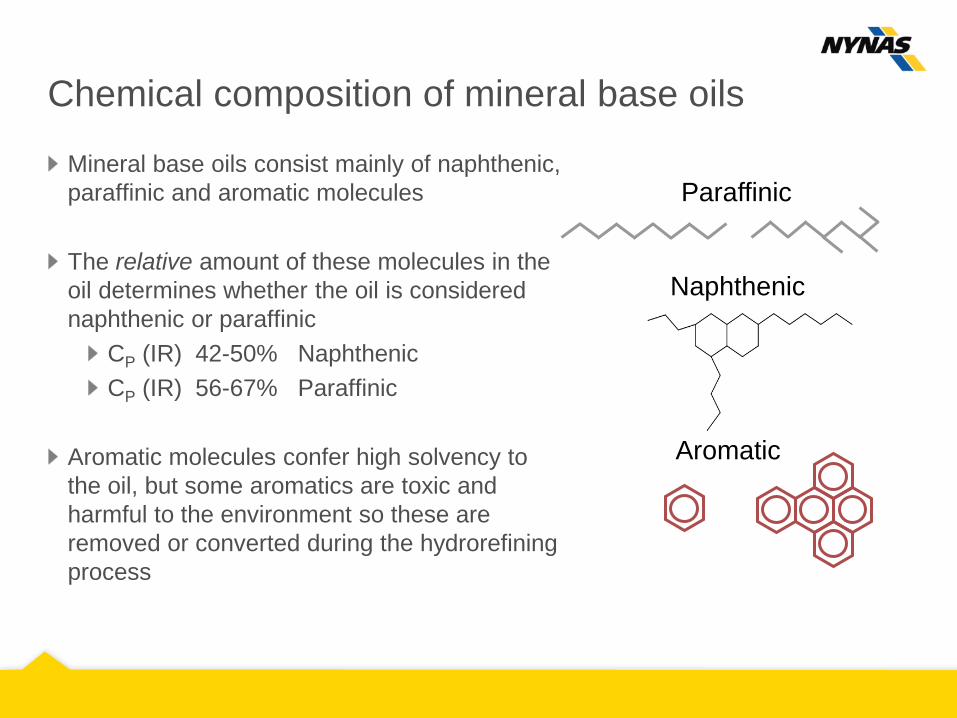
Chemical composition of mineral base oils
Mineral base oils consist mainly of naphthenic, paraffinic and aromatic molecules The relative amount of these molecules in the oil determines whether the oil is considered naphthenic or paraffinic
Aromatic molecules confer high solvency to the oil, but some aromatics are toxic and harmful to the environment so these are removed or converted during the hydrorefining process
Paraffinic
Naphthenic
Aromatic
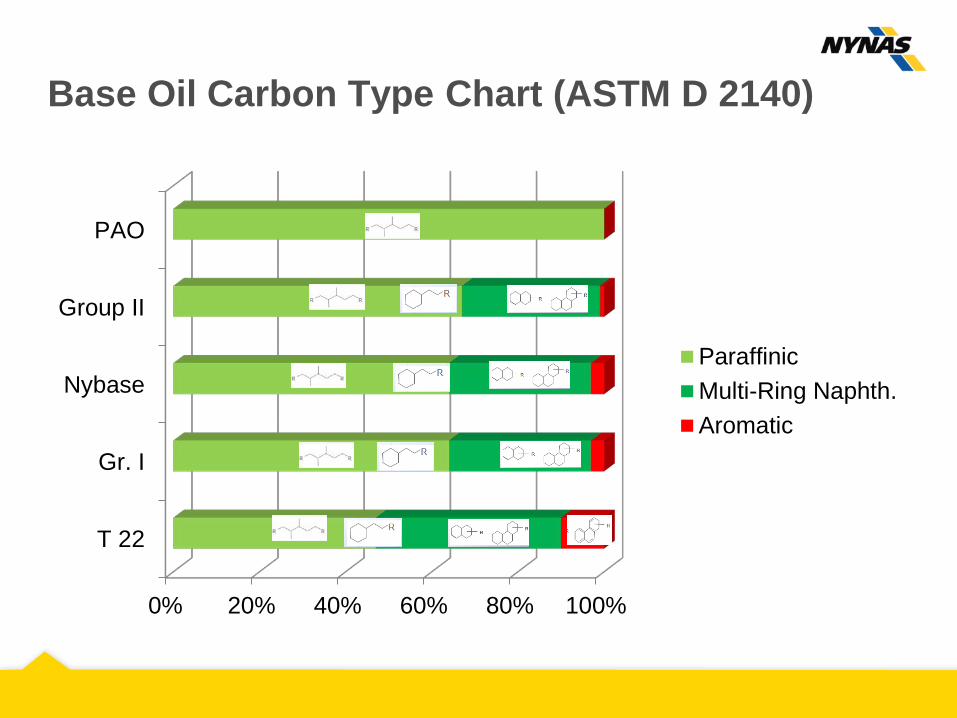
Base Oil Carbon Type Chart (ASTM D 2140)
0% 20% 40% 60% 80% 100%
T 22
Gr. I
Nybase
Group II
PAO
ParaffinicMulti-Ring Naphth.Aromatic
Aniline point
— 90ºC
— 80ºC
— 70ºC
— 60ºC
— 50ºC
— 40ºC
— 30ºC
— 20ºC
— 10ºC
— 0ºC
68ºC —
— 90ºC
— 80ºC
— 70ºC
— 60ºC
— 50ºC
— 40ºC
— 30ºC
— 20ºC
— 10ºC
— 0ºC
68ºC —
— 90ºC
— 80ºC
— 70ºC
— 60ºC
— 50ºC
— 40ºC
— 30ºC
— 20ºC
— 10ºC
— 0ºC
68ºC —
— 90ºC
— 80ºC
— 70ºC
— 60ºC
— 50ºC
— 40ºC
— 30ºC
— 20ºC
— 10ºC
— 0ºC
68ºC —
Aniline point
Aniline is a polar solvent The lower the “Aniline Point” temperature:
The more ”polar” the oil… The higher the solvent power
— 140ºC
— 130ºC
— 120ºC
— 110ºC
— 100ºC
— 90ºC
— 80ºC
— 70ºC
— 60ºC
— 50ºC
— 40ºC
— 30ºC
— 20ºC
Aromatic oils
Naphthenic oils
Paraffinic oils
Increasing solvent power
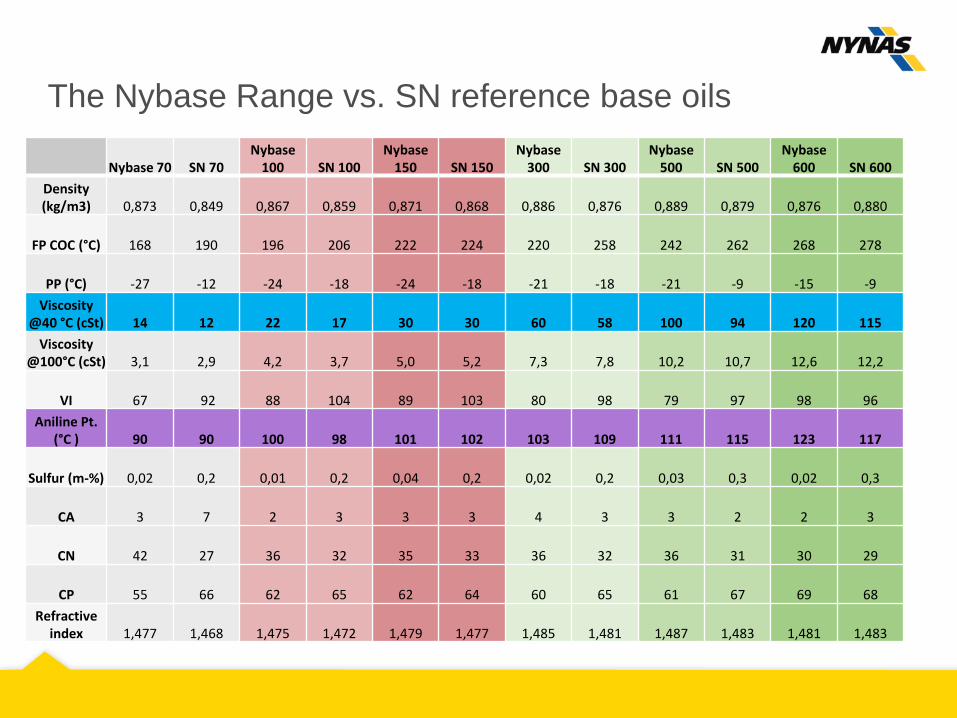
The Nybase Range vs. SN reference base oils
The Nybase Range vs. SN reference base oils
Nybase 70 SN 70 Nybase
100 SN 100 Nybase
150 SN 150 Nybase
300 SN 300 Nybase
500 SN 500 Nybase
600 SN 600 Density (kg/m3) 0,873 0,849 0,867 0,859 0,871 0,868 0,886 0,876 0,889 0,879 0,876 0,880
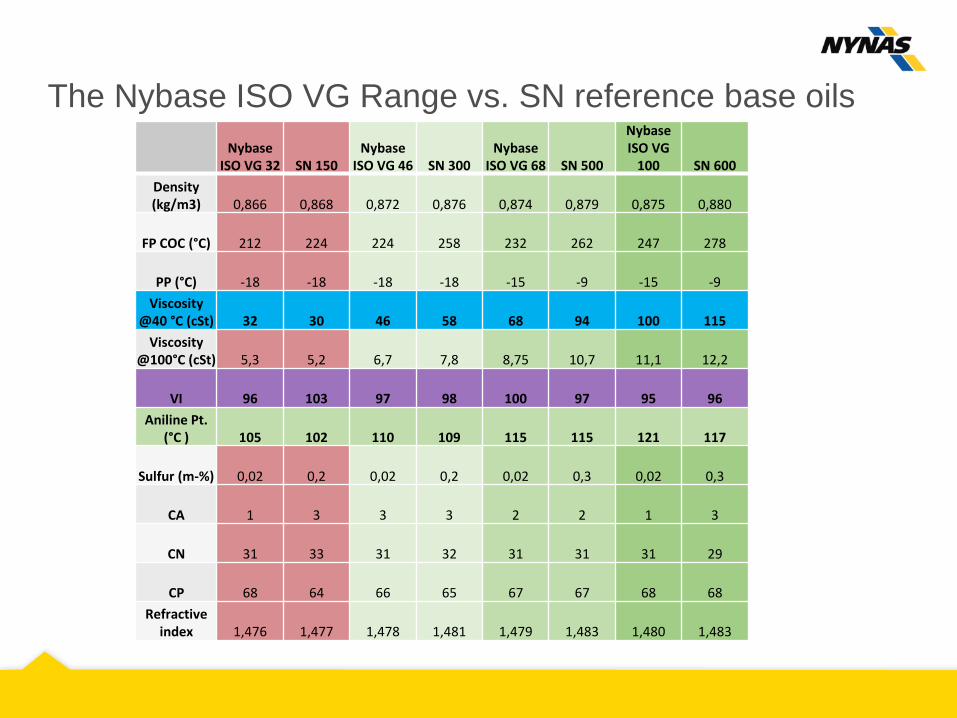
The Nybase ISO VG Range vs. SN reference base oils
Nybase
ISO VG 32 SN 150 Nybase
ISO VG 46 SN 300 Nybase
ISO VG 68 SN 500
Nybase ISO VG
100 SN 600 Density (kg/m3) 0,866 0,868 0,872 0,876 0,874 0,879 0,875 0,880
FP COC (°C) 212 224 224 258 232 262 247 278
PP (°C) -18 -18 -18 -18 -15 -9 -15 -9 Viscosity
@40 °C (cSt) 32 30 46 58 68 94 100 115 Viscosity
@100°C (cSt) 5,3 5,2 6,7 7,8 8,75 10,7 11,1 12,2
VI 96 103 97 98 100 97 95 96 Aniline Pt.
(°C ) 105 102 110 109 115 115 121 117
Sulfur (m-%) 0,02 0,2 0,02 0,2 0,02 0,3 0,02 0,3
CA 1 3 3 3 2 2 1 3
CN 31 33 31 32 31 31 31 29
CP 68 64 66 65 67 67 68 68 Refractive
index 1,476 1,477 1,478 1,481 1,479 1,483 1,480 1,483
PPD Expression in Nybase Range
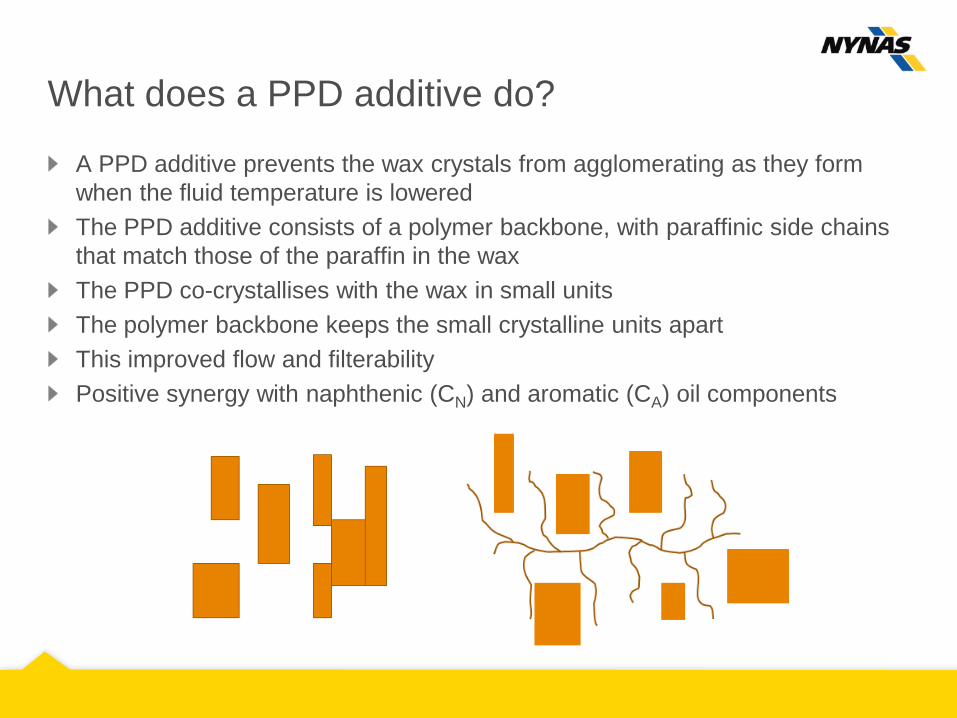
What does a PPD additive do?
A PPD additive prevents the wax crystals from agglomerating as they form when the fluid temperature is lowered The PPD additive consists of a polymer backbone, with paraffinic side chains that match those of the paraffin in the wax The PPD co-crystallises with the wax in small units The polymer backbone keeps the small crystalline units apart This improved flow and filterability Positive synergy with naphthenic (CN) and aromatic (CA) oil components
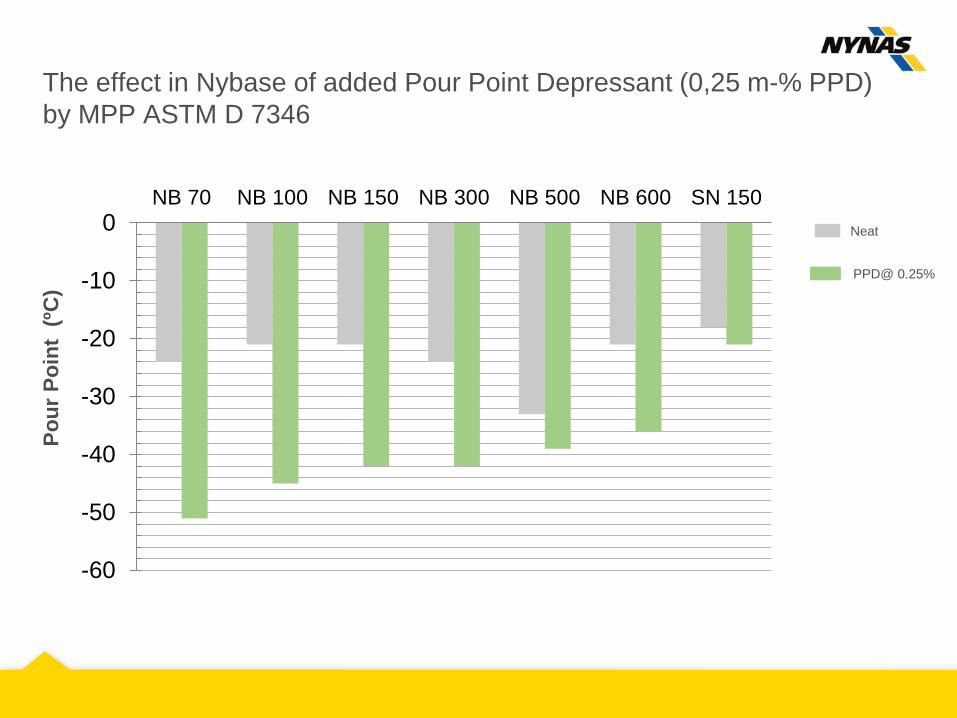
The effect in Nybase of added Pour Point Depressant (0,25 m-% PPD) by MPP ASTM D 7346
Neat
PPD@ 0.25%
-60
-50
-40
-30
-20
-10
0NB 70 NB 100 NB 150 NB 300 NB 500 NB 600 SN 150
Pour
Poi
nt (
ºC)
Naphthenic oils in industrial lubricants - Model Hydraulic Fluids based on Nybase
Formulation of Model Hydraulic Fluids I
Hydraulic fluids are mainly composed of Base oils (92-99%) An additive package (anti-oxidant, anti-wear, rust & corrosion inhibition, anti-foam) Viscosity Index Improvers (VII) (in HV only) and Pour Point Depressants (PPD)
Viscosities (KV@ 40 °C) range from 15 cSt to 100 cSt The largest market volumes are in ISO VG 46 and ISO VG 32
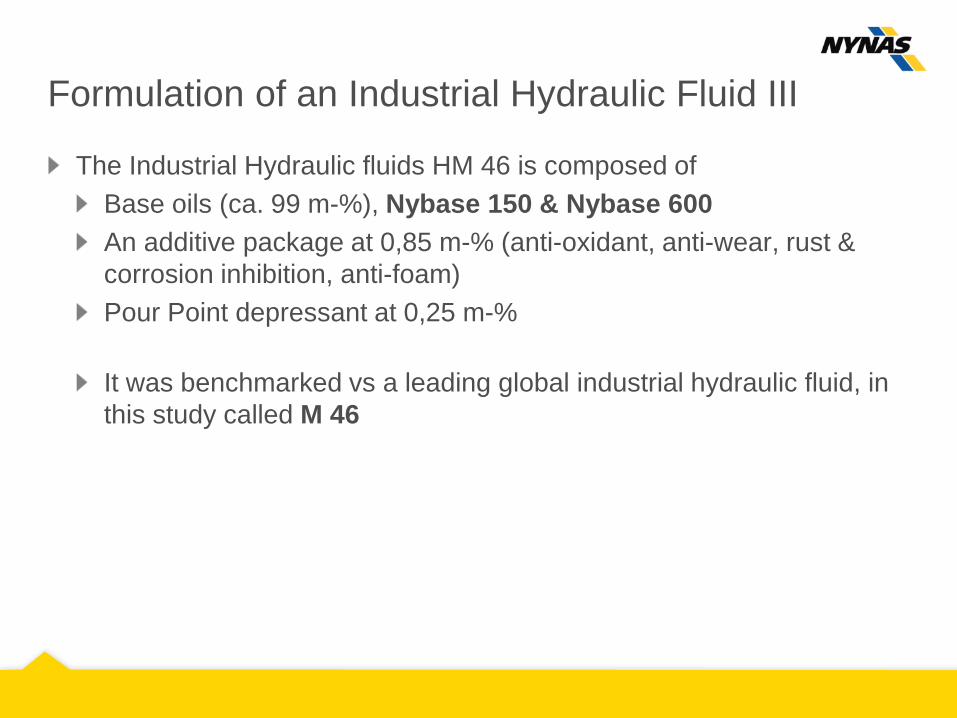
Formulation of an Industrial Hydraulic Fluid III
The Industrial Hydraulic fluids HM 46 is composed of Base oils (ca. 99 m-%), Nybase 150 & Nybase 600 An additive package at 0,85 m-% (anti-oxidant, anti-wear, rust & corrosion inhibition, anti-foam) Pour Point depressant at 0,25 m-% It was benchmarked vs a leading global industrial hydraulic fluid, in this study called M 46
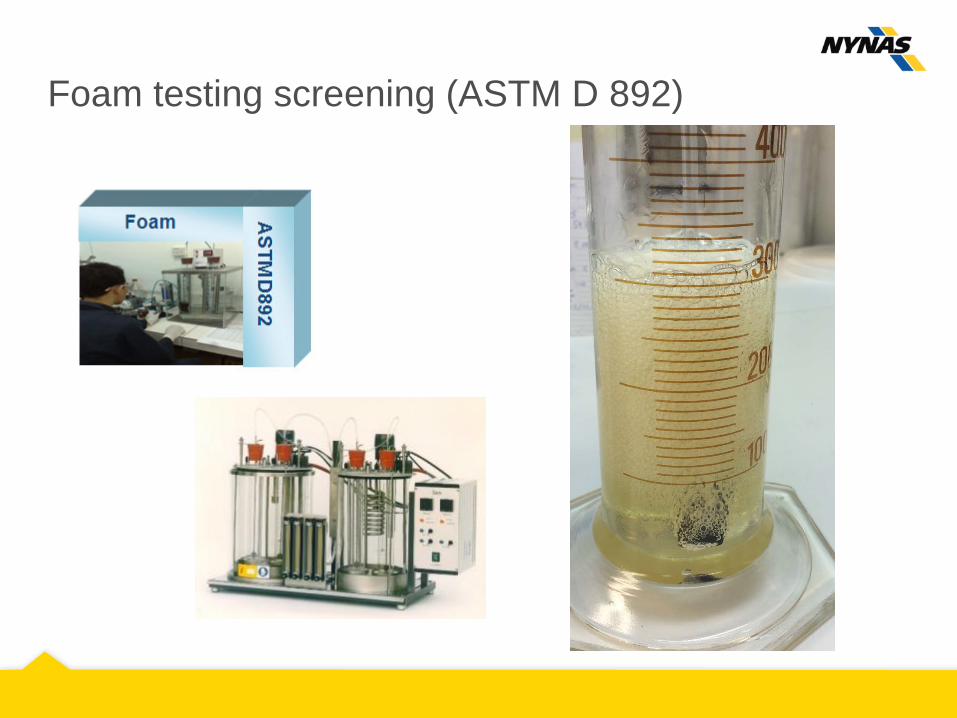
Foam testing screening (ASTM D 892)
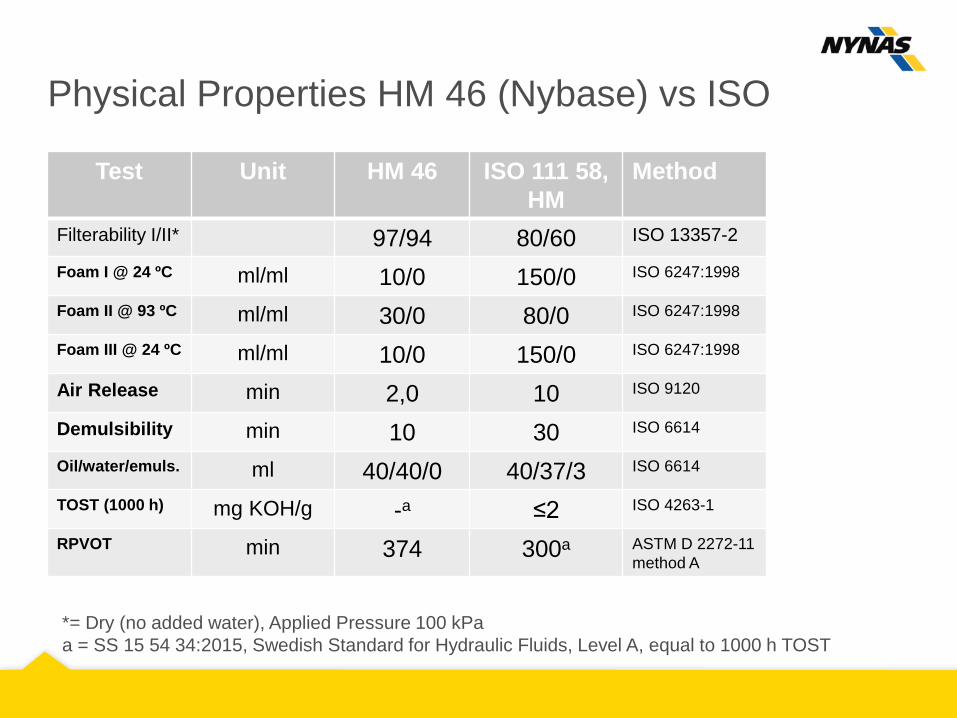
Physical Properties HM 46 (Nybase) vs ISO
Test Unit HM 46 ISO 111 58, HM
Method
Filterability I/II* 97/94 80/60 ISO 13357-2
Foam I @ 24 ºC ml/ml 10/0 150/0 ISO 6247:1998
Foam II @ 93 ºC ml/ml 30/0 80/0 ISO 6247:1998
Foam III @ 24 ºC ml/ml 10/0 150/0 ISO 6247:1998
Air Release min 2,0 10 ISO 9120
Demulsibility min 10 30 ISO 6614
Oil/water/emuls. ml 40/40/0 40/37/3 ISO 6614
TOST (1000 h) mg KOH/g -a ≤2 ISO 4263-1
RPVOT min 374 300a ASTM D 2272-11 method A
*= Dry (no added water), Applied Pressure 100 kPa a = SS 15 54 34:2015, Swedish Standard for Hydraulic Fluids, Level A, equal to 1000 h TOST
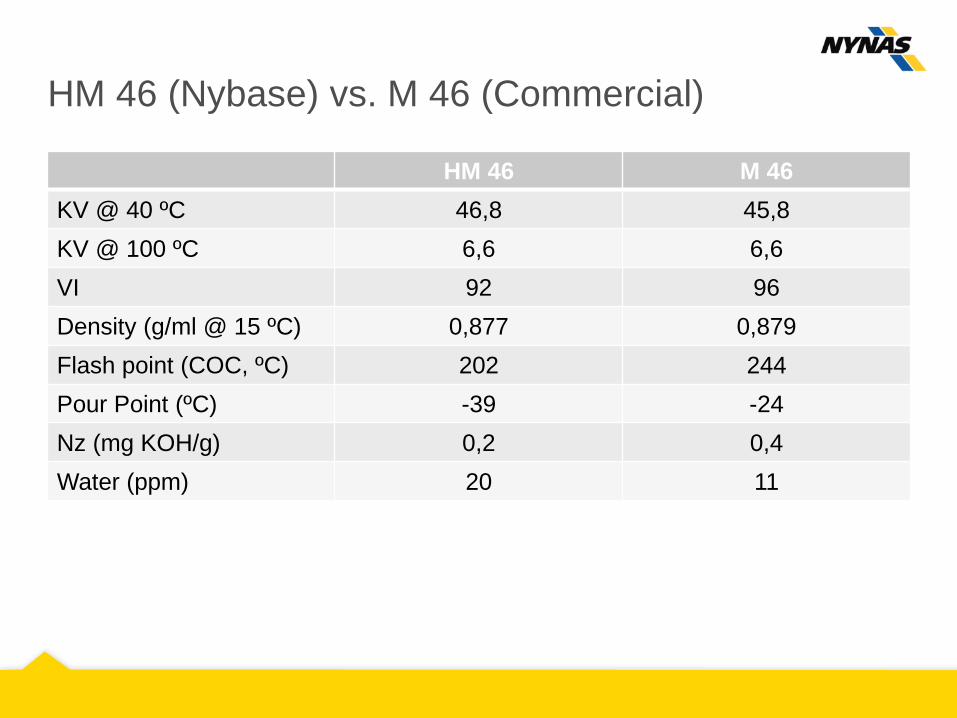
HM 46 (Nybase) vs. M 46 (Commercial)
HM 46 M 46 KV @ 40 ºC 46,8 45,8 KV @ 100 ºC 6,6 6,6 VI 92 96 Density (g/ml @ 15 ºC) 0,877 0,879 Flash point (COC, ºC) 202 244 Pour Point (ºC) -39 -24 Nz (mg KOH/g) 0,2 0,4 Water (ppm) 20 11
HM 46 (Nybase) vs. M 46 (Commercial)
ICP* HM 46 M 46 Ca 39 34 P 327 235 S 849** 2472*** Zn 418 259
* = Elemental Analysis by ICP ASTM D5185 ** = Base oil Sulfur contribution ca 300 ppm *** = Base oil Sulfur contribution significantly higher
Formulation of an Industrial Hydraulic Fluid IV
The Industrial Hydraulic fluids HM2 46 is composed of Base oils (ca. 99 m-%), Nybase ISO VG 46 An additive package at 0,85 m-% (anti-oxidant, anti-wear, rust & corrosion inhibition, anti-foam) Pour Point depressant at 0,25 m-% It was benchmarked vs a leading global industrial hydraulic fluid, in this study called M 46
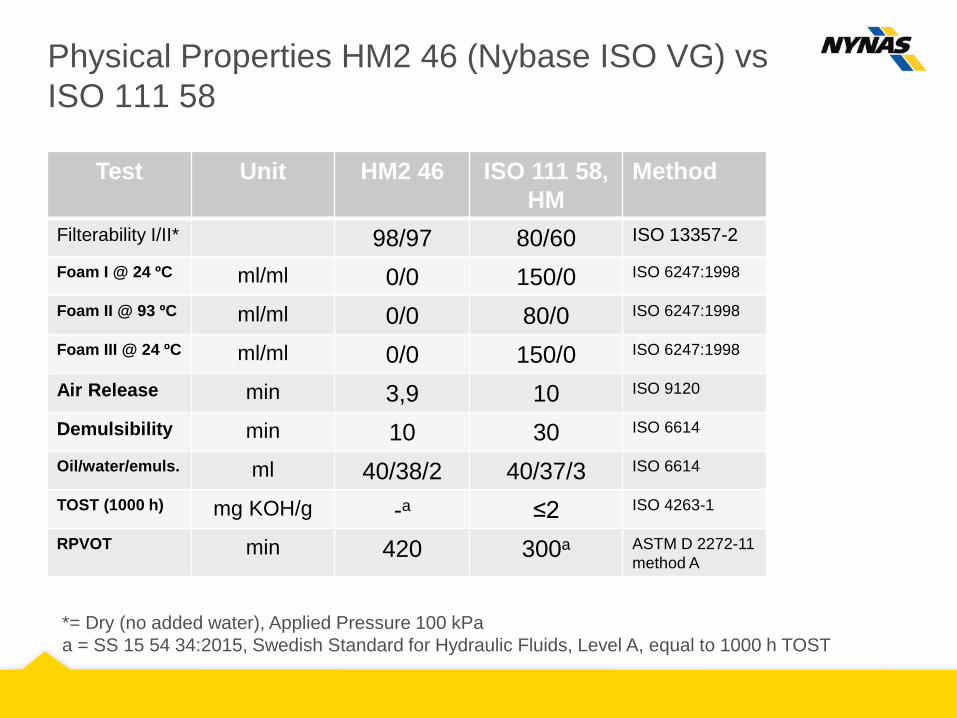
Physical Properties HM2 46 (Nybase ISO VG) vs ISO 111 58
Test Unit HM2 46 ISO 111 58, HM
Method
Filterability I/II* 98/97 80/60 ISO 13357-2
Foam I @ 24 ºC ml/ml 0/0 150/0 ISO 6247:1998
Foam II @ 93 ºC ml/ml 0/0 80/0 ISO 6247:1998
Foam III @ 24 ºC ml/ml 0/0 150/0 ISO 6247:1998
Air Release min 3,9 10 ISO 9120
Demulsibility min 10 30 ISO 6614
Oil/water/emuls. ml 40/38/2 40/37/3 ISO 6614
TOST (1000 h) mg KOH/g -a ≤2 ISO 4263-1
RPVOT min 420 300a ASTM D 2272-11 method A
*= Dry (no added water), Applied Pressure 100 kPa a = SS 15 54 34:2015, Swedish Standard for Hydraulic Fluids, Level A, equal to 1000 h TOST
HM 46 (Nybase ISO VG) vs. M 46 (Commercial)
HM2 46 M 46 KV @ 40 ºC 46,2 45,8 KV @ 100 ºC 6,75 6,6 VI 100 96 Density (g/ml @ 15 ºC) 0,873 0,879 Flash point (COC, ºC) 226 244 Pour Point (ºC) -39 -24 Nz (mg KOH/g) 0,4 0,4 Water (ppm) 43 11
Physical Properties HM2 46 (Nybase ISO VG) vs ISO 111 58
Test Unit HM2 46 ISO 111 58, HM
Method
Filterability I/II* 98/97 80/60 ISO 13357-2
Foam I @ 24 ºC ml/ml 0/0 150/0 ISO 6247:1998
Foam II @ 93 ºC ml/ml 0/0 80/0 ISO 6247:1998
Foam III @ 24 ºC ml/ml 0/0 150/0 ISO 6247:1998
Air Release min 3,9 10 ISO 9120
Demulsibility min 10 30 ISO 6614
Oil/water/emuls. ml 40/38/2 40/37/3 ISO 6614
TOST (1000 h) mg KOH/g -a ≤2 ISO 4263-1
RPVOT min 420 300a ASTM D 2272-11 method A
*= Dry (no added water), Applied Pressure 100 kPa a = SS 15 54 34:2015, Swedish Standard for Hydraulic Fluids, Level A, equal to 1000 h TOST
Conclusion of the Formulation & Miscibility study
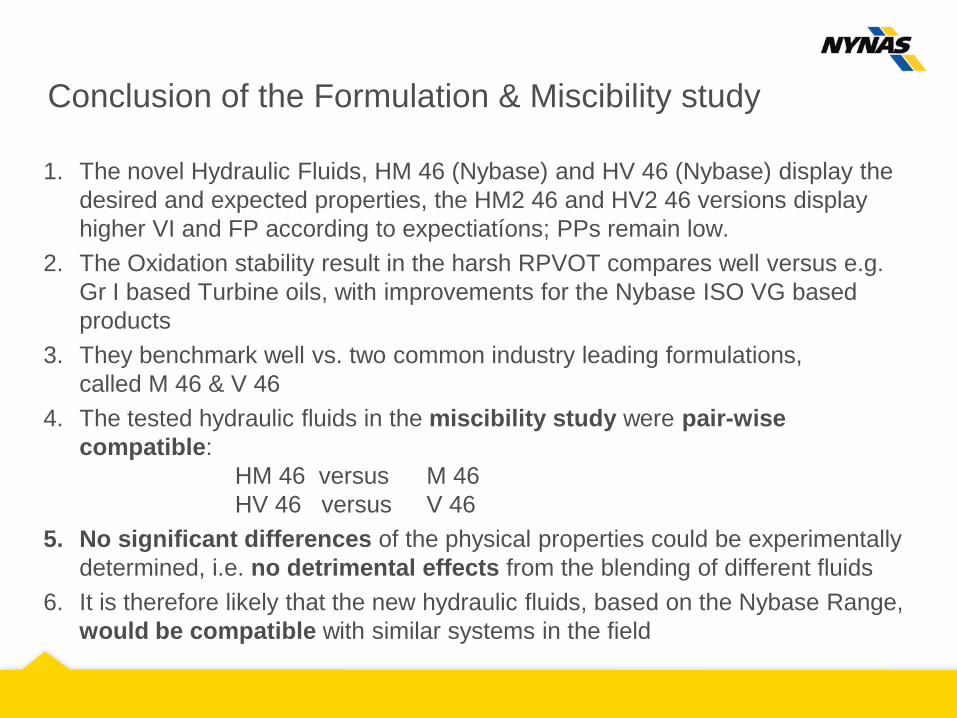
1. The novel Hydraulic Fluids, HM 46 (Nybase) and HV 46 (Nybase) display the desired and expected properties, the HM2 46 and HV2 46 versions display higher VI and FP according to expectiatíons; PPs remain low.
2. The Oxidation stability result in the harsh RPVOT compares well versus e.g. Gr I based Turbine oils, with improvements for the Nybase ISO VG based products
3. They benchmark well vs. two common industry leading formulations, called M 46 & V 46
4. The tested hydraulic fluids in the miscibility study were pair-wise compatible: HM 46 versus M 46 HV 46 versus V 46
5. No significant differences of the physical properties could be experimentally determined, i.e. no detrimental effects from the blending of different fluids
6. It is therefore likely that the new hydraulic fluids, based on the Nybase Range, would be compatible with similar systems in the field
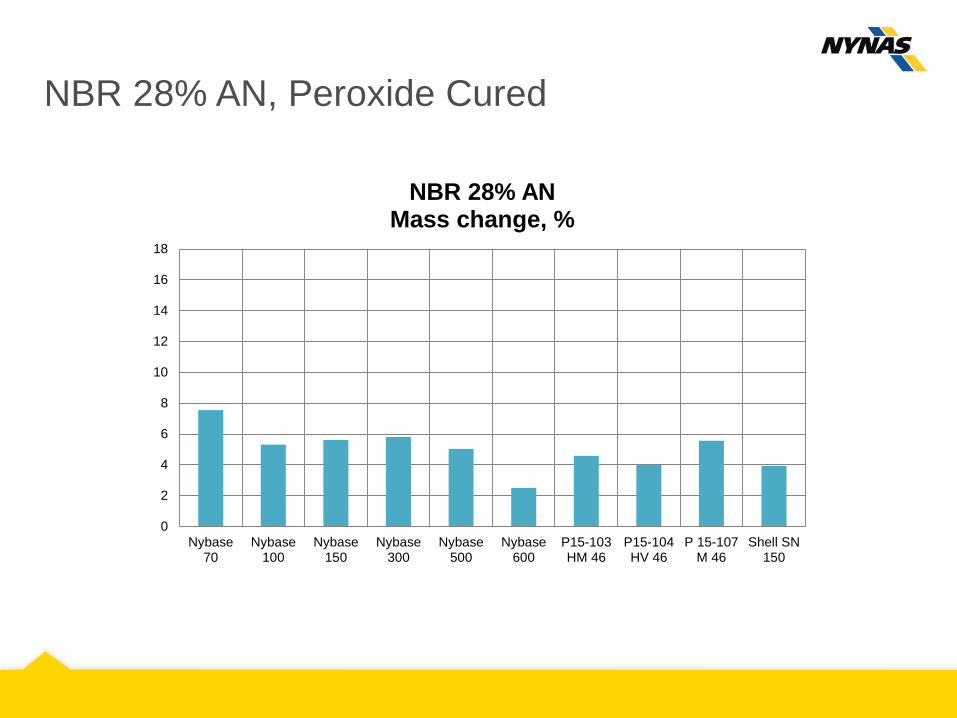
Elastomer Compatibility of the Nybase Range
Elastomer sealant material compatibility study
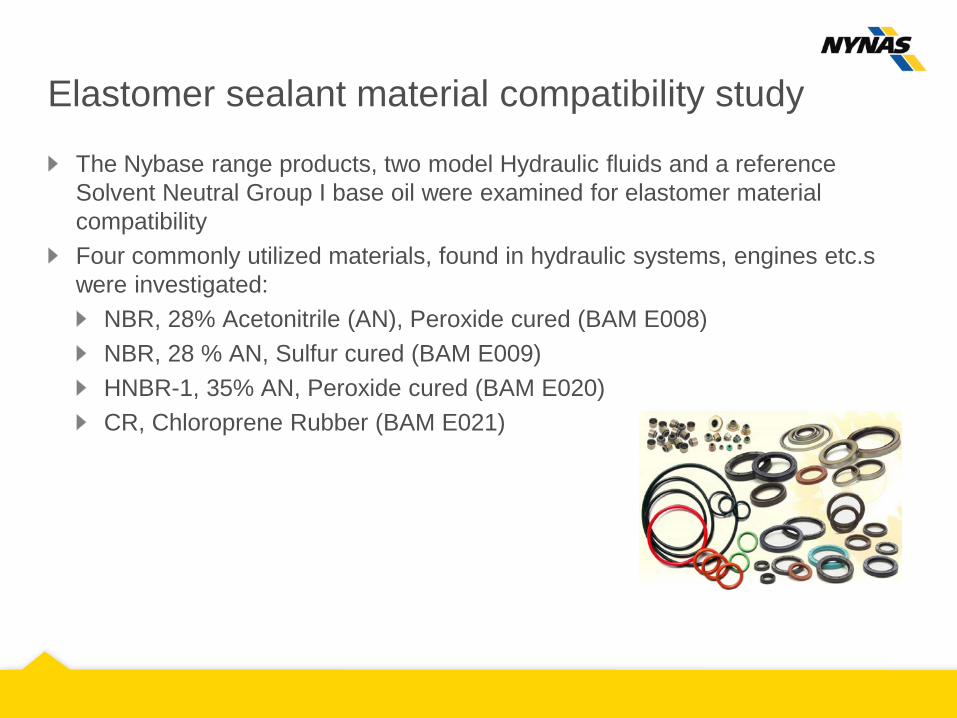
The Nybase range products, two model Hydraulic fluids and a reference Solvent Neutral Group I base oil were examined for elastomer material compatibility Four commonly utilized materials, found in hydraulic systems, engines etc.s were investigated:
The test specimen were immersed in oil at 100 °C for 168 h (one week) Changes were recorded for
Mass (increasing or decreasing) Hardness (increasing or decreasing)
Shore A method (Durometer acc. to ASTM D2240 A)
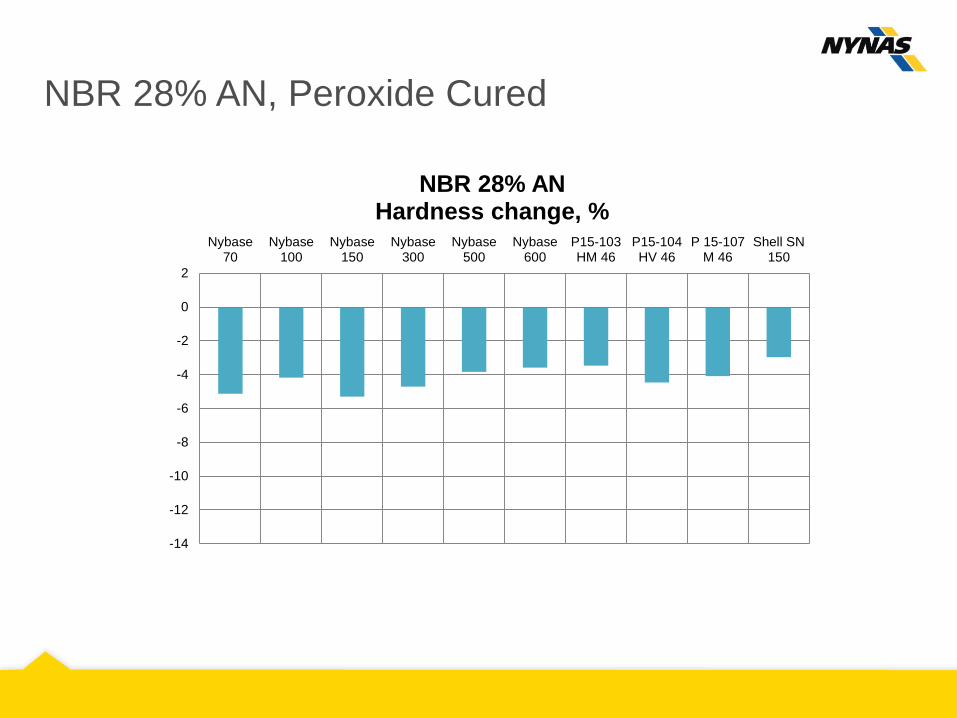
NBR 28% AN, Peroxide Cured
-14
-12
-10
-8
-6
-4
-2
0
2
Nybase70
Nybase100
Nybase150
Nybase300
Nybase500
Nybase600
P15-103HM 46
P15-104HV 46
P 15-107M 46
Shell SN150
NBR 28% AN Hardness change, %
NBR 28% AN, Peroxide Cured
0
2
4
6
8
10
12
14
16
18
Nybase70
Nybase100
Nybase150
Nybase300
Nybase500
Nybase600
P15-103HM 46
P15-104HV 46
P 15-107M 46
Shell SN150
NBR 28% AN Mass change, %
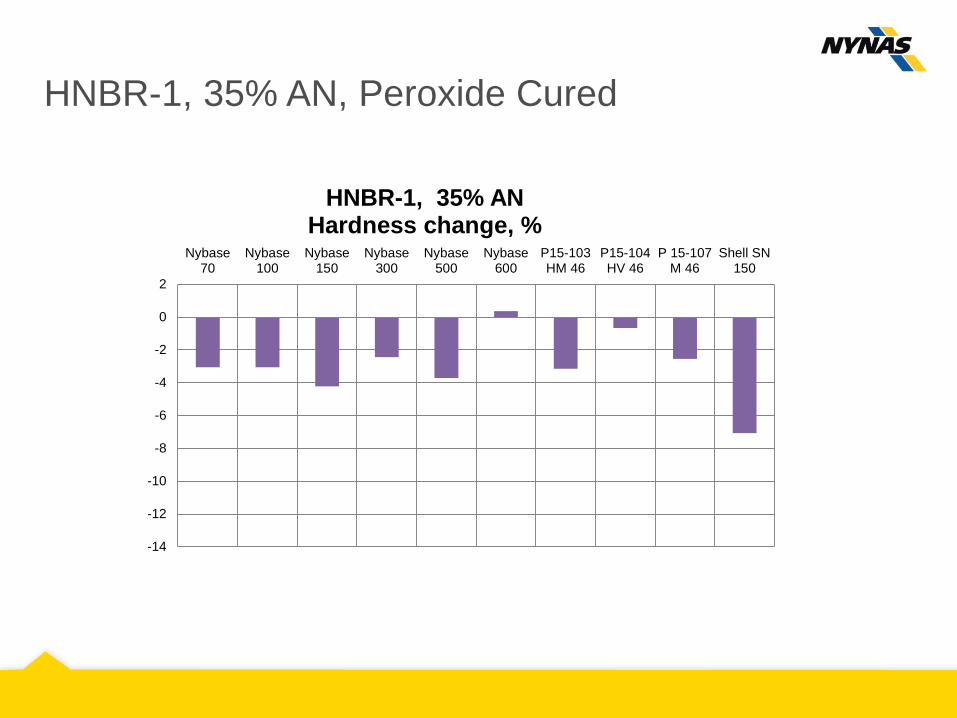
HNBR-1, 35% AN, Peroxide Cured
-14
-12
-10
-8
-6
-4
-2
0
2
Nybase70
Nybase100
Nybase150
Nybase300
Nybase500
Nybase600
P15-103HM 46
P15-104HV 46
P 15-107M 46
Shell SN150
HNBR-1, 35% AN Hardness change, %
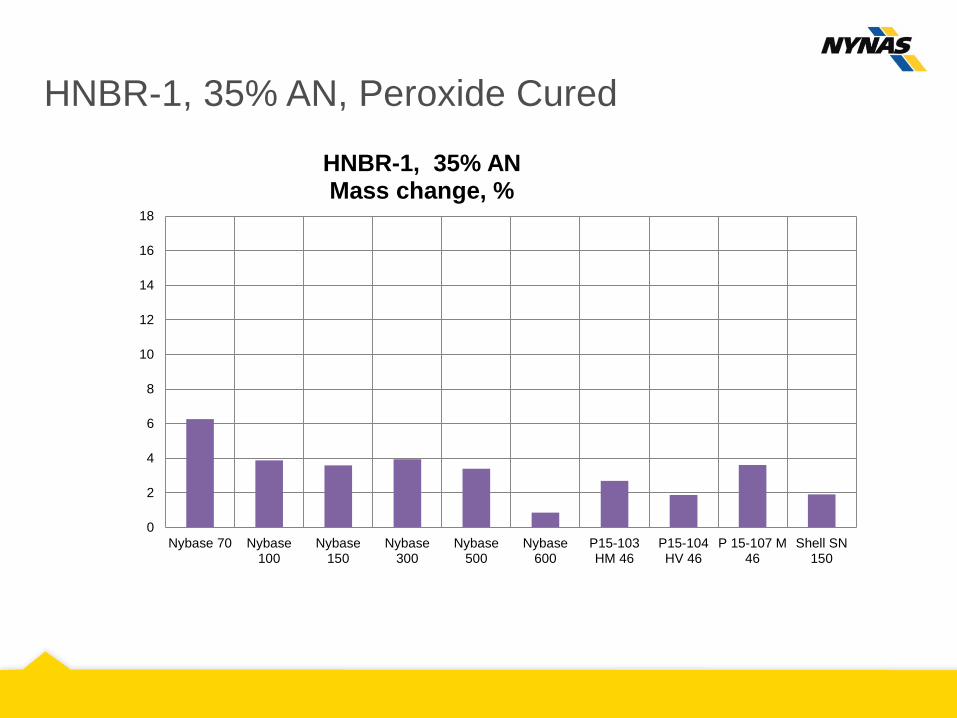
HNBR-1, 35% AN, Peroxide Cured
0
2
4
6
8
10
12
14
16
18
Nybase 70 Nybase100
Nybase150
Nybase300
Nybase500
Nybase600
P15-103HM 46
P15-104HV 46
P 15-107 M46
Shell SN150
HNBR-1, 35% AN Mass change, %
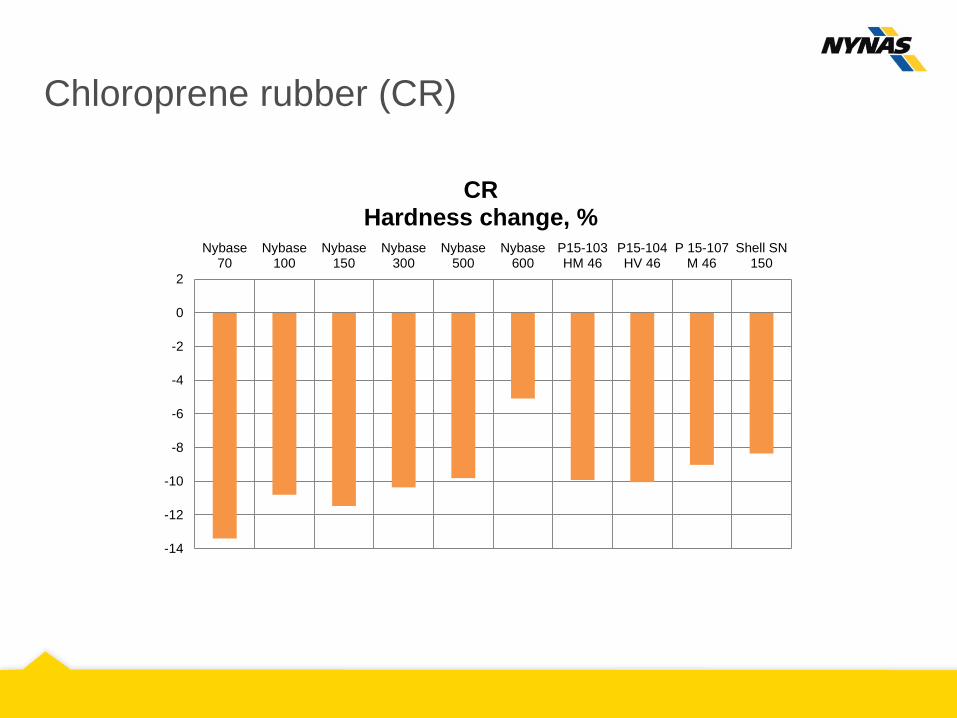
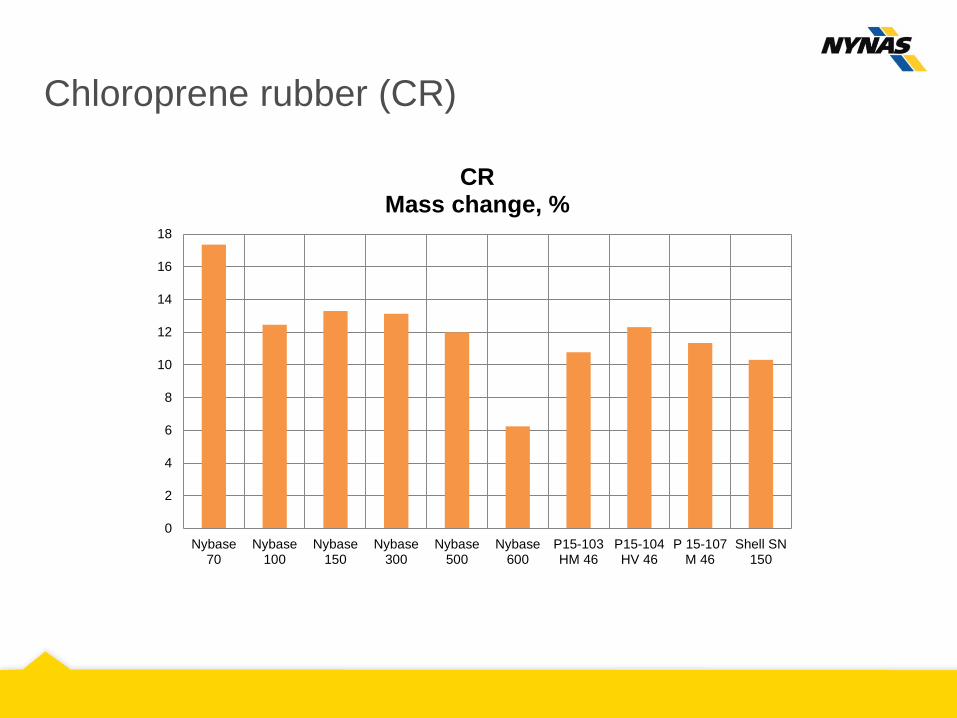
Chloroprene rubber (CR)
-14
-12
-10
-8
-6
-4
-2
0
2
Nybase70
Nybase100
Nybase150
Nybase300
Nybase500
Nybase600
P15-103HM 46
P15-104HV 46
P 15-107M 46
Shell SN150
CR Hardness change, %
Chloroprene rubber (CR)
0
2
4
6
8
10
12
14
16
18
Nybase70
Nybase100
Nybase150
Nybase300
Nybase500
Nybase600
P15-103HM 46
P15-104HV 46
P 15-107M 46
Shell SN150
CR Mass change, %
Some preliminary conclusions
All the Nybase Range fluids, and the model hydraulic fluids based on these, display the expected behaviour Seal material mass change and hardness change remains low across the NBR test series The compatibility with CR is, expectedly, slightly lower, as CR is better suited for more non-polar fluids with higher Aniline points Seal compatibility equals that of the reference fluids
One SN 150 Group I base oil One fully formulated industrial hydraulic fluid
This screening serves a s good indication for no-harm also in this respect
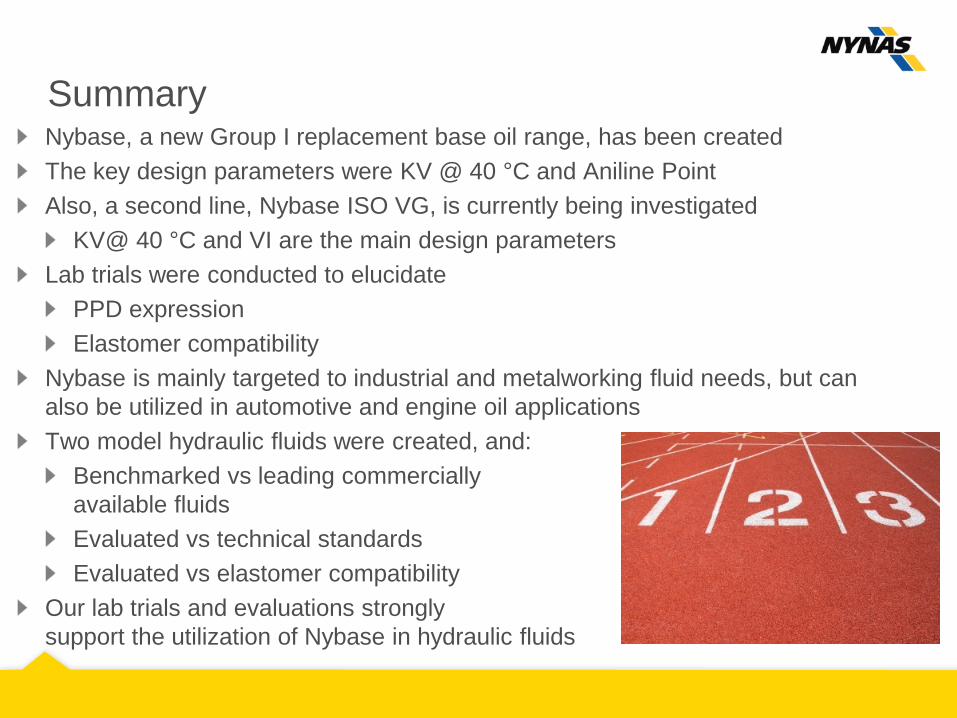
Summary Nybase, a new Group I replacement base oil range, has been created The key design parameters were KV @ 40 °C and Aniline Point Also, a second line, Nybase ISO VG, is currently being investigated
KV@ 40 °C and VI are the main design parameters Lab trials were conducted to elucidate
PPD expression Elastomer compatibility
Nybase is mainly targeted to industrial and metalworking fluid needs, but can also be utilized in automotive and engine oil applications Two model hydraulic fluids were created, and:
Benchmarked vs leading commercially available fluids Evaluated vs technical standards Evaluated vs elastomer compatibility
Our lab trials and evaluations strongly support the utilization of Nybase in hydraulic fluids
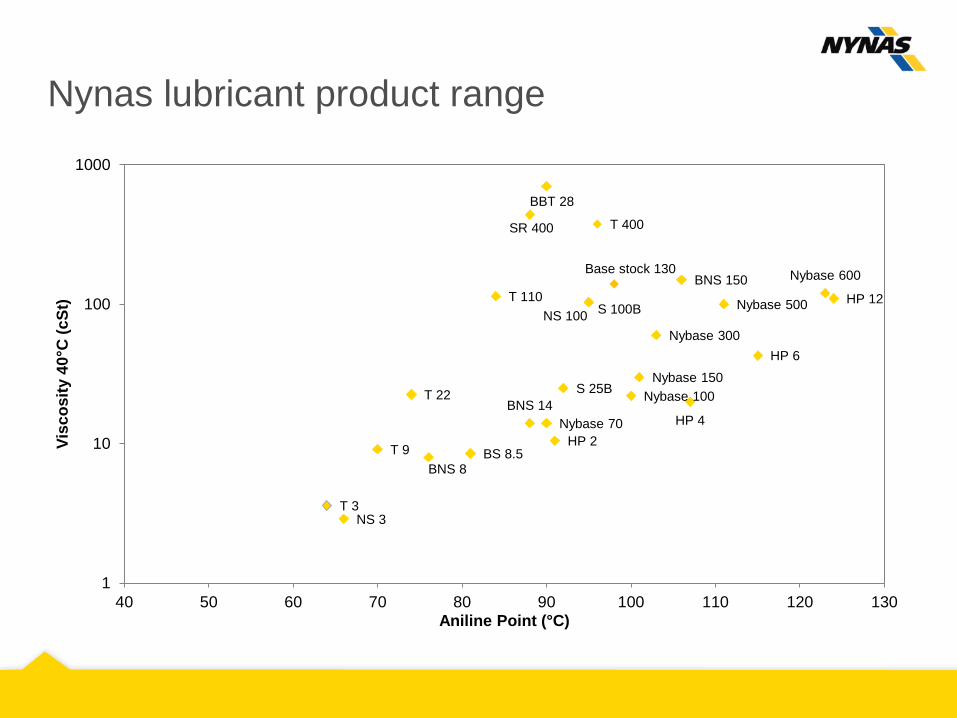
Nynas lubricant product range
T 3 NS 3
T 9
T 22
BNS 8 BS 8.5
T 110
T 400
BBT 28
NS 100 S 100B
S 25B BNS 14
BNS 150
HP 2 HP 4
HP 6
HP 12
SR 400
Base stock 130
Nybase 70
Nybase 100 Nybase 150
Nybase 300
Nybase 500
Nybase 600
1
10
100
1000
40 50 60 70 80 90 100 110 120 130
Visc
osity
40°
C (c
St)
Aniline Point (°C)
Nynas Group Head Office P.O. Box 10700 SE-121 29 Stockholm Sweden Tel. +46-8-602 12 00 Fax +46-8-91 34 27 [email protected]