Trends in the Marketing of Fresh Produce and Fresh-Cut/ Value-added Produce DR. ROBERTA COOK Dept. of Ag and Resource Economics Cooperative Extension Specialist University of California Davis April 2015 [email protected]
Transcript
Trends in the Marketing of
Fresh Produce and Fresh-Cut/ Value-added Produce
DR. ROBERTA COOK Dept. of Ag and Resource Economics
Cooperative Extension Specialist University of California Davis
• Aftermath of great recession • Overview of fresh-cut produce market • Lettuce, leafy greens and bag salads • Value-added fruit • Fresh-cut (value-added) vegetables • Branded vs private label • Consumer trends • Conclusions
U.S. Fresh Fruit and Vegetable1 Value Chain, Estimated Dollar Sales, Billions, 2010
institutional wholesalers food service
establishments
supermarkets and other retail outlets
consumers
exports
farms shippers Retailer distribution
centers
produce and general-line wholesalers
farm & public markets
imports
$6.1 $26.82
$12.3
$51.157
$122.132 $69.175
$1.800 Sources: Compilations by Kristen Park, Roberta Cook, and Edward McLaughlin based on U.S. Retail Census, ERS/USDA, NASS/USDA, U.S. Department of Commerce, and other data.
1 Excludes nuts and pulses
Top 5 US Fresh Market Vegetable States* in 2014: Geographic concentration of production (due to climate) limits local sourcing potential, yet it is growing in the summer/fall
Source: Vegetables 2014 Summary, USDA/NASS, January 2015
Area Harvested Production Value
State % of Total
State
% of Total
State
% of Total
CA 47 CA 52 CA 60 FL 10 AZ 8 FL 10 AZ 7 FL 7 AZ 6 GA 6 WA 4 GA 4 NY 4 GA 4 NY 3
Other 28 Other 25 Other 18 *Excludes potatoes
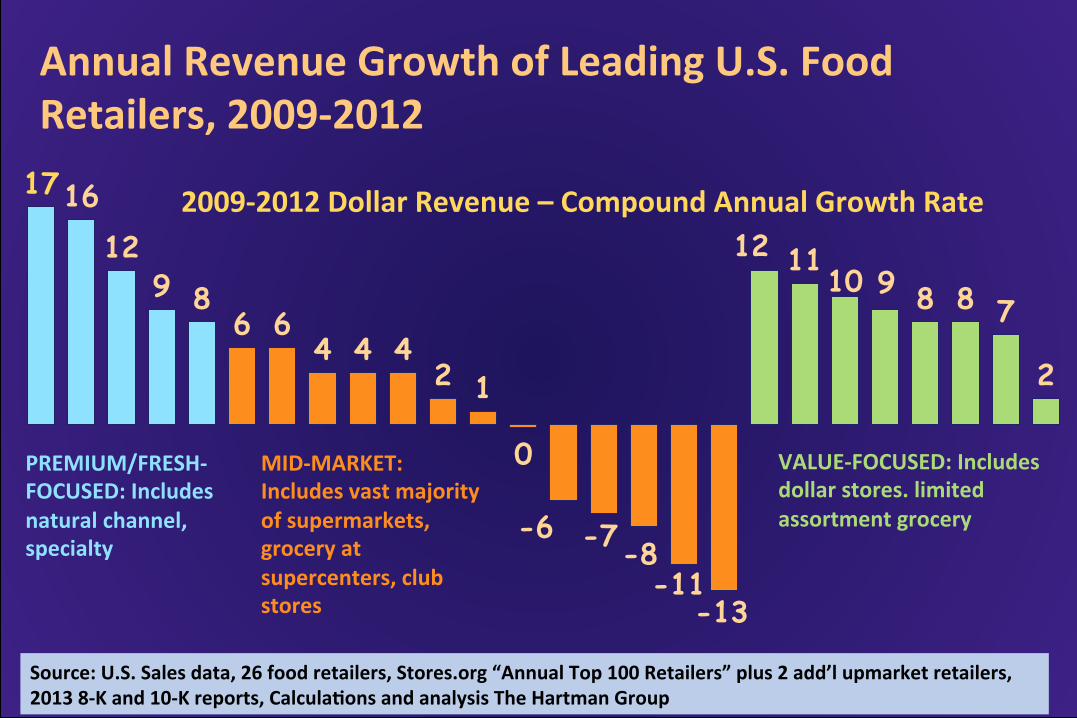
Annual Revenue Growth of Leading U.S. Food Retailers, 2009-‐2012
Source: U.S. Sales data, 26 food retailers, Stores.org “Annual Top 100 Retailers” plus 2 add’l upmarket retailers, 2013 8-‐K and 10-‐K reports, CalculaNons and analysis The Hartman Group
17 16 12
9 8 6 6
4 4 4 2 1
0
-6 -7 -8 -11
-13
12 11 10 9 8 8 7
2
PREMIUM/FRESH-‐FOCUSED: Includes natural channel, specialty
MID-‐MARKET: Includes vast majority of supermarkets, grocery at supercenters, club stores
VALUE-‐FOCUSED: Includes dollar stores. limited assortment grocery
2009-‐2012 Dollar Revenue – Compound Annual Growth Rate
USA Select Supermarket* Fresh Produce Dept. Performance During the Economic Downturn/Recovery, % Change v. Prior Yr
2008 2009 2010
Sources: Various sources of scanner data. 2014 is fruit and veg sales only, excludes non fruit/veg sales in produce dept like salad dressings, croutons, nuts, etc. Note: Not same store sales and the store universes change over time so exercise caution when making annual comparisons.
*As of 2013, includes Walmart Supercenters, Sam’s Club and Target.
3.3
-2.5
3.2 4.3 4.8
3.2
-3.6
2.0 1.5
-1.1
0.2 0.5
$Sales Quantity
2011 2013 2014
The economic downturn accelerates pace of change in the food marketing system
• More than originating new trends, it intensified pre-existing forces, such as channel blurring.
• Margin pressure at all levels of the food system! • Many produce suppliers facing lower profits. • Growing food safety, traceability and
sustainability expectations all increase costs. • Need for major investments in info tech systems. • Foodservice took a huge hit, hurting fresh-cut. • Mergers are up (retailers, foodservice, shippers).
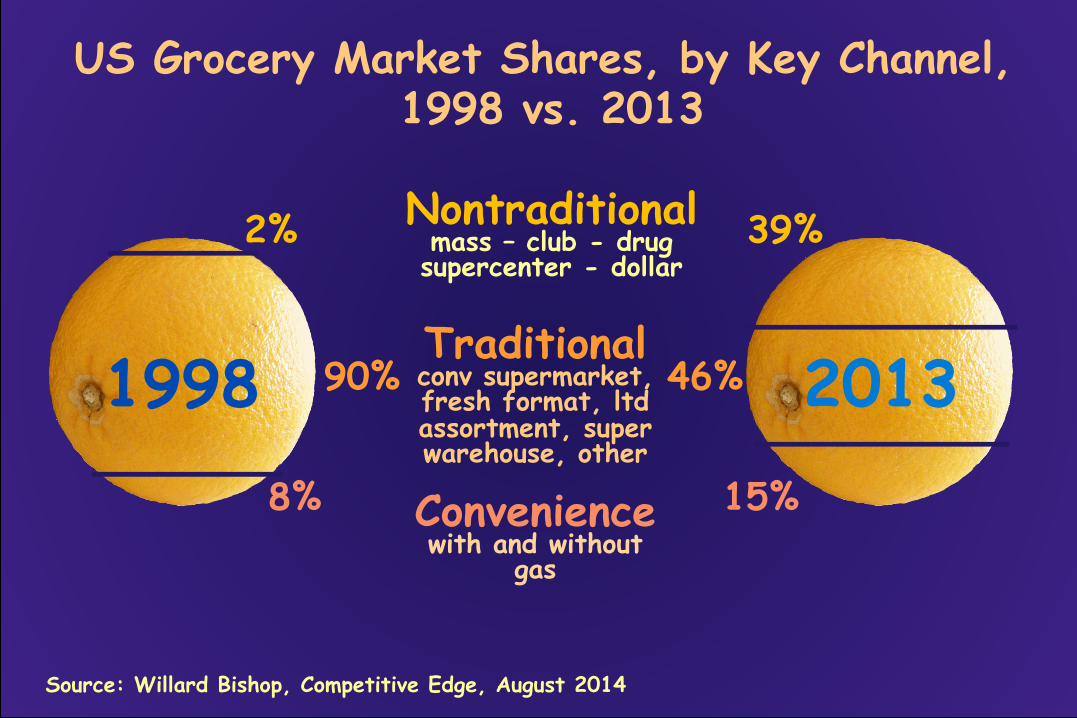
US Grocery Market Shares, by Key Channel, 1998 vs. 2013
Source: Willard Bishop, Competitive Edge, August 2014
15%
39%
46% 90%
8%
2% Nontraditional mass – club - drug supercenter - dollar
Traditional conv supermarket, fresh format, ltd assortment, super warehouse, other
Convenience with and without
gas
2013 1998
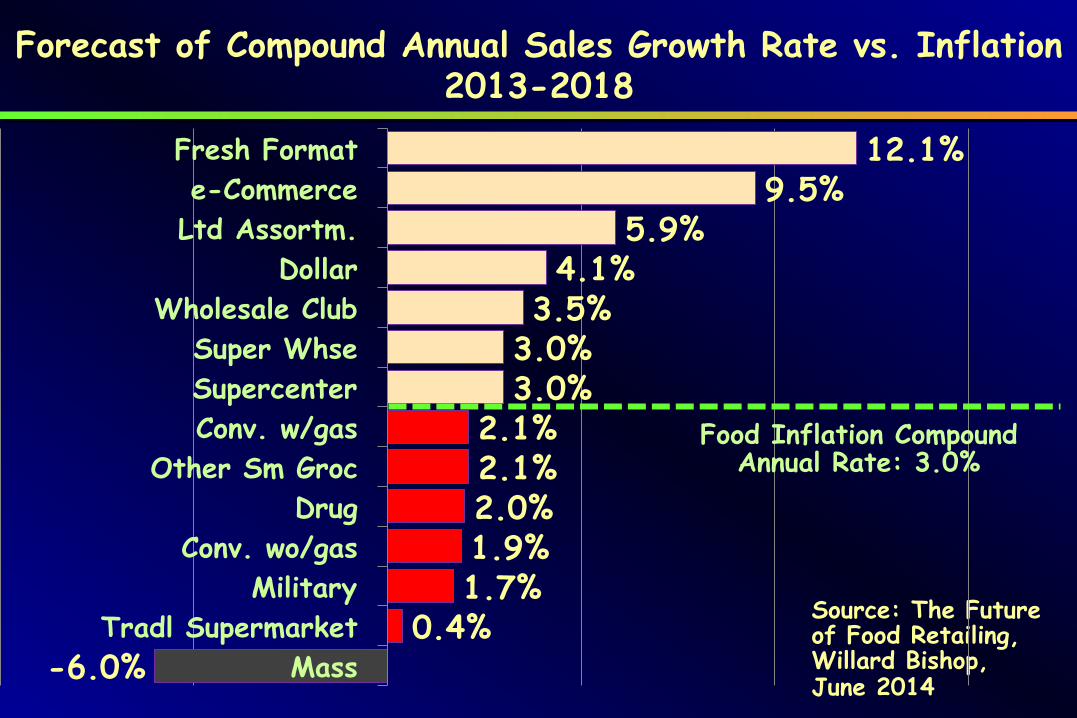
Forecast of Compound Annual Sales Growth Rate vs. Inflation 2013-2018
Source: The Future of Food Retailing, Willard Bishop, June 2014 -6.0%
0.4% 1.7% 1.9% 2.0% 2.1% 2.1%
3.0% 3.0% 3.5% 4.1%
5.9% 9.5%
12.1%
Mass Tradl Supermarket
Military Conv. wo/gas
Drug Other Sm Groc
Conv. w/gas Supercenter Super Whse
Wholesale Club Dollar
Ltd Assortm. e-Commerce
Fresh Format
Food Inflation Compound Annual Rate: 3.0%
3.2
12.0 7.8
10.9
17.3 17.2
0.5
9.7
5.0
10.7 12.5
17.2
Weekly $ sales/store
Weekly quantity sold/store Organic Fruit
Organic Veg
Fresh-cut, Organic and Total Fresh Fruit and Vegetable Sales in Key US Food Retailers, % Change 2014 vs 2013
All FruitVeg*
Freshcut Fruit**
Salads
Fresh Cut Veg
*Excludes other produce (such as salad dressings, toppings, etc.), which is 10% of produce dept sales dollars and 5% of quantity. ** Excludes overwrap.
Source: FreshFacts® on Retail, Whole and Fresh Cut Produce Trends: 2014, United Fresh Produce Association and Nielsen, March 2015. Fresh Coverage Area (FCA) incl key retailers from food, mass/supercenter and club chains, or more than 18,000 stores. It includes UPC, random weight and retailer assigned codes.
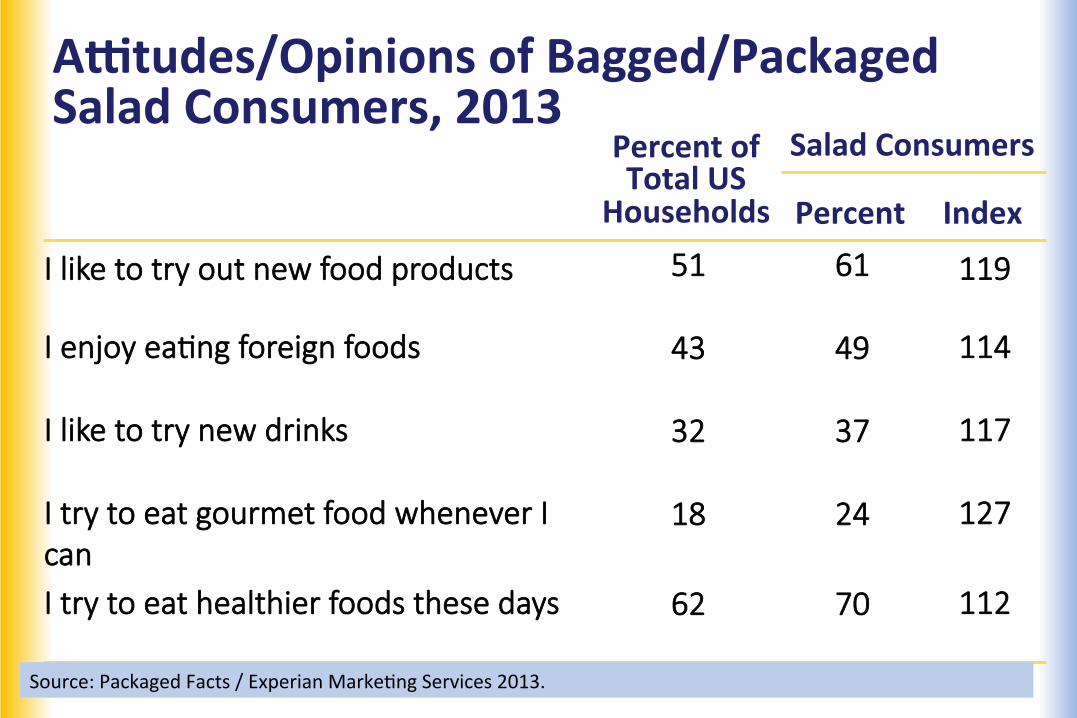
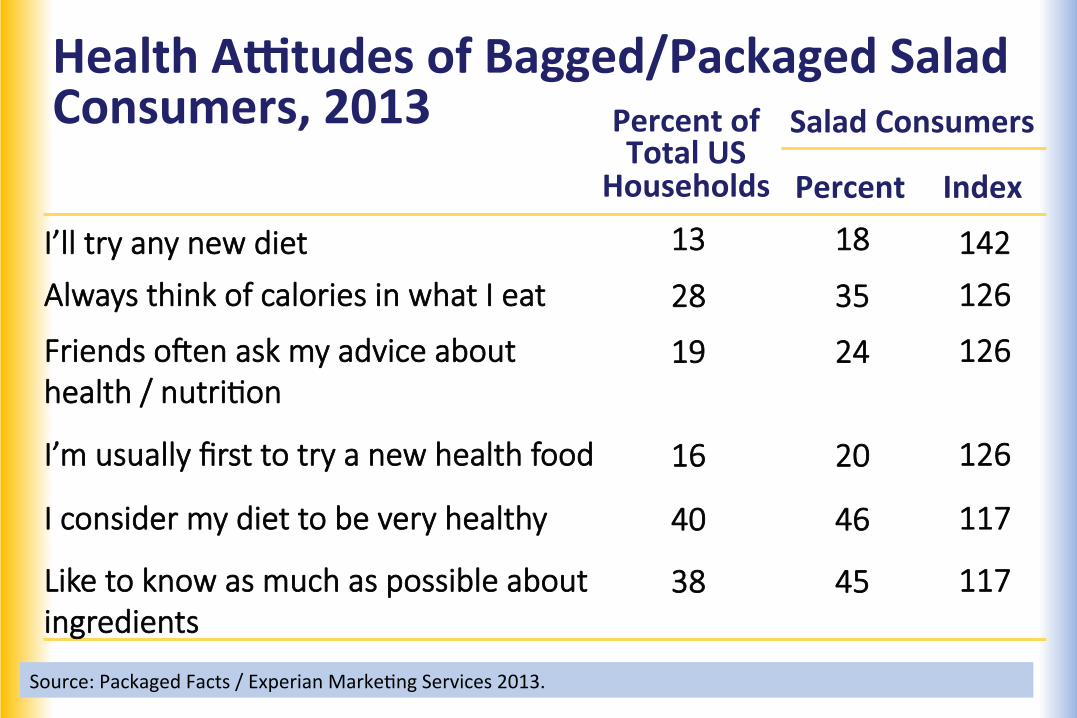
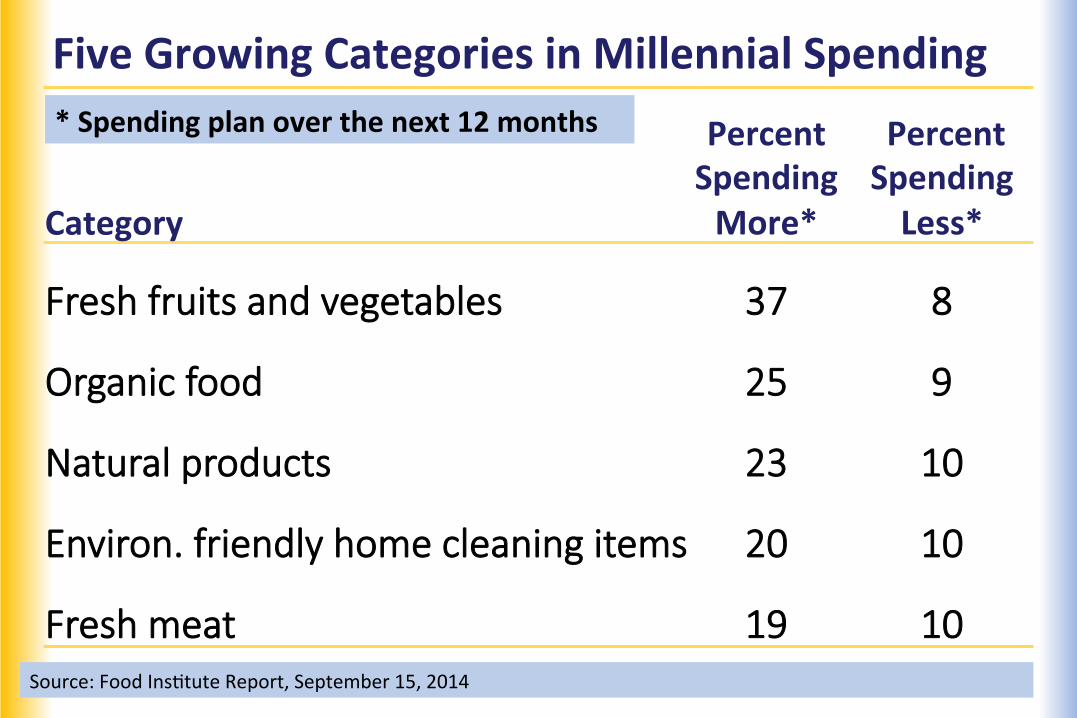
Consumer Behavior • Higher income and socially conscious foodies are
driving demand; their preferences lean to organic, convenience (fresh-cut), flavor, local.
• For mainstream consumers, positive attitudes about
wellness benefits of fresh produce not translating into higher purchases. Improved flavor might help.
• Perception that produce costs more and may be
wasted. Better shelf-life might help. • 47.6 million people on food stamps (SNAP) in
FY2012-13 (vs 17.3 in 2000) for cost of $79.8M.
Distribution of US Households by Income Level, Share of Total Fresh Produce Expenditures/Income Level & Ave. Fresh Produce Expenditures/Income Level, 2012
Source: Calculations by Roberta Cook from the Food Institute’s Demographics of Consumer Food Spending, 2014.
$478 14%
$254 8%
$409 17%
$339 13%
$ = Average fresh produce expenditures per income group
% = Percent of total fresh produce expenditures contributed by each income group
$819 31% <$15,000
15%
$15,000-$29,999
18%
$30,000-$49,999
20%
$50,000-$69,999
14%
$70,000-$99,999
14%
$100,000+ 19%
Share of Households
$594 18%
Organic Fruit and Vegetable Sales and Pricing in Key US Food Retailers, 2014 vs. 2013
Veg $2,110 17.2 757 17.2 $2.79 0
Fruit $1,103 17.3 532 12.5 $2.07 4.2
Organic Product
Weekly $ Sales per
Store
Percent Change
vs. 2013
Weekly Vol. per Store
Percent Change
vs. 2013
Avg Retail Price
Percent Change
vs. 2013
Source: FreshFacts® on Retail, Whole and Fresh Cut Produce Trends: 2014, United Fresh Produce Association and Nielsen, March 2015.
30% of households purchase organic fruits in supermarkets on 2 trips/yr.
51% of households purchase organic veggies in supermarkets on 4 trips/yr.
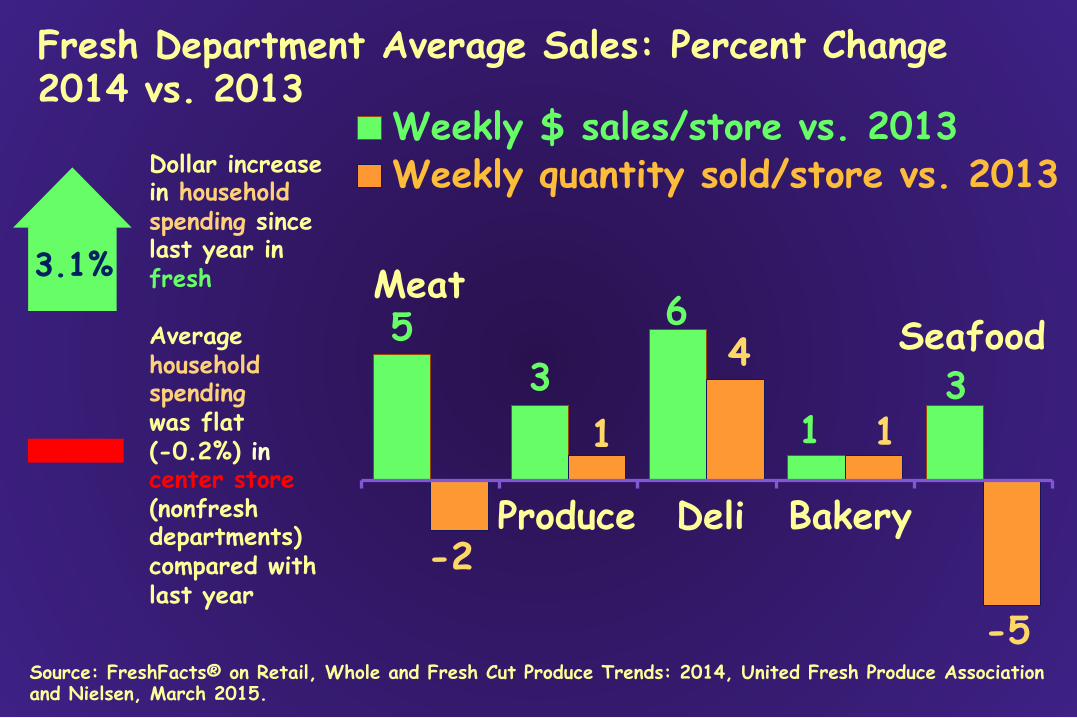
5 3
6
1 3
-2
1
4
1
-5
Weekly $ sales/store vs. 2013 Weekly quantity sold/store vs. 2013
Seafood
Fresh Department Average Sales: Percent Change 2014 vs. 2013
Meat
Produce Deli Bakery
Source: FreshFacts® on Retail, Whole and Fresh Cut Produce Trends: 2014, United Fresh Produce Association and Nielsen, March 2015.
Dollar increase in household spending since last year in fresh Average household spending was flat (-0.2%) in center store (nonfresh departments) compared with last year
3.1%
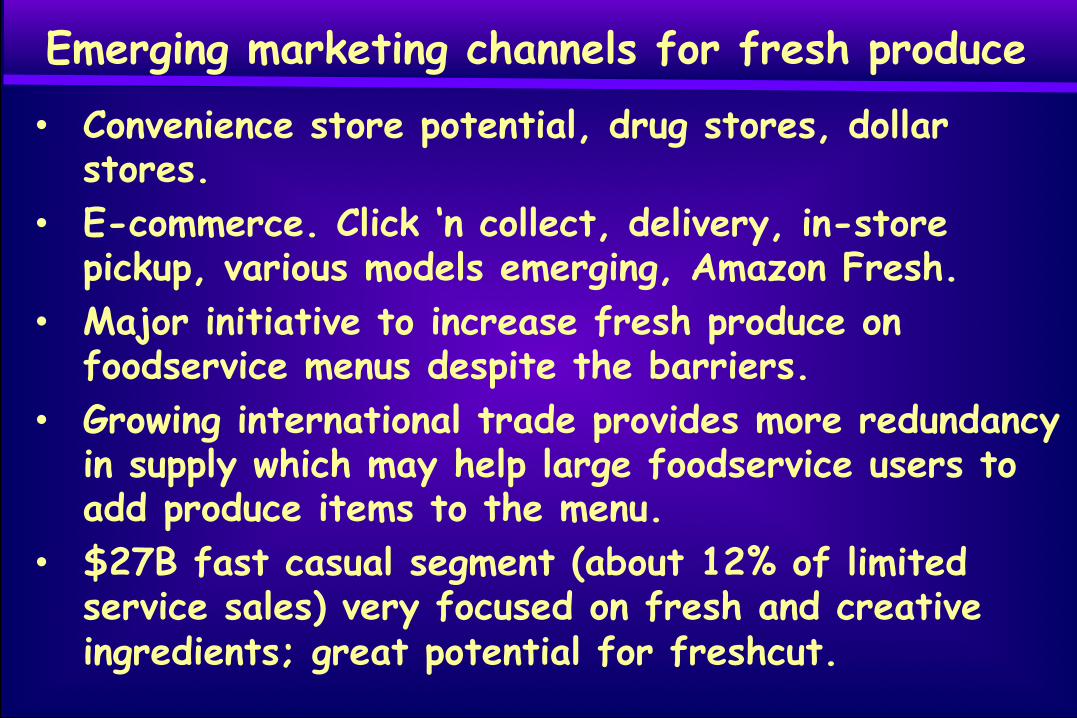
Emerging marketing channels for fresh produce
• Convenience store potential, drug stores, dollar stores.
• E-commerce. Click ‘n collect, delivery, in-store pickup, various models emerging, Amazon Fresh.
• Major initiative to increase fresh produce on foodservice menus despite the barriers.
• Growing international trade provides more redundancy in supply which may help large foodservice users to add produce items to the menu.
• $27B fast casual segment (about 12% of limited service sales) very focused on fresh and creative ingredients; great potential for freshcut.
Value-added/Fresh-cut Produce Trends
Overview
Perishables Group Nielsen data
• “Expanded all outlet” national sample includes sales through about 62% of supermarkets, plus sales through some nontraditional retailers, such as, Walmart, Sam’s, BJs, dollar stores; excludes Costco, limited assortment and other minor formats. I refer to as “Key Retailer” sales in my slides.
• Another common Nielsen data set is referred to as “total food” and excludes the nontraditional outlets noted above. I refer to as “Select Retailer” sales in my slides.
Percent of US Households Buying Fruit by Category, 2014
84% 79% 77%
73% 61%
55% 52%
49% 47%
Bananas Apples Citrus
Berries Grapes
Value-add fruit Melons
Stone Fruits Avocados
Source: FreshFacts® on Retail, Whole and Fresh Cut Produce Trends: 2014, United Fresh Produce Association and Nielsen, March 2015.
Percent of US Households Buying Vegetables by Category, 2014
87% 83% 83% 81%
78% 75%
68% 61%
56% 56%
Potato Bag Salad
Onion Tomato Carrot
Lettuce Cooking Veg
Peppers Cucumber
Value-add veg Source: FreshFacts® on Retail, Whole and Fresh Cut Produce Trends: 2014, United Fresh Produce Association and Nielsen, March 2015.
Fresh-‐cut Fruit and Veg Segments, Performance in Key US Retailers, 2013: Convenience Offers Value
ITEM VALUE-‐ADDED FRUITS
VALUE-‐ADDED VEGETABLES
PENETRATION: +1% +2% SPEND PER TRIP: +2% +4% DOLLAR SALES: +12% +14%
Sources: Nielsen Perishables Group FreshFacts® Total U.S. Fresh Coverage Area (FCA, and Nielsen Perishables Group FreshFacts® Powered by Spire, a Datalogix Company, both 52 Weeks Ending 12/28/13; PMA 2013 trade show; brand websites.
Shares of Total Value-added Produce Dollar Sales, by Subcategory, in Key US Retailers, 2014
Bag salads 49%
Value-add veg 22%
Value-add fruit 29%
Source: FreshFacts® on Retail, Whole and Fresh Cut Produce Trends: 2014, United Fresh Produce Association and Nielsen, March 2015. Fresh Coverage Area (FCA) incl key retailers from food, mass/supercenter and club chains, or more than 18,000 stores. It includes UPC, random weight and retailer assigned codes.
Value-added Fruit Definitions 1. Overwrap Typically sold in a tray with plastic overwrapping. Contains words like quartered, halved, sliced, wedge, eighth, and wrapped. 2. Fresh-cut Fruit Cut fresh, no preservatives. Contain high level of value-added characteristics such as chunk, cubed, cored, cup, cut, wedge, spear, sliced, boat. 3. Jars and Cups Perishable fruit in juice or preservatives, typically sold in a plastic cup or jar. Contains words like syrup, with or in juice, refrigerated, and chilled.
Source: FreshFacts® on Retail, Trends 2013, Perishables Group and United Fresh Foundation, 2014. Fresh Coverage Area (FCA) incl some nontraditional retailers such as Walmart, BJ’s; and UPC, random weight and retailer assigned codes.
US Value-added Fruit (VAF) Sales by Subcategory: Share of Total VAF Dollar Sales in Key Retailers (includes nontraditional retailers), 2013
Overwrap, 10.9%
Jars/cups, 7.9%
Fresh-cut Fruit, 81.2%
Source: FreshFacts® on Retail, Trends 2013, Perishables Group and United Fresh Foundation, 2014. Fresh Coverage Area (FCA) incl some nontraditional retailers such as Walmart, BJ’s; and UPC, random weight and retailer assigned codes.
1. Side Dish Includes fresh vegetables such as broccoli and cauliflower typically served as side dishes. Can often be cooked in the microwave directly in the bag. 2. Trays Comprised of vegetable-only trays with/without dip. Trays may also have a protein component or a nontraditional side (bean dip, hummus, breadsticks, etc.). 3. Snacking Single-serving sized (5 oz or less) vegetable items typically consumed as a snack or on the go. Often include dip. Keywords include snack, dip, bundle, pack and multi-pack. 4. Meal Prep Items ready to incorporate into recipe or meal. Includes carrots, vegetable blends and medleys. Preparation varieties include diced, sliced, chopped, shredded; also soup mix, fajita mix, pico de gallo, kabob, stew mix, stuffing mix.
Value- added Veg Excludes Bagged Salads but Includes:
Source: FreshFacts® on Retail, Trends 2013, Perishables Group and United Fresh Foundation, 2014. Fresh Coverage Area (FCA) incl some nontraditional retailers such as Walmart, BJ’s; and UPC, random weight and retailer assigned bar code.
US Value-added Veg (VAV) Sales by Subcategory: Share of Total VAV Dollar Sales in Key Retailers (includes nontraditional retailers), 2013
Side dish, 56.0%
Trays, 18.0%
Snacking, 11.0% Meal
prep, 15.0%
Source: FreshFacts® on Retail, Trends 2013, Perishables Group and United Fresh Foundation, 2014. Fresh Coverage Area (FCA) incl some nontraditional retailers such as Walmart, BJ’s; and UPC, random weight and retailer assigned bar code.
Lettuce, Leafy Greens and Bag Salads
Source: Fresh Trends 2014.
USA Household Likeliness of Bag Salad Purchase, 2014
Household Income
Percent
<$25,000 44 $25,000-$49,900 50
$50,000-$99,900 55
$100,000+ 64
Household Age Percent
21-39 47 40-49 52
50-58 51 59+ 63
On average, both bag salads and lettuce have a 53% purchase likelihood.
Head Lettuce
Romaine
Leaf
0 5
10 15 20 25 30 35
1985
19
86
1987
19
88
1989
19
90
1991
19
92
1993
19
94
1995
19
96
1997
19
98
1999
20
00
2001
20
02
2003
20
04
2005
20
06
2007
20
08
2009
20
10
2011
20
12
2013
P
7.7 3.6
Lbs.
Per
Cap
ita
US Per Capita Utilization/Consumption of Lettuce, by Type, 1985-2013P (includes fresh-cut and bulk, foodservice and retail)
All-23.8
12.5
Source: USDA/ERS, Vegetables and Pulses Yearbook May 30, 2014 and unpublished ERS data for leaf and romaine.
0 1,000 2,000 3,000 4,000 5,000 6,000 7,000 8,000
1960
19
62
1964
19
66
1968
19
70
1972
19
74
1976
19
78
1980
19
82
1984
19
86
1988
19
90
1992
19
94
1996
19
98
2000
20
02
2004
20
06
2008
20
10
2012
20
14P
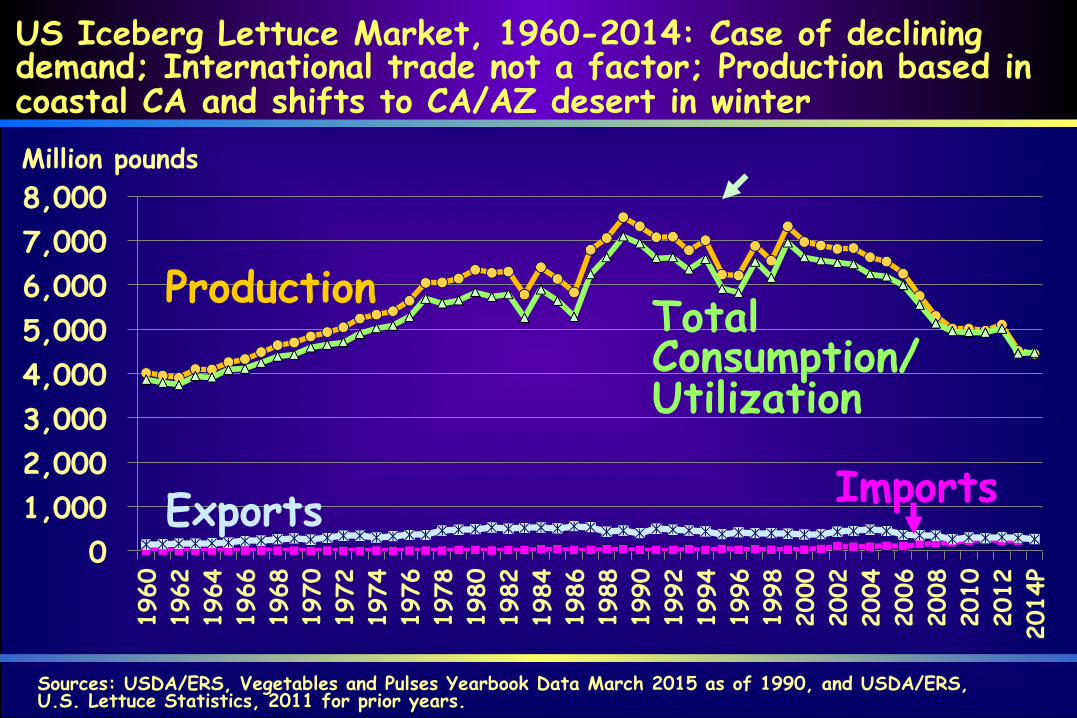
US Iceberg Lettuce Market, 1960-2014: Case of declining demand; International trade not a factor; Production based in coastal CA and shifts to CA/AZ desert in winter Million pounds
Production Total Consumption/ Utilization
Exports Imports
Sources: USDA/ERS, Vegetables and Pulses Yearbook Data March 2015 as of 1990, and USDA/ERS, U.S. Lettuce Statistics, 2011 for prior years.
0
1,000
2,000
3,000
4,000
5,000 19
89
1990
19
91
1992
19
93
1994
19
95
1996
19
97
1998
19
99
2000
20
01
2002
20
03
2004
20
05
2006
20
07
2008
20
09
2010
20
11
2012
20
13
2014
p
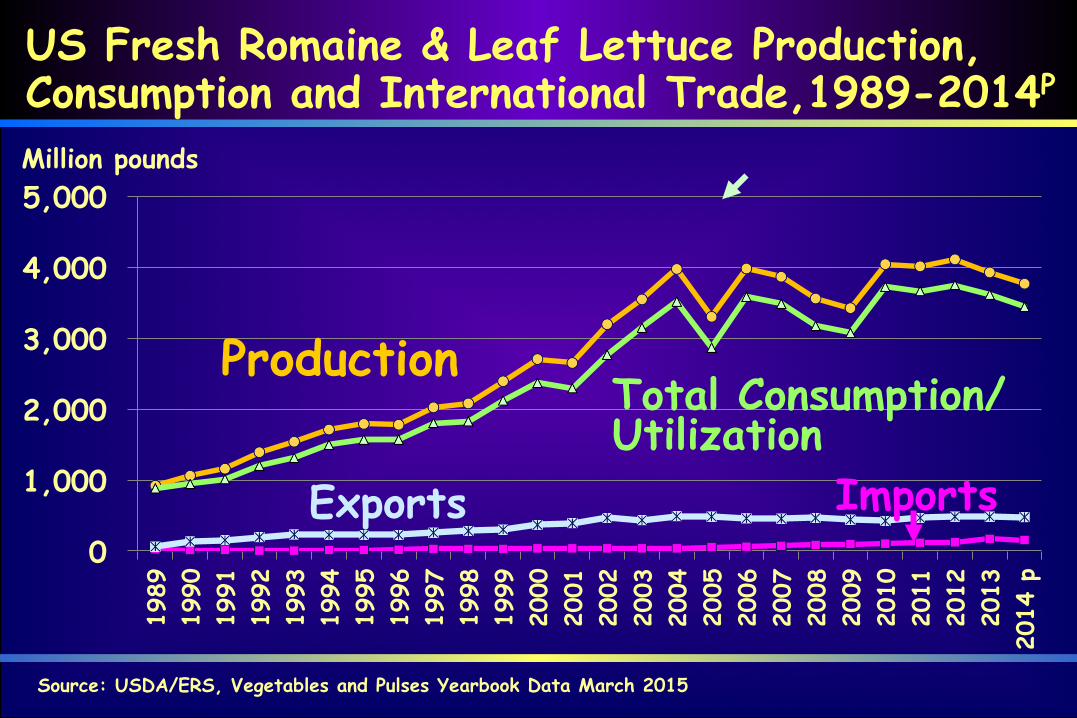
Million pounds
Production Total Consumption/ Utilization
Exports Imports
Source: USDA/ERS, Vegetables and Pulses Yearbook Data March 2015
US Fresh Romaine & Leaf Lettuce Production, Consumption and International Trade,1989-2014P
Pounds per capita
P=Preliminary
0
1
2
3
US Per Capita Utilization/Consumption of Fresh Spinach, 1985-2014,P (all channels, foodservice and retail, includes fresh-cut)
Source: USDA/ERS, Vegetables and Pulses Yearbook Tables, posted online March 20, 2015, http://www.ers.usda.gov/data-products/vegetables-and-pulses-data/yearbook-tables.aspx.
Source: Monterey County Ag Commissioner, 1991 and 2013 annual reports
Bulk to Process 6.9 13.9 15% 31%
Wrapped 14.2 23.4 30% 52%
Naked 26.1 7.4 55% 17%
TOTAL 47.2 44.7 100% 100%
Million Cartons* Percent Share
Product Form 1990 2013 1990 2013
* 50 lb carton-equivalent units, may not sum to 100 due to rounding
Long-term trend is that bulk to process and wrapped shipments are up: Monterey County Head Lettuce Shipments 1990 vs 2013
Source: Monterey County Crop Report 2013, Ag Commissioner.
Crop Acreage Cartons, thousands
Value, thousands
Carton Share %
Butter Leaf 810 995 8,567 1.5
Endive 403
429
4,346 0.6
Escarole 376
1,052
4,015 1.6
Green Leaf 7,813
8,149
75,541 12.1
Red Leaf 2,053
2,149
18,352 3.2
Romaine 38,793
39,608 381,425 58.6
Leaf, bulk N/A
15,226 167,400 22.5 Total 65,008 67,608 659,646 100.0%
Monterey County Leaf Lettuce Production, by Type, 2013
Top 10 Vegetable Sales and Pricing in Key US Food Retailers, 2014 vs. 2013
$2,500 $4.328 B total salad sales, all segments, up 7.7%
Top Bag Salad Segments: $Sales and Annual Growth Rates in Key US Food Retailers, (AOC*) 2014
7 Number above bar represents % change vs. prior yr.
$Millions
Source: Nielsen 52 weeks ending July 12, 2014. *Expanded all outlets combined (AOC) includes some nontraditional retailers such as Walmart, BJ’s and others.
-3 38 -7 7 22 4
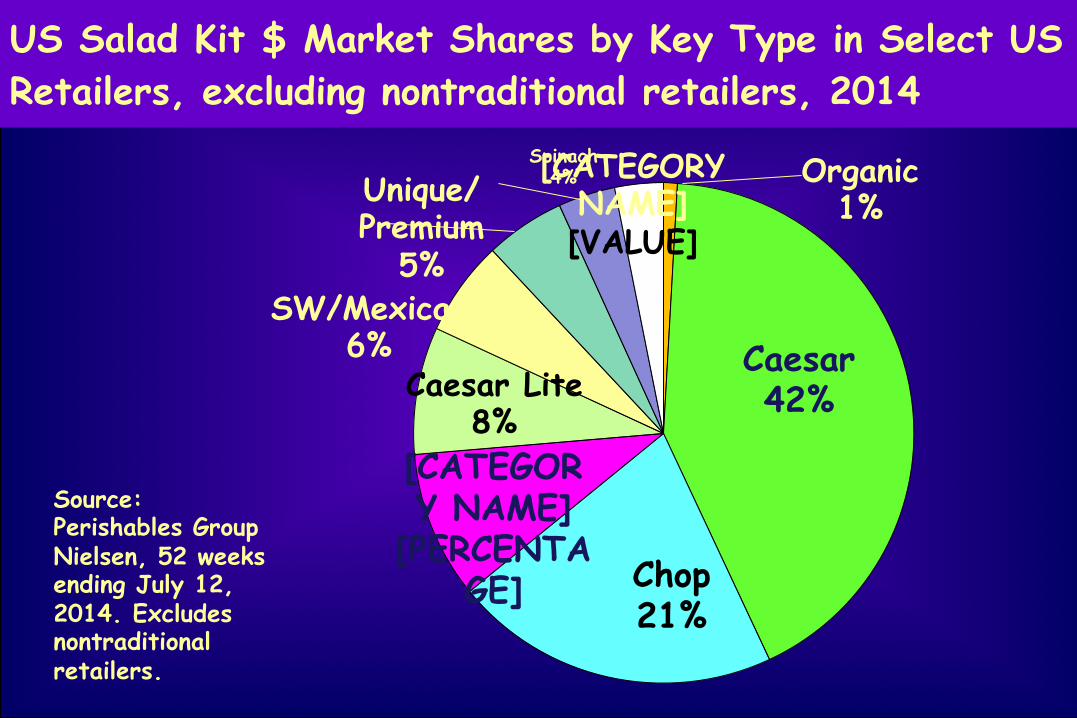
US Salad Kit $ Market Shares by Key Type in Select US Retailers, excluding nontraditional retailers, 2014
Organic 1%
Caesar 42%
Chop 21%
[CATEGORY NAME]
[PERCENTAGE]
Caesar Lite 8%
SW/Mexican 6%
Unique/Premium
5%
Spinach 4% [CATEGORY
NAME] [VALUE]
Source: Perishables Group Nielsen, 52 weeks ending July 12, 2014. Excludes nontraditional retailers.
Private label 29.7 0.2
Fresh Express 28.7 -0.8
Dole 19.7 -1.2
Earthbound Farm 6.7 0.7
Ready Pac 3.5 -0.2
Organic Girl 2.8 0.3
All Other 8.1 NA
% Share Share Pt. Change
US Bag Salad Market Shares in Select Retailers, by Key Firm (% total $ sales), and Point Change in Market Share 2014 vs 2013
Source: Nielsen 52 weeks ending July 12, 2014. Excludes nontraditional retailers, such as, Walmart and clubs.
Percent of US Households Buying Vegetables by Category, 2014
87% 83% 83% 81%
78% 75%
68% 61%
56% 49%
Potato Bag Salad
Onion Tomato Carrot
Lettuce Cooking Veg
Peppers Cucumber Mushroom
Source: FreshFacts® on Retail, Whole and Fresh Cut Produce Trends: 2014, United Fresh Produce Association and Nielsen, March 2015.
US Organic Salad Sales in Key Retailers, 2014 • Total organic salad sales about $1 billion,
23% of the $4.3 billion in salad sales.* • Organic $ salad sales grew by 16% and unit sales by 15%.*
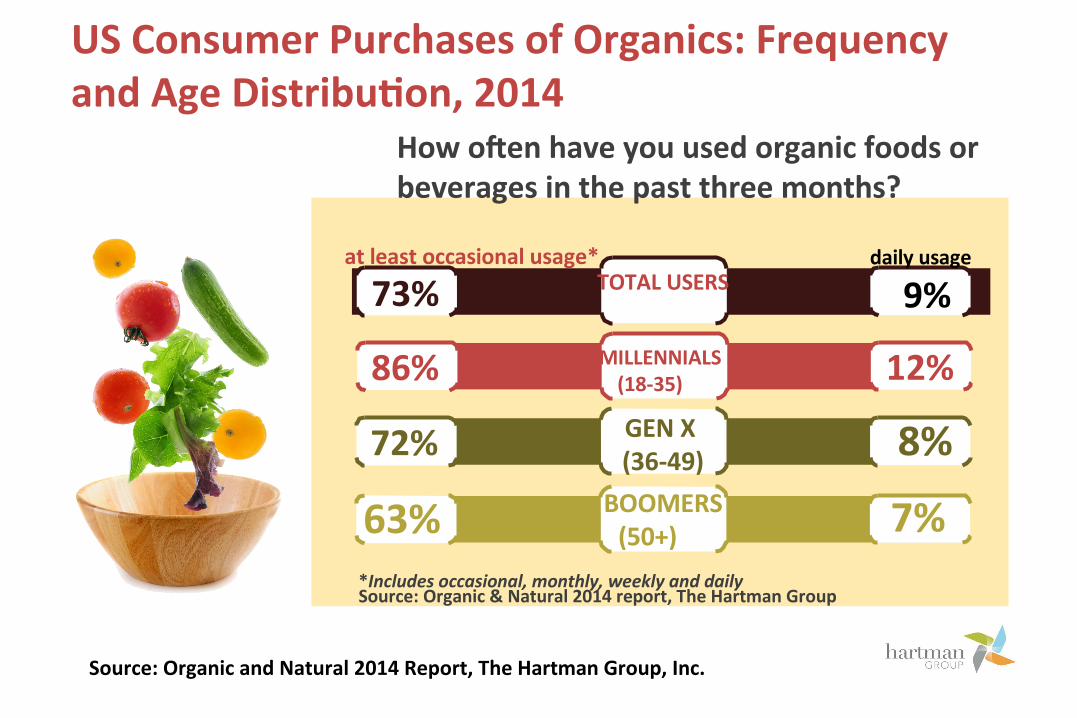
• According to the Hartman Group’s Organic and Natural 2014 report, 73% of consumers purchase organic products, and more than a third use them at least monthly (all food and beverage).
*Source: Perishables Group Nielsen 52 weeks ending July 12, 2014
How oken have you used organic foods or beverages in the past three months?
at least occasional usage*
73% daily usage
9% TOTAL USERS
86% 12% MILLENNIALS (18-‐35)
72% 8% GEN X (36-‐49)
63% 7% BOOMERS (50+)
Source: Organic and Natural 2014 Report, The Hartman Group, Inc.
*Includes occasional, monthly, weekly and daily Source: Organic & Natural 2014 report, The Hartman Group
US Consumer Purchases of Organics: Frequency and Age DistribuNon, 2014
Shoppers seek several claims in tandem, revealing motivation
Source: FMI U.S. Grocery Shopper Trends 2014. Regularly = at least “fairly often”
48 41
37 35
33 33 32 31 30
28 24
22 22 21 20
18 11
Whole grain Low sodium Low sugar High fiber
No preservatives No trans fats
No chemical additives Low calorie No/Low fat
No HFCS Natural
Non-GMO Low cholesterol Heart healthy
Antioxidant-rich Certified organic
Gluten-free
Percent of Shoppers
Good fiber
No neg. ingreds.
Minimal processing
Heart healthy
Positive nutrition
Value-added Fruit Trends
Fresh Noncitrus, Incl Melon
Fresh Citrus
Process Citrus
Process Noncitrus
0
50
100
150
200
250
300
350 19
76
1977
19
78
1979
19
80
1981
19
82
1983
19
84
1985
19
86
1987
19
88
1989
19
90
1991
19
92
1993
19
94
1995
19
96
1997
19
98
1999
20
00
2001
20
02
2003
20
04
2005
20
06
2007
20
08
2009
20
10
2011
20
12
2013
(frozen, dried and canned)
US Per Capita Total Fruit Disappearance/Consumption, Including Melons, Pounds 1976-2013, (all channels, foodservice and retail)
Poun
ds p
er c
apita
293 101
55
24 112
282
73 29
102
78
Source: Fruit and Tree Nuts Yearbook, ERS/USDA, October 31, 2014.
Fresh includes fresh-cut and commodity.
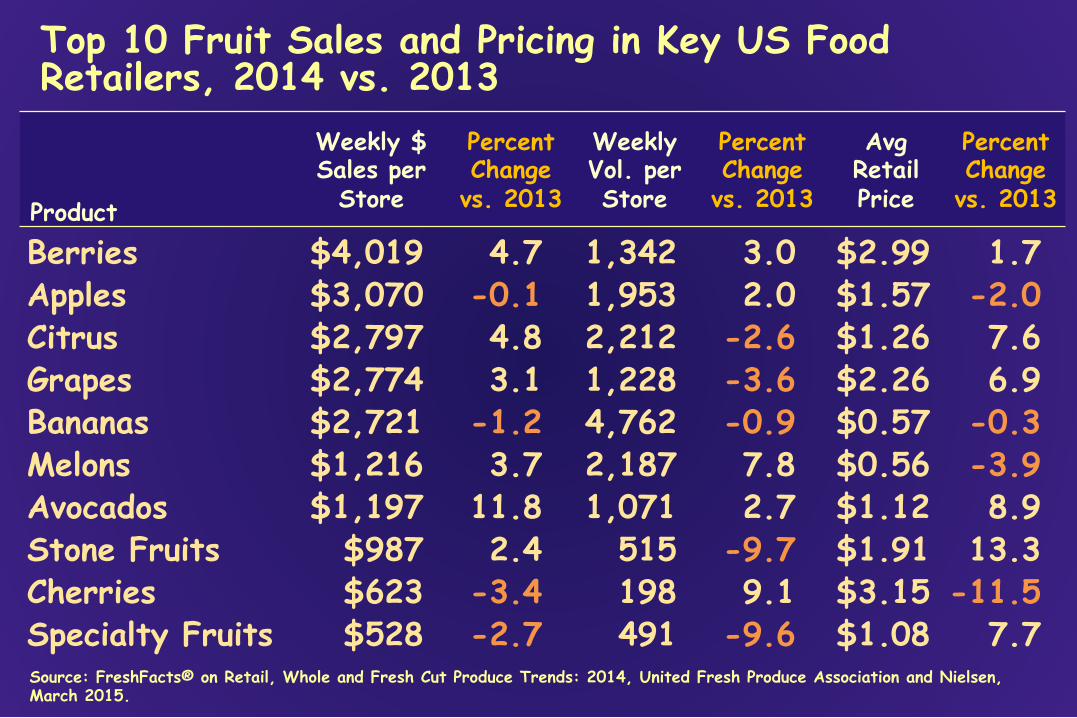
Top 10 Fruit Sales and Pricing in Key US Food Retailers, 2014 vs. 2013
Product
Weekly $ Sales per
Store
Percent Change
vs. 2013
Weekly Vol. per Store
Percent Change
vs. 2013
Avg Retail Price
Percent Change
vs. 2013
Berries $4,019 4.7 1,342 3.0 $2.99 1.7 Apples $3,070 -0.1 1,953 2.0 $1.57 -2.0 Citrus $2,797 4.8 2,212 -2.6 $1.26 7.6 Grapes $2,774 3.1 1,228 -3.6 $2.26 6.9 Bananas $2,721 -1.2 4,762 -0.9 $0.57 -0.3 Melons $1,216 3.7 2,187 7.8 $0.56 -3.9 Avocados $1,197 11.8 1,071 2.7 $1.12 8.9 Stone Fruits $987 2.4 515 -9.7 $1.91 13.3 Cherries $623 -3.4 198 9.1 $3.15 -11.5 Specialty Fruits $528 -2.7 491 -9.6 $1.08 7.7 Source: FreshFacts® on Retail, Whole and Fresh Cut Produce Trends: 2014, United Fresh Produce Association and Nielsen, March 2015.
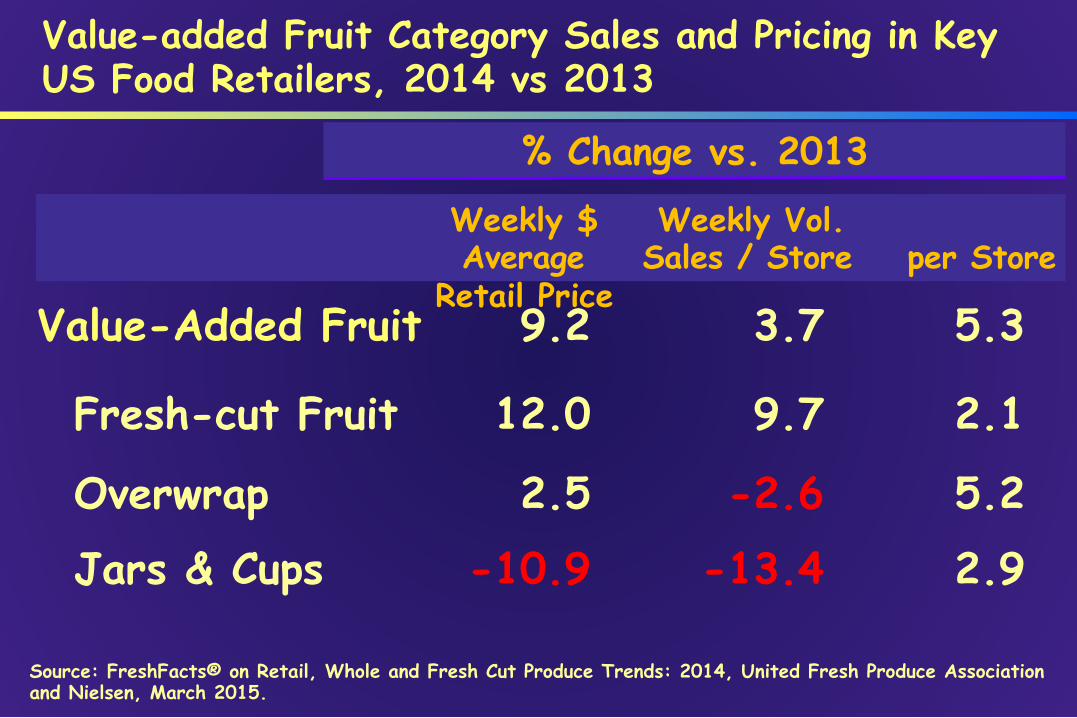
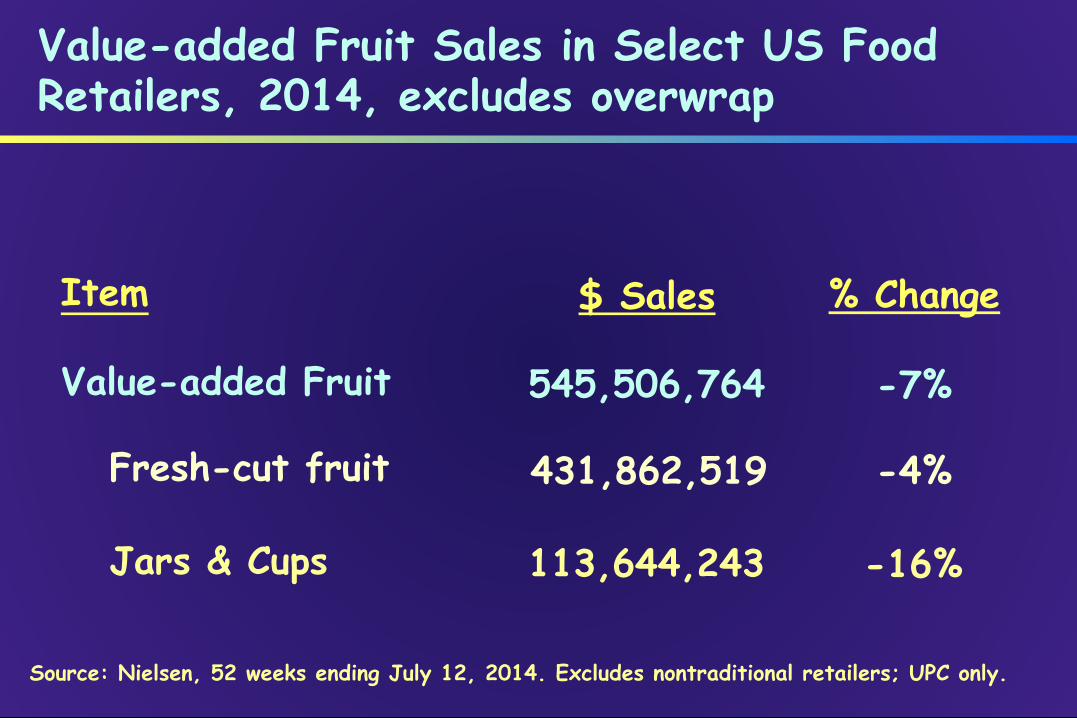
Value-added Fruit Category Sales and Pricing in Key US Food Retailers, 2014 vs 2013
Weekly $ Weekly Vol. Average Sales / Store per Store
Retail Price
% Change vs. 2013
Value-Added Fruit 9.2 3.7 5.3
Fresh-cut Fruit 12.0 9.7 2.1
Overwrap 2.5 -2.6 5.2
Jars & Cups -10.9 -13.4 2.9
Source: FreshFacts® on Retail, Whole and Fresh Cut Produce Trends: 2014, United Fresh Produce Association and Nielsen, March 2015.
Value-added Fruit Sales in Select US Food Retailers, 2014, excludes overwrap
US Select Retailer Fresh-cut Fruit (excl other VAF) Shares by Key Item in Dollars and Quantity 2014, ($431.8 million total sales in this national sample, excl nontraditional retail)
Small sizes growing and large pack sizes declining.
Fresh-cut Vegetable Trends
0
50
100
150
200
250
300
350
400
450 19
76
1978
19
80
1982
19
84
1986
19
88
1990
19
92
1994
19
96
1998
20
00
2002
20
04
2006
20
08
2010
20
12
2014
P
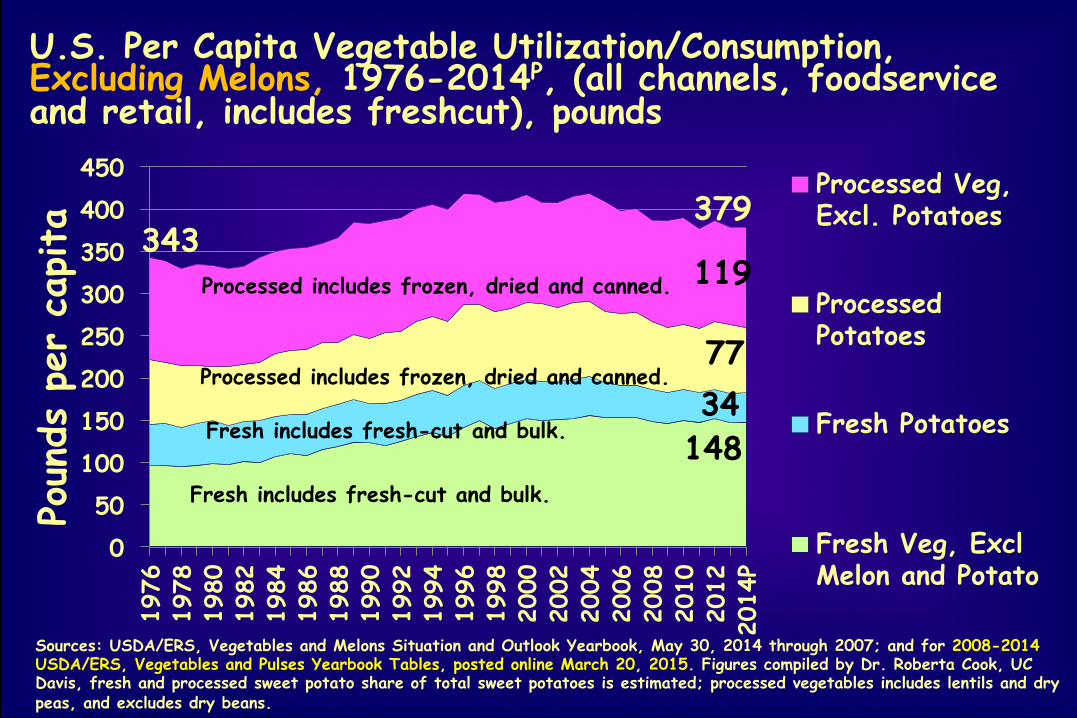
Processed Veg, Excl. Potatoes
Processed Potatoes
Fresh Potatoes
Fresh Veg, Excl Melon and Potato
Fresh includes fresh-cut and bulk.
Processed includes frozen, dried and canned.
Fresh includes fresh-cut and bulk.
Processed includes frozen, dried and canned. 77 34
Sources: USDA/ERS, Vegetables and Melons Situation and Outlook Yearbook, May 30, 2014 through 2007; and for 2008-2014 USDA/ERS, Vegetables and Pulses Yearbook Tables, posted online March 20, 2015. Figures compiled by Dr. Roberta Cook, UC Davis, fresh and processed sweet potato share of total sweet potatoes is estimated; processed vegetables includes lentils and dry peas, and excludes dry beans.
U.S. Per Capita Vegetable Utilization/Consumption, Excluding Melons, 1976-2014P, (all channels, foodservice and retail, includes freshcut), pounds
Poun
ds p
er c
apita 379
343
148
119
US Per Capita Consumption of Select Fresh Vegetables, 1985-2014P (includes fresh-cut and bulk, all marketing channels - foodservice and retail)
Pounds per capita P=Preliminary
Source: USDA/ERS, Vegetables and Pulses Yearbook March 2015.
0
5
10
15
Carrots Bell pepper Broccoli Sweet corn Cucumber
Value-added Vegetable Category Sales and Pricing in Key US Food Retailers, 2014 vs 2013
Weekly $ Weekly Vol. Average Sales / Store per Store
Retail Price
% Change vs. 2013
Value-Added Veg 10.9 10.7 0.2
Side Dish 12.2 10.9 1.1 Trays 3.4 6.7 -3.0 Meal Prep 8.7 5.2 3.3 Snacking 19.2 18.3 0.8 Source: FreshFacts® on Retail, Whole and Fresh Cut Produce Trends: 2014, United Fresh Produce Association and Nielsen, March 2015.
US Fresh-cut Veg Category Shares of Dollar Sales, by Key Item, in Select US Supermarkets, 2012*
Source: Nielsen *52 weeks ending July 14, 2012
Item Share (%) Carrots 47% Mixed Veg 19% Green Beans 7% Greens 4% Broccoli 4% Snap/Snow Peas 3% Onions 3% Pico de Gallo 1% All Others 12% Total 100%
Promotional Measures in Action for Value-added Vegetables
Source: United Fresh Foundation, FreshFacts on Retail, Q1 2012.
50.5%
53.2%
69.4%
61.6%
49.5%
46.8%
30.6%
38.4%
26.3% 18.9% 12.2% 14.5%
% on Promotion % Promo Efficiency % Subsidized Side dishes = 26.3% of
volume sold on promotion. Promotions were inefficient: 50.5% of the promotion volume was subsidized. Trays = next highest volume sold on promotion, 19%. 53% was subsidized. Overall, relatively high subsidy rates suggest consumers don’t need a discount to motivate purchasing value-added vegetables.
Branded vs. Private Label
Private Label Sales in US Supermarkets, 2012: Top Private Label Categories by Dollar Volume: Fresh Produce Becoming Important
Source: Food Industry Review, 2013 Edition. The Food Institute.
$9.5 $6.2 $6.0 $5.9
$4.1 $3.8
$2.6 $2.4 $2.3 $2.3
Milk Bread & baked goods
Cheese Paper products Fresh produce
Medications & remedies Deli prep'd foods
Frozen meat & seafood Packaged meat Bottled water
Billion
61% 30
%
9%
US Bag Salad Market Shares in Select Retailers: Top 5 Firms and Private Label, Share of Dollar Sales
Sources: 1994 - IRI; Nielsen *52 weeks ending July 14, 2014. Excludes Walmart and clubs.
US Consumer Frequency of Purchases of Locally Grown Products, 2014
79%
11% 10%
Occasionally Always Never
Source: FMI U.S. Grocery Shopper Trends 2014
86%
75%
61%
56%
39%
39%
31%
30%
24%
Freshness
Support local economy
Taste
Like knowing source/how produced
Nutritional value
Price
Enviro impact of long distance transportation
Appearance
Long term personal health effects
Reasons for Buying Locally Grown at Retail, 2014
Source: FMI U.S. Grocery Shopper Trends 2014
• Fresh-cut produce sales are growing again despite the economic downturn; VAF has been the most variable.
• Ongoing margin squeeze means that firms at all levels of the supply chain must improve management practices and share data effectively; information technology will help.
• Fresh-cut produce leads in category development but there is still great potential for improvement with store level assortment “right sizing,” pricing and promo, reducing shrink and helping maintain margins.
• Future growth rate of freshcut depends partly on success of foodservice in adding healthy menu options.
Conclusions
Supplemental Information for Handout
Frequency of Purchasing Private Brand Food Items at the Primary Store, 2011
Source: U.S. Grocery Shopper Trends 2011, FMI.
Always 41%
Occasionally 55%
Never 4%
36%
56%
7% 1%
Excellent
Good
Fair
Poor
Rating Private Brand Food Products at the Primary Store, 2011
Source: U.S. Grocery Shopper Trends 2011, FMI.
Initiatives to Increase Consumption
• More forces are in play to educate consumers about the benefits of fresh produce (MyPlate, salad bars in schools, PBH, govt and private efforts to increase awareness of fruit/veg health benefits.
• Culinary Institute of America and Harvard School of Public Health Dept of Nutrition Initiative: Menus of Change, The Business of Healthy, Sustainable, Delicious Food Choices. This is designed to introduce more fresh produce on foodservice menus.
Schools Offer New Opportunities for Produce and Targeted Product
Launchings on the Rise
Factors Considered in Consumer Decisions to Purchase Packaged Produce
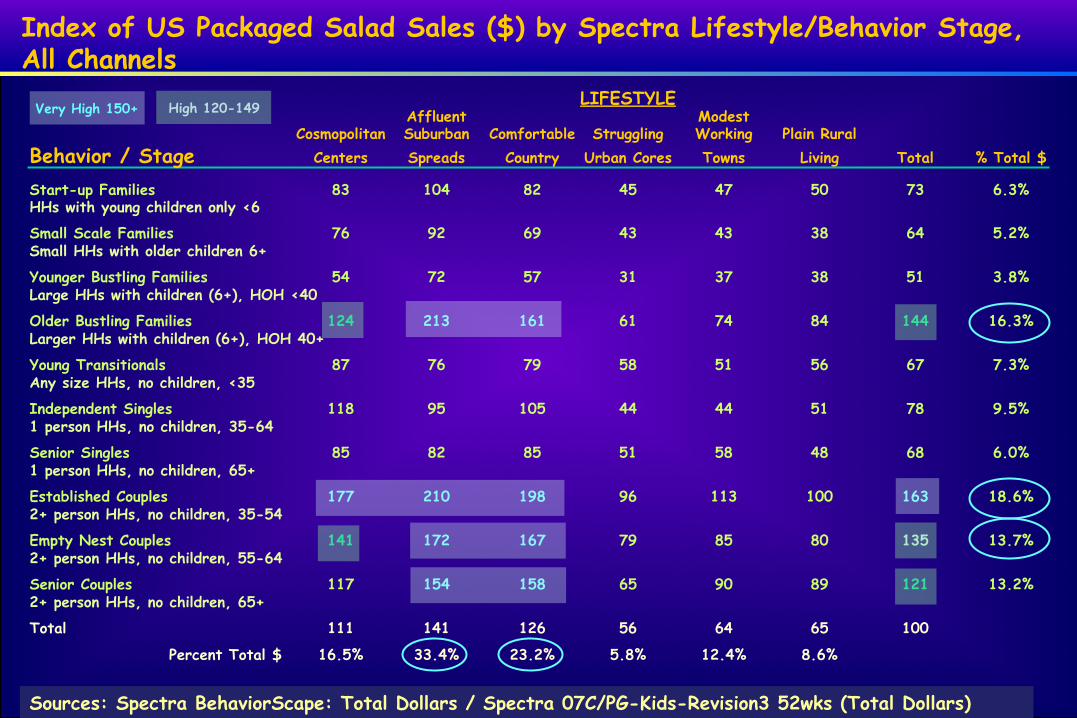
Start-up Families 83 104 82 45 47 50 73 6.3% HHs with young children only <6
Small Scale Families 76 92 69 43 43 38 64 5.2% Small HHs with older children 6+
Younger Bustling Families 54 72 57 31 37 38 51 3.8% Large HHs with children (6+), HOH <40
Older Bustling Families 124 213 161 61 74 84 144 16.3% Larger HHs with children (6+), HOH 40+
Young Transitionals 87 76 79 58 51 56 67 7.3% Any size HHs, no children, <35
Independent Singles 118 95 105 44 44 51 78 9.5% 1 person HHs, no children, 35-64
Senior Singles 85 82 85 51 58 48 68 6.0% 1 person HHs, no children, 65+
Established Couples 177 210 198 96 113 100 163 18.6% 2+ person HHs, no children, 35-54
Empty Nest Couples 141 172 167 79 85 80 135 13.7% 2+ person HHs, no children, 55-64
Senior Couples 117 154 158 65 90 89 121 13.2% 2+ person HHs, no children, 65+
Total 111 141 126 56 64 65 100
Percent Total $ 16.5% 33.4% 23.2% 5.8% 12.4% 8.6%
Very High 150+ High 120-149 LIFESTYLE Affluent Modest
Cosmopolitan Suburban Comfortable Struggling Working Plain Rural Behavior / Stage Centers Spreads Country Urban Cores Towns Living Total % Total $
Understanding Value-added Fruit/Veg Produce Shoppers, excludes bag salads
• Essence: a new tool from Nielsen Perishables Group’s FreshFacts® Shopper Insights powered by Spire, that segments consumers into 16 shopper groups and forty segments.
• Healthy Living Couples and Healthy Living Families are the most important shopper
groups for value-added produce, buying the largest share of value-added fruit and veg.
• Healthy Living Couples are affluent, have no children in the home and tend to be
55-75+. They try to eat right but don't count calories. • Healthy Living Families are affluent to lower income levels, have children in the
home and tend be 35 to 54. Like Healthy Living Couples, they try to eat well without counting calories, and they rely on simple meal solutions and fresh ingredients.
• Value-added produce lends well to both groups, as the highly affluent tend to do
in-home cooking using fresh ingredients, and middle income or less affluent consumers tend to go to simple or quick meal solutions.
Source: FreshFacts® on Retail, Q2 2012, Perishables Group/United Fresh Foundation.
• Healthy Living Couples had the largest contribution to value-added fruit (VAF), accounting for 26.9% of sales in the 52 weeks ending July 14, 2012.
• The next largest group was Healthy Living Families, contributing 17.3% to VAF sales.
• On average, these two shopper groups purchase VAF 4.7 and 5.2 times/household/year, respectively.
• Healthy Living Couples contributed 30.3% to value-added vegetable (VAV) sales in the 52 weeks ending July 14, 2012.
• Healthy Living Families contributed 16.3% to the VAV category.
• Healthy Living Couples average 4.3 purchase trips/household per year for VAV, and Healthy Living Families 4.2 trips.
• Natural/Organic households contributed 7.5% of VAV sales.
Source: FreshFacts® on Retail, Q2 2012, Perishables Group/United Fresh Foundation.
Understanding Value-added Fruit and Veg Produce Shoppers, excludes bagged salads