12
1 © GfK April 23, 2018 | GfK slide gallery Trends in the Markets of mobile Devices Arndt Polifke © GfK 2018 | TechFutures: Zukunftslabor Digital | April 17, 2018

1© GfK April 23, 2018 | GfK slide gallery
Trends in the Markets of mobile DevicesArndt Polifke
© GfK 2018 | TechFutures: Zukunftslabor Digital | April 17, 2018
2© GfK April 23, 2018 | GfK slide gallery
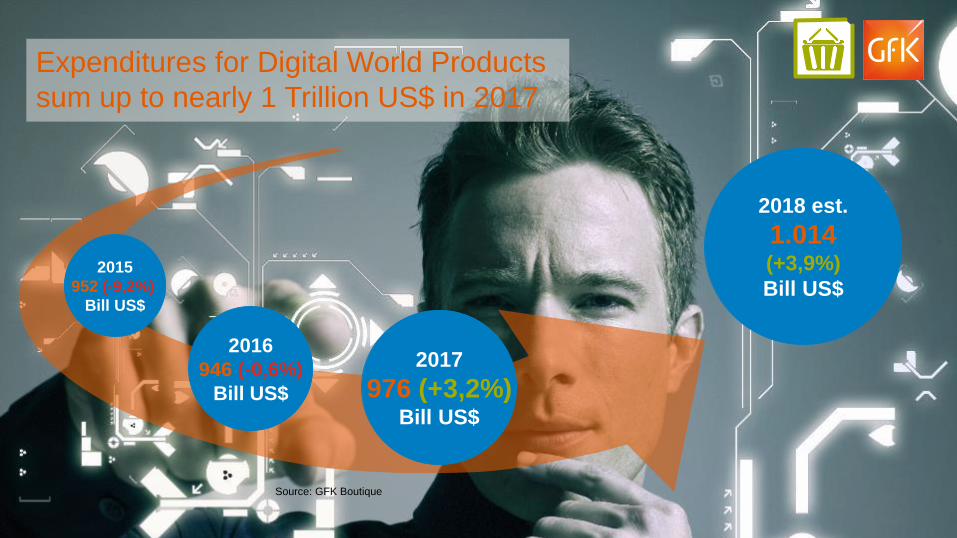
Expenditures for Digital World Products
sum up to nearly 1 Trillion US$ in 2017
2017
976 (+3,2%)Bill US$
2016
946 (-0,6%)
Bill US$
2015
952 (-9,2%)
Bill US$
2018 est.
1.014(+3,9%)
Bill US$
Source: GFK Boutique

3© GfK April 23, 2018 | GfK slide gallery
Smartphones are the Product that contributes the
highest share to total Tech Markets` Revenue, however
absorbing MP3 player, navigation device, camera etc
GfK Point-of-Sales tracking, value share %
48%41%
34% 31% 28% 27% 26% 25%
4%6%
7%6%
5% 4% 3% 3%
15%14%
13%13%
12% 12% 12% 12%
16%14%
14%13%
13%12% 11% 12%
18%26%
33% 37% 42% 46% 48% 48%
2011 2012 2013 2014 2015 2016 2017 2018
Smartphones
TV
Mobile PC
Tablet
all other products

4© GfK April 23, 2018 | GfK slide gallery
Smartphones are by far the most sold Digital World Product
Smartphones
1264 1358 1423 1460 1519
2014 2015 2016 2017 2018
Smartphones
TV
232 226 225 217 226
2014 2015 2016 2017 2018
TV
PC / PC Tablet
516 455 404 375 359
2014 2015 2016 2017 2018
PC/ PC TabletSource: GfK Boutique, Global Sales Mio Units

5© GfK April 23, 2018 | GfK slide gallery
While Western Europe and Developed APAC show a decline of demand
the trend for smartphones is still positive in various regions, leapfrogging
PCs in emerging regions as primary device for internet access
Smartphones Sales growth in % - 2017 +3% units
+9% value
Source : GfK POS
+9%Latam
+4%
MEA
+9% Eeastern Europe
+8% Emerging Asia
+1%
+2%
ChinaNorthamerica
-4%
-6%
Developed APAC
Western Europe

6© GfK April 23, 2018 | GfK slide gallery
Wireless
charging bezel-less display
Face recognition
Superfast charging
4K Video recording
Battery lifetime
Double lense Camera
Storage Capacity
High resolution Audio
IP CertificationScreen-to-body-ratio
18 : 9
7© GfK April 23, 2018 | GfK slide gallery
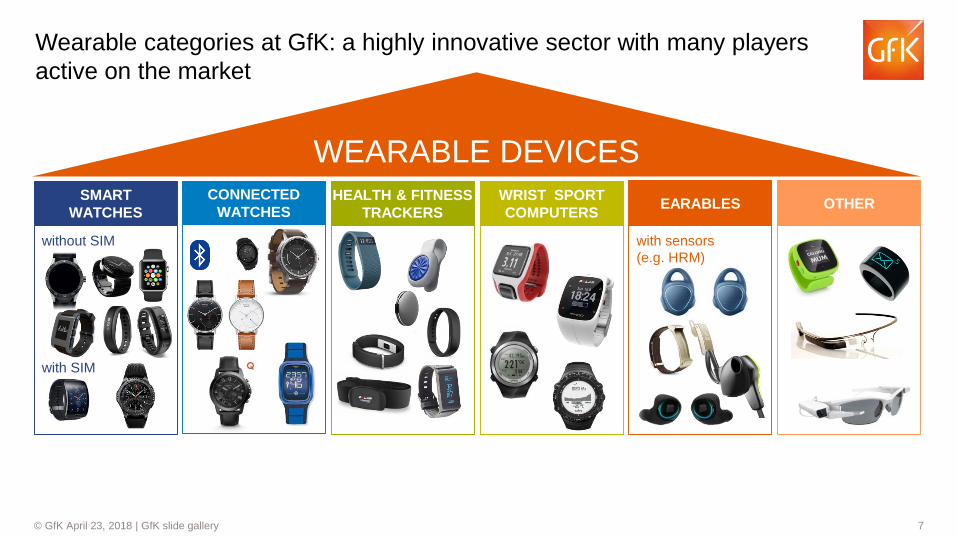
Wearable categories at GfK: a highly innovative sector with many players
active on the market
WEARABLE DEVICES
with sensors
(e.g. HRM)
EARABLES OTHERWRIST SPORT
COMPUTERS
HEALTH & FITNESS
TRACKERS
CONNECTED
WATCHES
without SIM
with SIM
SMART
WATCHES

8© GfK April 23, 2018 | GfK slide gallery
Watch manufacturers joined the wearable market in 2017 with their own and licensed
brands while first tech brands retreat.
HEALTH FASHION
TECH
+9
9© GfK April 23, 2018 | GfK slide gallery
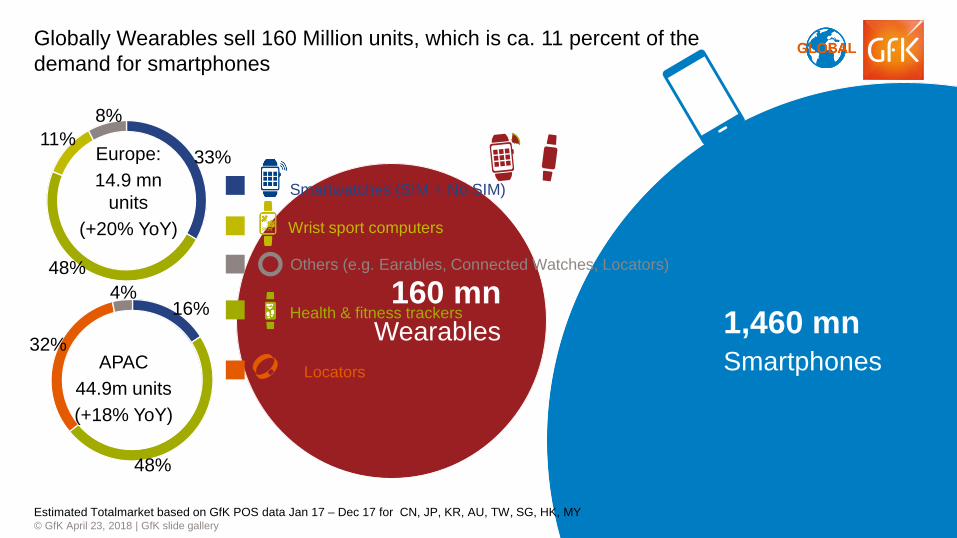
1,460 mnSmartphones
160 mnWearables
Globally Wearables sell 160 Million units, which is ca. 11 percent of the
demand for smartphones
33%
48%
11%
8%
Europe:
14.9 mn
units
(+20% YoY)
16%
48%
32%
4%
APAC
44.9m units
(+18% YoY)
Wrist sport computers
Health & fitness trackers
Smartwatches (SIM + No SIM)
Others (e.g. Earables, Connected Watches, Locators)
Locators
Estimated Totalmarket based on GfK POS data Jan 17 – Dec 17 for CN, JP, KR, AU, TW, SG, HK, MY
10© GfK April 23, 2018 | GfK slide gallery
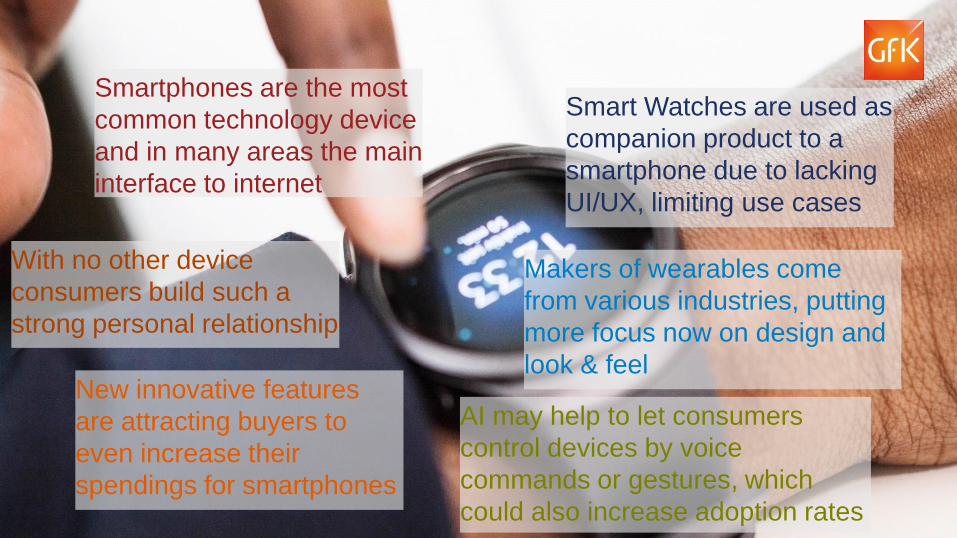
Smartphones are the most
common technology device
and in many areas the main
interface to internet
With no other device
consumers build such a
strong personal relationship
New innovative features
are attracting buyers to
even increase their
spendings for smartphones
Smart Watches are used as
companion product to a
smartphone due to lacking
UI/UX, limiting use cases
Makers of wearables come
from various industries, putting
more focus now on design and
look & feel
AI may help to let consumers
control devices by voice
commands or gestures, which
could also increase adoption rates

11© GfK April 23, 2018 | GfK slide gallery
Smartphones will remain
Wearables will emerge as an
independent category

12© GfK April 23, 2018 | GfK slide gallery
Thank you very much!


