20
Trends in the World Traditional & Renewable Heating Markets Krystyna Dawson Heating & Renewables Manager BSRIA WMI January 2015
| Date post: | 16-Jul-2015 |
| Category: |
Data & Analytics |
| Upload: | bsria |
| View: | 282 times |
| Download: | 1 times |

Trends in the World Traditional &
Renewable Heating Markets
Krystyna Dawson
Heating & Renewables
Manager
BSRIA WMI
January 2015
2 Excellence in Market Intelligence
Agenda
Worlds largest traditional heating markets
Growth in traditional heating, 2014
US Heating market overview
Water heating markets US and Europe
World renewable markets
Growing importance of controls
2
3 Excellence in Market Intelligence
Radiators 23%
UFH 10% WH
20%
CB 5%
DB 42%
Radiators 0% UFH
4%
WH 71%
CB 3%
DB/Furnaces 22%
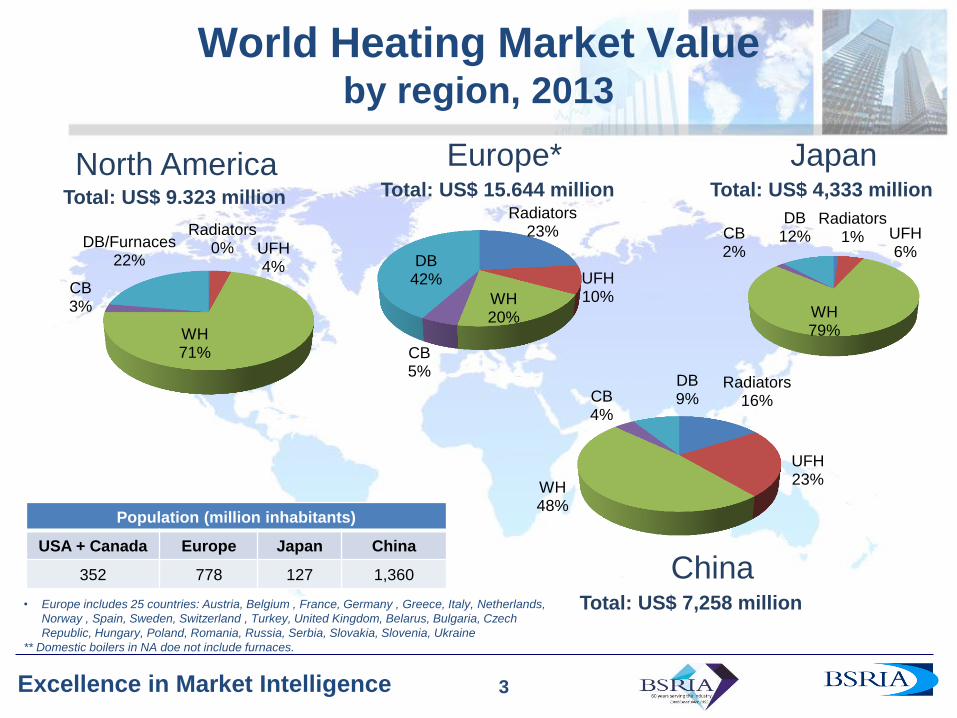
World Heating Market Value by region, 2013
• Europe includes 25 countries: Austria, Belgium , France, Germany , Greece, Italy, Netherlands,
Norway , Spain, Sweden, Switzerland , Turkey, United Kingdom, Belarus, Bulgaria, Czech
Republic, Hungary, Poland, Romania, Russia, Serbia, Slovakia, Slovenia, Ukraine
** Domestic boilers in NA doe not include furnaces.
Population (million inhabitants)
USA + Canada Europe Japan China
352 778 127 1,360
3
North America Total: US$ 9.323 million
Europe* Total: US$ 15.644 million
Radiators 1% UFH
6%
WH 79%
CB 2%
DB 12%
Japan Total: US$ 4,333 million
China Total: US$ 7,258 million
Radiators 16%
UFH 23%
WH 48%
CB 4%
DB 9%
4 Excellence in Market Intelligence
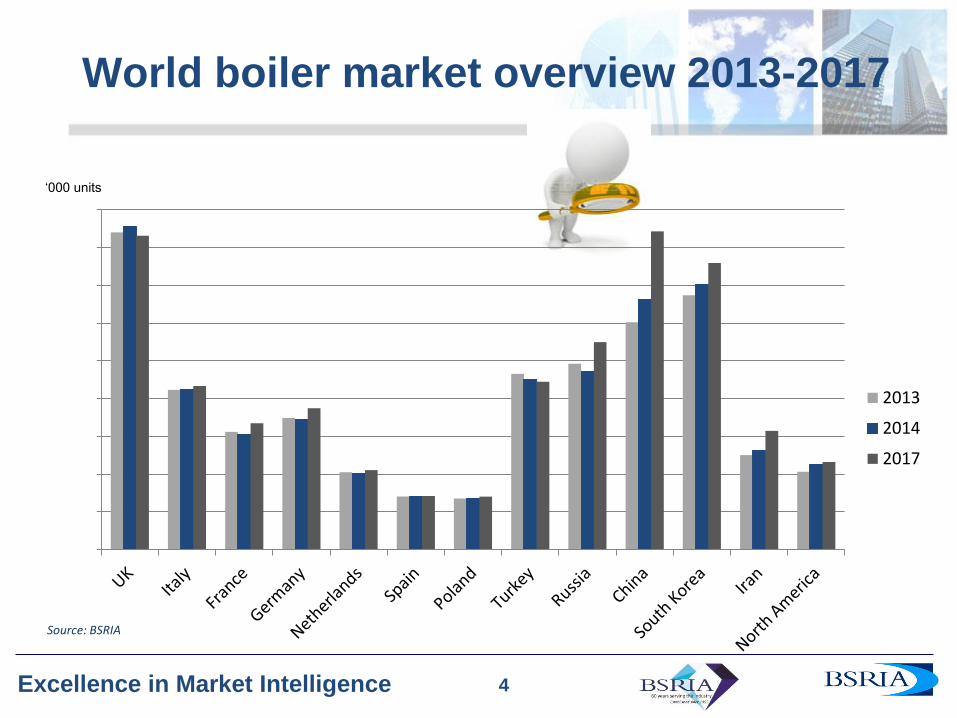
World boiler market overview 2013-2017
4
‘000 units
Source: BSRIA
0
200
400
600
800
1000
1200
1400
1600
1800
2013
2014
2017
5 Excellence in Market Intelligence
Gas furnaces,
89%
Oil furnaces,
0%
Electric furnaces,
9%
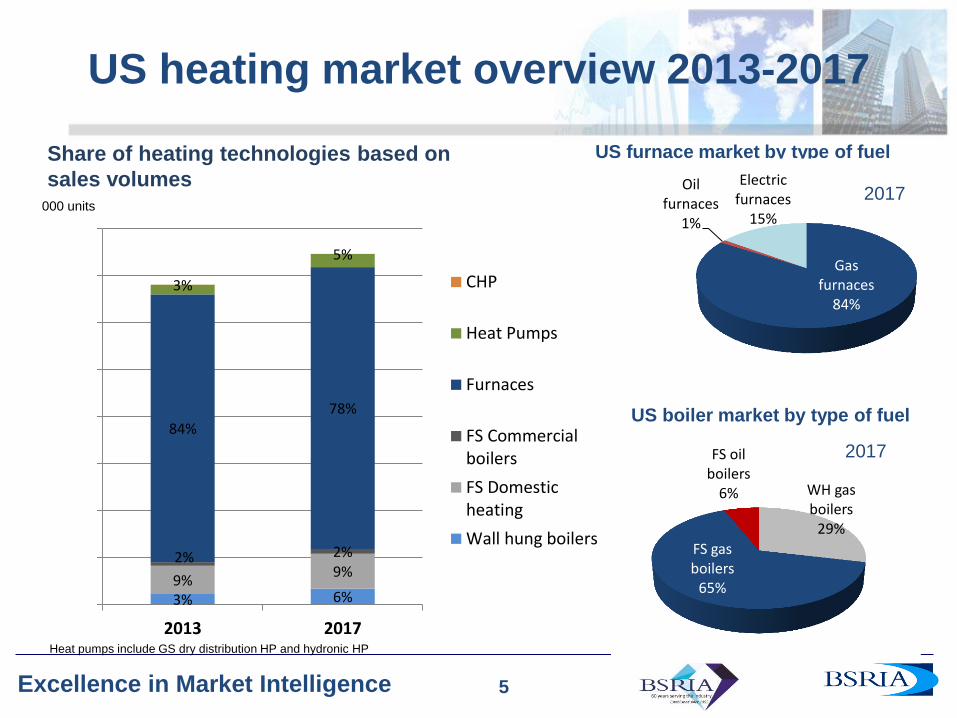
US heating market overview 2013-2017
5
Share of heating technologies based on
sales volumes
US furnace market by type of fuel
3% 6% 9%
9% 2% 2%
84%
78%
3%
5%
0
500
1000
1500
2000
2500
3000
3500
4000
2013 2017
CHP
Heat Pumps
Furnaces
FS Commercialboilers
FS Domesticheating
Wall hung boilers
000 units
2013
Gas furnaces
84%
Oil furnaces
1%
Electric furnaces
15%
2017
WH gas boilers
26%
FS gas boilers
60%
FS oil boilers
14%
US boiler market by type of fuel
2013
WH gas boilers
29%
FS gas boilers
65%
FS oil boilers
6%
2017
Heat pumps include GS dry distribution HP and hydronic HP

6 Excellence in Market Intelligence
Increasing
gasification in
China, Russia
and S. Korea
6
Main trends in traditional Heating markets,
2013 - 2014
Importance
Urgency
Move towards
Communal heating
Growing substitution
of boilers by
renewables
in new build
Increasing
penetration
of wall-hung
boilers
Gas-fuelled boilers
dominance grows
Energy efficiency
targets drive sales
of condensing boilers
and water heaters
• Low oil/gas
prices
• Push for
reduction of
CO2 emissions
• Energy
security issues
• Economics
Global Drivers:

7 Excellence in Market Intelligence
World Domestic Boiler Technology overview
Sales of Condensing units Sales of Non-Condensing units
Thousand u
nits
Thousand u
nits
2013 2014 2015 2016 2017
0.0
1,000.0
2,000.0
3,000.0
4,000.0
5,000.0
6,000.0
0
1,000
2,000
3,000
4,000
5,000
6,000
7,000
8,000
9,000
2013 2014 2015 2016 2017
Japan
China
NAmerica
Europe
CAGR
2013-2017
8.5%
CAGR
2013-2017
-7.5%
8 Excellence in Market Intelligence
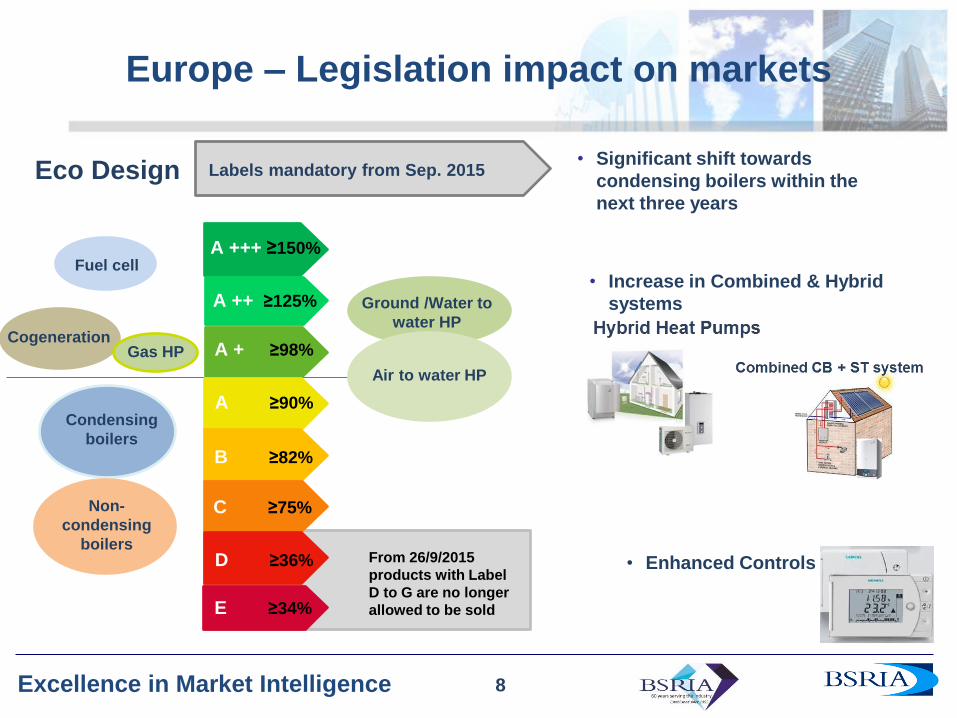
Europe – Legislation impact on markets
• Increase in Combined & Hybrid
systems
Eco Design
A +++ ≥150%
A ++ ≥125%
A + ≥98%
A ≥90%
B ≥82%
C ≥75%
D ≥36%
E ≥34%
Cogeneration Gas HP
Condensing
boilers
Non-
condensing
boilers
Ground /Water to
water HP
Air to water HP
From 26/9/2015
products with Label
D to G are no longer
allowed to be sold
• Enhanced Controls
Fuel cell
Labels mandatory from Sep. 2015
8
• Significant shift towards
condensing boilers within the
next three years
9 Excellence in Market Intelligence
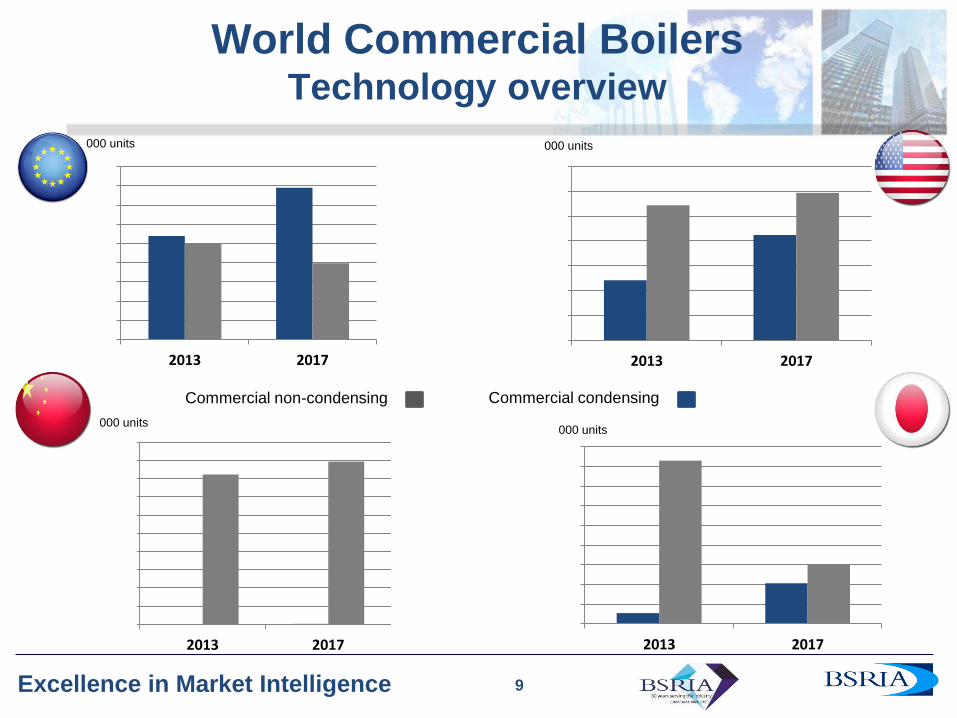
World Commercial Boilers Technology overview
9
000 units 000 units
0
20
40
60
80
100
120
140
160
180
2013 2017
Commercial condensing Commercial non-condensing
0
5
10
15
20
25
30
35
2013 2017
0
5
10
15
20
25
30
35
40
45
2013 2017
000 units
0
10
20
30
40
50
60
70
80
90
100
2013 2017
000 units
10 Excellence in Market Intelligence
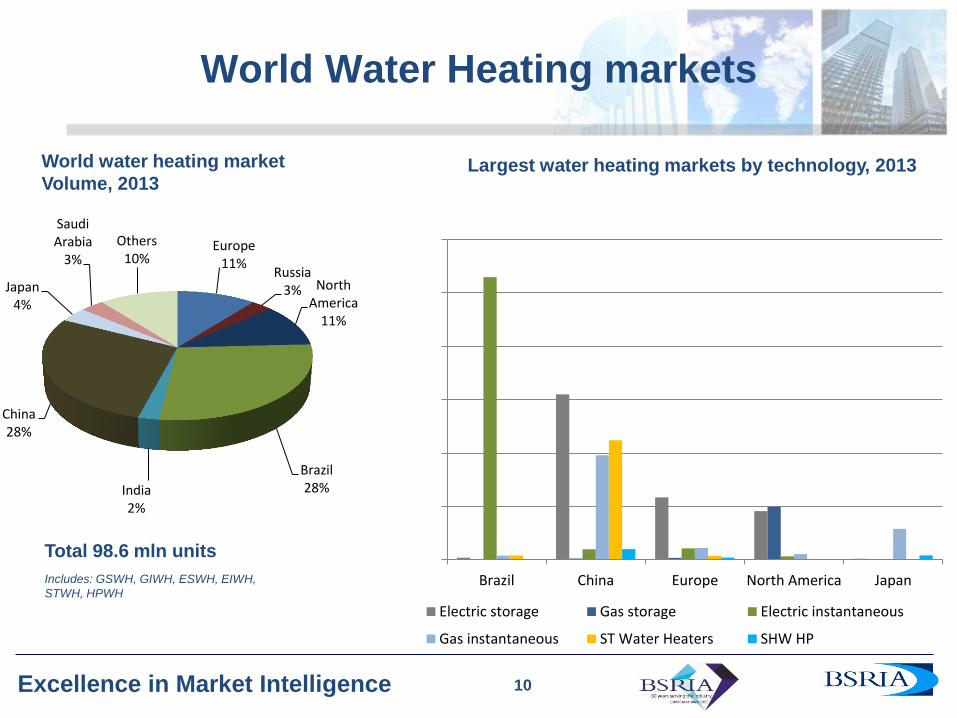
World Water Heating markets
10
Europe 11%
Russia 3% North
America 11%
Brazil 28% India
2%
China 28%
Japan 4%
Saudi Arabia
3%
Others 10%
World water heating market
Volume, 2013
Includes: GSWH, GIWH, ESWH, EIWH,
STWH, HPWH
Total 98.6 mln units 0.0
5,000.0
10,000.0
15,000.0
20,000.0
25,000.0
30,000.0
Brazil China Europe North America Japan
Electric storage Gas storage Electric instantaneous
Gas instantaneous ST Water Heaters SHW HP
Largest water heating markets by technology, 2013
000 units
11 Excellence in Market Intelligence
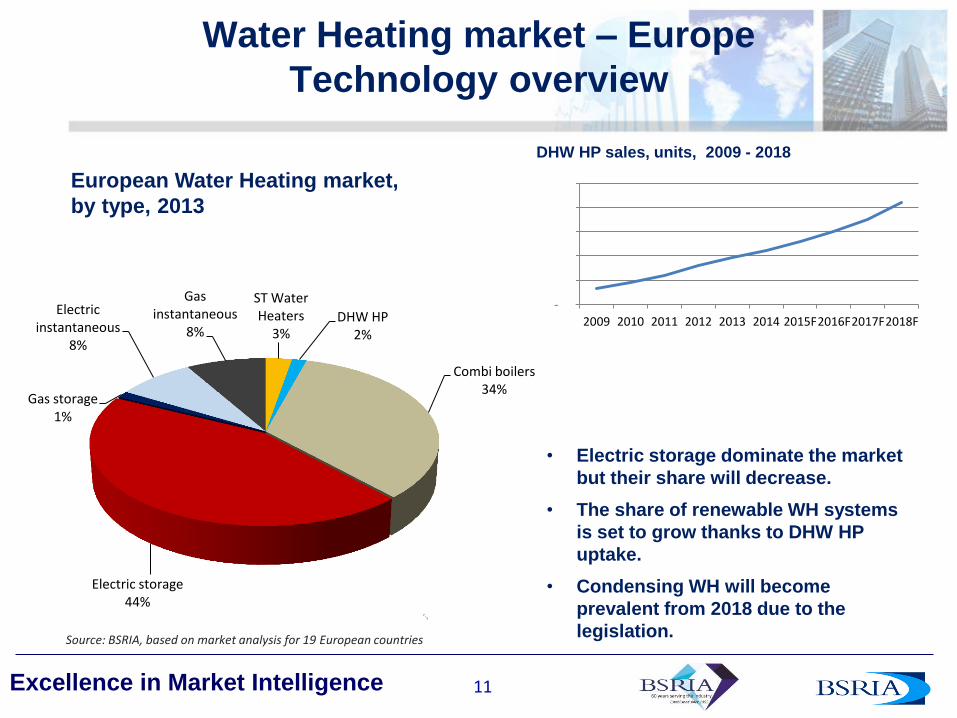
Water Heating market – Europe
Technology overview
11
European Water Heating market,
by type, 2013
DHW HP sales, units, 2009 - 2018
• Electric storage dominate the market
but their share will decrease.
• The share of renewable WH systems
is set to grow thanks to DHW HP
uptake.
• Condensing WH will become
prevalent from 2018 due to the
legislation.
Source: BSRIA, based on market analysis for 19 European countries
ST Water Heaters
3% DHW HP
2%
Combi boilers 34%
Electric storage 44%
Gas storage 1%
Electric instantaneous
8%
Gas instantaneous
8%
-
50,000
100,000
150,000
200,000
250,000
2009 2010 2011 2012 2013 2014 2015F2016F2017F2018F
12 Excellence in Market Intelligence 12
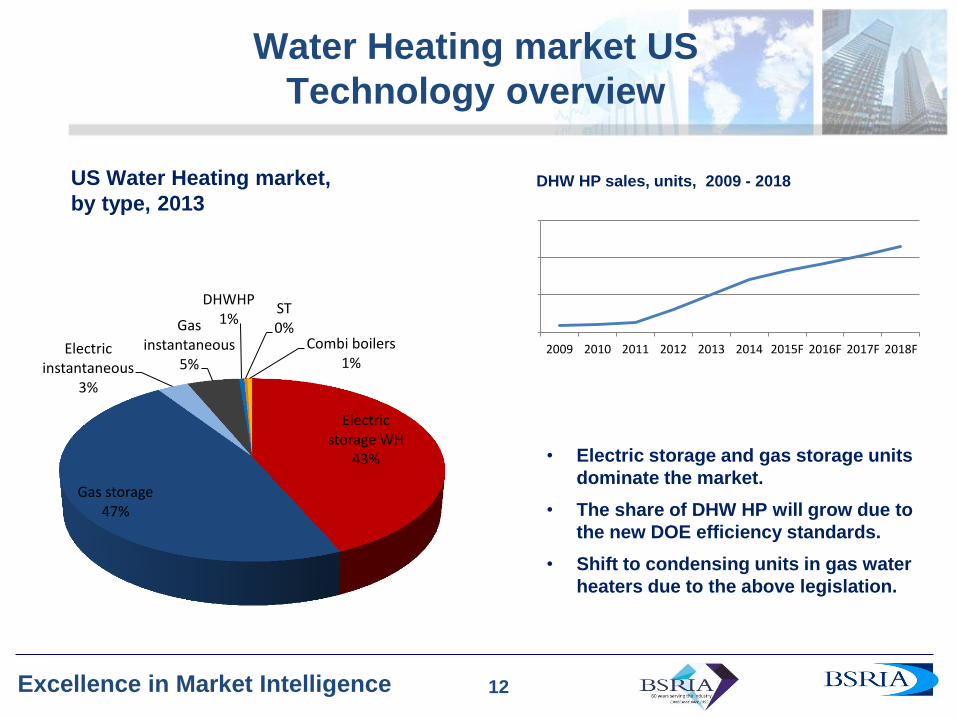
Water Heating market US
Technology overview
Electric storage WH
43%
Gas storage 47%
Electric instantaneous
3%
Gas instantaneous
5%
DHWHP 1%
ST 0%
Combi boilers 1%
US Water Heating market,
by type, 2013
0
50,000
100,000
150,000
2009 2010 2011 2012 2013 2014 2015F 2016F 2017F 2018F
DHW HP sales, units, 2009 - 2018
• Electric storage and gas storage units
dominate the market.
• The share of DHW HP will grow due to
the new DOE efficiency standards.
• Shift to condensing units in gas water
heaters due to the above legislation.
13 Excellence in Market Intelligence
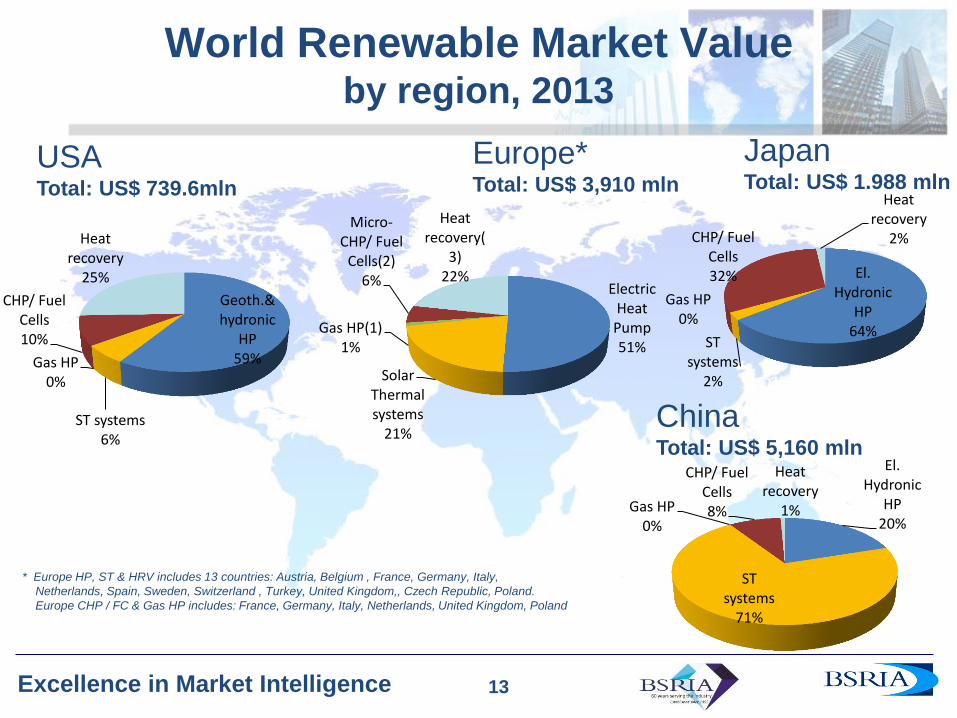
World Renewable Market Value by region, 2013
* Europe HP, ST & HRV includes 13 countries: Austria, Belgium , France, Germany, Italy,
Netherlands, Spain, Sweden, Switzerland , Turkey, United Kingdom,, Czech Republic, Poland.
Europe CHP / FC & Gas HP includes: France, Germany, Italy, Netherlands, United Kingdom, Poland
13
Europe* Total: US$ 3,910 mln
USA Total: US$ 739.6mln
Japan Total: US$ 1.988 mln
China Total: US$ 5,160 mln
Geoth.& hydronic
HP 59%
ST systems 6%
Gas HP 0%
CHP/ Fuel Cells 10%
Heat recovery
25% El. Hydronic
HP 64%
ST systems
2%
Gas HP 0%
CHP/ Fuel Cells 32%
Heat recovery
2%
Electric Heat Pump 51%
Solar Thermal systems
21%
Gas HP(1) 1%
Micro-CHP/ Fuel
Cells(2) 6%
Heat recovery(
3) 22%
El. Hydronic
HP 20%
ST systems
71%
Gas HP 0%
CHP/ Fuel Cells 8%
Heat recovery
1%
14 Excellence in Market Intelligence
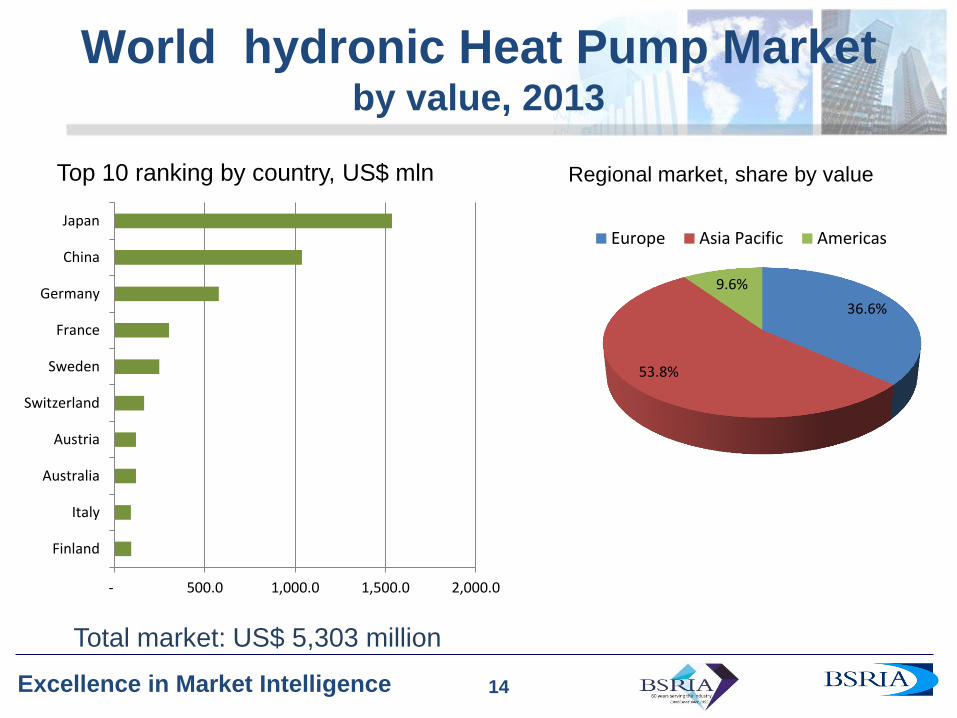
World hydronic Heat Pump Market by value, 2013
14
Regional market, share by value Top 10 ranking by country, US$ mln
Total market: US$ 5,303 million
- 500.0 1,000.0 1,500.0 2,000.0
Finland
Italy
Australia
Austria
Switzerland
Sweden
France
Germany
China
Japan
36.6%
53.8%
9.6%
Europe Asia Pacific Americas
15 Excellence in Market Intelligence
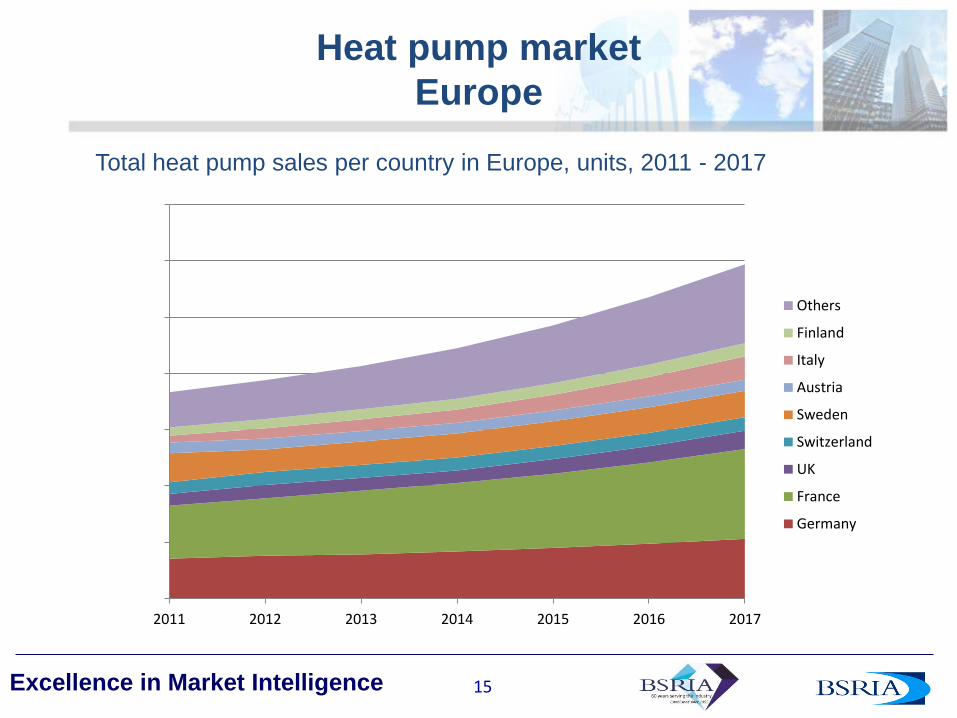
-
100,000
200,000
300,000
400,000
500,000
600,000
700,000
2011 2012 2013 2014 2015 2016 2017
Others
Finland
Italy
Austria
Sweden
Switzerland
UK
France
Germany
Heat pump market
Europe
Total heat pump sales per country in Europe, units, 2011 - 2017
16 Excellence in Market Intelligence
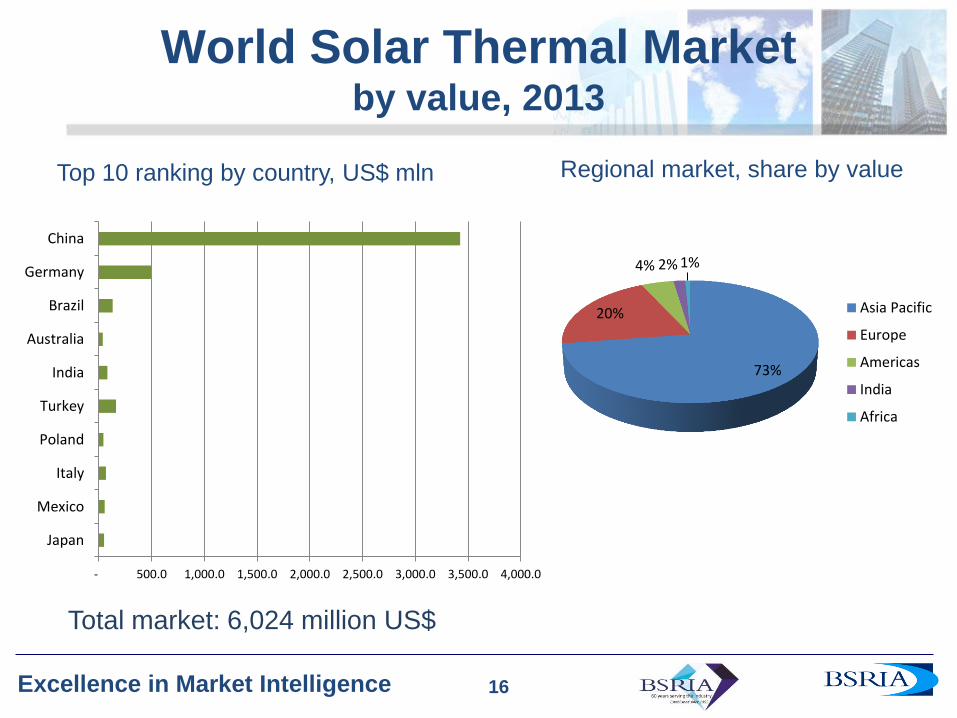
World Solar Thermal Market by value, 2013
16
Regional market, share by value Top 10 ranking by country, US$ mln
Total market: 6,024 million US$
73%
20%
4% 2% 1%
Asia Pacific
Europe
Americas
India
Africa
- 500.0 1,000.0 1,500.0 2,000.0 2,500.0 3,000.0 3,500.0 4,000.0
Japan
Mexico
Italy
Poland
Turkey
India
Australia
Brazil
Germany
China
17 Excellence in Market Intelligence
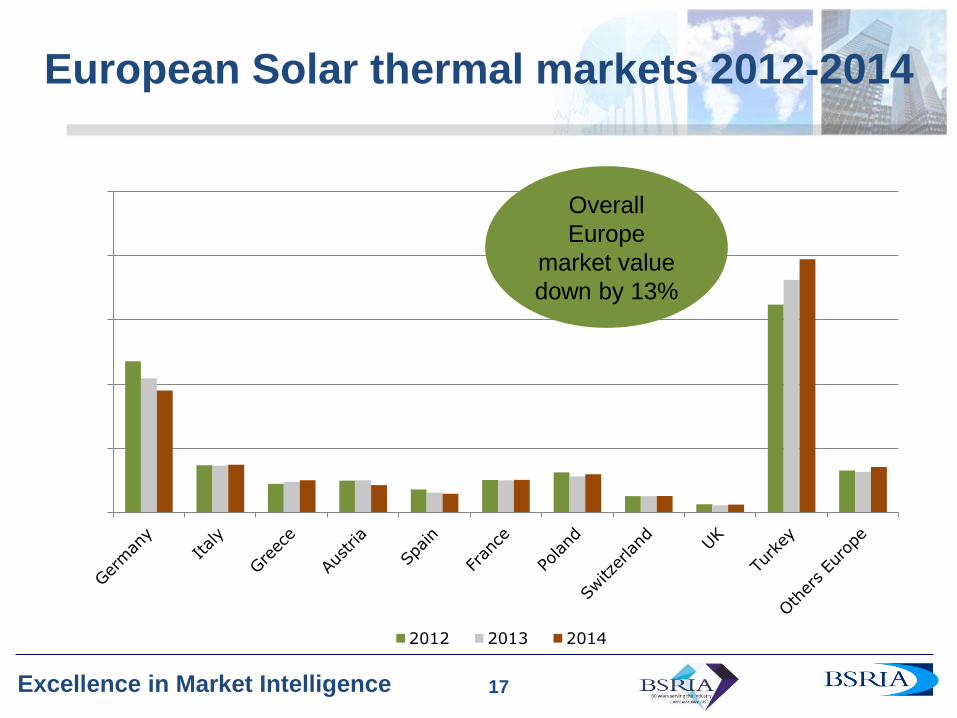
European Solar thermal markets 2012-2014
17
-
500
1,000
1,500
2,000
2,500
2012 2013 2014
Overall
Europe
market value
down by 13%
18 Excellence in Market Intelligence 18
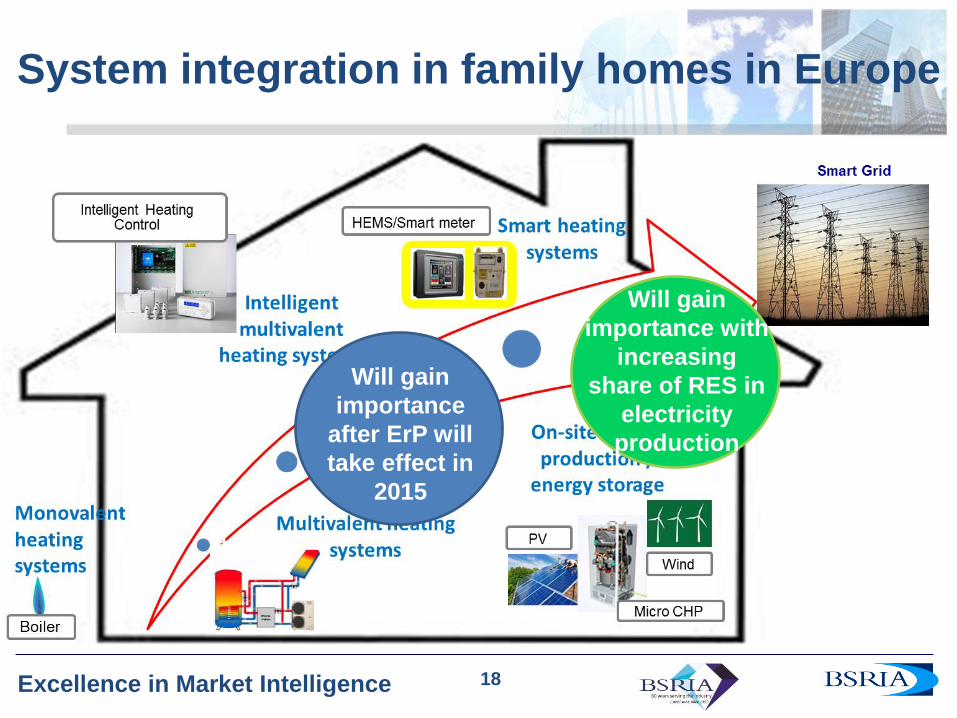
System integration in family homes in Europe
Will gain
importance
after ErP will
take effect in
2015
Will gain
importance with
increasing
share of RES in
electricity
production
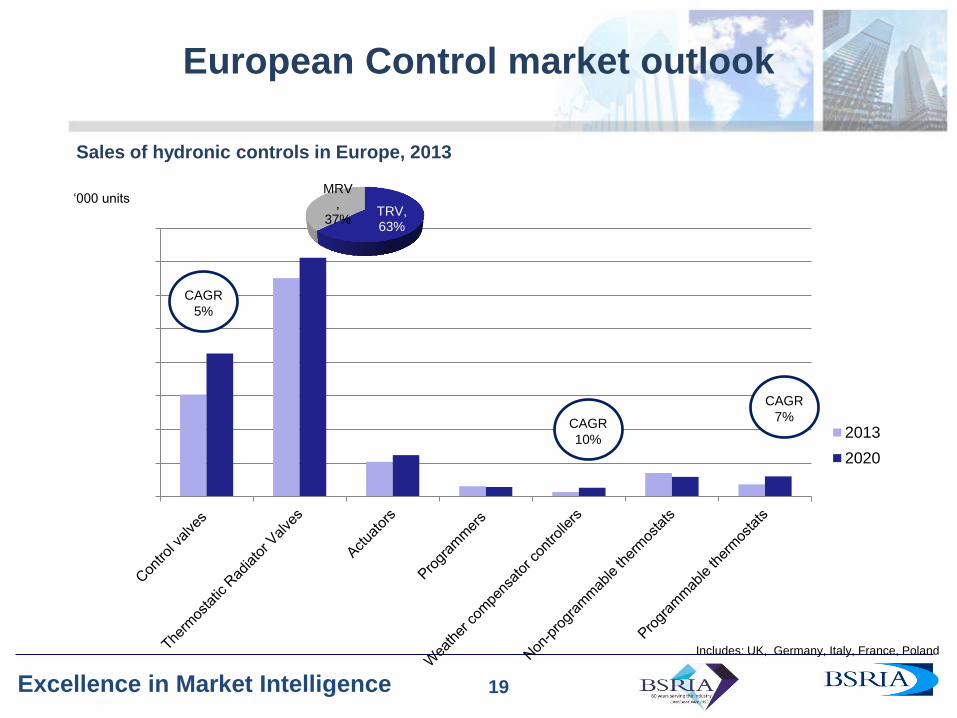
19 Excellence in Market Intelligence 19
Sales of hydronic controls in Europe, 2013
European Control market outlook
-
5,000.00
10,000.00
15,000.00
20,000.00
25,000.00
30,000.00
35,000.00
40,000.00
2013
2020
‘000 units
CAGR
7% CAGR
10%
CAGR
5%
TRV, 63%
MRV,
37%
Includes: UK, Germany, Italy, France, Poland
20 Excellence in Market Intelligence
Thank you
Contact:
Krystyna Dawson
Senior Manager – Heating & Renewables
BSRIA Worldwide Market Intelligence
Direct: +44 (0)1344 465 638; Mob: +44 (0)7990 595836
Email: [email protected]


