18
APRIL 2020 Trends in U.S. Intention-to- Stay Rates of International Ph.D. Graduates Across Nationality and STEM Fields CSET Issue Brief AUTHORS Remco Zwetsloot Jacob Feldgoise James Dunham

APRIL 2020
Trends in U.S. Intention-to-Stay Rates of International Ph.D. Graduates Across Nationality and STEM Fields CSET Issue Brief
AUTHORS Remco Zwetsloot Jacob Feldgoise James Dunham

Table of Contents
Executive Summary 3
International Ph.D. Graduates in U.S. STEM Fields 5
Trends in Intention-to-Stay Rates Across Nationality and STEM Fields 7
Intention-to-Stay Rates by STEM Field 7 Intention-to-Stay Rates by Nationality 8
Intention-to-Stay Rates by Nationality and STEM Field 9 Country Profile: China 10 Country Profile: India 12 Conclusion 14
Data Notes 16
Acknowledgments 16
Endnotes 17

Center for Security and Emerging Technology | 3
Executive Summary This Issue Brief assesses how many international Ph.D. graduates intend to stay in the United States after completing their degrees, and how these intentions differ across fields and nationalities. All analysis is based on data from the National Science Foundation’s Survey of Earned Doctorates, an annual census of all Ph.D. graduates from U.S. universities (see Box 1). Past studies show that intention-to-stay rates, the focus of this paper, correlate strongly with actual stay rates. The results speak to recent debates about the continued ability of the United States to attract and retain global talent. Many fear that an increase in international competition is eroding the country’s talent and innovation assets.1 Chinese students feature especially prominently in these debates due to concerns about technology transfer, and a widespread perception exists of a “reverse brain drain” of Chinese citizens leaving the United States.2 We find little evidence of decreasing U.S. attractiveness either among international Ph.D. students in general or among Chinese students specifically. Instead, we find that:
● International students account for a large portion of U.S. STEM Ph.D. graduates, with large variation across fields. International graduates are most numerous in computer science and engineering (around 60 percent) and least numerous in the health and biological sciences (below 30 percent). In nearly all STEM fields, the proportion of graduates who are international remained constant or decreased slightly between 2010 and 2017.
● Intention-to-stay rates among international Ph.D. graduates are 70 percent or higher in all STEM fields. They are highest—between 85 and 90 percent—in computer science, biology, and engineering. Across all STEM fields, intention-to-stay rates either held steady or increased slightly between 2000 and 2017.

Center for Security and Emerging Technology | 4
● Intention-to-stay rates are highest—above 85 percent—among students from Iran, India, and China. Students from richer countries, such as European Union member states and Canada, intend to stay at lower rates (around 75 percent). Intention-to-stay rates increased for students from most countries of origin between 2000 and 2017.
● The two most common countries of origin among international Ph.D. graduates are China and India. Looking closely at these graduates, we find that:
○ Among graduates from China, engineering (40 percent) and the physical sciences (20 percent) are the most popular fields of study. In these and most other STEM fields, intention-to-stay rates were around 85 to 90 percent in 2017. Rates declined somewhat in the 2000–2010 period, but mostly remained constant between 2010 and 2017.
○ Among graduates from India, engineering (40 percent) and the biological and health sciences (cumulatively 30 percent) are the most popular fields of study. In these and most other STEM fields intention-to-stay rates were between 85 and 95 percent in 2017, with little change between 2000 and 2017.
Box 1. Data: The National Science Foundation’s Survey of Earned Doctorates
This Issue Brief is based on data from the NSF’s Survey of Earned Doctorates (SED), which has been administered annually to all Ph.D. graduates from U.S. universities since 1957. The survey is administered to approximately 55,000 individuals who obtain degrees from 431 universities. The survey asks Ph.D. graduates for a range of background information, including their demographic and educational background, degree field, and post-graduation plans. Response rates for the survey are consistently above 90 percent.3 SED data is not publicly available due to privacy considerations. Researchers can request access to the data through an NSF license request. The use of NSF data does not imply NSF endorsement of the research, research methods, or conclusions contained in this report. Further relevant information about the SED and the data reported here is discussed in the “Data Notes” at the end of this Brief. The NSF also has extensive documentation for the SED available on its website, including a copy of the full survey and an annual report with detailed data tables.4
Center for Security and Emerging Technology | 5
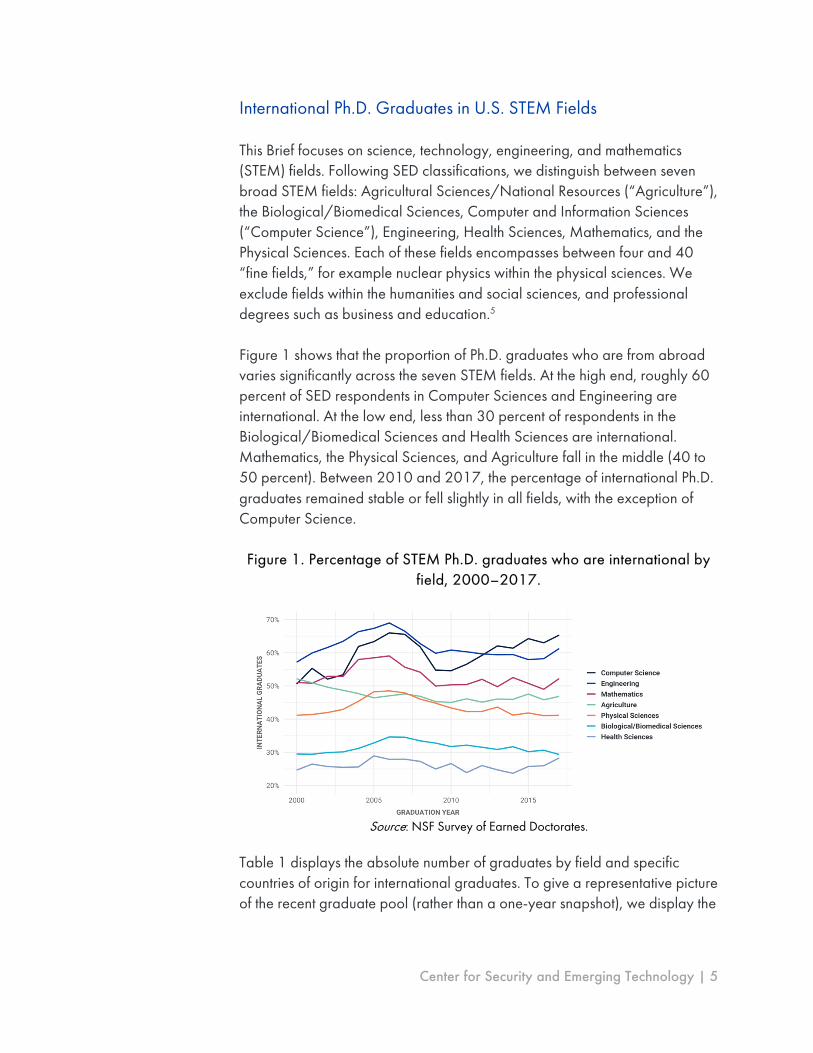
International Ph.D. Graduates in U.S. STEM Fields This Brief focuses on science, technology, engineering, and mathematics (STEM) fields. Following SED classifications, we distinguish between seven broad STEM fields: Agricultural Sciences/National Resources (“Agriculture”), the Biological/Biomedical Sciences, Computer and Information Sciences (“Computer Science”), Engineering, Health Sciences, Mathematics, and the Physical Sciences. Each of these fields encompasses between four and 40 “fine fields,” for example nuclear physics within the physical sciences. We exclude fields within the humanities and social sciences, and professional degrees such as business and education.5 Figure 1 shows that the proportion of Ph.D. graduates who are from abroad varies significantly across the seven STEM fields. At the high end, roughly 60 percent of SED respondents in Computer Sciences and Engineering are international. At the low end, less than 30 percent of respondents in the Biological/Biomedical Sciences and Health Sciences are international. Mathematics, the Physical Sciences, and Agriculture fall in the middle (40 to 50 percent). Between 2010 and 2017, the percentage of international Ph.D. graduates remained stable or fell slightly in all fields, with the exception of Computer Science.
Figure 1. Percentage of STEM Ph.D. graduates who are international by field, 2000–2017.
Source: NSF Survey of Earned Doctorates.
Table 1 displays the absolute number of graduates by field and specific countries of origin for international graduates. To give a representative picture of the recent graduate pool (rather than a one-year snapshot), we display the

Center for Security and Emerging Technology | 6
average annual number of graduates across fields and countries between 2015 and 2017. The seven included countries and regions—China, India, Iran, South Korea, the European Union, Taiwan, and Turkey—are the most common places of origin in STEM fields, collectively accounting for 32 percent of total Ph.D. graduates and 72 percent of international graduates over that time period.
Table 1. Annual number and percentage of STEM Ph.D. graduates by field and country/region of origin, averaged across 2015–2017.
Total Domestic China India Iran South Korea
European Union
Taiwan Turkey Other
Agriculture 1,310 698 (53%)
184 (14%)
54 (4%)
13 (1%)
26 (2%)
19 (1%)
10 (1%)
13 (1%)
293 (22%)
Biological / Biomedical Sciences
8,539 5,974 (70%)
833 (10%)
512 (6%)
39 (0%)
122 (1%)
125 (1%)
115 (1%)
43 (0%)
777 (9%)
Computer Science
2,026 725 (36%)
477 (24%)
197 (10%)
81 (4%)
68 (3%)
73 (4%)
37 (2%)
42 (2%)
326 (16%)
Engineering 9,206 3,758 (41%)
1,990 (22%)
783 (9%)
602 (7%)
330 (4%)
202 (2%)
164 (2%)
161 (2%)
1,217 (13%)
Health Sciences
2,270 1,664 (73%)
111 (5%)
107 (5%)
8 (0%)
57 (2%)
26 (1%)
32 (1%)
4 (0%)
261 (11%)
Mathematics 1,784 879 (49%)
447 (25%)
55 (3%)
18 (1%)
41 (2%)
64 (4%)
20 (1%)
25 (1%)
235 (13%)
Physical Sciences
5,916 3,470 (59%)
1,007 (17%)
292 (5%)
90 (2%)
82 (1%)
137 (2%)
78 (1%)
41 (1%)
720 (12%)
All STEM Fields
31,052 17,168 (55%)
5,049 (16%)
2,000 (6%)
851 (3%)
726 (2%)
645 (2%)
456 (1%)
329 (1%)
3,830 (12%)
Source: NSF Survey of Earned Doctorates. Percentages may not add up to 100 due to rounding.
Table 1 shows certain STEM fields outpace others in terms of the absolute number of Ph.D. graduates. Engineering and the Biological/Biomedical Sciences total around 8,000 or 9,000 annual graduates on average, compared to around 2,000 or fewer in the Health Sciences, Computer Science, Agriculture, and Mathematics. It also shows that China and India are

Center for Security and Emerging Technology | 7
the two most common countries of origin for international Ph.D. graduates by a significant margin. The last section of this paper analyzes Chinese and Indian graduates in particular.
Trends in Intention-to-Stay Rates Across Nationality and STEM Fields This section analyzes how many international Ph.D. graduates intend to stay in the United States after they complete their degrees, and how these intentions differ across fields and nationalities. Intention-to-stay rates are measured by respondents’ answers to the SED question “where do you intend to live in the year after graduation?” Response rates for this question average around 92 percent (see the “Data Notes” section at the end of the paper).6 The survey is typically taken by Ph.D. students either in the final semester before graduation or soon after graduation, meaning most respondents will be relatively certain about their post-graduation positions. Nonetheless, respondents may change plans between completing the survey and graduating because the question is prospective. Statistics on intention-to-stay rates correlate strongly with statistics on actual stay rates available from other data sources. For example, one study tracking Ph.D. graduates five and ten years after graduation found that Chinese and Indian graduates have among the highest long-term stay rates (both around 85 percent).7 Chinese and Indian graduates also have higher intention-to-stay rates than those from most other countries, and their levels correspond closely to actual stay rates.8 Intention-to-Stay Rates by STEM Field Figure 2 shows intention-to-stay rates across the seven broad STEM fields between 2010 and 2017. In 2017, rates were highest in Computer Science (87 percent), the Biological/Biomedical Sciences (86 percent), and Engineering (85 percent), followed by the Physical Sciences (81 percent), Mathematics (79 percent), the Health Sciences (73 percent), and Agriculture (69 percent). Notably, between 2000 and 2017, intention-to-stay rates either held steady or increased slightly across all seven STEM fields.

Center for Security and Emerging Technology | 8
Figure 2. Intention-to-stay rates among international STEM Ph.D. graduates by field, 2000–2017
Source: NSF Survey of Earned Doctorates.
Intention-to-Stay Rates by Nationality Table 2 shows the number of STEM graduates and their intention-to-stay rates by country of origin (in descending order of the most common countries of origin). Graduates from China, India, and Iran have the highest intention-to-stay rates (around or above 90 percent), while graduates from the European Union, Canada, Turkey, and elsewhere are lower (historically at around 65 to 75 percent).9 Over time, intention-to-stay rates have increased or held steady for most countries, with China as an exception. There are also notable cross-country differences in how many STEM Ph.D.s enroll and graduate. Whereas the number of domestic graduates and those from China and Iran steadily increased over time, the number of students from other countries or regions listed in Table 2 have mostly remained flat or even decreased somewhat.

Center for Security and Emerging Technology | 9
Table 2. Average annual number of graduates and intention-to-stay rates among STEM Ph.D. graduates by country/region of origin, 2000–2017.
2000–2005 2006–2011 2012–2017
Graduates Stay rate Graduates Stay rate Graduates Stay rate
Domestic 10,538 97% 13,496 96% 16,176 96%
China 2,740 95% 3,788 91% 4,646 87%
India 838 93% 1,995 91% 2,030 91%
South Korea 819 77% 994 74% 757 75%
EU 871 75% 861 73% 664 75%
Iran 82 94% 191 93% 657 95%
Taiwan 434 72% 477 75% 481 84%
Turkey 274 67% 336 77% 320 74%
Canada 246 72% 308 72% 250 76%
Other 2,326 64% 2,767 69% 3,277 70%
Source: NSF Survey of Earned Doctorates.
Intention-to-Stay Rates by Nationality and STEM Field Given their countries’ relatively large percentage of total graduates, this section assesses trends among Chinese and Indian Ph.D. graduates, looking at numbers and intention-to-stay rates across STEM fields. The number of Chinese graduates is especially high, and has increased steadily since the turn of the century (Figure 3).

Center for Security and Emerging Technology | 10
Figure 3. Average annual number of STEM Ph.D. graduates from China and India, 2000–2017.1
Source: NSF Survey of Earned Doctorates.
When disaggregating by field and nationality at the same time, certain data points rely on a low number of respondents. This raises the chance of random fluctuations in the results, especially in low-enrollment STEM fields such as Agriculture or the Health Sciences. To address this risk, the tables and figures in this section usually aggregate two or more years together. However, this is only a partial solution, so any changes in intention-to-stay rates should be interpreted with caution. Country Profile: China Figure 4 shows the annual number and proportion of Chinese Ph.D. graduates by STEM field, averaged for academic years 2016 and 2017. Engineering degrees lead, with around 2,000 Ph.D. graduates per year, accounting for 40 percent of total Chinese graduates, followed by the
1 In this figure and the figures below, data is displayed for the second year of the two-year grouping. For example, average annual intention-to-stay rates for the academic years 2000 and 2001 are displayed on the year 2001.

Center for Security and Emerging Technology | 11
Physical Sciences (around 1,000 graduates, or 20 percent of the total) and the Biological/Biomedical Sciences (around 800 graduates, or 16 percent). Figure 4. Average annual number and percentage of Chinese STEM Ph.D.
graduates by field, 2016–2017.
Source: NSF Survey of Earned Doctorates.
Figure 5 traces the intention-to-stay rates of Chinese Ph.D. graduates across STEM fields between 2000 and 2017, averaged over two-year periods. Between 2000 and 2010, intention-to-stay rates dropped from a very high starting point (often close to 100 percent) to around 85 to 90 percent. Between 2010 and 2017, on the other hand, rates held steady in most fields, except Computer Science (a mild increase) and Agriculture (a mild decrease). In 2016–2017, Computer Science saw the highest intention-to-stay rates (nearly 95 percent, compared to 88 percent for all international students as seen in Figure 2). Rates ranged from 85 to 90 percent for most other fields, with only Agriculture (close to 75 percent) scoring lower.10

Center for Security and Emerging Technology | 12
Figure 5. Intention-to-stay rates of Chinese STEM Ph.D. graduates by field, 2000–2017.
Source: NSF Survey of Earned Doctorates.
At the time of writing, SED data is available for approximately half of eventual 2018 respondents. Because the data is not yet complete, we exclude it from the figure above. However, the preliminary 2018 data suggests steady intention-to-stay rates in the Biological/Biomedical Sciences (a one percentage point increase from 2017 to 90 percent), the Physical Sciences (84 percent, no change), Health Sciences (one-point increase to 87 percent), and Engineering (87 percent, no change). There were larger drops in Computer Science (four points to 90 percent), Mathematics (four points to 82 percent), and Agriculture (four points to 71 percent). These numbers may change when the full data become available.11 Country Profile: India Figure 6 shows the annual number and proportion of Indian Ph.D. graduates by STEM field, averaged for academic years 2016–2017. As with Chinese graduates, Engineering degrees are clearly the most popular, with around 750 Ph.D. graduates per year—or 40 percent of total Indian STEM graduates—followed by the Biological/Biomedical Sciences (a little under 500, or 26 percent) and the Physical Sciences (a little under 300, or 14 percent).

Center for Security and Emerging Technology | 13
Figure 6. Average annual number and percentage of Indian STEM Ph.D. graduates by field, 2016–2017.
Source: NSF Survey of Earned Doctorates.
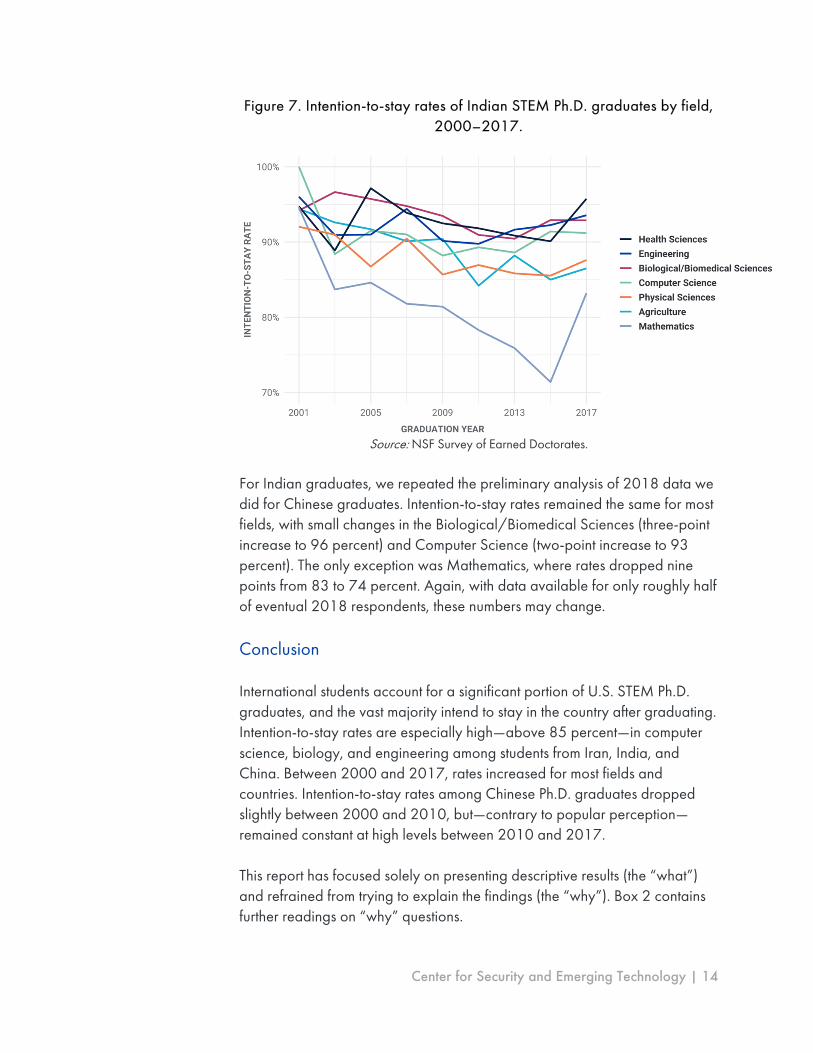
Figure 7 displays intention-to-stay rates among Indian Ph.D. graduates between 2000 and 2017. They decreased slightly over that period, but less so than for Chinese Ph.D. graduates. In 2017, rates were above 90 percent among graduates in the Health Sciences, Engineering, the Biological/Biomedical Sciences, and Computer Science, and close to 90 percent in Agriculture and the Physical Sciences. Intention-to-stay rates are generally lowest in Mathematics.
Center for Security and Emerging Technology | 14
Figure 7. Intention-to-stay rates of Indian STEM Ph.D. graduates by field, 2000–2017.
Source: NSF Survey of Earned Doctorates.
For Indian graduates, we repeated the preliminary analysis of 2018 data we did for Chinese graduates. Intention-to-stay rates remained the same for most fields, with small changes in the Biological/Biomedical Sciences (three-point increase to 96 percent) and Computer Science (two-point increase to 93 percent). The only exception was Mathematics, where rates dropped nine points from 83 to 74 percent. Again, with data available for only roughly half of eventual 2018 respondents, these numbers may change. Conclusion International students account for a significant portion of U.S. STEM Ph.D. graduates, and the vast majority intend to stay in the country after graduating. Intention-to-stay rates are especially high—above 85 percent—in computer science, biology, and engineering among students from Iran, India, and China. Between 2000 and 2017, rates increased for most fields and countries. Intention-to-stay rates among Chinese Ph.D. graduates dropped slightly between 2000 and 2010, but—contrary to popular perception—remained constant at high levels between 2010 and 2017. This report has focused solely on presenting descriptive results (the “what”) and refrained from trying to explain the findings (the “why”). Box 2 contains further readings on “why” questions.

Center for Security and Emerging Technology | 15
While valuable, the data analyzed for this Brief has shortcomings. First, stay rates are measured by intent expressed on a survey, which could pose reliability issues. As noted above, data on intention-to-stay rates correlates strongly with data on actual stay rates, but future research could explore using the NSF’s Survey of Doctorate Recipients (SDR), which tracks U.S. Ph.D. recipients’ careers over time, to analyze actual stay rates in a similarly disaggregated fashion.12 Second, the Survey of Earned Doctorates (SED) data is limited to Ph.D. recipients, excluding other important categories such as master’s and bachelor’s students. Neither the NSF nor any other organization we know of collects data that would allow us to systematically analyze stay rates among master’s or bachelor’s students. Despite these shortcomings, this Issue Brief illustrates that the United States possesses enduring strengths in the attraction and retention of top international talent.
Box 2. Further Reading on International Stay Rates
● For more information on and findings from SED, see the NSF’s most recent Survey of Earned Doctorates report.13
● For historical background and statistics on international Ph.D. students in the United States,
see “Internationalization of U.S. Doctorate Education,”14 by John Bound, Sarah Turner, and Patrick Walsh for the National Bureau of Economic Research.
● For a review of the research on how Ph.D. graduates make career and migration choices,
detailed data on stay rates among AI Ph.D.’s, and a related policy discussion, see CSET’s
report “Keeping Top AI Talent in the United States: Findings and Policy Options for International Graduate Student Retention.”15
● For statistics on long-term stay rates among international Ph.D. graduates (derived from a
different NSF survey), see “Stay Rates of Foreign Doctorate Recipients from U.S. Universities, 2013”16 by Michael G. Finn and Leigh-Ann Pennington at the Oak Ridge
Institute for Science and Education.
● For background on how the United States compares to other countries in Ph.D. graduates
(and higher education more broadly), see the most recent edition of the NSF’s Science and Engineering Indicators.17

Center for Security and Emerging Technology | 16
Data Notes The SED questions analyzed in this report are (question numbers from the AY 2018 version; response rates averaged over AY 2009–2018):
● For intention-to-stay rates: “B1. Where do you intend to live in the year after graduation?” (Response rate: 92 percent)
● For degree field: “A3. Please choose the field number from the Field of Study list … that best matches your primary field of study for your research doctoral degree.” (Response rate: 100 percent)
● For nationality: “C8. (If a non-U.S. citizen) Of which country are you a citizen?” (Response rate: 94 percent)
The SED collects information on a long list of fine degree fields, aggregated into overarching “broad” fields. We mostly followed the SED’s broad field taxonomy in reporting our results. We pulled out the three main fields of the “Life Sciences” (Agriculture, Biological/Biomedical Sciences, and Health Sciences) as distinct categories. We were unable to adopt a similar approach for the “Physical Sciences” because many of the finer degree fields have too few graduates for reliable statistical disaggregation. Acknowledgments Thanks to Darius Singpurwalla and staff at the NSF’s National Center for Science and Education Statistics for help accessing and analyzing the SED data, to Abigail Okrent for comments, and to Allie Vreeman and Matt Mahoney for editorial support. The use of NSF data does not imply NSF endorsement of the research, research methods, or conclusions contained in this report. © 2020 Center for Security and Emerging Technology. All rights reserved.
Center for Security and Emerging Technology | 17
Endnotes 1 For example, see James Manyika and William H. McRaven, “Innovation and National Security: Keeping Our Edge” (Council on Foreign Relations, September 18, 2019), https://www.cfr.org/report/keeping-our-edge/pdf/TFR_Innovation_Strategy.pdf; and “The Contest for Innovation: Strengthening America’s National Security Innovation Base in an Era of Strategic Competition” (Ronald Reagan Institute, December 2019), https://www.reaganfoundation.org/media/355498/the_contest_for_innovation_report.pdf. 2 For example, see Michael Brown and Pavneet Singh, China’s Technology Transfer Strategy: How Chinese Investments in Emerging Technology Enable A Strategic Competitor to Access the Crown Jewels of U.S. Innovation (Washington, DC: Defense Innovation Unit Experimental, January 2018), https://admin.govexec.com/media/diux_chinatechnologytransferstudy_jan_2018_(1).pdf; and “The Contest for Innovation: Strengthening America’s National Security Innovation Base in an Era of Strategic Competition” (Ronald Reagan Institute, December 2019), https://www.reaganfoundation.org/media/355498/the_contest_for_innovation_report.pdf; and Lilian Karunungan and Yoolim Lee, “China's Tech Boom Fueling ‘Reverse Brain Drain,’ Hillhouse Says” (Bloomberg, November 5, 2018), https://www.bloomberg.com/news/articles/2018-11-06/china-s-tech-boom-fueling-reverse-brain-drain-hillhouse-says. 3 National Center for Science and Engineering Statistics, “About the Survey of Earned Doctorates,” National Science Foundation, https://ncses.norc.org/NSFTabEngine/#SED_OVERVIEW. 4 National Center for Science and Engineering Statistics, “2018 Doctorate Recipients from U.S. Universities,” National Science Foundation, https://ncses.nsf.gov/pubs/nsf20301/. 5 Non-STEM fields generally have lower proportions of international students and somewhat lower stay rates; see “Table 17: Doctorate recipients, by broad field of study and citizenship status: Selected years, 1993–2018,” National Science Foundation, https://ncses.nsf.gov/pubs/nsf20301/data-tables; and “Table 51: Definite postgraduation commitments of doctorate recipients, by citizenship status and major field of study: 2018,” National Science Foundation, https://ncses.nsf.gov/pubs/nsf20301/data-tables. 6 If respondents did not answer this question but did provide a location for their prospective post-graduation employer, that location was used. 7 Michael G. Finn and Leigh-Ann Pennington, “Stay Rates of Foreign Doctorate Recipients from U.S. Universities, 2013,” Oak Ridge Institute for Science and Education, January 2018, https://orise.orau.gov/stem/reports/stay-rates-foreign-doctorate-recipients-2013.pdf, Tables 6 and 7. 8 For further evidence on correlation between intention-to-stay rates and actual stay rates, see Remco Zwetsloot, James Dunham, Zachary Arnold, and Tina Huang, “Keeping Top AI Talent in the United States: Findings and Policy Options for International Graduate Student

Center for Security and Emerging Technology | 18
Retention,” Center for Security and Emerging Technology, December 2019, https://cset.georgetown.edu/wp-content/uploads/Keeping-Top-AI-Talent-in-the-United-States.pdf. 9 For general stay rates (i.e., not STEM-specific) across all countries of origin, see “Table 53: Doctorate recipients with temporary visas intending to stay in the United States after doctorate receipt, by country of citizenship: 2012-18,” National Science Foundation, https://ncses.nsf.gov/pubs/nsf20301/data-tables. 10 We also conducted a preliminary analysis of intention-to-stay rates by fine field (e.g., looking at “Mechanical Engineering” and other engineering subfields instead of looking at “Engineering” broadly). There were not many differences between intention-to-stay rates for the broad fields and the subfields we analyzed. 11 Data are incomplete because some 2018 graduates are easier to contact and faster to respond than others, meaning their data will be entered into the system earlier. It is unclear how similar or different this first batch of respondents are from the overall SED respondent population, although, somewhat reassuringly, an analysis we conducted of first-batch versus complete 2017 SED data showed few differences in intention-to-stay rates between those two groups. The complete 2018 data are likely to be available after the next scheduled SED release in December 2020. 12 The Survey of Doctorate Recipients tracks Ph.D. graduates in science, engineering, and health fields. CSET will explore the possibility of using SDR to track actual stay rates in a more disaggregated way in future work. One potential difficulty is that SDR is based on sampling—in contrast to the SED, which is a census—which could mean that the number of respondents within specific categories (e.g., Chinese engineering graduates) may be too low for reliable statistical analysis. We thank Amy Burke, Michael Finn, and Leigh-Ann Pennington for a preliminary discussion of this idea. 13 National Center for Science and Engineering Statistics, “2018 Doctorate Recipients from U.S. Universities.” 14 John Bound, Sarah Turner, and Patrick Walsh, “Internationalization of U.S. Doctorate Education,” National Bureau of Economic Research, March 2009, https://www.nber.org/papers/w14792. 15 Zwetsloot, Dunham, Arnold and Huang, “Keeping Top AI Talent in the United States.” 16 Finn and Pennington, “Stay Rates of Foreign Doctorate Recipients from U.S. Universities, 2013.” 17 National Center for Science and Engineering Statistics, “The State of U.S. Science and Engineering 2020,” National Science Foundation, https://ncses.nsf.gov/pubs/nsb20201.


