142
Report to Congress Assessment: The Terrorism Risk Insurance Act of 2002 The United States Department of the Treasury June 30, 2005

R e p o r t t o C o n g r e s s
Assessment:The Terrorism Risk Insurance
Act of 2002
The United States Department of the TreasuryJune 30, 2005


REPORT TO CONGRESS
ASSESSMENT: THE TERRORISM RISK INSURANCE ACT OF 2002
JUNE 30, 2005
THE UNITED STATES DEPARTMENT OF THE TREASURY OFFICE OF ECONOMIC POLICY
WASHINGTON D.C.

Acknowledgments This study was conducted and prepared by the staff of the Treasury Department’s Office of Microeconomic Analysis under the direction of Assistant Secretary for Economic Policy Mark J. Warshawsky. Contributors included Lucy Huffman, Linda Moeller, Stacy Furukawa, Nada O. Eissa, and John D. Worth, with the research assistance of David Handy. The staff of the Treasury Department’s Office of Financial Institutions Policy, especially Mario Ugoletti, Roy Woodall and C. Christopher Ledoux, and the staff of the Terrorism Risk Insurance Program, including Jeffery Bragg, Howard Leikin, David Brummond, Howard Davis, and Neil Furst, provided expertise and insight. William McGinnies, Roberta McInerney and Martha Ellett gave legal counsel. Elizabeth Knack, John Palmieri, and Ernest Dillworth gave assistance with procurement of the survey contract and oversight of the survey process. We gratefully acknowledge the expert advice we have received from many sources outside the government, including members of the insurance industry and policyholders, and other experts in the insurance field, related to the survey instruments and to industry experience and practices. We also wish to thank the National Association of Insurance Commissioners, especially Eric Nordman and Thomas Kindred, for their assistance and for their provision of data, and the A.M. Best Company, especially Matthew Mosher and Henry Kane, for their advice and for providing us with specialized data.

Chapter 1 Introduction and Executive Summary Introduction The Terrorism Risk Insurance Act of 2002 (P.L. 107-297) (TRIA) requires the Department of the Treasury to administer a temporary program providing a Federal backstop for specified losses that are covered by insurers in the event of an act of terrorism committed by or on behalf of foreign person or interests. The Act further mandates that, as administrator of the Terrorism Risk Insurance Program (Program), the Treasury Department assess features of the Program and its environment. Specifically, Treasury is required to assess: • The effectiveness of the Program; • The likely capacity of the property and casualty insurance industry to offer insurance for
terrorism risk after termination of the Program; and, • The availability and affordability of such insurance for various policyholders, including
railroads, trucking, and public transit. We evaluate the effectiveness of TRIA within the context of the purpose of the legislation. The Act states:
PURPOSE- The purpose of this title is to establish a temporary Federal program that provides for a transparent system of shared public and private compensation for insured losses resulting from acts of terrorism, in order to--
(1) protect consumers by addressing market disruptions and ensure the continued widespread availability and affordability of property and casualty insurance for terrorism risk; and (2) allow for a transitional period for the private markets to stabilize, resume pricing of such insurance, and build capacity to absorb any future losses, while preserving State insurance regulation and consumer protections.
Therefore we evaluate effectiveness in terms of these purposes. We evaluate the likely capacity of the property and casualty insurance industry to offer insurance for terrorism risk after expiration of the Program in terms of the general “insurability” of terrorism risk and the likely provision of coverage after the expiration of TRIA. We address the “availability and affordability of such insurance for various policyholders, including railroads, trucking, and public transit,” by reporting on terrorism insurance take-up and costs for these groups. To assist in making these assessments, Treasury conducted a set of surveys. Treasury contracted with an outside survey research firm to assist in the development of and to conduct the surveys of both policyholders and insurers. In the process of developing the survey instruments, Treasury worked closely with policyholder and insurance industry representatives.

- 2 -
In addition to the formal surveys, Treasury also consulted with the National Association of Insurance Commissioners (NAIC), and a broad range of experts representing the insurance industry, policyholders, and others, in order to draw upon as many sources of information and input as possible. The completed survey results and information derived from these other sources forms the basis of this Report to Congress. The Report is organized as follows. Chapter 2 discusses background, including the mechanics of the Program. Chapter 3 gives a methodological overview of the surveys conducted by the Department. Chapter 4 summarizes and discusses key results from the surveys of insurers. Chapter 5 summarizes and discusses key results from the surveys of policyholders. This chapter also discusses the “availability and affordability” of terrorism risk insurance coverage for three specific policyholder groups as mandated by the Act – railroads, trucking, and public transit. Chapter 6 summarizes information collected from the survey of insurers on the use of reinsurance for terrorism risk. In Chapter 7, we make an assessment of the likely capacity of the insurance industry to offer insurance for terrorism risk after expiration of the Program. In making this assessment we use information from the surveys along with industry financial statistics, information on terrorism modeling methodologies, and other types of information, including that derived from our consultations with experts from the insurance and reinsurance industries and insurance industry regulators.

- 3 -
Executive Summary Based on our research, we offer our assessment of TRIA. Treasury is required to assess: A. The effectiveness of the Program; B. The likely capacity of the property and casualty insurance industry to offer insurance for
terrorism risk after termination of the Program; and, C. The availability and affordability of such insurance for various policyholders, including
railroads, trucking, and public transit. A. Effectiveness As discussed above, we evaluate the effectiveness of TRIA in terms of the purposes given in the legislation. Item 1: Protect consumers by addressing market disruptions and ensure the continued widespread availability and affordability of property and casualty insurance for terrorism risk. The year 2003 marked the first of three full years of subsidized Federal terrorism risk reinsurance. Surveys of insurers and policyholders through early 2005 suggest that policyholder take-up and the number of insurers writing terrorism risk insurance improved somewhat between 2002 and the period subsequent to enactment of TRIA (2003 through 2005). TRIA’s insurer deductibles have increased each year since 2003, shifting ever more of the burden of coverage from the Federal government back to the industry. In spite of this shift, the data show policyholder take-up rose or stayed stable between 2003 and 2004 and between 2004 and early 2005, a pattern suggestive of a market increasingly able to provide coverage. Availability of Terrorism Coverage Insurer Survey Results – Insurers wrote terrorism risk coverage on 67 percent of commercial property and casualty insurance policies, a 7 percentage point increase from 2002. This increase is in part due to more insurers writing coverage for terrorism risk. Whereas 73 percent wrote coverage in 2002, fully 91 percent of insurers surveyed wrote terrorism insurance in 2003. The measures of terrorism risk insurance were generally stable between 2003 and 2004. Policyholder Survey Results – Between 2002 and 2003, after the enactment of TRIA, take-up of terrorism risk insurance increased from 27 percent of policyholders to 39.5 percent. In 2004, 54 percent of policyholders reported having terrorism risk insurance coverage. We note that these changes were correlated with the enactment of TRIA, but not necessarily a result of TRIA. Other factors, such as the general insurance underwriting cycle, likely had some effect on market outcomes during this time. While we cannot quantify the share of observed coverage changes caused by TRIA, we do show evidence that suggests some effect of the Federal subsidy.

- 4 -
Pricing of Terrorism Coverage Results from both the survey of insurers and the survey of policyholders suggest insurers resumed, or more accurately began, pricing terrorism risk insurance during the time TRIA was in effect. Insurer Survey Results – In 2002, over 75 percent of insurers providing coverage for terrorism risk did not charge for it. That share declined to 46 percent in 2003 and just over 40 percent in 2004. As a consequence of more insurers charging for coverage during this period, the average cost of terrorism insurance (measured as the share of total premiums paid for terrorism coverage) increased from 0.9 percent to 1.8 percent of premiums by 2004. Among insurers who charged for terrorism insurance in 2002, however, average cost did not follow a straight pattern. The share of premiums charged for terrorism coverage first declined from 3.7 to 2.4 percent of premiums between 2002 and 2003, but then increased to 3.1 percent of premiums by 2004. Policyholder Survey Results – In 2002, 70 percent of policyholders with terrorism risk insurance coverage reported that they received the coverage at no cost. That share declined to 42 percent in 2003 and further to 37 percent in 2004. As a consequence of more policyholders paying for terrorism risk insurance, the average cost of such coverage increased from 1.2 percent of premium in 2002 to 1.6 percent in 2003, and further to 1.7 percent of premium by 2004. Among policyholders who reported paying for terrorism coverage, cost declined steadily over the period: from 4.0 percent of premium in 2002 to 2.8 percent in 2003 and further to 2.7 percent of premium in 2004. Policyholders located in high-risk cities faced declining costs for terrorism risk coverage that varied from 2.8 percent of premiums in 2002, 3 percent in 2003 and 1.9 percent in 2004. This overall decline in the cost of terrorism coverage is the outcome of two opposing trends: an increasing share that are paying for coverage and declining prices among those who report paying for the coverage. More than half of policyholders in cities that are considered to be at high risk for a terrorist attack reported receiving coverage at no cost in 2002, but less than 30 percent reported free coverage in 2004. On the other hand, the cost of terrorism coverage for paying policyholders in these high-risk cities declined substantially from 6.1 percent of premium in 2002, to 5.1 percent in 2003, and further to 2.6 percent in 2004. Item 2: Allow for a transitional period for the private markets to stabilize, resume pricing of such insurance (described above), and build capacity to absorb any future losses, while preserving state insurance regulation and consumer protections.

- 5 -
Building Capacity to Absorb Future Losses Industry surplus, a major source of insurer capacity, has returned to pre-September 11th levels. Insurers are financially stronger and more able to bear unexpected losses than they were prior to the enactment of TRIA. Insurers might have begun charging for terrorism risk insurance, and insurer financial strength would have improved whether or not TRIA was enacted. We therefore cannot determine that TRIA effectively caused these changes to take place. Reinsurance is another important component of an insurer’s capacity to absorb losses. Our data show a modest net increase in use of reinsurance over the period. Seventy percent of insurers reported purchasing reinsurance for terrorism risk in 2003, this fell to 65 percent in 2004 before increasing to 75 percent in the first months of 2005. Smaller and medium-sized insurers generally reported greater use of reinsurance for terrorism risk exposure (TRIA deductibles and co-payments) between 2003 and 2005. During this same period, however, larger insurers reported less use of reinsurance for terrorism risk exposure. Assessment (Items 1 and 2) Overall we find that TRIA was effective in terms of the purposes it was designed to achieve. TRIA provided a transitional period during which insurers had enhanced financial capacity to write terrorism risk insurance coverage. While we don’t ascribe a causal effect, during this period insurers began pricing for terrorism coverage and insurer financial strength improved. More generally, TRIA provided an adjustment period allowing both insurers and policyholders to adjust to the post-September 11th view of terrorism risk. TRIA’s effectiveness for these purposes does not imply continuation of the program. The sunset of TRIA should encourage the development of the private reinsurance market and other risk-transfer mechanisms. B. Insurance for Terrorism Risk after Termination of the Program The likely capacity of the property and casualty insurance industry to offer insurance for terrorism risk after expiration of the program is the primary focus of Chapter 7 of the report. TRIA provided a Federal backstop for terrorism losses that effectively subsidized terrorism risk insurance. It is reasonable to expect that the removal of the subsidy will result in a short-lived adjustment in coverage and pricing. We also sketch briefly the likely dynamics of the long run adjustment.

- 6 -
Modeling To provide and price insurance efficiently, insurers should be able to quantify their exposure to losses from terrorism risk. Insurers’ primary tool for quantifying loss exposure is modeling terrorism risk. Modeling terrorism risk has two critical components: (1) the ability to identify and quantify the severity of an event in terms of insurers’ losses, and (2) the probability of the loss occurring. Our assessment of developments in risk modeling over the past few years is positive, but we note that challenges do remain. Insurers’ ability to identify and quantify the severity of an event in terms of insurers’ losses has improved greatly. In particular, insurers are much better able to assess their exposures or accumulations of risk for a given terrorist event on an overall and individual customer basis. This is important because it allows insurers to more effectively underwrite coverage. Nevertheless, challenges remain, particularly in assessing the probability of the loss from terrorism. Because of the difficulty inherent in assessing these probabilities, use of models to predict terrorism risk is tempered by the uncertainty of their predictions. Financial Capacity We also assess capacity in terms of insurer financial strength, which incorporates both balance sheet strength and operating performance. The financial health of insurers, especially surplus, improved in the past three years. Among insurer groups providing coverage in TRIA-eligible property and casualty lines, surplus was higher in the third quarter of 2004 than it was in the third quarters of 2001, 2002 and 2003. Our surveys of insurers and policyholders also provide some indications of the development of private market capacity. Take-up of terrorism risk insurance, for example, continued to increase, while the ratio of policies written by insurers including terrorism coverage has been flat to rising, even as the TRIA deductible rose over time. It would not be surprising if the expiration of TRIA changes industry behavior since the business environment will change. Insurers, for example, will likely consider factors such as the possibility of insolvency from terrorism losses given the levels of surplus available and the effect on credit ratings. Experience with natural catastrophe risk underwriting and assignment of agency ratings suggests that in order to avoid ratings downgrades, insurers may significantly alter their approach to terrorism risk insurance after TRIA’s expiration. Among the changes insurers may institute are increasing the use of private reinsurance, building surplus by tapping into capital markets, and raising premiums or placing exclusions on some policies. The policyholder and insurer surveys include direct responses on the availability of coverage after the expiration of TRIA. Responding to questions about policies written in early 2005 that continue into 2006, nearly 50 percent of insurers reported that they are not writing coverage for terrorism risks in 2006 (after the scheduled expiration of TRIA) that is similar to the coverage they write under TRIA. One quarter of policyholders with terrorism risk coverage indicated that their coverage excludes terrorism coverage after the expiration of TRIA.

- 7 -
Assessment TRIA’s expiration will conclude the transitional assistance first provided to the insurance markets in the uncertain economic environment of 2002. Overall, our assessment is that the immediate effect of the removal of the TRIA subsidy is likely to be less terrorism insurance written by insurers, higher prices and lower policyholder take-up. While TRIA is in effect, however, it crowds out development of some reinsurance markets, and delays the development of private capacity to provide terrorism risk insurance. Over time, we expect that the private market will develop additional terrorism insurance capacity. We anticipate that the initial response of premiums in the market will spur the buildup of surplus as insurers tap into capital markets and the development of additional private reinsurance and other risk shifting mechanisms. C. Availability and Affordability of Such Insurance for Various Policyholders,
Including Railroads, Trucking, and Public Transit Chapter 4 discusses terrorism risk insurance take-up and cost for various classes of policyholders, including railroads, trucking and public transit. Among railroads, estimated take-up rates were approximately 25 percent in 2002, 31 percent in 2003, and 32 percent in 2004. In trucking, we estimate that take-up rates increased from 23 percent in 2002 to 31 percent in 2003 and 43 percent in 2004. The corresponding estimates for public transportation are 2 percent in 2002, 20 percent in 2003, and 36 percent in 2004. Cost estimates for these populations are less precise because they are based on smaller sample sizes (only respondents with terrorism coverage provide cost information), and are more likely to suffer from selection bias. The cost estimates for railroads are 5 percent of premiums in 2002 and 2003, increasing to 8 percent of premiums in 2004. These estimates, however, are based on only 13-15 observations (out of a population of 421 railroads). Cost estimates for trucking, where sample sizes are reasonably good, fall from 0.68 percent in 2002 to 0.55 percent in 2003 and rise to 1.06 percent in 2004. Cost estimates for public transit are based on samples too small to report.


Chapter 2 Background on the Property and Casualty Insurance Industry, Terrorism Losses of September 11th, and TRIA This chapter presents background information on the property and casualty insurance industry. It describes the structure and workings of commercial property and casualty insurance; the insurance industry environment after September 11th and prior to the passage of TRIA; and the structure and implementation of TRIA. In particular, Section 2.1 provides an overview of the insurance industry in the United States, with specific reference to the insurance lines eligible for Federal loss compensation under TRIA (TRIA-eligible), and to measures of financial strength of the insurance industry. Section 2.2 reviews the size of insured losses resulting from the terrorist attacks of September 11th and their impact on the insurance market. Section 2.3 describes the TRIA Program, including its structure and regulatory implementation, and certain administrative decisions made by the Treasury Department.

- 10 -
2.1 Overview of the Insurance Industry U.S.-based commercial property and casualty insurers represent a $209 billion industry (2003 premiums). The industry is characterized by a high degree of market regulation. Its performance generally follows an insurance industry cycle, characterized by periods of soft market conditions, in which premium rates are stable or falling and insurance is readily available, followed by periods of hard market conditions, in which rates rise, coverage may be more difficult to find and insurers’ profits increase. This section provides a brief overview of the U.S. insurance industry, with specific reference to TRIA-eligible lines. It presents a general description of the business, regulatory and market structure of the insurance industry. Key divisions, types of insurance coverage, measures of industry performance and concentration are described in Section A. Section B then focuses on TRIA-eligible lines. An overview of state insurance regulation relevant for terrorism risk insurance is provided in Section C. A. Nature of Insurance, Industry Structure, and Concentration Risk Transfer Insurance is the promise of payment in the event of a loss, under the terms and conditions of a contract between the policyholder and the insurer. The premium is the price of an insurance promise, usually payable in advance of the period of coverage and earned as the policy coverage period elapses. The policyholder therefore transfers the risk of the loss covered by the contract to the insurer, allowing the policyholder to manage its risk by controlling its exposure to loss. The insurer, for a premium, promises to compensate the policyholder for the insured loss, if realized. The basic purpose of insurance is to distribute, as efficiently and effectively as possible, the risk of loss of one person among a larger number of those who are exposed to similar perils. Premiums represent the cost of distributive risk-bearing. The insurer will typically transfer some of this risk by purchasing its own insurance - referred to as reinsurance - to cover a portion of the insured losses. Reinsured losses are often characterized by low probabilities of high losses. (See further discussion of the role of reinsurance below). Investments, Expenses, Reserves and Surplus Premiums represent a major, but not the only, source of revenue for insurers. Insurers also hold investment portfolios – mainly bonds and stocks – that generate returns. Insurers’ expenses include annual reserves set aside for anticipated annual losses, expenses associated with auditing and estimating loss claims, business expenses associated with administering and selling policies, and reinsurance costs. Insurers hold policyholders’ surplus to protect their policyholders against unanticipated losses. Policyholders’ surplus is the difference between the value of assets and known liabilities; it can be thought of as the financial cushion that protects the firm from being unable to pay all claims (insolvency).1 Insurers’ net profit builds retained earnings, a component 1 Standards of insolvency and regulatory actions vary from state to state. If an insurance company fails to meet a state standard, the regulator may put the company under its control and guidance, or may liquidate the company,

- 11 -
of policyholders’ surplus; insurers also build policyholders surplus by raising outside capital as needed. Types of Insurance Coverage The insurance industry is divided into two distinct parts: (1) property and casualty (including automobile, home and business insurance) and (2) life and health insurance. Insurance provided by property and casualty insurers – 3330 insurers, with premiums of $462 billion in 20032 - is further divided into personal lines and commercial lines. Personal lines include coverage for individuals’ personal risks, mainly private passenger automobile, homeowners and renters, personal property and liability insurance. Commercial Property and Casualty Insurance. Commercial property and casualty insurance covers a wide range of businesses. The specific types of insurance that fall under this category are defined by states and, as such, no uniform definition exists. In broad terms, however, the major lines of coverage (lines as defined for state financial reporting purposes) are commercial multiple-peril, fire and allied lines, liability, commercial auto, and workers’ compensation. ● Commercial multiple-peril package policies provide coverage for several risks, which
frequently include fire, allied lines, and liability as well as business interruption insurance (BI). BI covers financial losses that occur when a firm is forced to suspend business operations either due to direct damage or inability to access its premises (loss of use). Farmowners’ multiple-peril package policies similarly include property and liability coverage for personal and business losses of farmowners.
● Fire insurance provides coverage for damage from fire and lightning, including BI due to
fire, loss of rents, etc. With few exceptions in some states, fire insurance also covers losses caused by a fire following an event, even when other losses from that event are excluded from the insurance policy.
● Allied lines insure against losses caused by several different perils, including wind, hail,
water damage, explosion and riot, BI, etc. ● Boiler and machinery insurance covers the malfunction or breakdown of boilers,
machinery and electrical equipment, and associated BI. ● Marine lines (ocean and inland) provide coverage of all types of vessels and watercraft,
for property damage to the vessel and cargo, BI, and for marine-related liabilities. In addition, inland marine insures articles in transit by all forms of land and air transportation, as well as bridges, tunnels and other means of transportation and communication.
selling assets to pay claims and third-party liabilities. State guaranty funds may also be used to help make payments, should assets prove insufficient. 2Source: NAIC, “Property/Casualty Insurance Industry Aggregates: 1994-2003 Historical Direct Premiums”, 2003Property Casualty Statistical Compilation at www.naic.org/research/Research_Division/Stats/2003_PC_stat_comp.htm, accessed May 2005.

- 12 -
● Commercial auto (liability) protects the policyholder from legal liability for motor-
vehicle-related accidents causing injuries or property damage to others. Commercial auto (physical damage) covers damage to the policyholder’s vehicle.
● Burglary and theft insurance provides coverage for property taken or destroyed due to
burglary, robbery, fraud, forgery, etc. ● Liability provides coverage for exposure to lawsuits. Product liability covers exposure
from a defective condition causing bodily injury or property damage through the use of the product. Other liability provides coverage to a business for liability (such as negligence or carelessness) that leads to property damage or injury.
● Workers’ compensation provides for the cost of medical care and rehabilitation for
injured workers, for lost wages, long term disability, and for death benefits for dependents of persons killed in work-related accidents.
Role of Reinsurance Reinsurance is insurance purchased by primary insurance companies. It provides reimbursement for insured claims eligible under the reinsurance contract, and hence spreads the primary insurer’s risk. Primary insurers use reinsurance to manage their overall risk exposure, for example, by limiting liability from specific risks, or protecting against low-probability catastrophic loss - either a catastrophic loss resulting from a single event or from the aggregation of a large number of smaller events. Because reinsurance allows primary insurers to underwrite more policy coverage, it enhances the capacity of the primary insurer. Reinsurers’ portfolios consist of promises to reimburse insurers for portions of the insurers’ losses. As with primary insurers, the aggregation of independent risks provides diversification benefits which reduce reinsurers’ costs and enhances their claims-paying ability. Also, in parallel to primary insurers, reinsurers themselves purchase reinsurance for portions of their risks (retrocession) and hold surplus to protect their ability to pay claims of insurers. Reinsurance contracts are usually one of two types: treaty and facultative. A treaty contract generally covers eligible losses incurred under all or a broad set of the insurer’s policies for all risks written by the primary insurer (unless the risks are explicitly excluded). Facultative reinsurance contracts are much narrower in nature and cover losses incurred under specific underlying policies above a certain threshold. There are, broadly speaking, two types of loss reimbursement arrangements. Proportional (quota-share) reinsurance is a contract under which the primary insurer and the reinsurer share all premiums and losses on a pro-rated basis. Proportional reinsurance is often used in situations in which overall losses are limited but the probability is less well known. Excess-of-loss reinsurance, by contrast, provides reimbursement to the primary insurer for losses incurred above a specific threshold. Excess of loss reinsurance is often used in situations in which very large, low probability losses could threaten the insurer’s solvency. Contracts are often written to the particular needs of the client and a single contract may offer a variety of compensation arrangements.

- 13 -
In the United States, reinsurance may be purchased from state-authorized reinsurance companies, and, subject to certain conditions, from reinsurers that are not authorized (usually non-U.S. reinsurers). In the latter case, state insurance regulators generally require these reinsurers to collateralize their reinsurance liabilities. The property and casualty industry reinsures a substantial share of its direct premiums; over the past 5 years, for all lines, the share of premiums reinsured rose from 18 percent in 1999 to 21.5 percent in 2003. The degree of reinsurance varies sharply from line to line. While the 2003 share of commercial multi-peril and workers’ compensation premiums reinsured was respectively, 20 and 24.5 percent, the shares of premiums reinsured in the (commercial) fire, allied lines, and other liability lines in 2003 were 38, 50, and 40 percent, respectively.3 Role of Private Credit Rating Agencies Insurance company ratings provided by private credit rating agencies offer opinions of an insurer’s financial strength and ability to meet ongoing obligations to policyholders. The ratings are derived from evaluations of the company’s balance sheet, operating performance and business profile. A number of agencies rate insurers, including the A.M. Best Company (A.M. Best or Best’s), Moody’s and Standard & Poor’s (S&P). A.M. Best, an SEC-recognized ratings agency for the insurance industry, is the dominant issuer of insurer ratings. Almost 90 percent of eligible property-liability insurers in 1995 applied for a rating from A.M. Best, while only about 18 percent applied for a rating from S&P and only 10 percent applied for a rating from Moody’s.4 The most important factor behind this preference is probably the long historical relationship between Best and the insurance industry. The ratings are vitally important to investors and insurance purchasers as well as the insurers themselves. Insurance purchasers use ratings to choose insurance companies and/or decide how much they are willing to pay for insurance from particular companies. Many corporate insurance buyers require that all their insurers be highly rated. A strong financial rating gives an insurer better and cheaper access to capital markets, thus has a direct impact on its costs of raising capital. Financial Statistics of the Insurance Industry Premiums and surplus are key indicators of the size and financial performance of the insurance industry. This section presents data on premium revenues and surplus of the entire (commercial
3 RAA DataCenter, Line of Business Review, P & C Industry Trends by Line of Business, www.reinsurance.org, accessed May 2005. 4 Steven Pottier and David Sommer, “Property-Liability Insurer Financial Strength Ratings: Differences Across Rating Agencies,” Journal of Risk and Insurance, 1999, Vol. 66, No. 4, 621-642.

- 14 -
and personal) property and casualty industry. The data show that the financial situation of the property and casualty insurance improved substantially since the September 11th attack. 5 Our first measure of industry financial performance, direct written premiums (DWP) in property and casualty insurance, is total premiums collected by insurers directly from policyholders for the upcoming period of coverage, before any adjustments for premiums ceded to reinsurers. Figure 2.1 shows that direct written premiums increased by about 25 percent from 2001 to 2003, with the largest single year gain – nearly 15 percent - occurring from 2001 to 2002. Over the 7 year period from 1994 to 2001, direct written premiums increased by a total of about 35 percent.
Figure 2.1
Direct Written Premiums by Year: All Property and Casualty Lines: 1994 to 2003
050
100150200250300350400450500
1994 1995 1996 1997 1998 1999 2000 2001 2002 2003
Billi
ons o
f Dol
lars
Source: NAIC, 2003 Property Casualty Statistical Compilation. See footnote 2, this Chapter. While premiums are collected, invested, and proceeds used to pay a portion of anticipated losses, the ultimate source of insurers’ ability to pay claims is policyholders’ surplus. Figure 2.2 shows the growth in surplus of the entire property and casualty industry over the past decade. The growth in surplus is due to both revenue from underwriting and realized returns on investments, and to unrealized gains or losses on investments.6
5 The September 11th attacks primarily affected the commercial property and casualty industry. We discuss the recent financial performance of the property and casualty insurers that write in the TRIA-eligible lines in detail in Chapter 7. 6 Insurers’ accounts are reported under statutory accounting principles (SAP) imposed by state laws, rather than GAAP.

- 15 -
Figure 2.2
Policyholder Surplus by Year All Property and Casualty Lines: 1994 to 2003
050
100
150200250300350400
450500
1994 1995 1996 1997 1998 1999 2000 2001 2002 2003
Billi
ons o
f Dol
lars
Source: NAIC, 2003 Property Casualty Statistical Compilation. See footnote 2, this Chapter. Figure 2.2 shows that property and casualty industry surplus increased substantially from 1994 to 1998, but was about constant through 2000. Surplus dropped by $33 billion over 2001 and by $10 billion over 2002, but rose sharply between 2002 and 2003; by 2003 it had surpassed the 2000 level.7 The growth in surplus before 2000 likely reflects investment gains (interest, stock dividends and realized capital gains and losses), which averaged about $50 billion annually from 1994 to 2000, but only about $35 billion annually from 2000 to 2003.8 The decline in surplus over 2001 and 2002 was, in part, the result of low to negative net income, driven by the September 11th underwriting losses. The industry recorded a net income loss of about $4 billion in 2001 and underwriting losses of more than $50 billion in 2001. While the industry recorded a net income gain of $4 billion in 2002, it incurred underwriting losses of $30 billion in that year. The trend in surplus between 2001 and 2003 is consistent with the industry underwriting cycle. The cycle reflects the general response of premium and surplus following a catastrophic event, in which the sudden loss in surplus is followed by reductions in amounts of coverage offered by insurers and higher premiums. The higher premiums help rebuild surplus and attract new capital. Once surplus is rebuilt and new capital enters, the competition that follows leads to weaker premium growth. The underwriting cycle is relevant to the recovery of the property and casualty industry following the September 11th attacks as well as the Northridge earthquake. Distribution of Market Shares Figures 2.3 and 2.4 show the distribution of industry market shares of premiums. The two figures illustrate the diversity of market shares of industry participants. Figure 2.3 depicts market share against the rank of the insurer by direct premiums written (through rank 125). As
7 Statutory surplus includes both net profits (losses) from underwriting performance and realized investment gains (losses) and also unrealized investment gains (losses). In addition to direct losses, the September 11th attacks triggered investment portfolio losses. 8 Robert Hartwig, “Overview and Outlook for the Property/Casualty Insurance Industry,” Insurance Information Institute, July 2003, www.iii.org/media/industry/, accessed June 22,2005.

- 16 -
Figure 2.3 illustrates, the industry is composed of a number of large groups9 and many small groups, most with market shares under 2 percent. In 2003, there was only one group with market share above 10 percent and all groups beyond the 12th ranked group held less than 2 percent.
Figure 2.3
Property and Casualty Insurance Industry: Market Share by Company Rank: 2003
0
2
4
6
8
10
12
1 5 9 13 17 21 25 29 33 37 41 45 49 53 57 61 65 69 73 77 81 85 89 93 97 101
105
109
113
117
121
125
Mar
ket S
hare
(Per
cent
)
Source: NAIC, Property and Casualty Insurance Industry 2003 Market Share Report by State and Countrywide, By Group, All Lines, http://www.naic.org/research/Research_Division/Stats /2003_PC_MrktShare_Totals.pdf, accessed May 2005.
Figure 2.4 depicts the cumulative market shares held by insurers ranked by direct premiums written. As Figure 2.4 shows, the market share of total premiums held by the top five groups in 2003 was about 30 percent.
Figure 2.4
Property and Casualty Insurance Industry: Cummulative Market Share by Company Rank: 2003
0
20
40
60
80
100
1 5 9 13 17 21 25 29 33 37 41 45 49 53 57 61 65 69 73 77 81 85 89 93 97 101
105
109
113
117
121
125
Mar
ket S
hare
(Per
cent
)
Source: NAIC, Property and Casualty Insurance Industry 2003 Market Share Report by State and Countrywide, By Group, All Lines, http://www.naic.org/research/Research_Division/Stats /2003_PC_MrktShare_Totals.pdf, accessed May 2005. 9 An insurer group consists of affiliated companies that are commonly owned.

- 17 -
Broadly, the data depicted in Figures 2.3 and 2.4 show that the insurance industry is not highly concentrated. B. TRIA-Eligible Insurance Lines The remainder of the chapter focuses on industry performance and structure in the TRIA-eligible lines. This subsection first describes the TRIA-eligible lines and then examine characteristics of the insurers that provide coverage in these lines. As indicated earlier, we discuss the recent financial performance of these insurers in more detail in Chapter 7. TRIA-Eligible Lines TRIA established a temporary Federal program of shared public and private compensation for most lines of commercial property and casualty insurance; it specifically excluded personal property and casualty insurance, as well as health and life insurance (including group life). Because the states define commercial property and casualty insurance differently, Treasury looked to the NAIC’s Exhibit of Premiums and Losses (commonly known as Statutory Page 14)10 as a general reference point for its regulatory definition of commercial property and casualty insurance in implementing TRIA. Table 2.1 provides a complete list and brief description of each of the lines included under TRIA.
10 Department of the Treasury, 31 CFR Part 50, Departmental Offices; Terrorism Risk Insurance Program.

- 18 -
Table 2.1 TRIA-Eligible Lines and Descriptions
NAIC Line of Business Description 1. Fire Coverage protecting property against damage from losses caused
by a fire or lightning and loss of use (business interruption, or BI).
2.1 Allied Lines Property insurance that is usually bought in conjunction with fire insurance; it includes wind, water damage, explosion, riot, vandalism and other coverage, and BI.
3.0 Farmowners’ Multiple Peril Package policy that includes property and liability coverage for personal and business losses.
5.1 Commercial Multiple Peril (non-liability)
Package policy for the entire commercial enterprise that includes various risk exposures, frequently including fire, allied lines, BI, etc.
5.2 Commercial Multiple-Peril (liability)
As above, but includes liability.
8 Ocean Marine Coverage of all types of vessels and watercraft, for property damage to the vessel and cargo, BI, and for marine-related liabilities.
9 Inland Marine Coverage for shipments that do not involve ocean transport. Covers articles in transit by all forms of land and air transportation as well as bridges, tunnels and other means of transportation and communication.
16 Workers’ Compensation Covers an employer’s liability for medical care and physical rehabilitation of injured workers and helps to replace lost wages while they are unable to work. State laws, which vary significantly, govern the amount of benefits paid and other compensation provisions.
17 Other Liability Covers the policyholder against liability resulting from negligence, carelessness, failure to act, that causes property damage and personal injury to others.
18 Products Liability Protects manufacturers’ and distributors’ exposure to lawsuits from a defective condition causing bodily injury or property damage through the use of the product.
19.3 Commercial Auto No-Fault Protects the policyholder against exposure to motor-vehicle-related accidents causing injuries or property damage to others. No-fault is defined by states.
19.4 Other Commercial Auto Liability
Protects the policyholder from legal liability for motor-vehicle-related accidents causing injuries or property damage to others.
21.2 Commercial Auto Physical Damage
Covers damage to the policyholder’s vehicle.
22 Aircraft (all perils) Covers aircraft hulls, contents, and owners’ and manufacturers’ liability to passengers, airports and third parties.
24 Surety Covers a policyholder against damage from failure by a third party to perform specific obligations.
26 Burglary and Theft Insurance for property taken or destroyed due to burglary, robbery, fraud, forgery, etc.
27 Boiler and Machinery Insurance for the malfunction or breakdown of boilers, machinery and electrical equipment, and associated BI.
Source: TRIA-eligible lines: Department of the Treasury, 31 CFR Part 50, Departmental Offices; Terrorism Risk Insurance Program; and NAIC, “Official NAIC Quarterly Statement Instructions, Annual Statement Instructions, Property/Casualty For the 2005 Reporting Year,” November 2004.

- 19 -
Figure 2.5 shows the distribution of direct written premiums by TRIA-eligible lines in 2003. As the figure indicates other liability and workers’ compensation account for nearly $100 billion in direct written premiums. Together these two lines account for nearly 48 percent of TRIA-eligible direct written premiums. Another $52 billion, or 25 percent of TRIA-eligible direct written premiums, is derived from commercial property insurance, including approximately $19 billion in direct written premiums from commercial multiple-peril insurance and $10 billion in direct written premiums from fire insurance.
Figure 2.5
Direct Written Premiums by TRIA Eligible Line: 2003
0 5 10 15 20 25 30 35 40 45 50
17 Other Liability16 Workers Compensation
19.4 Other Commercial Auto Liability5.1 Commercial Multiple Peril (non-liability)
5.2 Commercial Multiple Peril (liability)9 Inland Marine
1. Fire21.2 Commercial Auto Physical Damage
2.1 Allied Lines24 Surety
18 Products Liability22 Aircraft (all perils)
8 Ocean Marine3.0 Farmowner Multiple Peril
27 Boiler and Machinery19.3 Commercial Auto No-Fault
26 Burglary and Theft
Billions of Dollars
Source: NAIC, Property/Casualty Insurance Industry Aggregates, 1994-2003 Historical Direct Premiums Written, http://www.naic.org/research/Research_Division/Stats/PC_StatCompHistory2003.pdf, accessed May 2005.
Insurers Underwriting Coverage in the TRIA-Eligible Lines Most insurers underwriting coverage in TRIA-eligible lines also provide coverage in other, non-eligible, lines of insurance. To get a sense of how important their TRIA-eligible business is to these insurers, we first compared the direct premiums written for TRIA-eligible lines to premiums written by these same insurers for all lines of property and casualty insurance. This includes insurance for personal lines coverage and other commercial lines that are not eligible for TRIA compensation. Figure 2.6 provides a time series for premiums written in TRIA-eligible lines and in all lines by these insurers. As Figure 2.6 indicates, TRIA-eligible lines have generally accounted for somewhat less than half the premiums written in all lines by these insurers over these years. In 2003 premiums in TRIA-eligible lines were $208.6 billion, while

- 20 -
premiums for all the property and casualty lines written by these insurers, including personal lines and other commercial lines not eligible for TRIA compensation, were $459.2 billion.11
Figure 2.6
Direct Written Premiums by Year: TRIA-Eligible and All Lines
0
100
200
300
400
500
1999 2000 2001 2002 2003
Bill
ions
of D
olla
r Direct Written Premiums -TRIA-Eligible LinesDirect Written Premiums -
Source: Data provided by A.M. Best. The insurers writing insurance in the TRIA-eligible lines industry exhibit the same diversity as characterizes the property and casualty industry as a whole: a number of large groups and many small groups, most with market shares under 2 percent. The larger groups write insurance in national and large regional markets while the smaller groups serve smaller regional and single state markets. To examine whether there were differences in performance by size and markets, all insurers writing more than $10 million in premiums in the TRIA-eligible lines were assigned to categories, defined by ranking by direct written premiums, that broadly reflect the range of markets they serve. Insurers were ranked after consolidating any insurers that were part of an insurer group - a corporate organization that includes all affiliated insurer and reinsurer entities.12 These categories are as follows: ● Top 25 Insurers – comprised of large national insurer groups generally writing in most or all
states. ● Insurers 26 to 50 – Approximately half national insurer groups, half large regional insurer
groups, including some specialty writer groups. ● Insurers 51 to 75 – Predominantly mid-size regional insurer groups. ● Insurers 76 to 100 – Predominately smaller regional groups and some large groups providing
insurance in only one or two states. ● Insurers 101 + – Remaining insurer groups, mainly providing coverage in one or two states.
11 The total property and casualty premiums in 2003 were $462.1 billion (see Figure 2.1); the difference between that number and this data may be due in part to the presence of property casualty insurers specializing in one or more lines not eligible for compensation under TRIA. In addition, there is likely some small discrepancy in totals between NAIC data and that of Best’s. 12 This categorization was recommended to us as most nearly capturing insurers alike in scope of business. Telephone conversation with Michael Murray, ISO, and Matthew Mosher, A.M. Best, March 24, 2005.

- 21 -
A sense of the average size of these categories may be gained by examining the share of direct premiums and of total surplus held by each category. In Figure 2.7 we compare the share of 2003 direct written premiums written by each size class of insurer group in TRIA-eligible lines and in all property and casualty lines written by these insurers. The top 25 insurers account for over 65 percent of direct written premiums within TRIA-eligible lines and over 57 percent of direct written premiums in all lines.
Figure 2.7
Share of Direct Written Premiums by Company Size Class TRIA-Eligible and All Lines: 2003
0
20
40
60
80
100
CompaniesRanked 1-to-25
CompaniesRanked 26-to-50
CompaniesRanked 51-to-75
CompaniesRanked 76-to-
100
CompaniesRanked 101-to-
End
Perc
ent P
rem
ium Direct Written Premiums -
TRIA-Eligible LinesDirect Written Premiums - AllLines
Note: Share represent share of direct written premiums written by insurers with over $10 million in direct written premiums. Source: Data provided by A.M. Best. As Figure 2.7 shows, the top 25 insurer groups dominate the market in TRIA-eligible lines, with over 60 percent of the total premiums. The top 50 insurers provide over 70 percent of the coverage in these lines. C. State Regulatory Authority States have primary responsibility for regulating the insurance industry in the United States - both the financial solvency of insurance companies doing business in their state and various aspects of insurer’s interactions with customers, referred to as market regulation.13 Congress acknowledged the role of state regulation in TRIA’s stated purposes and in its direction that Treasury consult with the NAIC in conducting this study.14 Market regulation by each state is intended to make sure that insurers are fair and nondiscriminatory in their dealings with customers, do not renege on the terms of their contracts, and write policies that offer what state laws require. Financial solvency regulation by the states is intended to ensure that insurers that do business in the state are in good financial condition and able to pay policyholders’ claims. State insurance regulations also govern the definition of various lines of coverage and a wide
13 The McCarran-Ferguson Act, enacted in 1945, is the basis for the general structure of state regulation of the business of insurance in the United States. See 15 USC § 1012. 14 See Section 101(b) (purposes) set forth in Chapter 1 and Section 108(d).

- 22 -
range of insurer practices within the state, including sales, premium rates, policy forms, underwriting, and claims processing and payment. There are two broad types of state market regulations: price (rate) and coverage (form) restrictions. State insurance regulators have the ability to both regulate price and require mandatory coverage of various risks or perils by means of their authority to reject insurance policy forms and the rates used to compute insurance premiums. It is important to note that states often do not have a uniform approach to regulation and may use different regulatory mechanisms for different types of insurance coverage. Commercial policies for large commercial buyers deemed to have the economic clout and insurance buying expertise to negotiate with insurers in a largely unregulated environment are often exempted from rate and form regulation. Many states with rating approval laws provide for the exemption of rate approvals on large commercial property and casualty policies, based on policy conditions. The conditions for exemption vary from state to state but usually require the buyer to have insurance premiums, net worth, and/or revenue above specified dollar limits. For example, Massachusetts defines a large commercial policyholder as having aggregate annual property and casualty insurance premiums (excluding workers’ compensation premiums) of at least $30,000; net worth of at least $10,000,000; net revenue or sales of $5,000,000; and more than 25 employees. The exemptions, however, do not apply to workers’ compensation policies. In addition to coverage provided in a state by insurers that are licensed or admitted by the state, coverage for special risks (surplus lines) is also available from insurers that are not licensed or admitted by the state, but are allowed to write insurance in the state if certain requirements are met. Examples of coverage provided by surplus lines insurers include insurance for risks of a special nature that require greater flexibility in policy terms and conditions than those of standard forms, or risks for which the highest rate allowed is considered inadequate by admitted companies. Surplus lines companies participate almost exclusively in the commercial markets. The requirements for surplus lines insurers vary from state to state; many states require that surplus lines carriers meet financial standards or require evidence that licensed insurers must have declined to provide coverage. Mandatory Insurance Coverage In addition to regulation of rates, states also have the right to require insurers within various lines to provide coverage for specific risks or perils. States can bar insurers from excluding various risks from their coverage. The two most common examples of states’ requiring the provision of coverage are workers’ compensation and statutory fire following requirements. Workers’ Compensation. Employers in all states except Texas are required to carry workers’ compensation (WC) insurance, although a few exempt certain industries and most exempt small employers.15 No exclusions are permitted for employers required to carry WC. Regulation of rates in most states historically required all insurers to use the same rates, employment rating classes and experience-rating plans (the employer’s own loss experience relative to the class 15 The following description is taken from Patricia Danzon and Scott Harrington, “Workers’ Compensation Rate Regulation: How Price Controls Increase Costs,” Journal of Law and Economics, Vol. XLIV (April 2001).
- 23 -
average). Rate advisory organizations (the National Council of Compensation Insurers – NCCI – in most states) collect loss and expense data from insurers to develop prospective loss costs. Insurers can file deviations and add their own expense and profit by class. Residual market mechanisms provide insurance at regulated rates to firms that cannot obtain coverage voluntarily from insurers. Residual market deficits are usually prorated across all insurers in the state. If insurers cannot fully recoup these deficit assessments by pass-through to the voluntary market, insurers may exit the market. Although likely a last resort for the insurers, this reduction in voluntary availability would further exacerbate voluntary market problems and the growth of residual markets. Studies of the workers’ compensation line indicate that pricing controls have the effect of exacerbating losses, particularly in the residual markets, which in turn increase premiums in private voluntary markets. The studies conclude that there is a cross-subsidy to high risks and small firms at the expense of low risks and insurer equity.16 Fire Following States. Fire following states are states that have adopted the Standard Fire Policy (SFP) for losses from fires. Currently 30 states have statutory standard fire insurance policy requirements.17 In these states, the statutory requirement establishes the minimum coverage for the peril of fire and the permissible exclusions from coverage.18 To date 12 of these states have allowed insurers to exclude terrorism from their SFPs if the insured policyholder turned down terrorism coverage under TRIA; the effect is that damage from a fire caused by a terrorist event is not covered even if the policyholder purchased coverage for fire, if the terrorism coverage offered by the insurer under TRIA has been turned down.19 In the rest of the fire following states, no exclusions for fire resulting from terrorism are allowed. As a result, the SFP provides mandatory coverage for fire following a terrorist act in these remaining states. Consequences of Restrictions on Terrorism Exclusions. If a peril such as terrorism cannot be excluded from general (non-terrorism) policy coverage, yet the insurer believes that writing the coverage would jeopardize solvency, it may respond by reducing the amount of coverage offered under the general policy. The responses of markets and regulators after September 11th suggest that this issue of contagion from terrorism insurance markets to non-terrorism insurance markets is one with potentially serious consequences that are generally recognized by regulators. Prior to September 11th, terrorism insurance was an unnamed peril in most standard commercial insurance policies covering damage to property and contents. This was because most insurers simply did not view terrorism as a risk that was significant enough to merit being explicitly considered or priced for most commercial insurance policies.20 As a consequence, after September 11th when insurers re-assessed the significance of this implied coverage for terrorism coverage that they were providing, they realized that they had much more exposure to risk than they had earlier thought.
16 Patricia Danzon and Scott Harrington, “Workers’ Compensation Rate Regulation: How Price Controls Increase Costs,” Journal of Law and Economics, Vol. XLIV (April 2001). 17 National Association of Mutual Insurance Companies (NAMIC), at www.namic.org, accessed June 2005. 18 NAMIC, State Advocate, www.namic.org, accessed May 2005. 19 NAMIC Compliance Grid, Standard Fire Insurance Policy, www.namic.org, accessed April 2005. 20 Howard Kunreuther and Erwan Michel-Kerjan, “Policy Watch: Challenges for Terrorism Risk Insurance in the United States,” NBER Working Paper No. 10870, October 2004.

- 24 -
The NAIC became concerned that if insurers were not allowed to exclude losses due to terrorist acts, then the only way to limit exposure would have been to severely restrict or cease operations in particular lines of coverage, categories of business or geographic zones likely to suffer such losses. 21 In order to avoid this problem, the NAIC urged its members in all 50 states to approve blanket terrorism exclusions for regulated property and casualty policies until such time as a Federal backstop was provided. By August 2002, 45 states, the District of Columbia and Puerto Rico had approved the exclusions while only five - New York, California, Texas, Florida and Georgia - had rejected them or withheld approval. These blanket exclusions were rescinded upon the passage of TRIA. Recently, the impending expiration of TRIA prompted some 47 states and the District of Columbia - the exceptions being Florida, Georgia and New York - to approve exclusions for property terrorism risk, conditional upon either expiration of TRIA at the end of 2005, or a renewal of TRIA with deductible, co-payment, or terrorism definition different from those in the current Program (called pop-up exclusions).
21 Robert Hartwig, “September 11: One Hundred Minutes of Terror that Changed the Global Insurance Industry Forever,” Insurance Information Institute (III), August 2002, p. 10.

- 25 -
2.2 September 11th and Aftermath September 11th changed the way Americans think about terrorism and the risks of terrorist attacks. In the context of terrorism risk insurance, the attacks on American soil that took place that day resulted in a broad reassessment of the likelihood and potential loss associated with terrorism. This prompted changes in the insurance industry, state regulation, and the management of risk by the insurance industry and ultimately led to the passage of TRIA. This section briefly describes the aftermath of September 11th as it relates to terrorism risk insurance and describes the atmosphere and debate leading up to and surrounding the passage of TRIA. A. Losses The size of the insured losses from the tragic events of September 11th were initially estimated to be anywhere from $25 billion to $70 billion. The size of these early loss estimates altered insurers’ and policyholders’ assessments of both the probability of terrorist attacks and their potential severity. The September 11th terrorist attacks affected more kinds of insurance and more commercial policyholders than any other disaster.22 As of July 2002, 119 insurers (nonlife, life and reinsurers) worldwide had publicly announced exposure to the attacks.23 Generally speaking, larger companies with the greatest financial resources (i.e., capital and surplus) suffered the heaviest losses, while smaller companies with more limited resources experienced fewer losses.
22 Insurance Information Institute, Hot Topics and Issues Update, “Catastrophes: Insurance Issues,” May 2005. 23 Robert Hartwig, “September 11: One Hundred Minutes of Terror that Changed the Global Insurance Industry Forever,” Insurance Information Institute (III), August 2002, p. 7.

- 26 -
The most recent estimate of insured losses from the September 11th attacks is $32.4 billion.24 Figure 2.9 shows the distribution of insured losses across the broad lines of insurance coverage.
Figure 2.9
Insurance Industry Loss Estimates from September 11th Attacks (Billions of Dollars)
Event Cancellation $1.0 Property - Other $6.0
Workers' Compensation $1.8
Aviation Liability $3.5
Aviation Hull $0.5
Property - WTC 1 and 2 $3.6
Other Liability $4.0
Business Interruption $11.0
Life $1.0
Notes: Amounts are losses as of October 2004, before adjustment for reinsurance. Dollar amounts and percentages do not add to total due to rounding. WTC losses do not include $1.1 billion due to a December 2004 Federal jury decision that the World Trade Center losses resulted from two separate attacks; this decision is subject to appeal. Including this amount would bring total losses to $33.5 billion. Source: Hartwig, “The Cost of Terrorism,” Insurance Information Institute. See footnote this Chapter, page 17. The life insurance industry losses of $1 billion include both group life insurance and individual life insurance. Data are not available for the separate components.25 It is estimated that group life insurance losses were less than half the total.26 The losses in the figure do not represent all the insured losses. Almost all the victims’ liability claims were waived because victims were compensated through the September 11th Victim Compensation Fund (VCF), the Federal fund created to compensate victims in lieu of their tort remedies. The total payment to victims for death and personal injury claims from the VCF is likely to be $6.9 billion.27 The insured losses were not the only losses arising from September 11th. Investment losses experienced by primary property casualty insurance and reinsurance companies, which had been 24 Robert Hartwig, “The Cost of Terrorism: How Much Can We Afford?,” Presentation before the National Association of Business Economists, October 4, 2004, at www.iii.org/media/presentations/tria/, accessed June 2005. 25 Lloyd Dixon and Rachel Stern, Compensation for Losses from the 9/11 Attacks, RAND Institute for Civil Justice, 2004. 26 Kevin Trapp, Swiss Re, “Pricing for Terrorism Risk in Group Life, Group Health and Group Disability Products,” Presentation at Society of Actuaries Spring Meeting, Session 23PD, June 23 to 25, 2003. 27 Ibid., p. 25.

- 27 -
growing prior to that date, racheted upward sharply in the third quarter 2001, but recovered somewhat by the fourth quarter. Unlike other insured events, the insurance losses from these terrorist attacks were highly correlated with investment losses - a difficult and risky situation for insurance and reinsurance companies which rely in large part on invested surplus to assure solvency. B. Insurance Market Response and the Passage of TRIA The September 11th losses produced an underwriting and pricing reaction by both insurers and reinsurers. The insurance industry announced it would cover insured losses, notwithstanding the arguably warlike nature of the attacks. Insurers and reinsurers, however, also took steps to reduce their exposure to future terrorism attacks. Reinsurers began excluding terrorism coverage from their commercial coverages, particularly for locales thought to be at risk - large urban locations and iconic properties - with the result that insurance coverage became less available for these properties. Insurers willing to provide the coverage were reportedly asking high prices. Primary insurers filed with their state regulators for permission to exclude the coverage from regulated policies and, as discussed above, all but five states granted blanket exclusions.28 The exclusions applied only to losses classified by the Property Claims Service as catastrophes - events with aggregate losses of at least $25 million in direct aggregate insured losses to property and affecting a significant number of insurers and policyholders; insurers were not allowed to exclude coverage for losses from smaller events. The behavior was generally consistent with the beginning stages of an underwriting or loss cycle that is a typical industry response to a catastrophic loss shock - insurers and reinsurers withdraw from the markets to limit their exposures while revising their understanding of the potential losses from such catastrophic events. During this initial period investors are reluctant to supply external capital because of doubts about levels of loss exposure and future loss expectations, forcing insurers to operate with their now-reduced internal capital or raise new, more expensive, external capital. As a consequence, supply is sharply reduced and prices rise significantly. The pullback in terrorism coverage in large cities and other high-risk areas raised concerns that this period of adjustment to the reality of global terrorism risk in the insurance market could have a negative spillover effect on the macroeconomy. Many of the concerns related to the disruptive effects of the transition between a world in which terrorism coverage was provided for a negligible price and one where terrorism risk was considered a non-negligible risk. For example, it was reported that large commercial properties and construction projects were having trouble getting financing because of concerns about terrorism coverage and there were questions about downgrading of existing mortgage-backed securities with inadequate insurance coverage on the collateral. In response to these and other concerns, efforts to create a Federal backstop began shortly after the September 11th attacks. 28 Prior to September 11th, most standard commercial insurance policies included terrorism coverage effectively free of charge because it was not excluded as a cause of loss, nor priced separately.

- 28 -
The House of Representatives passed the “Terrorism Risk Protection Act” (H.R. 3210) on November 29, 2001. The House bill called for a temporary program that expired at the end of three years. Federal compensation was triggered if industry-wide losses exceed $1 billion; or if industry-wide losses exceeded $100 million and some part of those losses exceeded 10 percent of the surplus (capital) and 10 percent of an individual commercial insurer’s net premium written. The bill would have required insurers to pay back to the U.S. Treasury any funds received. The Senate passed the “Terrorism Risk Insurance Act of 2002” (S. 2600) on June 18, 2002. Like the House, the Senate bill called for a temporary program. The two-year plan called for by this bill proposed a sharing of losses between insurers and the Federal Government above an aggregate industry retention of $10 billion for the first year of the plan and $15 billion during the plan’s second year. An individual insurer’s deductible was to be calculated as its market share multiplied by $10 billion in the first year and $15 billion in the second. The Terrorism Risk Insurance Act (TRIA), which included provisions from both the Senate and House bills, was signed into law on November 26, 2002 and became effective immediately. Details of the final law are described in Section 2.3.

- 29 -
2.3 The Terrorism Risk Insurance Act of 2002 – Structure and Implementation This section provides an overview of the structure of TRIA and its implementation by Treasury as the administrator of the Terrorism Risk Insurance Program. A. Structure of TRIA TRIA established a temporary (three-year) Federal Terrorism Risk Insurance Program that provides for a system of shared public and private compensation for insured property casualty insurance losses resulting from acts of terrorism. TRIA’s stated purposes are to ensure continued widespread availability of property and casualty insurance for terrorism risk and provide a transition period for private markets to stabilize, resume pricing, and build capacity, while preserving state insurance regulation and consumer protection. TRIA can be most easily thought of as terrorism risk reinsurance provided by the Federal Government at no cost, above a company-specific deductible. Certified Acts of Terrorism TRIA provides that the Federal Government will cover 90 percent of insured losses (as defined by TRIA) of participating insurers for an act or acts of terrorism as defined by TRIA, once an insurer’s deductible is reached. TRIA defines an act of terrorism as (1) a violent act or act that is dangerous to human life, property or infrastructure, that (2) has resulted in damage within the United States or outside of the United States in the case of an air carrier or vessel (as defined by TRIA) or on the premises of a United States mission, and (3) has been committed by an individual or individuals acting on behalf of any foreign person or interest, (4) as part of an effort to coerce the U.S. civilian population or influence the policy or affect the conduct of the U.S. Government by coercion. In addition, this statutory definition of an act of terrorism requires that the act be certified by the Secretary of the Treasury, with the concurrence of the Secretary of State and the Attorney General. Moreover, an act of terrorism must have resulted in property and casualty losses, in the aggregate, of $5 million or more. TRIA limits the liability of the Federal Government and insurers to $100 billion per year.29 Terrorism losses that are not covered under the Program are referred to by the industry as non-certified losses. Such losses might include, for example, acts of domestic terrorism committed without the relevant intent, attacks that fall below the minimum insured loss limit, or attacks outside U.S. borders. Mandatory Availability TRIA nullified exclusions for acts of terrorism contained within policies for TRIA-eligible lines of property and casualty insurance (discussed in Section 2.1) that were in effect on November 26, 2002. TRIA did not make the purchase of terrorism risk insurance mandatory, but it did require that all entities meeting the definition of a participating insurer under the Act offer (make available) terrorism risk insurance to their policyholders in any of TRIA-eligible lines that the 29 Section 102(1) of TRIA defines act of terrorism including the certification requirement. Section 103(e)(1)(B) contains the insurer liability caps under TRIA.

- 30 -
insurer offered. TRIA also required insurers to make the offer of terrorism risk insurance on the same terms and conditions as offered in their non-TRIA coverage and to disclose the cost of the terrorism risk insurance coverage.30 TRIA also required insurers to make certain disclosures to their policyholders about the TRIA Program. Policyholders have the option to accept or decline the terrorism risk insurance coverage, or to negotiate other terms with the insurer. TRIA did not set the price for terrorism risk insurance. Pricing is generally subject to state regulation as discussed previously. Insured Losses Insured loss is defined by TRIA as any loss resulting from an act of terrorism that is covered by primary or excess property and casualty insurance (as defined by TRIA) and issued by an insurer if such loss occurs within the United States or on a U.S. air carrier, vessel as defined in TRIA, or on the premises of a U.S. mission.31 TRIA covers insured losses from a nuclear reaction, or radiological, biological, or chemical release and/or contamination resulting from a certified act of terrorism if the coverage for those perils is provided in the primary or excess property and casualty policy issued by a TRIA-eligible insurer. Eligible insurers are defined in TRIA to include private insurers licensed or admitted to provide insurance by any state, which includes state-licensed captive insurance companies and risk retention groups set up to insure the risks of a parent company or association; state joint underwriting associations that pool the losses of members and state residual market entities that pool the risks of those that cannot otherwise get insurance; approved alien insurers incorporated outside the U.S. and not licensed by a state; and insurers approved by a federal agency for maritime, energy, or aviation activity. Insurer Deductible The term insurer deductible is defined by TRIA.32 The amount changes in each Program Year. In the first full Program Year (2003) the deductible was 7 percent of 2002 premiums, in 2004 the deductible was 10 percent of 2003 premiums, and in 2005 the deductible is 15 percent of 2004 premiums. The purpose of the graduated deductible amounts was to encourage development of private market capacity over time. As noted above, insurers are also liable for 10 percent of losses above the deductible threshold. A simple numerical example is helpful in illustrating the operation of the TRIA deductible and co-pay provisions. Consider an insurer with $1 billion in direct earned premiums in TRIA-eligible lines in 2004; its deductible for 2005 would be equal to $150 million and the Federal Government would share 90 percent of losses above the $150 million threshold. If this insurer 30 The term insurer is defined in section 102(6) of TRIA and includes any affiliate as defined in section 102(2). See also Treasury regulations at 31 CFR 50.5. The mandatory availability (also known as the make available) requirement is contained in section 103(c) and its continuation in Program Year 3 was made subject to a determination by the Treasury Secretary by September 1, 2004. See also 70 FR 7403 (February 14, 2005). For a discussion of the mandatory availability decision see section 2.3C. 31 Insured loss is defined in section 102(5) of TRIA. 32 Insurer deductible is defined in section 102(7) of TRIA.

- 31 -
faced an insured loss of $100 million due to certified terrorism losses there would be no Federal compensation and the insurer would be liable for the entire loss. In the event that the Federal Government provides compensation for insured losses for an act of terrorism under the Program, TRIA requires recoupment of at least a portion of the Federal compensation through policyholder premium surcharges.33 Recoupment is mandatory in cases where the aggregate industry retentions (deductibles and co-pays) are below a specified aggregate retention amount. The annual aggregate retention amount was $10 billion for 2003, $12.5 billion for 2004 and is $15 billion for 2005. The Government is required to collect the difference between these recoupment amounts and the aggregate industry retention through an industry-wide surcharge, not to exceed 3 percent of the premium paid on a policy. If the aggregate industry retention amount exceeds the aggregate retention amount, the Federal Government may require recoupment at the discretion of the Secretary of the Treasury, but the statute does not require recoupment. Impact of Company-Specific Deductibles Setting an insurer’s deductible as a percentage of its premiums may confer an advantage on smaller insurers because large insurers, with more premiums, retain more exposure to terrorism risk for the same policy limit. For example, consider a comparison between the insurer in the example above, with 2004 direct earned premiums of $1 billion and a 2005 deductible of $150 million, and an insurer with $100 million in 2004 earned premiums and a 2005 deductible of $15 million. If both insurers were writing coverage for an insured loss of $100 million due to certified terrorism losses, the larger insurer could expect to retain the entire loss without TRIA compensation, while the smaller insurer would have a retention of $23.5 million; the $15 million deductible and 10 percent, or $8.5 million, of the losses above the threshold. Thus, on the margin, TRIA may confer a pricing advantage upon the smaller insurer.
The advantage conferred upon smaller insurers would be maximized for small companies offering terrorism-only coverage, such as by the use of a captive insurance company for terrorism risks. A 2005 survey by Marsh reported “…significant utilization of captive insurers for terrorism exposures…”.34 The Treasury has cautioned that post-enactment formation or utilization of a captive insurer that will only provide stand-alone, TRIA-only coverage for losses from acts of terrorism raises questions regarding the integrity of the Program.35 Treasury will not pay the Federal share of compensation, in whole or part, should it determine that the insurer’s claim for Federal payment has been designed to circumvent the purposes of the Act or regulations.36 TRIA also may confer an advantage upon insurers writing in single TRIA-eligible lines (monoline insurers) relative to insurers writing across a broad range of TRIA-eligible lines 33 TRIA’s recoupment provision are contained in section 103(e)(7). 34 “Marketwatch: Terrorism Insurance 2005,” Research Report, Marsh, Inc., 2005. 35 U.S. Treasury, Terrorism Risk Insurance Program Office, Interpretative Letters, “Insurer (TRIA-Only Captives),” March 2, 2004, and “Property and Casualty Insurance (Standalone Terrorism Coverage and Captive Insurer),” September 24, 2004. 36 U.S. Treasury, Terrorism Risk Insurance Program Office, Interpretative Letters, “Property and Casualty Insurance (Workers Compensation Deductible and Captive Insurer),” September 21, 2004.

- 32 -
(multiline insurers), some of which offer less accumulation risk, yet with the same deductible. Compare, for example, a monoline property insurer with a $150 million deductible derived from 15 percent of direct earned premiums in the line, with a multiline insurer, with the same overall direct earned premium and deductible but writing premiums in property and commercial auto, which offers low level terrorism risk. That second insurer could be expected to retain a greater portion of property losses per dollar of policy coverage, compared to the monoline insurer, because a given property event would not be as likely to exceed the deductible of the second insurer. The monoline insurer could gain a pricing advantage. B. Implementation of TRIA TRIA gave Treasury the responsibility for implementing the Terrorism Risk Insurance Program. In implementing TRIA, Treasury has followed five goals: (1) to ensure the Program was promptly operational; (2) to implement TRIA in a transparent and effective manner; (3) to rely as much as possible on the state insurance law and regulatory structure; (4) to allow insurers to participate in the Program in a manner most consistent with their normal course of business; and, (5) to ensure that in the event of insured losses, insurance benefits could be provided in the most expeditious manner.37 In consultation with the NAIC, Treasury promptly issued several interim guidance notices to assist the insurance industry in complying with the immediately-effective requirements of TRIA.38 The interim guidance notices were directly followed by notice and comment rulemakings resulting in the issuance of interim and final regulations to implement key provisions of TRIA. Treasury proposed and finalized all regulations necessary to make the Program operational, including regulations necessary to identify participating insurers,39 to identify TRIA-eligible commercial property and casualty insurance lines,40 to calculate insurer deductibles, to address the treatment of state residual market insurance entities;41 for submission, review and payment of potential claims under TRIA42 and for litigation management.43 In April 2003, Treasury established a Terrorism Risk Insurance Program (TRIP) office,44 named its executive director, and recruited its small staff (seven staff members currently). The TRIP Office has provided insurers with numerous interpretations and responses to various issues, contracted with a claims management contractor and an auditor to assist with the processing and verification of potential claims and has established a web-based claims facility for the
37 See Testimony of Wayne A. Abernathy, Assistant Secretary for Financial Institutions, Treasury Department before the Subcommittee on Capital Markets, Insurance and Government Sponsored Enterprises of the House Committee on Financial Services (April 28, 2004). 38 Treasury issued interim guidance notices on December 3, 2002; December 18, 2002 and January 22, 2003. These notices provided a basis for the insurers to proceed to offer coverage and allowed the Program to be immediately operational. 39 31 C.F.R. 50.5 et seq. 40 Ibid. 41 31 C.F.R. 50.19 and 50.30. 42 31 C.F.R. 50.50. 43 31 C.F.R. 50.80. 44 31 C.F.R. 50.2 (2003).

- 33 -
submission and payment of claims. Currently the TRIP Office is finalizing recoupment procedures. C. Administrative Decisions by Treasury under TRIA Make Available The make available provisions of TRIA required that, from the date of enactment (November 26, 2002) through the last day of the second year of the Program (December 31, 2004), each insurer must make available, in all of its commercial property and casualty insurance policies, coverage for losses due to covered acts of terrorism that does not differ materially from the terms, amounts and other coverage limitations applicable to losses arising from events other than acts of terrorism. TRIA required that the Secretary of the Treasury determine by September 1, 2004, whether the make available provision should be extended through the third and final year of the Program. On June 18, 2004, the Secretary of the Treasury announced the extension of the make available provision into the third year. 45 Group Life TRIA did not provide coverage for group life insurance policies. Instead, the Treasury Department was tasked with evaluating market conditions and making a determination on whether group life should be included in TRIA. The law directed that the Secretary of the Treasury could include coverage for group life insurance if both insurance and reinsurance were not available, or not likely to be available in the future. During its evaluation of market conditions, the Treasury concluded that, while there was a general lack of catastrophic reinsurance for insurance companies that offer group life coverage, there had been no appreciable reduction in the availability of group life insurance coverage for consumers. Group life insurance companies have stayed with their customers and continued to make group life insurance available on much the same terms as before September 11th. Given that evaluation, the Secretary of the Treasury determined that he could not extend coverage for group life insurance under the Program. The decision was the result of a careful consideration of market conditions, with significant input from users and providers of group life insurance.46
45 Office of Public Affairs, “Treasury Announces Decision to Extend the ‘Make Available’ Provisions of the Terrorism Risk Insurance Act into 2005,” Treasury Department, June 18, 2004. Also see Technical Amendments to “Make Available'' Provision and “Insurer Deductible” Definition, 70 FR 7403 (February 14, 2005). 46 Office of Public Information, “Treasury Announces Decision on Group Life Coverage Under Terrorism Risk Insurance Program,” Treasury Department, August 15, 2003.


Chapter 3 Methodological Overview of TRIA Surveys This chapter provides an overview of the surveys used by the Treasury to evaluate insurance-market conditions following the implementation of TRIA. Before September 11th terrorism risks were treated as “other perils” and were not priced either explicitly or separately in the majority of commercial property and casualty insurance policies. While anecdotal information about perceived shortages of terrorism risk insurance and reinsurance was widely reported, little was known about the more general availability and affordability of terrorism risk insurance in the United States. Treasury contracted for the collection of the survey data because the required market-wide data were generally not available. The TRIA survey data provide Treasury with a consistent basis for the quantitative analysis of the insurance market. These data give a unique, comprehensive overview of the availability and affordability of terrorism risk insurance coverage on an approximately annual basis, from 2002 through the first two months of 2005. The broad objectives of the TRIA surveys were: • To collect information from both buyers and sellers of terrorism risk insurance on the broad
scope of terrorism coverage immediately prior to passage of TRIA, and while TRIA is in effect.
• To collect this information from nationally representative samples of insurers and
policyholders. • To collect data “at arm’s length” from Treasury to preserve the confidentiality of survey
responses. • To survey the same organizations on an approximately annual basis in order to monitor the
effects of increases in the legally mandated insurer deductibles. • To minimize respondent burden while collecting information in sufficient detail to control
for important differences between survey respondents. • To collect the survey data on a timely basis, including data on policies written or renewed at
the beginning of 2005 and therefore extend into 2006, for analysis and incorporation into the study results for delivery to Congress by June 30, 2005 as required by law.
Section 3.1 of this chapter reviews the development of the survey instruments, including the substantial contributions made by insurance industry experts and representatives. We discuss sample and survey design in Section 3.2. Section 3.3 describes the data-collection process. Section 3.4 discusses the strengths and weaknesses of the survey data.

- 36 -
3.1 Survey Development The information provided in this study is based on two independent multi-wave surveys of participants in the commercial property and casualty insurance market: the first surveyed insurers and the second surveyed policyholders.1 The insurer survey collected information on the provision of certified and non-certified terrorism coverage, the average cost of certified coverage, terms and conditions on terrorism coverage, the purchase of reinsurance, and technical factors affecting insurers’ ability to price terrorism coverage. The policyholder survey questionnaire collected information on the characteristics of businesses and other organizations that purchase terrorism coverage, special terms and conditions associated with that coverage, reasons why policyholders declined the mandatory offer, and reported loss-mitigation efforts. Treasury’s strategy for the collection of this information and the survey questionnaires are described in this section. Treasury developed a preliminary plan for the collection of information on terrorism risk insurance coverage immediately after passage of TRIA. These plans were shared with insurance industry representatives and experts for comment. Treasury convened a meeting of insurance industry representatives and other experts to review the proposed survey plans on January 30, 2003. During this advisory meeting, industry representatives and experts emphasized several features of the market, including the heterogeneity of the commercial property and casualty insurance market; the importance of accounting for different market segments; the distinction between commodity coverage and negotiated coverage; the importance of analyzing industry capacity as well as the availability and affordability of terrorism coverage; and the existence of policy renewal “seasons” within a calendar year. Location, size, and “nature of industry” were identified as variables that are important for the definition of market segments. It was noted that large insurers and large companies negotiate contracts on a case-by-case basis. These contracts are complex and heterogeneous, and it is difficult to draw meaningful conclusions about them on the basis of information from standardized survey questions. Virtually all high profile, large, geographically concentrated properties fall within this category. Meeting participants agreed that the survey should take account of coverage for non-certified terrorist attacks as well as coverage for acts of terrorism likely to be certified because both affect market conditions within the industry. Workers’ compensation was identified as an important issue because the liabilities associated with personnel loss are difficult to value, terrorism coverage is mandatory even in the case of war, and the perceived magnitude of liabilities associated with personnel loss has increased since the September 11 attacks. Other issues that were noted include workers’ compensation insurance and nuclear, biological, chemical, or radiological (NBCR) terrorism risks. Meeting participants recommended that the Treasury surveys ask whether respondents have terrorism risk insurance and whether they consider premiums for such insurance to be too high. Treasury was advised that information on terrorism risk insurance prior to the events of 1 A questionnaire directed to reinsurers was also developed, but the resulting data are not statistically reliable because response rates to the reinsurer survey were low.

- 37 -
September 11th is generally unavailable because terrorism risk insurance was often incorporated into standard coverage at little or no additional cost. Regarding questions about post-September 11th prices, Treasury was advised to inquire about limits and deductibles as well as premiums. There was also agreement among those experienced with business surveys that contracting with a third party to collect survey data under a pledge of confidentiality would increase survey participation. Preliminary survey questionnaires were drafted in the spring of 2003. In all cases these questionnaires were reviewed by insurance industry representatives, NAIC representatives and others before they were submitted to the survey contractor for field testing. A self-organized working group consisting of representatives of major insurers and the American Insurance Association (AIA) provided a substantially revised alternative approach to the insurer questionnaire. Detailed comments on the insurer questionnaire were also provided by the Alliance of American Insurers (AAI) after consultation with its members. Members of the Coalition to Insure Against Terrorism (CIAT) met with Treasury staff to review the policyholder questionnaire and recommend changes in wording and question formulation. In addition staff members from Marsh, Guy Carpenter and the Council of Insurance Agents and Brokers (CIAB) provided substantial advice to Westat and to Treasury under consulting arrangements with Westat. NAIC staff members responded to numerous questions from Treasury staff and from Westat, the contractor chosen by Treasury to conduct the TRIA surveys. Many revisions suggested by these reviewers were incorporated in the final questionnaire design. The resulting insurer and policyholder survey questionnaires are described below. Insurer Questionnaire The insurer questionnaire had four major sections. The first section requested information on the characteristics of the insurer, such as ownership (public or privately held) and number of locations. The second section collected information on insurance purchased or sold in TRIA-eligible lines, charges for terrorism coverage, and special terms and conditions associated with terrorism coverage. This section also asked about non-certified coverage, NBCR and special conditions associated with coverage in states that require coverage for fire damages following terrorist attacks whether terrorism risk insurance coverage was purchased or not. The third section of the insurer questionnaire asked about reinsurance for the deductible and co-payment associated with terrorism coverage, or the reasons why terrorism reinsurance was not purchased. The last section asked a number of qualitative questions designed to assess recent and expected developments in market capacity and insurers’ ability to underwrite terrorism risks. These surveys were conducted on an annual basis: the first wave covered 2002 and 2003, the second wave covered 2004, and the third survey covered the first two months of 2005. More specifically, the second section of the questionnaire asked about insurers’ policies written or renewed within the specified calendar year: the month when policies representing the largest share of direct written premiums was renewed, the total number of policies written or renewed in a given year, the total direct written premiums from those policies, the number of policies written in that year that included terrorism coverage, total direct written premiums on policies with terrorism coverage, and total direct written premiums for terrorism coverage in policies that included terrorism coverage. In wave one these questions were asked for each of the following

- 38 -
broad lines: commercial property including business interruption, workers’ compensation, other liability and casualty. Survey respondents were asked to aggregate across the lines and coverage types in two ways. First, the lines were aggregated over three broad lines of coverage: commercial property, workers’ compensation, and other liability and casualty. The commercial property aggregate includes policies covering losses to property and business interruption. Workers’ compensation includes only coverage for workers’ compensation. Other liability and casualty includes liability and casualty coverage, including commercial auto no-fault, other commercial auto insurance, aircraft, and other types of coverage. Second, respondents were asked to provide information aggregated by the method of coverage provision. Information on umbrella or excess policies and on package policies was collected separately. Umbrella or excess policies provide coverage for losses above the limits of the property-casualty policies. Such policies may have terms of coverage that are broader than policies providing the primary layer of coverage. Package policies cover more than one type of insurance risk under the same policy. Thus, umbrella and package policies effectively aggregate across the broad lines of coverage identified above. The questions described above refer explicitly to policies written or renewed in a given calendar year. Because TRIA was passed in late November 2002, comparisons between the pre-TRIA environment in calendar year 2002 and the post-TRIA environment in calendar years 2003 through 2005 are reasonably straightforward. Data reported for calendar year 2002 represent primarily pre-TRIA market conditions, while data reported for 2003 through 2005 represent post-TRIA market conditions. In the first survey wave, for each of the broad lines listed above, insurers were asked to identify the month when the policies representing the largest share of their direct written premiums is written or renewed. Because all policies are not written or renewed at the beginning of the calendar year, the true average cost of coverage for acts of terrorism covered under TRIA, in an expected value sense, should incorporate a weighted average of the TRIA Program year deductibles.2 Furthermore previously existing exclusions of terrorism coverage were nullified immediately when TRIA went into effect, but insurers may have waited for their regular policy renewal dates to price the mandatory offer under terms that took account of the TRIA backstop. Therefore the true behavioral response of insurers should become apparent with a lag, and the length of that lag is a function of the primary policy renewal month within each line. Survey information collected from insurers was generally available in insurers’ books and records, and much of it is routinely reported to NAIC. The balance of the second section of the insurer questionnaire was designed to be answered more easily. For example, respondents were asked a series of questions that can be answered yes or no, to determine whether special terms or conditions were typically associated with the terrorism coverage they actually sold. While the law specifies that the insurer must offer all policyholders terrorism coverage under terms and conditions comparable to those in the basic insurance policy, the policyholder is free to decline 2 The program year deductibles are 7 percent of the prior calendar year’s direct earned premiums in 2003, 10 percent in 2004, and 15 percent in 2005.

- 39 -
the initial offer and then negotiate for coverage under terms and conditions that are different from the initial offer. If negotiation for terrorism coverage under terms and conditions that are different from the mandatory initial offer were a general pattern, and if insurers were to prefer one type of restriction or condition over others available to them, insurers’ responses to these questions should identify their preferred mechanisms for limiting exposure. To characterize the different markets served by different survey respondents, insurers were asked to report the median value of assets covered by commercial insurance policies, the median number of employees at a single location covered in workers’ compensation policies, and their willingness to provide workers’ compensation insurance to establishments in different employee size classes. To evaluate cyclical changes in the structure of coverage, brief questions about system-wide changes in average limits and deductibles among policies that did not include terrorism coverage were also included. Respondents were asked whether they provide any coverage to locations in high-risk cities, an iconic location, or a city with more than 350,000 in population, and whether the terms and conditions associated with terrorism coverage for these high-risk locations differ significantly from those associated with coverage for other locations.3 Insurers providing any NBCR coverage and those that provide coverage in fire following states were also asked about special terms and conditions associated with terrorism coverage in those contexts. The third section of the insurer survey collects information on reinsurance for terrorism risks. Participants were asked to identify the approximate percentage of their TRIA deductibles and co-payments reinsured, and to indicate whether their reinsurance coverage included special terms and conditions. The survey also collected information about reinsurance for non-certified and NBCR terrorism coverage. Finally, insurers that do not purchase reinsurance for their TRIA deductibles and co-payments were asked why they do not. The last section of the insurer questionnaire asked a series of simple questions about the organization’s use of techniques to estimate the probability and cost of a future terrorist event, their use of specific financial risk management techniques and techniques to limit exposure within geographical areas.4 Policyholder Questionnaire The policyholder questionnaire parallels the insurer questionnaire, but is shorter and simpler. In the first section of the questionnaire, policyholders were asked about corporate structure, whether their organization has a single or multiple locations, whether they have locations in a high-risk city, in an iconic location, and/or in a large city (defined by population greater than 350,000). The second section of the policyholder questionnaire asked basic information about the
3 These cities were identified by the Department of Homeland Security (DHS) in the spring of 2003: Chicago, Houston, Los Angeles, New York City, San Francisco, Seattle or Washington, D.C. See the DHS May 14, 2003 press release titled “Securing Our Homeland: Protecting Our Urban Areas,” accessed June 9, 2005 from http://www.ncsl.org/terrorism. 4 The reinsurer questionnaire was broadly similar to the insurer questionnaire, and as such is not reviewed in detail.

- 40 -
respondent organization: total assets, number of employees, total revenue, share of revenue from each major geographic region, and share of revenues from large cities. The third section of the policyholder survey asked about the organization’s insurance coverage. Information was collected on the number of policies begun or renewed in the specified year, whether any of those policies included terrorism coverage, the total premiums paid for all policies within the broad line, the total premiums for TRIA-eligible coverage, the sum of total premiums for non-certified coverage if known, the highest limit across all policies, and the lowest deductible across all policies. Recognizing the possibility that the policy renewal month would affect the date when policyholders received the initial mandatory offer of terrorism risk insurance for acts of terrorism covered under TRIA, policyholders were asked to identify the policy renewal month for policies representing the largest share of their total premiums within broad lines of interest. In 2003 and 2004, policies written or renewed later in the calendar year were expected to reflect higher charges for certified coverage because the coverage period extends into the following year, when the legislatively mandated insurer deductible is higher.5 Policyholders were asked whether any of their terrorism coverage is provided through captives, and about their reasons for using a captive insurer for terrorism coverage. In addition, they were asked about special terms and conditions associated with their TRIA-eligible and non-certified coverage, and about differences between limits and deductibles for TRIA-eligible and non-certified terrorism coverage. The next section of the policyholder survey covered respondents who do not purchase terrorism coverage, asking their reasons for declining the mandatory offer and the price they would be willing to pay for terrorism coverage. The last section of the policyholder survey asked a series of questions about general practices: whether more or less of the respondent organization’s terrorism risk coverage is purchased from alternative insurers relative to the norm for that organization, whether specific risk-mitigation measures had been adopted, and whether the organization is required to purchase TRIA-eligible or non-certified terrorism risk insurance for reasons involving loan covenants or lease contracts. Questions on Coverage After TRIA As a general rule, insurance policies written or renewed in the first part of 2005 extend into 2006. By law, the Program expires at the end of 2005. Insurers’ charges for terrorism coverage and their use of special conditions to limit exposure are expected to adapt to the expiration of the Federal backstop. Policyholder purchase decisions are expected to change in response. New questions were added to the last wave of survey questionnaires to capture these effects. In all
5 For example, consider a policyholder who renews all commercial property and casualty insurance policies each July. Policies written or renewed at the beginning of July of 2003 spanned the first 6 months of 2004, when insurers’ deductibles were 10 percent of the prior year’s direct earned premium, as well as the last 6 months of 2003 when insurers’ TRIA deductibles were 7 percent of the prior calendar year’s direct earned premium. The cost of similar policies written and renewed in early January of 2003 should be lower, all else equal, because in the latter case the lower seven percent insurer deductible was in effect throughout the entire coverage year.

- 41 -
cases survey respondents were asked to respond in terms of policies actually written or renewed in the first two months of 2005. For clarity, coverage for terrorist events comparable to acts of terrorism covered under TRIA was called international terrorism coverage in the questionnaires. In both surveys the additional questions asked about the use of exclusions for international terrorism coverage in 2006, the use of special terms and conditions associated with international terrorism coverage, and about differences between the limits and deductibles for policies with terrorism coverage and those for non-certified coverage.

- 42 -
Section 3.2 Survey Design This section focuses on the design of the TRIA surveys and the structure of the survey samples. Treasury contracted with Westat, a contractor with experience in the collection and analysis of confidential survey data, to draw nationally representatives samples, field test the questionnaires described above to evaluate tradeoffs between respondent burden and questionnaire detail, develop paper and web-based data collection instruments, follow up with survey respondents with clarifying questions as necessary, edit the data, develop sample weights, and provide summary statistics needed to evaluate data quality. Following new guidelines provided under the Confidential Information Protection and Statistical Efficiency Act of 2002 (CIPSE, Public Law 107-347), Treasury collected the survey data under a pledge of confidentiality. Industry advisors commented in several contexts that this approach could increase survey participation, and thereby strengthen the reliability of the survey results. Design of Insurer Survey The goal of the insurer survey was to collect data that can be used to analyze insurer behavior in response to the passage of TRIA. The number of commercial property and other liability insurers is small relative to the total number of corporations and other organizations in the U.S. economy. Furthermore large insurers account for a large share of total premiums in TRIA-eligible lines (see Chapter 2), and a simple random sample of the population might not include a sufficient number of observations from large insurers to draw reliable conclusions about this group. In addition, because TRIA is a national Program, it is important to ensure that survey data are available from all major regions of the country. Therefore, Treasury specified that the sample of insurers selected for participation in the insurer survey should be statistically representative of the four major geographical regions within the U.S., and for each of three broad asset classes: insurers with less than $1 billion in total assets, insurers with $1 to $10 billion in total assets, and insurers with more than $10 billion in assets. Table 3.1 summarizes the sample domains of the TRIA insurer survey.

- 43 -
Table 3.1
TRIA Insurer Survey Sample Domains and Sub-Domains Broad Geographic Regions Northeast Midwest South West Broad Lines Sold All TRIA-eligible lines, or all but workers’ compensation Workers’ compensation only Asset Size Class Insurers with less than $1 billion in assets Insurers with $1-10 billion in assets Insurers with over $10 billion in assets The NAIC provided Westat with a sample frame for the insurer survey. The sample frame listed all commercial property and casualty insurers with premiums in TRIA-eligible lines. 6 The final survey frame also included domains for a small number of foreign insurers, and for captive insurers registered in Vermont and Hawaii. Design of Policyholder Survey A large sample of policyholders is required to generate statistically reliable information on the commercial property and other liability policyholders within the U.S. economy. Industry representatives consistently emphasized the heterogeneity of different segments of the commercial property and casualty insurance market. To fulfill the mandate that Treasury evaluate the availability and affordability of insurance for acts of terrorism covered under TRIA, it was essential that the survey be representative of all major regions and industrial sectors within the economy. The survey data also needed to be representative of large corporations and other organizations that account for a disproportionate share of total economic activity. High sampling rates were also important to ensure the availability of information on sub-populations mentioned explicitly in the law, as sources of particular concern: trucking, railroads, and public transit.7 6 Treasury is indebted to the NAIC for providing Westat, Treasury’s survey contractor, with the information needed to develop the insurer sample frame. 7 An alternative source of data is broker surveys. While they have the advantage of a higher response rate, it is generally thought that the clientele served by brokers is not representative of all major sectors of the economy. Marsh, an insurance broker, has released a number of independent studies on the topic of terrorism risk insurance. These are based on client records. The most recent of these studies, titled MarketWatch: Terrorism Insurance 2005, included data from 2,371 firms. The median total insured value (TIV) of the firms included was $200 million; the median for property premiums was $275,000; the median for terrorism premiums was $13,000. Data are reported through year-end 2004. Key results from this study include the following.

- 44 -
Taking these factors into account, the policyholder survey was designed to generate reliable estimates of take-up rates and costs for the groups listed in Table 3.2.8 This approach ensured that Treasury would be able to compare and contrast survey results along the dimensions specified in Table 3.2. As noted above, data collection was undertaken “at arm’s length” from Treasury to preserve the confidentiality of the information collected in the survey. No directly identifying information was provided to Treasury analysts, and data were masked as required, following established statistical procedures, to prevent indirect disclosure at the level of the individual respondent. No directly or indirectly identifying survey information has been or will be released in any Treasury report or publication. All contractor staff involved in the TRIA surveys have signed pledges of confidentiality, and have been notified that violators of these pledges are subject to substantial fines, imprisonment, or both. This approach was taken to ensure compliance with the CIPSE, which safeguards the confidentiality of data collected for exclusively statistical purposes.
Marsh found that about 49 percent of Marsh’s clients purchased property terrorism insurance in 2004, compared to the 2003 average of 27 percent. More specifically, the take-up rate increased from 23 percent in the second quarter of 2003 to 44 percent in the first quarter of 2004, but remained fairly steady throughout 2004. The purchase of property terrorism coverage in 2004 varied significantly depending on a company’s TIV; smaller companies (less than $100 million TIV) were much less apt to purchase this coverage. Take-up rates—the percentage of companies buying the coverage—varied considerably among regions in 2004: about 53 percent in the Northeast and Midwest, 47 percent in the South, but only 34 percent in the West. The cost of terrorism coverage was measured both as a rate—premiums divided by TIV—and as a percentage of a client’s overall property premium. Marsh found that the median terrorism premium rate for 2004 was 0.0057 percent, essentially unchanged from 2003. The rate decreased as the TIV of the client increased. The median percentage of a company’s annual property insurance costs attributable to terrorism premiums rose from 4.4 percent in 2003 to 4.7 percent in 2004. Larger companies spent a smaller percentage of premium dollars on terrorism insurance in 2003. In 2004, the opposite occurred: the largest companies spent 5.25 percent of their property premium budget on terrorism insurance, compared to only 4.5 percent in companies with TIV under $100 million. Marsh found that 81 percent of companies purchased TRIA coverage in their primary general liability (GL) programs in 2004, a decline from 93 percent in 2003. As a percentage of premiums for the overall coverage the charge for terrorism coverage held steady at about 1 percent. To the extent that similar calculations have been undertaken, our findings from the policyholder survey, presented in Chapter 5, are broadly consistent with the findings reported by Marsh, particularly for large policyholders. The Marsh estimates are based on a sample of Marsh client records and are unlikely to be representative of the broader group of commercial property and casualty policyholders represented in our survey. 8 The frame for the policyholder sample was constructed by Westat, the survey contractor, using data from Dunn and Bradstreet and the Census of Governments.
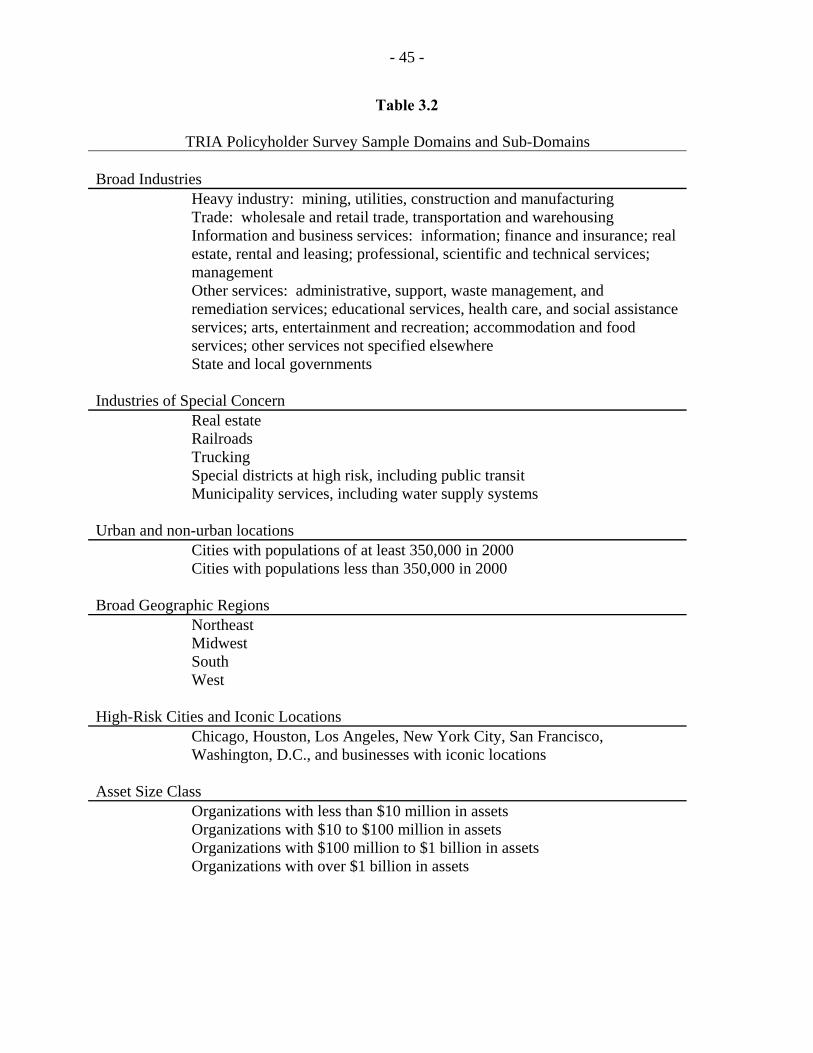
- 45 -
Table 3.2
TRIA Policyholder Survey Sample Domains and Sub-Domains Broad Industries Heavy industry: mining, utilities, construction and manufacturing Trade: wholesale and retail trade, transportation and warehousing Information and business services: information; finance and insurance; real
estate, rental and leasing; professional, scientific and technical services; management
Other services: administrative, support, waste management, and remediation services; educational services, health care, and social assistance services; arts, entertainment and recreation; accommodation and food services; other services not specified elsewhere
State and local governments Industries of Special Concern Real estate Railroads Trucking Special districts at high risk, including public transit Municipality services, including water supply systems Urban and non-urban locations Cities with populations of at least 350,000 in 2000 Cities with populations less than 350,000 in 2000 Broad Geographic Regions Northeast Midwest South West High-Risk Cities and Iconic Locations Chicago, Houston, Los Angeles, New York City, San Francisco,
Washington, D.C., and businesses with iconic locations Asset Size Class Organizations with less than $10 million in assets Organizations with $10 to $100 million in assets Organizations with $100 million to $1 billion in assets Organizations with over $1 billion in assets

- 46 -
3.3 Data Collection Distribution of questionnaires for the first wave of policyholder questionnaires began on November 8, 2003, and continued through March 15, 2004. Distribution of questionnaires for the first wave of insurer questionnaires began on December 16, 2003. The full schedule of data collection efforts for all three waves is given below in Table 3.3. In every instance survey questionnaires were accompanied by a cover letter from Treasury Secretary Snow, urging cooperation with the survey and providing assurances about the confidential nature of the data collection effort. Parallel cover letters from Westat also accompanied each questionnaire; these letters pledged to safeguard the confidentiality of survey responses, provided unique passwords to enable confidential web-based data entry, and gave email and telephone contact information. Detailed information about data security procedures was also made available on the web in accordance with the Privacy Information Act of 2002. Table 3.3
Data Collection Commenced Data Collection Ended
Wave One Policyholders November 8, 2003 March 15, 2004 Insurers December 16, 2003 April 5, 2004
Wave Two Policyholders September 24, 2004 December 15, 2004 Insurers September 24, 2004 December 15, 2004
Wave Three Policyholders January 28, 2005 March 18, 2005 Insurers January 26, 2005 March 18, 2005 Reinsurers November 29, 2004 February 7, 2005
Throughout the data collection process care was taken to protect the identities of survey respondents. Access to the full database at Westat was restricted to a few key staff members. Questions from Treasury staff about the consistency of individual survey responses were referred to Westat for follow-up with the survey respondent by referencing a survey identification number. For cases in which an industry is so dominated by a small number of entities that it is impossible to analyze information from that industry without discerning company-level results, the data were analyzed separately at Westat according to Treasury specifications and only aggregated results were forwarded to Treasury. After the first survey wave, Treasury and Westat agreed upon a number of specific measures designed to gauge and/or improve the integrity of the data. Measures taken to improve the integrity of the data include post-stratification of the insurer survey results with NAIC data on total premiums in TRIA-eligible lines, sustained telephone follow up with large wave one non-respondent policyholders who were contacted late during the initial survey wave, and optimal

- 47 -
sub-sampling of wave one non-respondents for increased efficiency. Measures taken to assess the reliability of the data include a follow-up survey to assess the possibility of non-response bias in the policyholder survey, a second follow-up survey with policyholders who reported no workers’ compensation insurance coverage to check for respondent reporting error, and the purchase of additional information from Dunn and Bradstreet for use in the development of statistical adjustment factors to compensate for possible non-response bias and attrition bias.

- 48 -
Section 3.4 Strengths and Weaknesses of Survey Data While the insurer and policyholder surveys were contracted out concurrently, the two surveys provide two distinct and independent sources of quantitative information about terrorism risk insurance coverage. The following chapters show that the two sets of survey results show similar trends over time, and therefore they are mutually reinforcing. Westat’s final response rate estimate for the first wave of the insurer survey is 50 percent overall, and 52 percent on an asset-weighted basis. The corresponding response rate for the 2004 cross-section data is 58 percent overall, and 53 percent on an asset-weighted basis. Response rates for the policyholder survey are lower. Unweighted response rates, in which large respondents receive greater weight because the largest organizations were sampled with certainty, are 20 percent for wave one, and 17 percent for wave two. Population-weighted estimates of policyholder response rates are 17 percent for the first survey wave, and 14 percent for the second wave. This result is not entirely unexpected. For context, it is helpful to note that response rates to complex financial surveys often fall below 40 percent even when the surveys are mandatory.9 Clearly response rates will be lower in the case of a complex financial survey that is voluntary. Westat’s final analysis of policyholder survey response rates shows low overall survey response rates to be attributable to very low response rates among small organizations; the response rates of larger organizations are much higher. Large organizations are responsible for a disproportionately large share of total economic activity. For example, the category “very large firm or organization” includes 12 businesses and one state government with more than 300,000 employees each. Table 3.4 below shows that the wave one survey response rate for very large organizations was roughly 32 percent, and the corresponding response rate for the 2004 cross-sectional data was 25 percent.
9 Philip Smith, “Perspectives on Response Rates and Nonresponse in Establishment Surveys,” presented to the Federal Economic Statistics Advisory Committee in Washington D.C. on December 14, 2004. Retrieved June 12, 2005 from http://www.bls.gov.

- 49 -
Table 3.4
Policyholder Groups Response Rate Estimates
Percentages
2002-2003 2004 Small firm – heavy industry, trade, information – high-risk city 9 7 Small firm – heavy industry, trade, information – not high-risk city 15 13 Small firm – other services – high risk industry 15 13 Small firm – other services – not high risk industry 12 9 Small organization – government 37 28 Mid-size or large organization – government 57 44 Mid-size or large organization – non-government 20 17 Very large firm or organization 32 25 Wave three response rates are relatively low in all instances, and for this reason data from 2005 are discussed, but not presented graphically, in Chapters 4 through 6. Response rates to the reinsurer survey were too low to warrant the presentation of any quantitative results, despite substantial efforts to develop a useful questionnaire. A number of very large reinsurers responded to the survey. We are grateful for their efforts and we have taken their responses into consideration in our qualitative analysis. However the aggregate results are not statistically reliable and therefore they cannot be presented. In response to the obvious concern with policyholder response rates, Westat and Treasury agreed upon several efforts to evaluate possible measurement errors. The majority of these efforts were motivated by three basic concerns that arise in the context of the policyholder survey. The first involves respondent recall error. In 2003 some policyholders may not have known or recalled whether they had terrorism coverage in 2002 or 2003, particularly if their insurer provided terrorism coverage at no charge. On this count some of the increase in terrorism risk take-up rates shown in the policyholder survey results may be an artifact of improved respondent recall about the active decision to accept or decline terrorism coverage under the make available provision. Similar concerns about possible reporting errors arise with respect to workers’ compensation insurance coverage. Survey estimates of take-up rates in workers’ compensation lines are low. We know from comments made during the initial advisory group meeting mentioned above and from follow up conversation with the NAIC that self-insurance for workers compensation is prevalent.10 This explanation provides some credibility to the low workers’ compensation take-up rate estimates, but seem unlikely to be a complete explanation. It is also possible that some
10 Eric Nordman, Director of Research at the NAIC, advised us that approximately 38 states permit workers’ compensation coverage through group self-insurance, and a number allow businesses to self-insure for their workers’ compensation exposure.

- 50 -
respondents don’t recall purchasing terrorism coverage in workers’ compensation precisely because it is mandatory and no active purchase decision needs to be made.11 To investigate the low workers’ compensation take-up rate estimates, Westat contacted 184 wave one survey respondents out of 464 who did not report workers’ compensation coverage in 2003. Among the 177 wave one respondents who participated in this follow-up survey, 55 percent reported that they actually did have workers’ compensation coverage. Westat reports that “many respondents simply did not think of their state WC program, or special nonprofit insurance pool, as an insurance policy.” Among the remaining follow-up survey respondents, 45 percent were self insured for workers’ compensation, 19 percent participated in the Federal Employers’ Liability Act program, and 8 percent reported that their employees were hired by temporary help agencies, were paid by professional employer organizations, or were self employed. A small number claimed that workers’ compensation was not required in their state if the establishment has fewer than 50 employees. These results indicate clearly that self insurance and respondent recall error both contribute to the low workers’ compensation take-up rate obtained with the survey. On the basis of these follow-up survey results, Westat recommended that overall sample-based estimates of workers’ compensation take-up rates be adjusted upward by 55 percent of the complement of the estimate.12 While this approach may be viable for overall estimates, the sample sizes in the follow-up survey are too small to support comparison of take-up rates in different groups of interest. We have concluded that the workers’ compensation take-up rate estimates are not statistically reliable and therefore we do not present them. Although state law requires that terrorism coverage be included in workers’ compensation policies, Westat found that only 6 of the 98 follow-up survey respondents who had workers’ compensation coverage were able to report on their workers’ compensation terrorism insurance premiums. This suggests either that their terrorism coverage is usually provided at no charge or that respondents don’t recall the charge. Policyholder survey estimates of the cost of terrorism coverage in workers’ compensation insurance policies are therefore unreliable, and as a result, unfortunately, policyholder reports of the cost of workers’ compensation coverage are not reported in this study. Cost data from insurers in workers’ compensation lines is reported in Chapter 5, however. It should be noted that the TRIA surveys were sent to individuals responsible for most insurance decisions, typically in finance and accounting departments. Questionnaires were sent to persons with the title of President, Owner, Chief Executive Officer, Chief Financial Officer, Treasurer, Comptroller, Director of Actuarial Services, and so on. In many cases the individuals responsible for workers’ compensation insurance coverage may be different from those to whom the questionnaire was sent. The web-based data entry survey was designed to allow data entry
11 Mary Jane Cleary of NCCI suggested this form of respondent recall error during a brief telephone conversation in the spring of 2004. 12 For example, if the sample-based workers’ compensation take-up rate estimate is 40 percent, Westat estimates that 55 percent of the remaining policyholders, who do not report having workers’ compensation coverage in their survey responses, nonetheless do have workers’ compensation coverage. They therefore recommend an adjusted uptake rate estimate of 73 percent.

- 51 -
from persons in two separate departments, and separate questionnaires about workers’ compensation were developed to facilitate the collection of information on workers’ compensation coverage. Nonetheless we believe that the high item non-response in the policyholder survey data on workers’ compensation coverage, despite the fact that workers’ compensation coverage is mandatory in most instances, is attributable in part to the fact that workers’ compensation data is often handled in a separate department from the one that handles other insurance purchasing decisions. A different set of measurement concerns involves the possibility of non-response and survey attrition bias. To understand this issue, note that survey respondents who invest the time and effort required to respond to the survey might be more concerned than the average policyholder about terrorism risks, and that policyholders with the greatest concerns may be more likely to respond to all three survey waves. Westat’s non-response follow up study was designed to test for evidence of non-response bias of this sort in the first survey wave. This follow-up survey consisted of a small number of brief questions posed in telephone interviews, to ascertain whether or not the non-responding organization had in fact purchased terrorism coverage. These telephone interviews were attempted with a random sample of 1,000 organizations in the first wave of the policyholder survey that were known through initial telephone contact to be eligible to participate, but had not responded to the survey questions. Organizations that had not purchased terrorism coverage were asked to identify their reasons for declining coverage, selecting from a short list of reasons provided by the interviewer. The results from this survey were encouraging. They showed no evidence of survey non-response bias for estimates of uptake for the population as a whole, and for most sub-groups of interest. The results show evidence of survey non-response bias in some groups.13 Unfortunately we do see some evidence of attrition bias in the second wave of the policyholder survey. Attrition bias is similar to non-response bias in the sense that it occurs when survey respondents differ systematically, in ways that influence their survey responses, from survey non-respondents. However attrition bias occurs when a former survey respondent declines to participate in later survey waves. For example, in Chapter 5 we show a striking increase in take-up rates among large policyholders in 2004, when compared with the take-up rate estimates for this group in 2002 and 2003. When calculating take-up rate estimates among large policyholders who participated in the first survey wave separately for those who also participated in the second wave and those who did not participate in the second wave, we find that the 2003 take-up rate estimate of the group that participated in the second survey wave is double the 2003 take-up rate estimate for the group that did not participate in the second survey wave. This suggests that
13 Statistically significant discrepancies were found with some regularity in take-up rate estimates for the Western region, large cities, real estate, railroads, government, and organizations with $100 million-$1 billion in assets. They were found with somewhat less regularity in take-up rate estimates for Washington D.C., San Francisco, business services, and organizations with $1 billion or more in assets. In most instances in which statistically significant discrepancies were noted, the likelihood that the respondent had purchased any insurance coverage in a given line was found to be understated in the initial (and much longer) TRIA policyholder survey, and the likelihood of having purchased terrorism risk insurance was overstated in 2003. While some statistically significant discrepancies are to be expected simply because both sets of estimates are based on random samples, the clustering of several discrepancies for one sub-group suggests that the estimates for these groups are less reliable than the estimates in which no clustering of this sort is observed. It should be noted, however, that Westat employed a conservative testing procedure to flag possible discrepancies.

- 52 -
survey respondents who are more likely to purchase terrorism risk insurance are represented disproportionately in the second wave of survey data. The group that did not participate in the second survey wave represented roughly 30 percent of the population of large policyholders in 2003, so this is unlikely to be a trivial effect in quantitative terms. It is also a believable result: higher-risk organizations are likely to be more interested in terrorism and terrorism related issues, to be more aware of TRIA and terrorism insurance, and to be more motivated to participate in the survey during successive waves because TRIA is potentially beneficial to them. For some organizations, and especially those managing large numbers of complex insurance policies in TRIA-eligible lines, the resources required to complete three waves of the TRIA survey can be quite burdensome. Therefore it seems plausible that large organizations with little interest in terrorism risk insurance would be more likely to drop out of the survey after the first wave than large organizations that have a vested interest in TRIA. For this reason our discussion of 2004 results from the policyholder survey in Chapter 5 is guarded. The third concern that arose during the course of the survey involved the selection of reporting categories. Insurance industry representatives advised us that they would be able to report data in the following broad categories: commercial property, workers’ compensation, and other liability and casualty. Our survey contractor recommended that we collect separate information on umbrella and package policies because they often span several lines. This approach did not raise problems in field tests and focus groups employed to evaluate the questionnaire, but a number of wave one respondents indicated that information on their package policies was included when they reported on commercial property coverage. Realizing that package policies are an identifiable component of commercial property policies under NAIC reporting conventions we modified the wave two questionnaires to ask separately about umbrella and package lines. Many wave two respondents then shifted the composition of their policy data away from commercial property and into package lines.14 The upshot is that we cannot disentangle package from umbrella policies in wave one, and some wave one data on commercial property policies likely includes information from package policies. Large shifts in the composition of policy data by broad line that were revealed in data analysis were referred to Westat for follow up with the survey respondent, but the follow ups were not successful in all instances and we can say nothing about small composition shifts that are less obvious. We usually aggregate the policy information into two broad categories: all lines except workers’ compensation, and workers’ compensation insurance. Because our basic unit of analysis is the entire organization, this aggregation does not present serious problems for interpretation.
14 In waves two and three information was requested in the following broad lines. (1) Commercial property, including policies covering losses in business interruption, fire, allied lines, farm owners’ multiple peril, commercial multiple peril (non-liability portion), burglary and theft, inland marine and boiler and machinery. (2) Workers’ Compensation. (3) Other liability and casualty, including the remaining property and casualty policies such as commercial multiple peril (liability portion), products liability, other liability, commercial auto no-fault, other commercial auto liability, commercial auto physical damage, surety, ocean marine, financial & professional liability, aircrafts (all perils) and event cancellation. (4) Umbrella and/or excess policies, defined as those that include coverage for losses above the limit of an underlying policy or policies that impact property or casualty policies. While it applies to losses over the dollar amount in the underlying policies, terms of coverage are sometimes broader than those of the underlying policies. (5) Package policies that cover more than one type of insurance risk under the same policy.

- 53 -
We also note two minor points that are relevant in the assessment of data quality. The first is that the survey results presented in the balance of the study are, whenever possible, presented in ratio form. This approach has two advantages. First, in the case of data that were collected near the end of 2004, the comparability of the resulting estimates to annual estimates from 2003 is good. Second, when respondents report in different orders of magnitude from wave to wave (reporting in dollars in wave one but in thousands of dollars in wave two, for example) ratios from the two time periods remain comparable. The second point is simply that, unless indicated otherwise in the text, the survey data are weighted to be representative of the population that was eligible to participate in the survey. Estimates from the insurer survey are representative for the population of insurers who collected more than $10 million in commercial insurance premiums and sold some policies in TRIA-eligible lines. Estimates from the policyholder survey are weighted to be representative of corporations and other organizations with at least 10 employees who are not part of the Federal Government. This approach is adopted because the organization itself is the basic unit of analysis. Changes in reported values within asset size classes are indicative of changes in the market conditions facing and/or the behavior of organizations with an identifiable set of characteristics. These are listed in the descriptions of the insurer and policyholder questionnaires.


Chapter 4 Results from Surveys of Insurers This chapter presents quantitative information on the availability, affordability, and cost of terrorism risk insurance immediately prior to and during the TRIA Program. The findings are based on Treasury surveys of commercial property and casualty insurers, described in Chapter 3. The analysis is focused on commercial property and casualty insurance lines that are eligible for TRIA coverage. The data cover 2002 to 2005, and therefore reflect adjustments in this market to the events of September 11th, 2001 and the subsequent introduction of TRIA. The supply of terrorism risk insurance in 2002, prior to the passage of TRIA, is used throughout as a baseline for comparison. Ideally one would also like to report on the availability and affordability of terrorism risk insurance prior to September 11th, but this information is not available. It is our understanding that terrorism risk insurance was nearly universal and available at little or no charge to the vast majority of policyholders in the United States prior to September 11th. This chapter also presents data on the writing and purchase of terrorism coverage for events not covered by TRIA, also known in the industry as non-certified coverage. Terrorism risk insurance as defined and covered under TRIA is known in the industry as certified coverage, because the law requires that an act be certified by the Secretary of Treasury as an act of terrorism before the Federal backstop becomes effective.1 Non-certified coverage is commercial property and casualty coverage for acts of terrorism that would not meet the conditions for certification as required by TRIA if they occurred. The private market offers non-certified coverage without a Federal backstop, even though there is recent experience with domestic terrorist attacks.2 Developments in the market for non-certified coverage provide a useful point of comparison when evaluating the development of the market for TRIA-eligible coverage. Industry experts generally believed that the risks associated with non-certified terrorism are somewhat different and less severe than those associated with certified terrorism. Domestic terrorist attacks are widely expected to occur with less frequency and severity than foreign terrorist attacks. Nevertheless, data on non-certified coverage provide insights into the terrorism-insurance market in the absence of a Federal subsidy. Prior to September 11th terrorism risk insurance was general in nature and the cost of such coverage was not generally specifically or separately priced by insurers. In general, after September 11th, but before the enactment of TRIA, terrorism risk insurance was specifically or separately priced only for policyholders thought to be at risk of attacks. This terrorism risk coverage generally covered both certified and non-certified risks. Our analysis compares this somewhat more inclusive pre-TRIA terrorism coverage to the terrorism risk insurance written under TRIA. For clarity of exposition we use the term terrorism risk insurance to refer to both overall terrorism coverage in 2002 and TRIA coverage (late 2002 through 2005). Differences in actual coverage should be considered when evaluating the cross-period comparisons provided below.
1 An act of terrorism is defined in part as an act that has been committed by an individual or individuals acting on behalf of any foreign person or foreign interest. 2 Most notable among these is the1995 bombing of the Alfred P. Murrah Federal Building in Oklahoma City, Oklahoma.

- 56 -
The unit of analysis in this chapter is the insurance company or insurance group. An insurance group is the highest level of corporate organization, and may include several insurers. The choice of insurers as the unit of analysis may obscure the composition of insurers’ policies and premiums. The data provide information on overall writing of and charges for terrorism coverage, but no detail about particular policies. We note that this aggregation may obscure vulnerabilities confronting insurers who write commercial property and liability coverage for high-risk sub-populations within their client base.3,4 Ultimately, time and resource constraints prevented the collection of policy-level data from individual insurers. The exact relationship between the cost of terrorism coverage and total insured values covered for terrorism risks at the level of individual policies cannot be examined with precision on the basis of the survey data presented here. Instead, these survey data provide a broad summary of results for all insurers in TRIA-eligible lines, and for sub-groups with characteristics of particular interest, such as size and type of terrorism risk. Annual data from 2002 through 2004, from the first two waves of the insurer survey, are presented graphically. The third and final survey wave collected data on policies written or renewed in the first two months of 2005. Because of the cyclicality of premiums within the calendar year, data from 2005 is not incorporated into the graphical presentation. Instead, we discuss results from the 2005 wave in the text where appropriate.
3 For example, large insurance groups may include some insurers that write standardized coverage for small businesses and other organizations and some insurers that specialize in writing of commercial property and other casualty coverage for trophy buildings. The average cost of terrorism coverage may be very low in the case of the provider of coverage for a large number of small, standardized policies but very high for the company that writes insurance coverage for trophy buildings. 4 Another aggregation issue involves disentangling seasonal from cyclical effects. For approximately 26 percent of insurers, our survey results suggest that policies representing the largest share of their commercial property coverage are written or renewed in January. For roughly 13 percent of insurers, July appears to be the primary policy renewal month. For roughly 8 percent of the surveyed population, policies representing the largest share of premiums in commercial property lines are renewed in October. If the market begins to soften in the third quarter of the year demand conditions facing approximately 30 percent of the surveyed population, i.e., those that are most active between July and December, may be quite different from the conditions confronting those who write or renew primarily in the first half of the year. Both forms of temporal fluctuation will be embedded in data on policies written or renewed during the calendar year. This problem can be mitigated through the use of terrorism cost shares rather than reported premiums to measure the cost of terrorism coverage, as noted in Chapter 3, but some seasonal and cyclical effects may remain.

- 57 -
4.1 Terrorism Risk Insurance Written and the Cost of Terrorism Coverage
This section addresses the overall writing and cost of terrorism risk insurance by insurers. Most of the discussion is focused on aggregated data on property and casualty lines excluding workers’ compensation. Because state regulations forbid the exclusion of terrorism coverage from workers’ compensation policies, terrorism coverage is included in nearly all workers’ compensation insurance and generally does not reflect a choice on the part of either the insurer or the policyholder. We address terrorism risk insurance in the workers’ compensation line later in this chapter. We note two points at the outset. First, the survey data refer explicitly to policies written or renewed in a given calendar year, rather than those that were in effect during most of the calendar year. As such, results from 2002 are predominately pre-TRIA results, because TRIA was passed in late November of that year. Results from 2003 onward are post-TRIA results; they characterize policies written or renewed during the course of the 2003 calendar year. Second, the data are weighted to represent the population of insurers covering TRIA-eligible lines. We therefore obtain a representative view of all insurers in such lines, and examine the behavior across insurers.5 This approach also lends itself to subsequent evaluation of terrorism risk insurance written by insurer asset size class. Availability of Terrorism Risk Insurance The first broad measure of availability we examine is the proportion of insurers writing any terrorism coverage. While insurers are required by TRIA to make available terrorism coverage in eligible lines under the same terms and conditions applied to the rest of their coverage, TRIA does not set the price at which insurers must offer that coverage. Insurers are required to disclose a price for terrorism coverage, which policyholders may decline. In fact, policyholders may elect to decline all terrorism risk coverage except in the case of workers’ compensation. Unless price offers violate state law or regulation, insurers who prefer not to sell terrorism risk insurance can therefore price it at levels unlikely to be accepted by policyholders. Survey data summarized in Figure 4.1 indicate that roughly 73 percent of commercial property and casualty insurers wrote some terrorism coverage in TRIA-eligible commercial property and casualty lines (excluding workers’ compensation) in 2002. That percentage increased to approximately 91 percent in 2003 and stabilized at that level in 2004.6
5 Two alternative weights are policy and premiums weight. Premium-weighted results are difficult to interpret, especially since effective reinsurance prices and portfolio risk exposure change over time. We examined policy-weighted coverage, and found qualitatively similar results. Policy-weighted results effectively represent the behavior of large insurers. 6 Item non-response rates for the data underlying this percentage, and similar ones presented below, are typically less than two percent. Item non-response rates are reported explicitly in instances when the item non-response rate for the eligible population is greater than five percent.

- 58 -
Figure 4.1
Insurers Writing Any Terrorism Risk InsuranceCommercial Property and Casualty Lines
0102030405060708090
100
2002 2003 2004
Perc
ent I
nsur
ers
The average share of all commercial property and casualty and liability insurance policies written with terrorism coverage in TRIA-eligible lines represents a second measure of coverage in the market. The increase in this share since 2002 is evidence of an expansion of terrorism risk coverage. The average share of policies in TRIA-eligible lines with terrorism coverage, shown in Figure 4.2, increased between 2002 and 2004. Insurers, on average, wrote insurance coverage for terrorism in approximately 60 percent of 2002 policies in commercial property and casualty lines covered by TRIA. Terrorism risk coverage was therefore written even prior to the passage of TRIA. After the enactment of TRIA in late 2002, the average percentage of policies with TRIA-eligible coverage increased to approximately 67 percent. While suggestive, this result does not necessarily represent evidence of a TRIA effect. Identifying a TRIA effect requires, at a minimum, disentangling its effect from that of the natural underwriting cycle described in Chapter 2.
Figure 4.2
Policies Written with Terrorism Risk CoverageRelative to Total Policies Written
0102030405060708090
100
2002 2003 2004
Ave
arge
Per
cent

- 59 -
Between 2003 and 2004 the TRIA deductible increased from 7 percent to 10 percent of prior year direct written premium. Despite this reduction in the Federal backstop, the share of policies including terrorism risk coverage remained stable over the period. The finding that insurers included terrorism coverage in 60 percent of their 2002 policies on average runs counter to anecdotal information reported in the marketplace at the time. Shortages in the supply of terrorism coverage were a matter of concern. The decision of state regulators to allow terrorism exclusions in order to preserve the capacity of insurers increased this concern. We do not have exact figures on the availability of terrorism risk insurance prior to September 11th, but it is generally assumed that the vast majority of commercial property and casualty insurance policies at that time included terrorism coverage either explicitly or implicitly (i.e. terrorism risk insurance was not excluded). Survey results suggest that many insurers, and particularly small insurers with little or no exposure to terrorism risk, continued to write terrorism coverage for no charge in 2002. The widespread inclusion of such coverage in 2002 suggests that the supply of terrorism risk insurance was not restricted by many insurers. The insurer survey collected data on policies written or renewed in 2002. Many policies in effect during 2002 were written in 2001 when terrorism exclusions were not permitted. It is unlikely that this affects our results. Respondents were specifically asked to report on policies written and renewed in 2002 rather than on policies in effect during 2002 so as to not overstate the share of insurers’ policies written after September 11th that included terrorism coverage. A third measure of the extent of terrorism risk coverage is the ratio of premiums from policies with terrorism risk coverage to total premiums in TRIA-eligible lines. When compared with the number of policies that included terrorism coverage relative to the total number of policies, this ratio of dollar values assigns more importance to higher-priced terrorism coverage. Over the period examined, premium-weighted shares of total policies that are written with terrorism risk insurance coverage look similar to the corresponding policy-weighted shares, though increases in the dollar-weighted ratio over time are slightly more pronounced. Premiums from policies with terrorism coverage represented 59 percent of total premiums in 2002, and 68 percent in 2003 and 2004. The data from the first two months of 2005 are consistent with 2003 and 2004, and suggest continued writing of terrorism risk insurance. More than 97 percent of insurers wrote policies with coverage for terrorism risk insurance, and slightly more than 70 percent of policies continued coverage of terrorism risks. Data from the first two months of 2005 data therefore suggest that coverage continued to expand, despite further increases in the TRIA deductible. Figure 4.3 shows the distribution of insurers’ policies written with terrorism risk coverage between 2002 and 2004. The figure shows the share of insurers that included terrorism coverage in either all or none of their policies, as well as the intermediate cases: the percentage of insurers who included terrorism coverage in less than 10 percent of their policies, 10 to 50 percent, 50 to 90 percent, or 90 to 100 percent of their policies in TRIA-eligible lines.

- 60 -
Figure 4.3
Policies Written with Terrorism Risk CoverageDistribution of Insurers by Percent Written with Terrorism
0
10
20
30
40
50
zero LE 10 10 to 50 50 to 90 90 to 100 100Range of Percent Written with Terrorism Risk Coverage
Perc
ent I
nsur
ers 2002 2003 2004
The figure reveals substantial heterogeneity among commercial property and casualty insurers with respect to the terrorism risk coverage actually written. This heterogeneity may differentiate insurers who serve relatively low-risk clients from those insurers for whom it is more problematic to write terrorism coverage because their clients’ exposures are substantial. It is particularly noteworthy that roughly 40 percent of surveyed insurers reported including terrorism coverage in every policy; for these insurers the ratio of policies with terrorism coverage to the total number of policies is one. This proportion of insurers is quite stable over time, declining only slightly between 2002 and 2004. The fact that a substantial proportion of insurers included terrorism insurance in all of their policies might be interpreted as evidence that some insurers are able to insure such risks despite the events of September 11th. (However the inclusion of terrorism risk insurance coverage in these policies does not necessarily indicate that the coverage is not limited.) On the other hand, the data suggest a dramatic decline between 2002 and 2003 in the percentage of insurers who always excluded terrorism coverage. These insurers report a value of zero when asked the number of policies that include terrorism risk coverage. The percentage of insurers who report providing terrorism coverage relatively infrequently, in less than 10 percent of their policies, increased steadily from a value of about 6 percent in 2002 to almost 17 percent in 2004. The percentage of insurers providing coverage in 10 to 50 percent of their policies doubled in 2003, but then returned to the year-earlier value in 2004; these patterns may reflect changes in the composition of the client base of some insurers. Figure 4.4 provides additional detail on the insurers who did and did not write coverage in 2002. The figure compares the average percentage of policies written with terrorism risk insurance in 2003 and 2004 with the average percentage of policies written with terrorism risk coverage in 2002. Among insurers who wrote terrorism insurance in 2002 and continued to write terrorism coverage in later years, roughly 75 percent of policies written in 2003 and 2004 included terrorism risk coverage. In contrast, among new entrants to the terrorism risk insurance market, roughly 50 percent of policies written included terrorism coverage.

- 61 -
Figure 4.4
Policies Written with Terrorism Risk CoverageNew Entrants vs. Established Suppliers
0102030405060708090
100
Insurers that Did Not Write Terrorism RiskCoverage in 2002
Insurers that Wrote Terrorism RiskCoverage in 2002
Ave
rage
Per
cent 2002 2003 2004
Cost of Terrorism Risk Insurance Next we describe the average costs for terrorism risk insurance derived from the insurer surveys. The basic unit of analysis in this section is total premiums for terrorism coverage as a share of total premiums for policies with terrorism coverage included. We generally refer to this concept as the terrorism cost share, and interpret it as the relative price or relative cost of terrorism coverage. This cost-share ratio is used to assess the affordability of terrorism coverage under TRIA. We prefer this measure to a simple dollar value of terrorism coverage because the ratio of terrorism coverage to total coverage provides some control for differences in average risk and insured value among different insurers. Furthermore commercial property and casualty insurance prices are known to be cyclical, and normalization by total premiums helps to control for these cyclical effects. Figure 4.5 shows that, averaging over all insurers who provided terrorism coverage in a given year, terrorism risk insurance cost shares increased over time despite TRIA.7 Several factors contributed to this pattern. Chief among these, as discussed and documented below is a decline in the percentage of insurers writing terrorism risk insurance coverage at no explicit charge.
7 Data on terrorism risk insurance premiums were not reported by some survey respondents. Therefore terrorism cost shares cannot be calculated for 12 percent of 2002 values, 18 percent of 2003 values, and 8 percent of 2004 values. The majority of these (47, 64 and 49 percent in waves 1, 2 and 3 respectively) are insurers with less than $1 billion in total assets. These item non-response rates apply to all terrorism cost share statistics reported in this chapter.

- 62 -
Figure 4.5
Average Terrorism Cost SharesAverage Premium for Terrorism Coverage
Relative to Total Premium for Policies with Terrorism Coverage
0.0
1.0
2.0
3.0
4.0
5.0
2002 2003 2004
Ave
rage
Per
cent
Cyclical declines in the overall cost of policies apart from the cost of terrorism coverage may also contribute to the increases in average terrorism risk shares shown above. Some industry reports have suggested that this has occurred recently. TRIA was designed to provide insurers with time to adjust their pricing policies in the face of increased terrorism risks. In this sense these cost share increases are to be expected. In the case of terrorism risk insurance coverage, standardized loss cost estimates developed by the Insurance Services Office, Inc. (ISO) in 2003 are believed to have contributed to the determination and stabilization of terrorism insurance rates, once the rate filings backed by these loss cost estimates were reviewed and approved by state regulators.8 These loss cost estimates are defined as a fixed percentage of property values, and it is known that property values in many parts of the country increased rapidly during the period examined. Increased awareness of the threat of terrorism is also likely to have affected terrorism risk insurance coverage costs in non-standardized, negotiated terrorism risk insurance for large properties. Finally, increases in average terrorism cost shares may be due in part to a demonstration effect: TRIA may have encouraged some insurers who otherwise might have continued to write coverage at no cost to adopt a positive charge for terrorism risk insurance coverage instead. That is, the reporting requirement may have encouraged insurers who otherwise would have charged for terrorism risk insurance coverage implicitly in the overall cost of coverage to adopt an explicit price in 2003. Based on our data we are unable to differentiate between these combined
8 Erwann Michel-Kerjan and Burkhard Pedell, “Terrorism Risk Coverage in the Post-9/11 Era: A Comparison of New Public-Private Partnerships in France, Germany, and the U.S.” The Geneva Papers, 2005, 30, pp. 144-170. The authors report that these negotiated loss cost estimates were defined in terms of zip codes, encompassing three risk “tiers.” Specified zip codes within Chicago, New York City, San Francisco and Washington, D.C. are assigned to the highest tier; maximum loss costs within this tier were $0.03 per $100 property value. For the second tier, consisting of areas within Boston, Houston, Los Angeles, Philadelphia and Seattle as well as portions of the cities listed in the preceding sentence, loss costs were specified as $0.018 per $100 of property value. Loss costs for the balance of the country were set at $0.001 per $100 of property value. The authors assert that prices for terrorism coverage began to come down once standardized loss cost estimates were approved by NAIC.

- 63 -
effects: a general trend towards adopting higher prices for terrorism coverage in the post-September 11th era, and the countervailing effects of TRIA. Estimates of total terrorism risk insurance coverage premiums collected (in TRIA-eligible lines) provide another useful perspective on the growth in terrorism coverage during the past three years. Using the TRIA survey data in combination with publicly-available information from the NAIC, we estimate that total terrorism risk insurance premiums in TRIA-eligible lines, apart from workers’ compensation, were roughly $700 million in 2002. TRIA premiums, again excluding workers’ compensation, were approximately $2.3 billion in 2003 and $2.7 billion in 2004. These estimates of total terrorism risk insurance premiums are obtained by using TRIA survey data to calculate the annual ratio of total terrorism risk insurance premiums to total premiums in TRIA-eligible lines. (This differs from the cost share reported above because the cost share is the share of premiums associated with terrorism only on policies that include terrorism coverage.) These survey-based estimates, which are roughly 0.5 percent in 2002, 1.4 percent in 2003, and 1.6 percent in 2004, are applied to published data from the NAIC9 reporting total premiums in TRIA-eligible lines to obtain the estimates given here. These aggregate results mask important differences between priced coverage and coverage provided at no charge. A major factor contributing to the increase in average terrorism risk insurance cost shares shown above is a substantial decline, from over 75 percent of all insurers in 2002 to roughly 45 percent in 2004, in the percentage of insurers who provided terrorism coverage at no charge. This can be seen in Figure 4.6, which also shows increases in the percentage of insurers charging a positive terrorism risk insurance cost share of less than 2 percent. The percentage of insurers reporting average terrorism risk insurance cost shares within this range increased from 10 percent in 2002 to roughly 35 percent in 2004. The percentage of insurers reporting average cost shares over 2 percent increased from less than 15 percent in 2002 to nearly 20 percent in 2003 and 2004. Thus a major component of the increase in the terrorism cost share is likely the movement from unpriced to priced policies with terrorism coverage. The persistence of insurers writing terrorism coverage for no charge is unexpected in view of the widespread concern about the availability and costs of terrorism risk insurance coverage that motivated passage of TRIA. Even the 2005 data suggest that 35 percent of insurers charged nothing for terrorism coverage.
9 The 2004 estimates of total premiums in TRIA-eligible lines are obtained by applying third-quarter 2003 to third-quarter 2004 annual growth rates to the NAIC total for 2003.

- 64 -
Figure 4.6
Average Terrorism Cost SharesDistribution of Insurers By Average Terrorism Cost Share
0
20
40
60
80
100
zero LE 2 Percent 2 to 100 Percent
Range of Insurers' Average Terrorism Cost Shares
Perc
ent I
nsur
ers
2002 2003 2004
The large percentage of insurers writing terrorism risk insurance coverage at no charge parallels, and is similar in magnitude to, the large and relatively stable percentage of insurers who include terrorism coverage in all of their policies. In particular, these results suggest that roughly 40 percent of insurers in the surveyed population perceive their client’s exposure to terrorism risk to be small. Much of the increase in average cost shares, especially between 2002 and 2003, is due to the reduction in free certified coverage. In Figure 4.7 we compare average cost shares among insurers providing terrorism risk insurance coverage at a non-zero cost. In this sub-sample, average non-zero terrorism cost shares declined from approximately 3.7 percent of total premiums in 2002 to approximately 2.4 percent in 2003. Average terrorism cost shares among this group of insurers returned to approximately 3 percent in 2004. For the first two months of 2005 this average cost share appears to have increased to approximately 3.5 percent. These 2005 results, however, are not comparable to the annual measures for 2002 through 2004, for reasons cited above.
Figure 4.7
Average Terrorism Cost Shares Among Insurers Reporting Positive Charges
0.0
1.0
2.0
3.0
4.0
5.0
2002 2003 2004
Ave
rage
Per
cent

- 65 -
The interaction between insurers’ pricing and willingness to write terrorism risk insurance is explored in Table 4.1. This table shows the estimated percentage of insurers in each category that report average terrorism cost shares in one of three categories: zero, positive but less than 2 percent of total premiums, and greater than 2 percent of total premiums. Insurers reporting that they include terrorism risk insurance coverage in all their policies are also likely to write terrorism risk insurance coverage at no cost. In 2002, for example, 94 percent of insurers who included terrorism risk insurance coverage in all of their commercial property and liability policies reported that they did not charge for terrorism risk insurance coverage. This percentage falls to roughly 80 percent in 2003 and 2004. In 2002, 64 percent of insurers that included terrorism risk insurance coverage in half to 99 percent of their policies did so at no cost; these percentages decline to 22 percent in 2003 and 5 percent in 2005. Among insurers that included terrorism risk insurance coverage in less than half of their policies 37 percent reported that they wrote terrorism risk insurance coverage at no cost in 2002; this percentage declined to 4 percent in 2003, but increased to 12 percent in 2004.

- 66 -
Table 4.1 Cost Share by Share of Coverage Including Terrorism
Positive Positive Cost Share Cost Share
Zero Cost Less or Equal Greater thenTerrorism Coverage Written Share to 2 percent 2 percent Total
Less Than 50 percent 37.2 17.7 45.1 100.0
Between 50 and 99 percent 63.9 18.3 17.8 100.0
100 percent 94.2 5.8 0.0 100.0
Positive Positive Cost Share Cost Share
Zero Cost Less or Equal Greater thenTerrorism Coverage Written Share to 2 percent 2 percent Total
Less Than 50 percent 3.5 28.0 68.6 100.0
Between 50 and 99 percent 22.4 65.8 11.8 100.0
100 percent 80.4 17.4 2.2 100.0
Positive Positive Cost Share Cost Share
Zero Cost Less or Equal Greater thenTerrorism Coverage Written Share to 2 percent 2 percent Total
Less Than 50 percent 11.7 29.8 58.5 100.0
Between 50 and 99 percent 4.9 81.4 13.7 100.0
100 percent 82.3 16.3 1.5 100.0
2002
Cost Share
2004
Cost Share
Cost Share
2003

- 67 -
These data suggest that the immediate response by some insurers to the events of September11th may have been to exclude terrorism risk insurance coverage for risky policyholders without charging lower-risk policyholders for terrorism risk insurance coverage. However the proportion of insurers writing terrorism risk insurance coverage for less than 100 percent of policyholders and who also wrote the coverage at no cost declined significantly in 2003 and 2004. This result may reflect greater use of pricing to differentiate between policyholder types. Insurers who included terrorism risk insurance coverage in less than half of their policies were most likely to have average terrorism cost shares greater than 2 percent. Insurers who included terrorism risk insurance coverage in 50 to 99 percent of their policies were most likely to have a positive cost share of less than 2 percent in 2003 and 2004, although they were most likely to include free terrorism risk coverage in 2002. As discussed above, insurers reporting that they write terrorism risk insurance coverage for 100 percent of policyholders are most likely to write the coverage at no cost. In short, the survey data suggest that insurers’ propensity to write terrorism risk coverage, as measured by the share of total policies written that included terrorism coverage, was inversely related to their average terrorism cost shares. Among insurers with relatively high average costs for terrorism risk insurance, the average percentage of policies written with terrorism risk insurance is relatively low, presumably because the policyholders served by these insurers decline the mandatory offer. This strongly suggests that insurers are using pricing to differentiate between risk-types and to manage their exposure to risk.

- 68 -
4.2 Terrorism Risk Insurance and Terrorism Cost Share by Insurer Size This section reviews the percentage of policies written with terrorism risk insurance and terrorism risk insurance cost shares within three insurer asset size classes. Throughout this section we compare and contrast results from insurers with less than $1 billion in assets, insurers with $1-10 billion in assets, and insurers with more than $10 billion in assets. This comparison is motivated by the general notion that in the absence of the Federal backstop large insurers may have a competitive advantage in the writing of terrorism risk insurance and coverage for other large, but infrequent, events such as natural catastrophes10 while, under TRIA, larger firms generally have larger TRIA deductibles than smaller firms. We expect that insurers of different sizes will serve different segments of the overall commercial property and casualty insurance market. Asset size classes are intended to isolate the relatively small number of large insurers who account for a large share of economic activity when measured in value terms, smaller insurers who tend to serve smaller regional markets and lower-risk clients, and more average or typical insurers who may serve both markets. To make these ideas more concrete it is helpful to note that TRIA survey responses suggest insurers with less than $1 billion in assets account for 55 percent of all insurers, but only 10 percent of premiums in TRIA-eligible lines. Insurers with $1-10 billion in assets account for about 32 percent of all insurers and about 20 percent of premiums in TRIA-eligible lines. In contrast, large insurers with more than $10 billion in assets account for more than 70 percent of total premiums in TRIA-eligible lines although they represent only 14 percent of all insurers. Asset size classes are also correlated with other characteristics that provide insight into the types of coverage likely to be offered and the diversity of markets served. Large insurers are more likely to serve national and global markets, and small insurers are more likely to serve specialized or regional markets. For example, among insurers who operate from a single location roughly 80 percent report assets of less than $1 billion. In contrast, among insurers with multiple locations in the U.S. more than 50 percent report assets of $1 to $10 billion and roughly 20 percent report assets over $10 billion. Among insurers with multiple national and global locations, 25 to30 percent report assets of $1 to $10 billion and more than 60 percent report assets greater than $10 billion. The average percentage of terrorism risk insurance policies written within asset size classes is shown below in Figure 4.8.11 Increases in the average ratio of policies with terrorism risk insurance coverage to the total number of policies are most evident among insurers with $1-10 billion in assets. The increase in the percentage of terrorism risk insurance written among medium-sized insurers may be related to the structure of TRIA. To the extent that large insurers hold a more diversified portfolio of insurance policies than smaller insurers, large insurers’ deductibles could be a larger share of their total liability than the corresponding share among small and medium insurers. Large well-diversified insurers may have TRIA deductibles that are
10 Anne Gron, “Insurer Demand for Catastrophe Reinsurance,” The Financing of Catastrophe Risk, Kenneth Froot (ed), Chicago: University of Chicago Press, 1999, pp. 23-49. 11 Data on the total assets of captive insurers are not available. Therefore data from captive insurers cannot be included in the analysis by asset size class. Captives represent approximately 7 percent of survey respondents for 2002, 2003 and 2004, and less than 5 percent of survey respondents in 2005.

- 69 -
sufficiently large to make the dollar value of their benefits from the Federal backstop provided by TRIA relatively small. Some insurance industry representatives have argued that the structure of the TRIA deductible effectively provides smaller and medium-sized insurers with a relative advantage in the sale of terrorism risk insurance coverage under TRIA. While only descriptive, survey data showing growth in the percentage of terrorism risk insurance coverage written by medium-sized insurers are consistent with this argument. The behavior of small insurers is not consistent with this argument.
Figure 4.8 Percent of Policies Written with Terrorism Risk Coverage
By Total Insurer Assets
0
20
40
60
80
100
Under $1 billion $1 to 10 billion Over $10 billionTotal Assets
Ave
rage
Per
cent 2002 2003 2004
The averages above conceal substantial variability in the percentage of policies written with terrorism risk insurance coverage across asset size class. Overall, more than 40 percent of insurers provided terrorism risk insurance coverage in all their policies throughout the period 2002-2004, and a declining percentage provided no terrorism coverage. Across asset size classifications, the data reveal different changes in the average share of policies with terrorism risk insurance. The top panel of Figure 4.9 reports on the percentage of smaller insurers who write terrorism risk insurance by share of total policies, ranging from zero to 100 percent in six intervals, the second panel provides the same information on medium-sized insurers, and the bottom panel presents parallel information on large insurers. Comparing the figures, we find that small insurers are the most likely to write coverage in all of their policies; about 48 percent of small insurers wrote terrorism coverage in all their policies between 2002 and 2004 (2005 results are consistent). A relatively small percentage of small insurers wrote no terrorism risk insurance coverage after 2002, but the decline in the percentage of insurers who included terrorism risk insurance coverage from all of their policies is mirrored by a parallel increase in the percentage that wrote terrorism risk insurance coverage in less than 10 percent of their policies. Among the three asset size classes, small insurers are most likely to write terrorism risk insurance coverage in some, but less than 10 percent of their policies overall.

- 70 -
Figure 4.9 Average Percent of Policies with Terrorism Risk Coverage
Distribution for Insurers with less than $1 Billion Assets
01020304050
Zero LE 10 10 to 50 50 to 90 90 to 100 100
Percent of Policies Written with Terrorism Risk Coverage
Perc
ent I
nsur
ers
2002 2003 2004
Distribution for Insurers with $1 Billion to $10 Billion Assets
01020304050
Zero LE 10 10 to 50 50 to 90 90 to 100 100
Percent of Policies Written with Terrorism Risk Coverage
Perc
ent I
nsur
ers
2002 2003 2004
Distribution of Insurers with over $10 Billion Assets
01020304050
Zero LE 10 10 to 50 50 to 90 90 to 100 100
Percent of Policies Written with Terrorism Risk Coverage
Perc
ent I
nsur
ers
2002 2003 2004
Note: A missing bar indicates that no survey respondents provided an answer within the specified range. Compared with small insurers, a smaller but still substantial and stable percentage of insurers in the $1-10 billion asset size class wrote terrorism risk insurance coverage for all their policyholders throughout the period 2002-2004. Compared with small insurers, medium-sized insurers are more likely to include terrorism risk insurance coverage in 50-99 percent of their policies.

- 71 -
Among large insurers, in clear contrast with insurers in the smaller asset size classes, we see a decline over time in the percentage of insurers who write TRIA-eligible coverage on all of their policies. There is also a parallel decline in the percentage of insurers who do not write TRIA-eligible coverage. Relative to the two other size categories, a notably larger percentage of large insurers provided terrorism risk insurance coverage in 50 to 99 percent of their policies. The Federal backstop under TRIA may contribute to the willingness of approximately 20 percent of large insurers in the surveyed population to include terrorism risk insurance in all of their policies in 2004, but in view of the role of total premiums in the determination of deductibles it seems as likely that these insurers do not believe their exposure to terrorism risk is substantial. Next we provide more detail on terrorism cost share and the distribution of terrorism risk insurance cost shares by company size. The move away from unpriced terrorism risk insurance to positive terrorism cost shares subsequent to the passage of TRIA suggests that some insurers are only slowly adapting to the post-September 11th view of terrorism risk. As discussed earlier, the large drop between 2002 and 2003 in the percentage of insurers writing unpriced terrorism risk insurance may be attributable in large part to the make available provision, which requires that the insurer provide an explicitly-documented price for terrorism risk insurance written on terms and conditions comparable to other coverage included in the policy. Figure 4.10 reports on the cost of terrorism risk coverage calculated separately within asset size classes. The largest increases in terrorism risk insurance cost shares are reported by smaller insurers, whose average charges for coverage increased from less than one percent in 2002 to approximately two percent of premiums in 2004. Insurers with $1 to 10 billion in assets reported smaller increases in average terrorism risk insurance cost shares, from just under 1 percent in 2002 to almost 1.7 percent in 2004. These results are contrary to the generally reported trend: an overall decrease in the cost of coverage that is not free and an increase in availability since the enactment of TRIA. This difference is likely explained by the large market share of large insurers: declines in average terrorism cost shares are reported by this group. Our estimates suggest that average terrorism risk insurance cost shares charged by large insurers declined between 2002 and 2004, from nearly 2 percent to roughly 1.6 percent. For the small and large insurers, these overall patterns continue in data from the first two months of 2005.
Figure 4.10
Average Terrorism Cost Shares Terrorism Premium Relative to Total Premium, by Total Insurer Assets
0.0
1.0
2.0
3.0
4.0
5.0
Under $1 billion $1 to 10 billion Over $10 billion
Total Assets
Terro
rism
Cos
t Sha
re
2002 2003 2004

- 72 -
Figure 4.11 shows the range of cost shares reported by small, medium and large insurers. Examination of the results suggests that larger insurers were generally less likely than the small and medium asset size class insurers to offer terrorism risk insurance coverage at no cost in 2002.
Figure 4.11 Distribution of Terrorism Risk Insurance Cost Shares
Distribution for Insurers with less than $1 Billion Assets
0
20
40
60
80
100
Zero LE 2 Percent 2 to 100 PercentTerrorism Premium relative to Total Premium
Perc
ent I
nsur
ers
2002 2003 2004
Distribution for Insurers with $1 Billion to $10 Billion Assets
0
20
40
60
80
100
Zero LE 2 Percent 2 to 100 PercentTerrorism Premium relative to Total Premium
Perc
ent I
nsur
ers
2002 2003 2004
Distribution for Insurers with over $10 Billion Assets
0
20
40
60
80
100
Zero LE 2 Percent 2 to 100 PercentTerrorism Premium relative to Total Premium
Perc
ent I
nsur
ers
2002 2003 2004
Note: A missing bar indicates that no survey respondents provided an answer within the specified range.

- 73 -
The top panel of Figure 4.11 shows that insurers in the less than $1 billion asset class size continue to write terrorism risk insurance coverage for no charge on more than 55 percent of their terrorism risk insurance policies in 2003 and 2004. The middle panel of Figure 4.11 shows the percentage of insurers in the $1 to 10 billion asset size class who shifted out of zero cost share coverage and into cost share ranges of 0-2 percent and above is more pronounced than it is for small insurers. The bottom panel shows a similar 40 percent decrease, from nearly 60 percent in 2002 to 20 percent in 2003, in the proportion of large insurers who wrote terrorism coverage at no charge. By 2004, although Figure 4.10 suggests a slight decrease in average cost share charged by large insurers, the cost share distribution in Figure 4.11 shows a continued trend towards priced coverage. More than half of large insurers reported average terrorism cost shares greater than zero but less than 2 percent in 2004, while roughly 30 percent reported average terrorism cost shares over 2 percent. Over time, some of these terrorism cost share increases are probably attributable to increasing TRIA deductibles. The higher percentage of larger average terrorism cost shares reported by large insurers may be attributable, as well, to the fact that large insurers are more likely to write insurance coverage for large, high-risk policyholders. The reasons why large insurers are more likely to write terrorism risk coverage for large policyholders include the following. First, large insurers typically have the capacity to cover large exposures and high-risk locations, as well as the technical capabilities required to underwrite terrorism risks. Second, large insurers typically hold the diversity of product lines and the diversity of covered properties’ locations needed to insure against terrorist attacks.12 Third, high-risk clients whose total insured values are substantial are more likely to be sensitive to the threat to their own liquidity that could result from a terrorist attacks affecting multiple insurance lines and locations. Therefore large insurers whose capacity is considered secure may command a higher price for coverage of catastrophes and terrorist events.13
12 Neil A. Doherty, Integrated Risk Management: Techniques and Strategies for Reducing Risk, New York: McGraw-Hill, 2000. 13 Gron, “Insurer Demand,” and Kenneth A. Froot, “Risk Management, Capital Budgeting, and Capital Structure Policy for Insurers and Reinsurers,” NBER Working Paper 10184, December 2003.
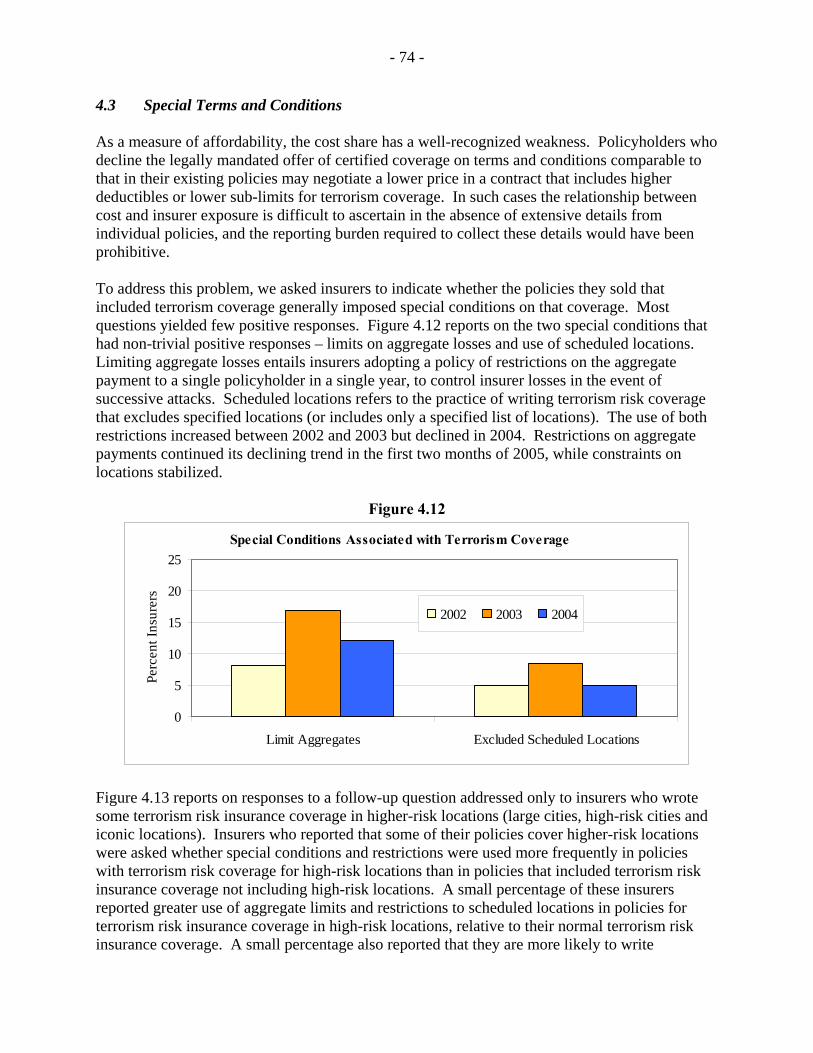
- 74 -
4.3 Special Terms and Conditions As a measure of affordability, the cost share has a well-recognized weakness. Policyholders who decline the legally mandated offer of certified coverage on terms and conditions comparable to that in their existing policies may negotiate a lower price in a contract that includes higher deductibles or lower sub-limits for terrorism coverage. In such cases the relationship between cost and insurer exposure is difficult to ascertain in the absence of extensive details from individual policies, and the reporting burden required to collect these details would have been prohibitive. To address this problem, we asked insurers to indicate whether the policies they sold that included terrorism coverage generally imposed special conditions on that coverage. Most questions yielded few positive responses. Figure 4.12 reports on the two special conditions that had non-trivial positive responses – limits on aggregate losses and use of scheduled locations. Limiting aggregate losses entails insurers adopting a policy of restrictions on the aggregate payment to a single policyholder in a single year, to control insurer losses in the event of successive attacks. Scheduled locations refers to the practice of writing terrorism risk coverage that excludes specified locations (or includes only a specified list of locations). The use of both restrictions increased between 2002 and 2003 but declined in 2004. Restrictions on aggregate payments continued its declining trend in the first two months of 2005, while constraints on locations stabilized.
Figure 4.12
Special Conditions Associated with Terrorism Coverage
0
5
10
15
20
25
Limit Aggregates Excluded Scheduled Locations
Perc
ent I
nsur
ers
2002 2003 2004
Figure 4.13 reports on responses to a follow-up question addressed only to insurers who wrote some terrorism risk insurance coverage in higher-risk locations (large cities, high-risk cities and iconic locations). Insurers who reported that some of their policies cover higher-risk locations were asked whether special conditions and restrictions were used more frequently in policies with terrorism risk coverage for high-risk locations than in policies that included terrorism risk insurance coverage not including high-risk locations. A small percentage of these insurers reported greater use of aggregate limits and restrictions to scheduled locations in policies for terrorism risk insurance coverage in high-risk locations, relative to their normal terrorism risk insurance coverage. A small percentage also reported that they are more likely to write

- 75 -
standalone terrorism coverage for high-risk areas. The proportion of insurers reporting that they are more likely to impose conditions in high-risk locations as opposed to locations that are not considered to be high risk fell slightly between 2003 and 2004.
Figure 4.13
Special Conditions Associated with Terrorism Coverage Imposed More Frequently for High-Risk Locations
0
5
10
15
20
25
Limit Aggregates Excluded Scheduled Locations
Perc
ent I
nsur
ers
2003 2004
Special Conditions for 2006 In the last wave of the TRIA surveys insurers were asked a small number of additional questions about their policies written or renewed in January and February of 2005. Although annual policies written or renewed within the first two months of 2005 do not extend far into 2006, responses to these questions nonetheless provide some insight into insurers’ willingness to write terrorism risk insurance coverage going forward.14 The first question asked whether policies written or renewed in the first two months of 2005 incorporate coverage for international terrorism in 2006 that is roughly similar to their 2005 certified terrorism risk insurance coverage, when those policies include terrorism risk coverage in 2005. Our estimates suggest that roughly half of the insurer population answered this question in the affirmative. Thus half of insurers report that they are not providing terrorism coverage in 2005 that is roughly similar to TRIA coverage. A follow-up question was asked of the 50 percent of insurers who indicated that they do not write international terrorism risk insurance coverage for 2006 that is broadly comparable to TRIA coverage in policies that included TRIA coverage in 2005. Specifically, they were asked to indicate whether their policies that included certified terrorism risk insurance coverage in 2005:
14 These questions ask about policies actually written during the first two months of 2005, rather than language drafted for policies to be written in the future, to minimize the speculative nature of the responses.

- 76 -
(a) excluded international terrorism coverage unconditionally in 2006, (b) incorporated contingent exclusions for international terrorism coverage in 2006, or (c) did not exclude international terrorism coverage for 2006, but the international terrorism
risk insurance coverage written for 2006 is not comparable to the certified terrorism risk coverage written for 2005.
Figure 4.14 shows the results. Among respondents writing coverage that does not include international terrorism coverage in 2006 under terms and conditions comparable to that written for certified coverage in 2005, our estimates suggest that roughly 55 percent of the insurer population that writes certified coverage in 2005 nonetheless exclude international terrorism risk insurance coverage in 2006. Twenty-two percent of this group uses a contingent exclusion for terrorism risk insurance coverage once the policy period runs into 2006. The remaining 24 percent do not exclude international terrorism coverage. The last group of respondents is writing international terrorism coverage for 2006 that is in some way not similar to the certified terrorism risk insurance that they are writing for 2005.
Figure 4.14
Non-Comparable Terrorism Coverage After TRIA ExpiresWhen Terrorism Risk Insurance Coverage is Written for 2005
0
20
40
60
80
100
Do Policies Written in January and February of 2005 Exclude International Terrorism Coverage after TRIA Expires on December 31, 2005?
Perc
ent I
nsur
ers Terrorism Excluded
Contingent Exclusion for TerroismIncluded But Not Comparable
When asked to compare the total premiums for policies with certified terrorism risk insurance coverage in 2005 that also included international terrorism coverage in 2006, on the one hand, with those that included certified terrorism risk insurance coverage in 2005 but excluded international terrorism coverage in 2006 on the other, most insurers replied that there was no increase in cost associated with the international terrorism coverage in 2006. Of course, the amount of 2006 exposure spanned by policies written or renewed in the first part of the year is not large, and therefore it seems quite possible that these cost shares will increase during the course of the year, as the proportion of annual exposure attributable to coverage in 2006 increases.

- 77 -
4.4 Nuclear, Biological, Chemical and Radiological (NBCR) Terrorism Insurance TRIA’s definition of insured loss, under the Program, does not exclude NBCR losses under a commercial property and casualty insurance policy, nor does the TRIA definition of an act of terrorism exclude these risks. If an insurer included coverage for these risks in a commercial property and casualty insurance policy and otherwise meets Program conditions for payment, the insurer would receive Federal payment for such losses. An insurer may exclude coverage for NBCR losses if 1) such policy exclusion is also applied to losses arising from events other than acts of terrorism and 2) it is permitted by applicable state law.15 In general, insurers who write NBCR coverage have expressed concern about their exposure in the event of an act of terrorism because the geographical range of damage can be extensive. They have expressed similar concerns with respect to the duration of damage over time. On average, 35 percent of insurers in TRIA-eligible lines report that NBCR terrorism risks were included in some of their policies written in 2003 and 2004, not including workers’ compensation policies.16 The stability of this figure conceals a distinct shift in the size of insurers writing NBCR coverage: the percentage of insurers with less than $1 billion in assets who provided any terrorism risk insurance coverage for NBCR decreased by roughly six percent between 2003 and 2004. This decline was offset by an increase of 12 percent in the number of insurers with $1 to 10 billion in assets who wrote any TRIA-eligible NBCR coverage, and an increase of 17 percent among insurers with more than $10 billion in assets. In all asset size classes, the percentage of insurers writing some NBCR coverage during the first two months of 2005 was higher than the annual values reported for 2003 and 2004. The 2005 survey results indicate that roughly 43 percent of insurers wrote or renewed policies with some NBCR coverage. Seasonal effects may be incorporated in these results and consequently they are not directly comparable to the annual values from 2003 and 2004.
Figure 4.15
Insurers Providing Any NBCR Terrorism Risk InsuranceOverall and by Total Insurer Assets
0
20
40
60
80
100
Overall Under $1 billion $1 to 10 billion Over $10 billion
Perc
ent I
nsur
ers
2003 2004
Note: Responses to this question for 2003 are missing for 16 percent of survey respondents; the item non- response rate for 2004 is 9 percent. 15 U.S. Treasury, Terrorism Risk Insurance Program Office, Interpretive Letters, “Make Available; Property and Casualty Insurance (Nuclear, Biological & Chemical),” March 24, 2004. 16 Item non-response rates over five percent are reported explicitly throughout the chapter.

- 78 -
4.5 Non-Certified Coverage The non-certified terrorism insurance market is relevant to our evaluation precisely because it is not eligible for TRIA coverage. Although the risk characteristics of TRIA-eligible insurance are generally thought to be different following the events of September 11th,17 the non-certified market offers some insight into the development of a terrorism risk insurance market. We start with a description of coverage of non-certified terrorism risk. Data show that about 38 percent of insurers write non-certified terrorism insurance. This overall provision rate masks substantial heterogeneity across insurer asset size class, however. Among small insurers (less than $1 billion in assets), only about 15 percent provide non-certified coverage. Among the next size class of insurers ($1-10 billion in assets), roughly 50 percent write some non-certified coverage. A much larger percentage of large insurers (with assets over $10 billion) wrote non-certified terrorism coverage during 2003 and 2004, however. Over time, we find a stable share of smaller insurers providing non-certified coverage, but and increasing share of large insurers providing such coverage. The proportion of large insurers that provided non-certified coverage increased by about 30 percent between 2003 and 2004: from 65 percent to 85 percent.
Figure 4.16
Insurers Providing Any Non-Certified Terrorism Risk InsuranceOverall and by Total Insurer Assets
0
20
40
60
80
100
Overall Under $1 billion $1 to $10 billion Over $10 billion
Perc
ent I
nsur
ers
2003 2004
Note: Responses to this question for 2003 are missing for 17 percent of survey respondents; the item non- response rate for 2004 is 8 percent. Prior to the implementation of TRIA, our data show that about 70 percent of insurers wrote insurance for (any) terrorism risk. It is useful to recall that during this period, there was no distinction between types of terrorism coverage. The introduction of TRIA seems to have introduced a sharp break in the share of insurers writing certified as opposed to non-certified terrorism insurance. In 2003, about 40 percent of insurers in TRIA-eligible lines reported writing policies that cover non-certified terrorism risk (Figure 4.16). This rate compares with some 90 percent of insurers writing policies covering certified terrorism risk (Figure 4.17).
17 See, for example, Risk Management Solutions, Managing Terrorism Risk, 2003.

- 79 -
Comparing provision of non-certified coverage to certified coverage, we find more insurers writing certified terrorism insurance overall and within in each insurer-size class than non-certified coverage. This comparison suggests that TRIA has encouraged insurers who otherwise would likely not have participated in this market to write certified terrorism coverage.
Figure 4.17
Insurers Providing Any Certified Terrorism Risk InsuranceOverall and by Total Insurer Assets
0102030405060708090
100
Overall Under $1 billion $1 to $10 billion Over $10 billion
Perc
ent I
nsur
ers
2003 2004
Comparing provision of certified and non-certified coverage across insurers of different sizes, we find that large insurers are substantially more likely than smaller insurers to write non-certified terrorism risk insurance. It is reasonable to argue that this pattern is representative of the likely market outcome for certified coverage in the absence of the Federal backstop. These comparisons therefore suggest that TRIA has encouraged smaller insurers to write certified terrorism risk insurance coverage that they might otherwise not write in the absence of TRIA.

- 80 -
4.6 Workers’ Compensation As explained in Chapter 2, workers’ compensation insurance is compulsory for most organizations under state law. The net effect is that terrorism risk insurance coverage is effectively mandatory in workers’ compensation insurance policies. Figure 4.18 plots cost shares from terrorism coverage included with workers’ compensation. Average terrorism cost shares for workers’ compensation coverage increased from roughly 0.25 percent in 2002 to roughly 0.75 percent in 2003. The average terrorism cost share in workers’ compensation lines increased further, to nearly 1.5 percent, in 2004.
Figure 4.18
Average Terrorism Cost Shares in Workers' CompensationAverage Premium for Terrorism Coverage
Relative to Total Premium for Policies with Terrorism Coverage
0
0.51
1.52
2.5
2002 2003 2004
Ave
rage
Per
cent
Note: Responses to this question for 2002 are missing for 23 percent of survey respondents that write some workers’ compensation policies; item non-response rates for respondents eligible to answer this question fall to 14 percent and 6 percent for 2003 and 2004 respectively. Figure 4.19 reports on average costs for TRIA-eligible coverage in workers’ compensation lines, calculated separately by the median number of covered employees at a single location from the policies written by the insurer. Roughly 30 percent of insurers report a median number of employees covered at a single location less than or equal to five. Presumably these insurers specialize in insurance for small businesses and the self-employed. The largest average cost share reported for 2004 is by insurers whose median number of employees is between one and five.

- 81 -
Figure 4.19
Average Terrorism Cost Shares in Workers' CompensationBy Median Number of Employees Covered
0.00.51.01.52.02.5
5 or less 5 to 10 10 to 50 over 50
Median Number of Covered Employees
Ave
rage
Per
cent
2002 2003 2004
Note: A missing bar indicates that no survey respondents provided an answer within the specified range. The item non-response rate for the median number of employees covered is 35 percent for 2002 and 39 percent for 2003; item non-response falls to 22 percent for 2004. Because terrorism risks associated with workers’ compensation coverage are more concentrated in large establishments, insurers were asked in the surveys whether there had been a change in their willingness to write workers’ compensation coverage to organizations with fewer than 100, 100 to 1,000, and more than 1,000 employees at a single location. In reference to 2002 coverage the survey asked about willingness to write workers’ compensation coverage after September 11th, but before passage of TRIA. With respect to subsequent coverage (in 2003 and 2004), insurers were asked about changes in their willingness to write workers’ compensation to locations in these same size classes since passage of TRIA. For most size categories, insurers predominantly responded that there has been no change in willingness to write workers’ compensation coverage. Regarding large employers (locations with 1,000 or more employees), the data suggest a decline in the fraction of insurers who are less willing to write workers’ compensation coverage, and a very slight increase in the percentage of insurers who report a greater willingness to write workers’ compensation coverage to organizations with more than 1,000 employees in a single location.


Chapter 5 Results from Surveys of Policyholders This chapter presents evidence on the availability and cost of terrorism risk insurance from surveys of policyholders.1 The data provide insight into the use of terrorism risk insurance by commercial property and casualty insurance policyholders, including individual firms, municipalities and organizations. The surveys cover 2002 to 2005, and therefore follow the adjustment of this insurance market to the events of September 11th and the subsequent enactment of TRIA. Chapter 3 describes the TRIA surveys and provides additional information and detail on the design and timing of the surveys. Policyholders were asked whether they purchased terrorism risk coverage in each broad line of commercial property and casualty insurance. Because TRIA’s make available rule restricts the ability of insurers to exclude terrorism coverage, the policyholder data provides insight into policyholder decisions to decline such coverage. We emphasize that the discussion of results here is based primarily on data aggregated over all property and casualty lines, excluding workers’ compensation. Because state laws and regulations prohibit the exclusion of terrorism coverage from workers’ compensation insurance policies, terrorism coverage is included in such policies by definition. This chapter is organized as follows. Section 5.1 presents estimates of total terrorism insurance take-up and prices reported by policyholders. The following three sections disaggregate the data, first by organization size and by the amount of coverage purchased (Section 5.2), then by policyholder-risk characteristics (Section 5.3) and finally by industry and region (Section 5.4). We examine various features of the market in the following two sections, including special terms and conditions associated with certified coverage (Section 5.5), and take-up of NBCR-terrorism coverage (Section 5.6). A persistent criticism of subsidized insurance is that it dampens mitigation by policyholders. We examine mitigation activities among policyholders in Section 5.7. We report on reasons for non-purchase in Section 5.8.
1 For brevity of exposition, we use the term terrorism risk insurance to refer to both overall terrorism coverage in 2002 and TRIA coverage for December 2002 through 2005 when discussing the empirical results presented in this chapter.

- 84 -
5.1 Take-up and Prices of Terrorism Insurance
Policyholder take-up rates are defined throughout this chapter as the share of policyholders who purchased any amount of terrorism risk insurance, either as stand-alone coverage or in conjunction with a regular policy in TRIA-eligible lines. Policyholders were asked to report on the number of policies, and premium paid for policies written or renewed in a specific calendar year. 2 For example, an annual policy renewed in October 2003 and extended through September of 2004, would be included in 2003 data. This approach allows us to separate pre-TRIA and post-TRIA outcomes.3 The data suggest that the proportion of respondent policyholders taking any terrorism coverage has been increasing steadily since 2002. Figure 5.1 shows that roughly 27 percent of surveyed policyholders reported some terrorism insurance in commercial property and casualty lines in 2002. The take-up rate rose to more than 39 percent in 2003 and to 54 percent in 2004. Data from January and February of 2005 suggests that take-up of terrorism insurance remained stable.
Figure 5.1
Policyholder Terrorism Risk Insurance Take-up Rates
0102030405060708090
100
2002 2003 2004
Perc
ent P
olic
yhol
ders
We note that the observed increase in take-up rates since 2002 corresponds to the introduction of the Federal backstop. However, the observed increase does not necessarily represent a TRIA effect. The data reported here do not eliminate other factors that might drive take-up of such insurance, such as the underwriting cycle or increasing awareness of terrorism risks. The increase in take-up rates also occurred as the TRIA deductible increased from 7 percent in 2003 to 10 percent in 2004 and finally to 15 percent in 2005. This reduction in the subsidy is predicted to have a negative effect on take-up rates. 2 Although it would be helpful to know more about the percentage of the organizations’ policies that include terrorism coverage, in this survey policyholders were not asked to report on the number of policies that included terrorism risk insurance coverage due to concerns about respondent burden and potential attrition from the sample. 3 The take-up rate estimates for 2002 may be slightly biased downward because terrorism risk insurance coverage need not have been priced explicitly and some policyholders may have obtained coverage that included terrorism risk insurance without realizing it was included.

- 85 -
The policyholder take-up rates shown in Figure 5.1 are different from, and not directly comparable with, the measures of insurer policy writing reported in the preceding chapter (for example figure 4.2). Several factors limit the comparability of policyholder take-up rates, on the one hand, and the percentage of insurer policies written with terrorism coverage relative to the total number of policies written, on the other. First, the two measures of availability are based on different units of reference. The ratio of insurer policies with terrorism coverage included is the share of insurance policies that cover terrorism averaged over all insurers, whereas policyholder take-up is the share of policyholders with terrorism coverage. Large policyholders, who may have multiple policies and are more likely to have terrorism insurance, would have more weight in the insurer measure of availability than in the policyholder measure. The average insurer is also quite different from the average policyholder. The TRIA insurer survey was designed to be representative of 495 insurance companies and insurance groups with more than $10 million in premiums. In contrast, respondents to the policyholder survey represent almost 1.1 million organizations that are not part of the Federal Government and have at least 10 employees. As we note in Chapter 2, insurers are quite diverse in terms of both markets served as well as market share. These differences suggest that direct comparison of these two ratios is generally not informative. We next examine the cost of terrorism risk insurance to policyholders, measured by the share of total premiums paid for terrorism coverage in TRIA-eligible lines.4 For consistency, we calculate the cost share in 2002 in lines that would become TRIA-eligible. In all subsequent years, the cost share is calculated in lines that are TRIA-eligible. Standard practices in the insurance industry before the enactment of TRIA was to combine certified and non-certified terrorism coverage. The 2002 cost share estimate therefore refers to both types of coverage, whereas the 2003 and 2004 cost shares refer only to TRIA coverage. In 2002, data suggest that the cost share of terrorism coverage was about one percent of TRIA-eligible premiums (Figure 5.2).5 That percentage increased to roughly 1.6 percent in 2003 and 1.7 percent in 2004. Overall, the policyholder terrorism risk insurance cost share estimates are consistent with the average terrorism cost share estimates obtained from insurer data (see Figure 4.5).
4 We refer to this as the terrorism risk insurance cost share. 5 Data on terrorism risk insurance premiums were not reported by some survey respondents. Therefore terrorism cost shares cannot be calculated for 19 percent of 2002 values, 23 percent of 2003 values, and 19 percent of 2004 values. These item response rates apply to all terrorism cost share statistics reported in this chapter. Item non-response rates are typically less than two percent. Item non-response rates are reported explicitly when the item non-response rate for the eligible population is greater than five percent.

- 86 -
Figure 5.2
Average Policyholder Terrorism Risk Insurance Cost SharesAverage Premiums for Terrorism Coverage
Relative to Total Premiums for Policies with Terrorism Coverage
0.0
1.0
2.0
3.0
4.0
5.0
2002 2003 2004
Perc
ent P
rem
ium
s
These estimates are based on all respondents, including policyholders who paid nothing for terrorism coverage. Figure 5.3 shows that a substantial proportion of policyholders received terrorism risk insurance coverage at no charge. In fact, 70 percent of policyholders with terrorism risk insurance were not charged explicitly for that coverage in 2002. That rate, however, declined sharply to 42 percent in 2003 and further to 37 percent in 2004. This decline in the policyholders with free coverage mirrors the decline in zero cost share terrorism coverage observed in the insurer data. The data suggest a marked change in the spread of terrorism cost shares between 2002 and 2004. By the end of the period, fewer policyholders faced a zero cost share, while more faced cost shares between zero and 5 percent of premiums. Most policyholders who pay for terrorism coverage pay at most two percent of premiums. The share of policyholders with cost shares at or below 2 percent nearly tripled over the period, from 15 percent in 2002 to 35 percent in 2003, and finally to 42 percent in 2004. The share of policyholders paying between 2 percent and 5 percent of their total premium in TRIA-eligible lines doubled from 7 percent in 2002 to 14 percent in 2003 and 2004.

- 87 -
Figure 5.3
Average Policyholder Terrorism Risk Insurance Cost SharesDistribution of Policyholders By Average Terrorism Cost Share
0
20
40
60
80
100
Zero Below 2 Percent 2 to 5 Percent Above 5 PercentPercent Premiums
Perc
ent P
olic
yhol
ders
2002 2003 2004
We note that a relatively stable proportion of policyholders obtained terrorism coverage for no charge throughout the period examined, because declines in the percentage of policyholders obtaining terrorism risk insurance coverage at no cost are offset by increases in uptake rates. This group represents approximately 19 percent of all policyholders in 2002, 16 percent in 2003, and 20 percent in 2004.6 At the same time, an increasing fraction of policyholders purchased priced terrorism coverage. Approximately 8 percent of all policyholders purchased terrorism risk insurance coverage for a non-zero price in 2002. In 2003 roughly 23 percent of policyholders purchased terrorism risk insurance of a positive price, and 34 percent did so in 2004. These increases in take-up rates for priced terrorism risk insurance are consistent with declines in average non-zero prices. Excluding policyholders who received terrorism risk insurance at no charge, the average cost of terrorism coverage declined between 2002 and 2004. In 2002, survey data suggest that the non-zero cost share of terrorism coverage was about 4 percent of TRIA-eligible premiums. That percentage fell to roughly 2.8 percent in 2003 and 2.7 percent in 2004. Clearly the overall increase in costs presented in Figure 5.1 reflects three broad patterns: an increase in policyholders who are paying for terrorism coverage, a decline in the cost faced by paying policyholders, and a fairly stable percentage of policyholders who continue to obtain terrorism risk insurance for no charge. Policyholders obtaining free terrorism risk insurance are presumably those confronting low terrorism risks.
6 For example, 27 percent of all policyholders had terrorism risk insurance coverage in 2002 and 70 percent of policyholders received terrorism coverage for no charge. Thus 19 percent of all policyholders received terrorism risk insurance coverage at no charge in 2002.

- 88 -
Figure 5.4
Average Policyholder Terrorism Risk Insurance Cost SharesAmong Policyholders Reporting Positive Charges
0.0
1.0
2.0
3.0
4.0
5.0
2002 2003 2004
Perc
ent P
rem
ium
s
Captive Insurers A captive insurer is an entity formed primarily to insure or reinsure the risks of one policyholder. It may be owned by a corporation or an association, domiciled onshore or offshore, and has the option of writing the business of unrelated parties. Captive insurers typically underwrite insurance for one or a small number of organizations and therefore have low premiums. Because the TRIA deductible is calculated based on previous-year’s direct written premiums, captives will face a low TRIA deductible and therefore receive Federal support for a large share of terrorism losses. This raises a concern that TRIA encourages the use of less-diversified captives by policyholders. For the most part, the policyholder survey does not ask policyholders questions about the nature of insurers from whom they purchase coverage. But in the second and third waves of the survey, we did ask a question about whether policyholders purchased any terrorism risk insurance coverage from captive insurers. While we cannot explicitly measure whether TRIA increases the use of captives, our data suggest that about 3 percent of all policyholders purchased terrorism coverage through a captive in 2004. Data from January and February of 2005 suggest that use of captives for terrorism risk insurance coverage may have increased to almost 8 percent. Non-Certified Terrorism Coverage We estimate that approximately 57 percent of commercial property and casualty policyholders had non-certified terrorism risk insurance coverage in 2004, and estimates for the first two months of 2005 are comparable. Survey responses about the cost of non-certified coverage were

- 89 -
too limited to provide reliable estimates. We believe, however, that the majority of policyholders do not pay an explicit price for non-certified coverage.7 5.2 Take-up and Price by Policyholder Size and Amount of Coverage In this section, we examine the take-up of terrorism coverage by firm size, measured by the value of assets.8 Figure 5.5 shows that take-up rates increased in every policyholder size class, in each year examined. Terrorism insurance take-up in 2002 was highest among larger policyholders, but the difference between 2002 and 2003 take-up is quite small for these large policyholders. Between 2002 and 2003 estimated take-up rate increased by 11 percentage points among policyholders who reported less than $10 million in assets, by 15 percentage points among policyholders with $10 to $100 million in assets, and by 16 percentage points among policyholders with $100 million to $1 billion in assets. Take-up increased by only 4 percentage points among policyholders with more than $1 billion in assets.
Figure 5.5
Policyholder Terrorism Risk Insurance Take-up RatesBy Total Assets of Policyholder
0
20
40
60
80
100
Under $10 million $10 to $100 million $100 million to $1 billion
$1 billion or more
Perc
ent P
olic
yhol
ders
2002 2003 2004
Note: Take-up rates for 2004, for policyholders in the largest asset size class, may be unreliable. The bar is shaded to reflect the tentative nature of the estimate. The take-up rate also increased in each size class between 2003 and 2004: take-up rates increased by 17 percentage points among policyholders with less than $10 million in assets, 8 percentage points among policyholders with $10 to $100 million in assets, and 2 percentage points among policyholders with $100 million to $1 billion in assets.
7 Results from a recent survey conducted by Moody’s also suggest that non-certified coverage is included in a large percentage of policies, for little or no charge. James Eck, “Moody’s Special Comment: Terrorism Risk Remains Material for Insurers as TRIA Expiration Looms,” Moody’s Investors Service Global Credit Research, June 2005. 8 Census Bureau Enterprise Statistics data show that companies with under $250,000 in sales receipts account for half (51 percent) of all companies in the private sector, but only 6 percent of employment and 3 percent of payroll. Statistics of Income data from the IRS shows that they count for roughly 1 percent of total assets. In contrast, companies with $50,000,000 or more in sales receipts are a trivial share of all companies, but account for 86 percent of total assets, 46 percent of employment and 54 percent of total payroll.

- 90 -
In the case of large policyholders with $1 billion or more in assets, the 2004 take-up rate estimate reported in Figure 5.5 may be overstated as a result of attrition bias, as discussed in Chapter 3. The survey questionnaires were particularly complex, and therefore potentially burdensome, for large policyholders. It is possible that large respondents who participated in the survey repeatedly did so because they were more concerned about their terrorism risk exposure, and therefore more likely to purchase terrorism risk insurance coverage, than large organizations that declined to participate in the second survey wave. But comparisons across asset size classes can be instructive, and large policyholders account for a large share of total economic activity. Therefore we present the 2004 results from large policyholders throughout this chapter, but the estimates should be interpreted with caution. Figure 5.6 shows take-up rates within comparable ranges for replacement cost values. Replacement cost value is defined as the cost of replacing property with like kind and quality without a reduction for depreciation. Land values are omitted from replacement cost values because land cannot be replaced in this way. These estimates are reported in Figure 5.6. The results are similar to the analysis by asset size; the largest replacement value class had the highest 2002 take-up, but the smallest take-up differential between 2002 and 2003.9 Between 2002 and 2003 we estimate that take-up increased by 12 percentage points among policyholders with replacement cost values of less than $5 million, by 12 percentage points among policyholders with replacement cost values of $5 to $50 million, and by 19 percentage points among policyholders with replacement cost values of $50 to $500 million. There was only a 4 percentage point increase among policyholders with replacement cost values of $500 million or higher. In 2004 we estimate that the take-up rate among policyholders reporting replacement cost values of less than $50 million was 53 percent and the take-up rate was 61 percent among policyholders with replacement cost values of $50 to $500 million. The attrition bias discussed above may have affected the 2004 take-up rate among the largest replacement cost value category and should be interpreted with caution.
9 Once again the very high 2004 take-up rate estimates for the largest asset size class should be viewed with caution.

- 91 -
Figure 5.6
Policyholder Terrorism Risk Insurance Take-up RatesBy Total Replacement Value of Property Insured
0
20
40
60
80
100
Under $5 million $5 to 50 million $50 to $500 million $500 million or higher
Perc
ent P
olic
yhol
ders
2002 2003 2004
Note: Take-up rates for 2004, for policyholders in the largest total replacement value class, may be unreliable. The bar is shaded to reflect the tentative nature of the estimate. Figure 5.7 reports on average terrorism risk insurance cost shares calculated separately by asset size class. These data suggest that charges for terrorism coverage increase with the policyholder asset size. Among policyholders with less than $10 million in assets, average terrorism risk insurance cost shares increased from 1 percent in 2002 to 1.3 percent in 2003 and 1.6 percent in 2004. Among policyholders with $10-100 million in assets average terrorism cost shares increased from 1.7 percent in 2002 to 2.1 percent in 2003, and then declined to 1.8 percent in 2004. Average cost shares among organizations with $100 million to $1 billion in assets increased from 1.7 percent in 2002 to 2.5 percent in 2003, and declined to 1.7 percent in 2004. Among policyholders with over $1 billion in assets average terrorism cost shares increased from 2.2 percent in 2002 to 2.8 percent in 2003. The 2004 cost share estimate for the largest asset class size increase is subject to concern about possible attrition bias.
Figure 5.7
Average Policyholder Terrorism Risk Insurance Cost SharesBy Total Assets of Policyholder
0.0
1.0
2.0
3.0
4.0
5.0
Under $10 million $10 to $100 million $100 million to $1 billion
$1 billion or more
Perc
ent P
rem
ium
s
2002 2003 2004
Note: Cost shares for 2004, for policyholders in the largest asset size class, may be unreliable. The bar is shaded to reflect the tentative nature of the estimate.

- 92 -
Figure 5.8 shows terrorism cost shares by replacement value of property insured. This analysis is generally consistent with the pattern of cost shares shown above. Policyholders reporting a replacement value of property insured of $500 million or more, reported very high cost shares (nearly 5 percent) in 2002. These cost shares drop significantly in 2003 and 2004, essentially coming into line with the other replacement value categories. This may reflect an increased capacity of insurers to offer coverage on large, valuable properties. As above, we urge caution in the interpretation of 2004 cost shares for the highest replacement value category.
Figure 5.8
Average Policyholder Terrorism Risk Insurance Cost Shares By Total Replacement Value of Property Insured
0.0
1.0
2.0
3.0
4.0
5.0
Under $5 million $5 to 50 million $50 to 500 million $500 million or higher
Perc
ent P
rem
ium
s 2002 2003 2004
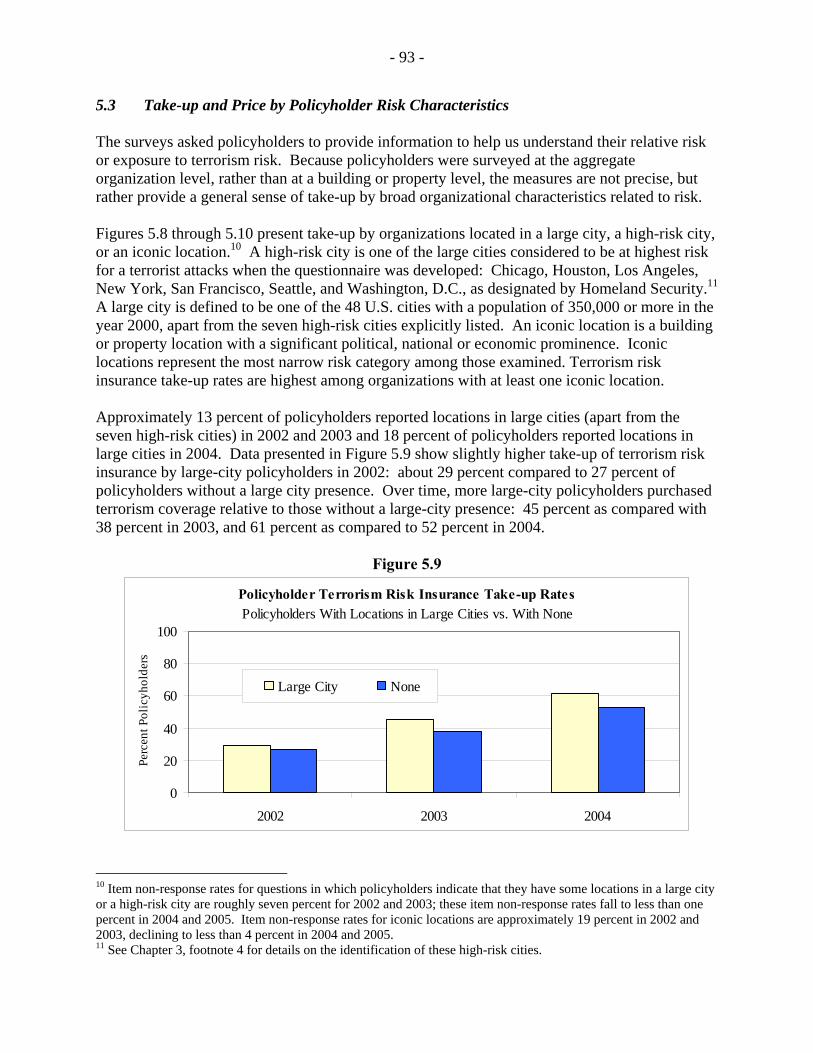
- 93 -
5.3 Take-up and Price by Policyholder Risk Characteristics The surveys asked policyholders to provide information to help us understand their relative risk or exposure to terrorism risk. Because policyholders were surveyed at the aggregate organization level, rather than at a building or property level, the measures are not precise, but rather provide a general sense of take-up by broad organizational characteristics related to risk. Figures 5.8 through 5.10 present take-up by organizations located in a large city, a high-risk city, or an iconic location.10 A high-risk city is one of the large cities considered to be at highest risk for a terrorist attacks when the questionnaire was developed: Chicago, Houston, Los Angeles, New York, San Francisco, Seattle, and Washington, D.C., as designated by Homeland Security.11 A large city is defined to be one of the 48 U.S. cities with a population of 350,000 or more in the year 2000, apart from the seven high-risk cities explicitly listed. An iconic location is a building or property location with a significant political, national or economic prominence. Iconic locations represent the most narrow risk category among those examined. Terrorism risk insurance take-up rates are highest among organizations with at least one iconic location. Approximately 13 percent of policyholders reported locations in large cities (apart from the seven high-risk cities) in 2002 and 2003 and 18 percent of policyholders reported locations in large cities in 2004. Data presented in Figure 5.9 show slightly higher take-up of terrorism risk insurance by large-city policyholders in 2002: about 29 percent compared to 27 percent of policyholders without a large city presence. Over time, more large-city policyholders purchased terrorism coverage relative to those without a large-city presence: 45 percent as compared with 38 percent in 2003, and 61 percent as compared to 52 percent in 2004.
Figure 5.9
Policyholder Terrorism Risk Insurance Take-up Rates Policyholders With Locations in Large Cities vs. With None
0
20
40
60
80
100
2002 2003 2004
Perc
ent P
olic
yhol
ders
Large City None
10 Item non-response rates for questions in which policyholders indicate that they have some locations in a large city or a high-risk city are roughly seven percent for 2002 and 2003; these item non-response rates fall to less than one percent in 2004 and 2005. Item non-response rates for iconic locations are approximately 19 percent in 2002 and 2003, declining to less than 4 percent in 2004 and 2005. 11 See Chapter 3, footnote 4 for details on the identification of these high-risk cities.

- 94 -
Approximately 8 percent of policyholders reported locations in high-risk cities in 2002 and 2003 and 11 percent of policyholders reported locations in high-risk cities in 2004. Figure 5.10 compares take-up rates for organizations that had locations in these high-risk cities with those that did not. Terrorism risk insurance take-up rates are consistently higher among organizations with some presence in these cities than among organizations with no locations in high-risk cities. In 2002, prior to the enactment of TRIA, the terrorism risk insurance take-up rate for companies and other entities with locations in high-risk cities was roughly 34 percent, as compared with 26 percent among policyholders with no locations in these cities. In 2003 and 2004, take-up rates for policyholders with some presence in a high-risk city were 46 and 67 percent respectively, as compared with 39 percent in 2003 and 52 percent in 2004 among policyholders without high-risk city locations.
Figure 5.10
Policyholder Terrorism Risk Insurance Take-up RatesPolicyholders With Locations in High-Risk Cities vs. With None
0
20
40
60
80
100
2002 2003 2004
Perc
enta
ge P
olic
yhol
ders
High-Risk City None
Respondents representing six percent of policyholders reported divisions, branches, subsidiaries or other entities in iconic locations. Figure 5.11 shows that take-up rates among organizations with iconic locations are consistently higher than take-up rates among organizations without such locations. Terrorism coverage among organizations with iconic locations more than doubled over the period, from 34 percent in 2002 to 62 percent in 2003 and 70 percent in 2004. Take-up rates among policyholders without iconic locations were 25 percent in 2002, 38 percent in 2003, and 53 percent in 2004.

- 95 -
Figure 5.11
Policyholder Terrorism Risk Insurance Take-up RatesPolicyholders With Iconic Locations vs. With None
0
20
40
60
80
100
2002 2003 2004
Perc
ent P
olic
yhol
ders Iconic Locations None
Figures 5.12 to 5.14 on the following pages present the corresponding costs faced by policyholders in different locations. Between 2002 and 2003, the cost of terrorism coverage increased moderately for policyholders with locations considered to be at higher risk for terrorist attacks (large cities, high-risk cities and iconic locations), but then declined in 2004. Between 2002 and 2004, the cost generally rose for policyholders with no locations in these areas. This trend partially reflects a shift over time by low-risk policyholders into small but non-zero charges for terrorism coverage that they previously received for no cost. Data from 2004 suggest a large decline in the cost shares for organizations with locations in high-risk areas, and a steady rise in the cost shares for organizations without locations in these high-risk areas. This occurs to such a degree that lower-risk policyholders reported paying a larger terrorism cost share than those in large and iconic cities. This result may reflect better and more precise pricing methods by insurers, greater competition for urban and higher-risk policyholders, the effects of state rate regulation, and the effects of TRIA. Calculations using a sample of policyholders that participated in each of the survey waves show a similar result, suggesting that the pattern, particularly the decline in 2004 terrorism risk insurance cost shares in the higher-risk location policyholder groups, is not a function of selective survey participation. The result is broadly consistent with the result found in the insurer data (Figure 4.10) that small insurers charged, on average, the highest cost shares in 2004. One alternative explanation is that non-terrorism premiums were higher for organizations with locations in these high risk areas than for organization without locations in these areas.

- 96 -
Figure 5.12
Average Policyholder Terrorism Risk Insurance Cost SharesPolicyholders With Locations in Large Cities vs. With None
0.0
1.0
2.0
3.0
4.0
5.0
2002 2003 2004
Perc
ent P
rem
ium
s Large City None
Figure 5.13
Average Policyholder Terrorism Risk Insurance Cost SharesPolicyholders With Locations in High-Risk Cities vs. With None
0.0
1.0
2.0
3.0
4.0
5.0
2002 2003 2004
Perc
ent P
rem
ium
s High-Risk City None
Figure 5.14
Average Policyholder Terrorism Risk Insurance Cost SharesPolicyholders With Iconic Locations vs. With None
0.0
1.0
2.0
3.0
4.0
5.0
2002 2003 2004
Perc
ent P
rem
ium
s Iconic Locations None
Figures 5.15 through 5.17 present the terrorism risk insurance share for policyholders reporting a non-zero cost share. These figures show the same basic pattern for higher-risk policyholders as

- 97 -
is shown above, but cost shares are flat or declining for policy-holders without higher-risk locations.
Figure 5.15
Average Positive Policyholder Terrorism Risk Insurance Cost Shares Policyholders With Locations in Large Cities vs. With None
0.0
1.0
2.0
3.0
4.0
5.0
2002 2003 2004
Perc
ent P
rem
ium
s Large City None
Figure 5.16
Average Positive Policyholder Terrorism Risk Insurance Cost SharesPolicyholders With Locations in High-Risk Cities vs. With None
0.0
1.02.0
3.04.0
5.0
6.0
2002 2003 2004
Perc
ent P
rem
ium
s
High-Risk City None
Figure 5.17
Average Positive Policyholder Terrorism Risk Insurance Cost Shares Policyholders With Iconic Locations vs. With None
0.0
1.0
2.0
3.0
4.0
5.0
2002 2003 2004
Perc
ent P
rem
ium
s Iconic Locations None

- 98 -
Figure 5.18 provides additional detail on the terrorism cost shares paid by organizations with different risk characteristics. The figure compares the range of terrorism cost shares reported by policyholders with at least one location in a high-risk city to the range of terrorism cost shares for policyholders without locations in high-risk cities. In 2002, nearly 73 percent of the lower-risk policyholders had free terrorism risk insurance coverage compared to 54 percent of policyholders with locations in high-risk cities. The decline in zero cost share coverage between 2002 and 2003 is much more striking among the low risk population and undoubtedly accounts for much of the change in the high-risk/non-high-risk cost share differential. The proportion of low-risk policyholder receiving free terrorism risk insurance coverage falls by 30 percentage points, from 73 to 43 percent, between 2002 and 2003. Comparing across all three years we see that both the high- and low-risk groups are increasingly paying for terrorism risk insurance, and that their charges are most likely to fall within the less than 2 percent range.
Figure 5.18 Distribution of Policyholders by Average Terrorism Cost Share
Policyholders With and Without High-Risk City Locations
Policyholders With Locations in High-Risk Cities
0
20
40
60
80
100
Zero Below 2 Percent 2 to 5 Percent Above 5 Percent
Range of Policyholders' Average Terrorism Cost Shares
Perc
ent P
olic
yhol
ders
2002 2003 2004
Policyholders With No Locations in High-Risk Cities
0
20
40
60
80
100
Zero Below 2 Percent 2 to 5 Percent Above 5 PercentRange of Policyholders' Average Terrorism Cost Shares
Perc
ent P
olic
yhol
ders 2002 2003 2004

- 99 -
5.4 Take-up and Cost Shares by Industry and Region Industry Figure 5.19 presents terrorism insurance take-up rates by major industrial sector. Take-up rates have increased substantially in all major sectors. The terrorism risk insurance take-up rate in wholesale and retail trade was particularly low in 2002, at 19 percent, as compared with 25 percent in heavy industry, 35 percent in business, and 30 percent in the service sector and government.12 On average, take-up rates are estimated to have increased roughly 12 percent per year in 2003 and 2004. By 2004 the terrorism insurance take-up rate had increased to 45 percent in wholesale and retail trade, to 47 percent in heavy industry, to 65 percent in business, to 57 percent in services and to 43 percent in government. The highest take-up rates are in business and services.
Figure 5.19
Policyholder Terrorism Risk Insurance Take-up RatesBy Major Industrial Sector
0
20
40
60
80
100
Heavy Industries Trade Business Services Government
(NAICS 1,2,3) (NAICS 4 ) (NAICS 51-55) (NAICS 56+,7,8)
Perc
ent P
olic
yhol
ders
2002 2003 2004
Figure 5.20 shows the terrorism risk insurance cost share by industry classification of policyholders. The low cost share paid by firms reporting their primary classification as Heavy Industry is of particular interest. It is also interesting to note that the cost share paid by firms reporting their primary classification as Trade fell in 2004.
12 Business includes industries in information; finance and insurance; real estate and rental and leasing; professional, scientific and technical services; and management of companies and enterprises.

- 100 -
Figure 5.20
Average Policyholder Terrorism Risk Insurance Cost Shares By Major Industrial Sector
0.0
1.0
2.0
3.0
4.0
5.0
Heavy Industries Trade Business Services Government
(NAICS 1,2,3) (NAICS 4 ) (NAICS 51-55) (NAICS 56+,7,8)
Perc
ent P
rem
ium
s
2002 2003 2004
The TRIA specifically directed Treasury to examine the availability and affordability of terrorism insurance for policyholders in railroads, trucking, and public transit. Take-up estimates for those groups are included in Figure 5.21 below.13 Among railroads, survey results indicate that take-up rates were approximately 25 percent in 2002, 31 percent in 2003, and 32 percent in 2004. In trucking, survey results suggest that take-up rates increased from 23 percent in 2002 to 31 percent in 2003 and 43 percent in 2004. The corresponding estimates for public transportation are 2 percent in 2002, 20 percent in 2003, and 36 percent in 2004.
Figure 5.21
Policyholder Terrorism Risk Insurance Take-up RatesIndustries of Special Interest
0
20
40
60
80
100
Rail Transportation Truck Transportation Public Transit
Perc
ent P
olic
yhol
ders
2002 2003 2004
Cost share estimates for these populations are even less precise because they are based on smaller sample sizes (only respondents with terrorism coverage provide cost information). The cost share estimates for railroads are 5 percent of premiums in 2002 and 2003, increasing to 8 13 The number of companies in railroads and trucking is too small to ensure the confidentiality of survey results without undue masking, and the same is true for providers of public transportation. Therefore these estimates were developed by Westat, following Treasury specifications. The number of observations underlying these estimates is quite small, especially for the cost share estimates for railroads and public transit.

- 101 -
percent of premiums in 2004. These estimates, however, are based on only 13-15 observations (out of a population of 421 railroads). Cost share estimates for trucking, where sample sizes are reasonably good, fall from 0.68 percent in 2002 to 0.55 percent in 2003 and rise to 1.06 percent in 2004. Cost share estimates for public transit are based on samples too small to report.
Figure 5.22
Average Policyholder Terrorism Risk Insurance Cost SharesIndustries of Special Interest
0123456789
10
Rail Transportation Truck Transportation
Perc
ent P
rem
ium
s
2002 2003 2004
Region Figure 5.23 shows take-up across major geographical sectors. The increase in take-up between 2002 and 2003 suggests that policyholders in the Northeast and West are no more likely to purchase terrorism risk insurance coverage than policyholders in the Midwest and South. In all major geographical regions, policyholder survey data yield terrorism risk insurance take-up rates of slightly less than 30 percent in 2002, around 40 percent in 2003, and near 50 percent in 2004. The two exceptions evident are the slightly lower than average take-up rates estimated for the South in 2002 and 2003 and the higher than average 2004 take-up rate estimated for the Northeast. Terrorism insurance take-up rate estimates for the Northeast increased sharply in 2004 to 64 percent. Overall, however, these results indicate take-up of terrorism risk insurance coverage increased relatively uniformly throughout the country.

- 102 -
Figure 5.23
Policyholder Terrorism Risk Insurance Take-up RatesBy Region
0
20
40
60
80
100
Northeast Midwest South West
Perc
ent P
olic
yhol
ders 2002 2003 2004
Figure 5.24 shows cost share by region. These results are consistent with the general perception that the Northeast and West are considered to be at higher risk for acts of terrorism.
Figure 5.24
Average Policyholder Terrorism Risk Insurance Cost Shares By Region
0.0
1.0
2.0
3.0
4.0
5.0
Northeast Midwest South West
Perc
ent P
rem
ium
s
2002 2003 2004

- 103 -
5.5 Special Terms and Conditions Mirroring the insurer survey, the policyholder survey asked a set of questions about whether special terms and conditions are generally applied to policies with TRIA coverage relative to policies without TRIA. Out of a broad range of special conditions, policyholders only gave positive responses in two areas, the use of annual aggregates and exclusion of scheduled locations. Figure 5.25 shows results for these special conditions.14 The percent of policyholders reporting use of either type of restriction fell from 2002 to 2004.15
Figure 5.25
Special Terms and Conditions for Terrorism Risk Insurance Relative to Policies with No Terrorism Risk Insurance Coverage
0
20
40
60
80
100
Annual Aggregates Excluded Scheduled Locations
Perc
ent P
olic
yhol
ders
2002 2003 2004
Special Conditions for 2006 In the last wave of the TRIA surveys, policyholders were asked about their policies actually written or renewed in January and February of 2005. Although policies written or renewed within the first two months of 2005 do not extend far into 2006, responses to these questions nonetheless provide some insight into arrangements made for terrorism risk insurance coverage post-TRIA. For clarity of exposition, terrorism risk insurance coverage comparable to certified terrorism risk insurance provided under TRIA is identified as international terrorism risk insurance coverage for the purposes of this discussion, and the 2006 counterpart to non-certified coverage is identified as domestic terrorism. Among policyholders that purchased or renewed commercial property or casualty insurance coverage with certified terrorism coverage in the first two months of 2005, approximately 26 percent are estimated to have exclusions for international terrorism risk insurance coverage for the portion of their policy year that extends into 2006. For policyholders with coverage
14 Annual aggregates are restrictions on the aggregate payments to a single policyholder in a single year - this controls insurer losses in the event of successive attacks. Restricted locations policies are policies that either exclude specified locations from coverage or include only a specified list of locations. 15 Item non-response rates for these variables ranged between 11 and 14 percent in 2002 and 2003, declining to 5 to 7 percent in 2004.

- 104 -
extending into 2006 survey data suggest that the use of restrictions for international terrorism coverage is comparable to that reported for certified coverage. Comparing 2005 and 2006 coverage, roughly 4 percent of policyholders report more coverage conditions that are specified in terms of annual aggregates for 2006 coverage, and roughly 3 percent report special conditions that are specified in terms of restricted locations for 2006. Because the 2006 coverage period spanned by policies written in the first two months of this year is relatively short, it is possible that the adjustments described above are less severe than those being adopted now.

- 105 -
5.6 Take-Up of Nuclear, Biological, Chemical or Radiation Risk (NBCR) Coverage TRIA requires that Nuclear, Biological, Chemical and Radiological (NBCR) terrorism insurance be offered by an insurer only if such NBCR coverage is offered by the insurer as part of the policyholder’s overall commercial property and casualty insurance. The percentage of policyholders reporting that they purchase NBCR terrorism risk insurance coverage is extremely small. In each of 2002, 2003 and 2004, less than 3 percent of policyholders reported NBCR coverage in lines other than worker’s compensation. This contrasts with the results from the insurer survey in which 30 percent of insurers reported that they provided some terrorism coverage for NBCR. Policyholders that did not purchase NBCR terrorism risk coverage were asked why they had not done so. As shown in Table 5.1 the dominant reason policyholders reported for not purchasing coverage is that policyholders believed that they were not at risk. Another major reason was that many policyholders reported that they felt that the premiums were too high; the share of policyholders reporting the latter as a major reason, however, declined from 31 percent in 2003 to 15 percent in 2004. In 2003, 11 percent of policyholders reported that the restrictive terms under which NBCR coverage was offered was a major reason to decline coverage; in 2004 this percentage declined to 7 percent. Roughly 8 percent of the surveyed population reported that they could not find adequate NBCR terrorism coverage; this figure declined to 5 percent in 2004.16
16 Item non-response rates for the variables reported in Table 5.1 were between 4 and 5 percent in 2003, increasing to 12 to 14 percent in 2004, and therefore changes over time should be interpreted with caution.

- 106 -
Table 5.1 Reasons for Not Purchasing NBCR Coverage
Not at riskHigh
premiumsRestrictive
termsInadequate coverage Other
Not a reason 11.2 33.59 56.96 63 92.93Minor reason 14.96 30.68 27.29 23.74 1.62Major reason 69.73 30.87 10.88 8.27 0.62No response 4.11 4.86 4.86 4.99 4.83
Not at riskHigh
premiumsRestrictive
termsInadequate coverage Not Offered Other
Not a reason 24.55 61.46 72.55 75.17 66.88 84.23Minor reason 8.41 11.1 8.09 6.72 4.63 0.6Major reason 55.18 14.79 6.59 5.42 16.13 1.19No response 11.87 12.64 12.77 12.7 12.36 13.98
2003
Policyholder Reasons for not purchasing NBCR
2004
Policyholder Reasons for not purchasing NBCR

- 107 -
5.7 Mitigation Activities One of the standard arguments against government-subsidized insurance programs is that such programs create problems of morale hazard. In theory, because the cost of insurance is lower than the natural market-clearing price, corporations will naturally purchase more insurance and invest less in measures designed to prevent damages. The cost of insurance and the availability of insurance are among two of several factors that influence policyholder decisions with regard to mitigation activities. The cost of the mitigation itself, the availability of knowledge about effective mitigation measures, concerns about employee/customer safety and public relations, the perception of peril, and the time passed since the last hazardous event all enter into consideration. With these issues in mind, policyholders were asked about measures they have taken to reduce losses associated with certified or non-certified attacks. More specifically, policyholders reported the degree to which the policyholder organization has undertaken the following efforts to reduce potential loss associated with a foreign or domestic terrorist attacks: • Increased expenditures on security • Decentralized operations • Made egress and fire prevention plans • Created employee incentive schemes to reward safe practices • Restricted products or services in current business operations Responses to these questions are summarized in Table 5.2. Among the alternatives listed, small changes in egress and fire prevention plans were reported by 16 to 22 percent of respondents, and large changes in egress and fire prevention plans were reported by an additional 6 to 7 percent. Roughly 17 to 20 percent of respondents reported that they had increased security to a small extent and approximately 11 to 14 percent reported that they had, to a small extent, offered rewards for safe practices. Roughly 5 percent reported that they had restricted their supply of products or services to a small extent.17
17 Note that item non-response rates to the variables reported in Table 2.1 were between 23 and 24 percent in 2003, declining to 9 to 10 percent in 2004, and therefore changes in these reported values over time should be interpreted with caution.

- 108 -
Table 5.2 Loss Reduction Measures
Increased security
Decentralized operations
Egress and fire prevention
plans
Reward safe practices
Restricted products or
services
Not at all 57.61 73.26 53.24 63.23 69.94To a small extent 16.77 2.97 16.26 11.19 5.69To a large extent 2.15 0.31 6.63 1.84 0.65No response 23.46 23.46 23.87 23.74 23.72
Increased security
Decentralized operations
Egress and fire prevention
plans
Reward safe practices
Restricted products or
services
Not at all 68.38 83.26 62.09 73.54 82.19To a small extent 20.16 5.26 21.69 13.53 5.23To a large extent 2.04 0.76 6.39 2.19 1.91No response 9.43 10.71 9.83 10.74 10.68
2003
2004
Focusing on the loss reduction measures that entail relatively modest costs, 23 to 28 percent of respondents reported making improvements in egress and fire prevention plans, and 19 to 22 percent of respondents reported making improvements in security. Without knowing more about the baseline of activities and vulnerabilities, it is difficult to draw a conclusion about whether these results should be viewed as encouraging or discouraging. At the same time, it is important to be aware that we do not know to what extent, if any, policyholders’ mitigation efforts would have been different in the absence of the TRIA backstop.

- 109 -
5.8 Reasons for Non-Purchase of Terrorism Coverage Policyholders that declined terrorism risk insurance were asked their reasons for declining coverage. This information provides additional insight into the role TRIA may have played in improving the availability of terrorism risk insurance. Figure 5.26 shows a substantial increase, from 49 percent in 2003 to 89 percent in 2004, in the percentage of policyholders without terrorism coverage who selected “we feel our company is not at risk” as one reason they declined the offer of insurance for acts of terrorism covered under TRIA. We also see, however, an increase in the percentage of the surveyed population that declined coverage because the cost was too high. The estimated percentage of respondents reporting that they declined coverage because the cost was too high increased from 24 percent in 2003 to 36 percent in 2004. This result is consistent with the shift away from free coverage and into priced coverage that is documented in both the insurer and policyholder survey results. In both 2003 and 2004, roughly 10 percent of the surveyed population without terrorism coverage cited inadequate coverage as one of the reasons for non-purchase. The vast majority of policyholders without terrorism coverage reported that they felt they were not at risk.
Figure 5.26
Reasons for Declining Terrorism Risk Insurance CoveragePolicyholders with No Terrorism Risk Insurance Coverage
020406080
100
Not at Risk Cost Too High RestrictiveConditions
InadequateCoverage
Perc
ent P
olic
yhol
ders
No
Terro
rism
Cov
erag
e
2003 2004


Chapter 6 Reinsurance This chapter provides quantitative information on the use of reinsurance. Reinsurance is insurance purchased by insurance companies to manage their risk exposure. In the case of terrorism, primary insurers are likely to use reinsurance to protect against catastrophic loss, either resulting from a single act of terrorism or from the aggregation of a large number of smaller acts of terrorism. It is known that large insurers typically reinsure a relatively small share of their exposure to natural catastrophe risk: the share of total exposure reinsured declines as insurer size increases, reflecting in part the ability of larger insurers to diversify risk using other mechanisms.1 Our data allows us to examine whether a similar pattern is observed for TRIA-eligible lines of property and casualty insurance. The data come from questions in the 2002 to 2005 waves of the survey to insurers, and cover use of reinsurance for all risks as well as TRIA exposure. Under TRIA, insurers maintain all terrorism risk exposure below their TRIA deductible, which is a fixed percentage of the previous year’s direct earned premiums, and 10 percent of exposure beyond the deductible. Large insurers, especially diversified insurers offering coverage in several lines, face a terrorism risk deductible that is significant in dollar terms.2 Nevertheless, because this reinsurance only covers TRIA deductibles and co-payments, the share of terrorism risk exposure reinsured is a fraction of what total exposure would be in the absence of the Federal backstop, for equivalent coverage. Almost 90 percent of insurers in our sample purchased some reinsurance in 2004, but only 65 percent purchased reinsurance for TRIA deductibles and co-insurance.3,4 The share of insurers purchasing reinsurance for TRIA-eligible coverage dropped from 70 percent in 2003 to 65 percent in 2004, but rose to 75 percent in early 2005. To examine the extent of use of reinsurance in different TRIA-eligible lines, insurers who provided TRIA-eligible coverage in commercial property and casualty insurance lines were asked to estimate the percent of deductible and co-payment for TRIA losses that they reinsured in each year. These results are presented in the following three figures. Insurers’ use of reinsurance for TRIA deductibles and co-payments for commercial property lines of insurance is shown in Figure 6.1. In interpreting these results it is important to note that as the TRIA deductible percentage increases through time (it was 7 percent in 2003, 10 percent in 2004 and 15 percent in 2005) a similar share of retention reinsured represents a larger dollar amount of exposure reinsured.
1 Anne Gron (1999), “Insurer Demand for Catastrophe Reinsurance,” in The Financing of Catastrophe Risk, Kenneth Froot (ed), Chicago: University of Chicago Press, 1999, pp. 23-49. 2 For example, data from NAIC on direct earned premiums in TRIA-eligible lines suggests that the 2005 TRIA deductible of some large insurers is over $2 billion. 3 The questions and answers provided on the first wave of the insurer survey, for 2002 and 2003, did not provide enough information to clearly separate insurers without any reinsurance and insurers without reinsurance for terrorism risk. 4 Reinsurance questions in the survey refer to TRIA deductible and co-payments in commercial property and casualty lines, including workers’ compensation.

- 112 -
Comparing 2003 and 2004, insurers were less likely to reinsure, and they reinsured a smaller share of terrorism risk exposure in 2004.5 However data from the first two months of 2005 suggest an increase in the use of reinsurance in commercial property lines. Our disaggregation by size, presented later in the chapter, suggests that much of the 2004 decline in reinsurance for TRIA-eligible coverage is attributable to larger insurers. This pattern of declining use of reinsurance by large insurers continued in the first two months of 2005.
Figure 6.1
Share of TRIA Deductibles and Co-Payments ReinsuredDistribution for Commercial Property Lines
01020304050
No reinsurancefor TRIA for this
line
1 to 25% 26 to 50% 51 to 75% 76 to 100%
Perc
ent I
nsur
ers
2003 2004
Note: The item non-response rate is 6 percent for 2003. Overall, the survey data suggest that while insurers reinsure a substantial portion of their retained risk, reinsurance purchases have not increased. The percentage of insurers reporting that they had no reinsurance for TRIA exposures increased between 2003 and 2004, there is a slight increase in use between 2004 and the first two months of 2005. Among insurers using reinsurance, an increasing percentage reported that they reinsured between 26 and 75 percent of their deductible and co-payment exposure, while the percentage of insurers reporting that they insured between 1 and 25 percent of their TRIA exposure declined. Fewer insurers reported that they reinsured more than 76 percent of their TRIA exposure in 2004 than in 2003; this result is analyzed further below. The use and extent of reinsurance purchased for TRIA deductibles and co-payments for other liability and casualty lines are shown in Figure 6.2. Between 2003 and 2004 the percentage of insurers using reinsurance decreased (the percentage without reinsurance increased). In the first two months of 2005 our results suggest that insurers’ use of reinsurance returned to 2003 levels. Examining the percentage of TRIA deductible and co-payment reinsured, the proportion of insurers reinsuring between 76 and 100 percent of their TRIA deductibles and co-payments declined, while the percentage of insurers with terrorism risk reinsurance for between 26 and 75 percent of their TRIA deductible and co-payment increased slightly. 5 Item non-response rates over five percent are reported explicitly throughout the chapter.

- 113 -
Figure 6.2
Share of TRIA Deductibles and Co-Payments ReinsuredDistribution for Other Liability Lines
01020304050
No reinsurancefor TRIA for
this line
1 to 25% 26 to 50% 51 to 75% 76 to 100%
Perc
ent I
nsur
ers
2003 2004
The availability of reinsurance for workers’ compensation is particularly important to insurers because coverage of terrorism risk in those policies is generally mandatory under state law. While most states approved blanket terrorism risk exclusions for other regulated commercial property and casualty policies after the September 11th attacks, states did not extend these exclusions to workers’ compensation policies. Similarly, the recently approved conditional exclusions for terrorism risk if TRIA expires do not cover workers’ compensation. The data presented in Figure 6.3 show greater use of reinsurance for the TRIA deductible and co-payment along the extensive margin (the purchase of reinsurance) as well as the intensive margin (the amount of reinsurance) in workers’ compensation policies. Between 2003 and 2004, a smaller share of insurers reported that they had no reinsurance for workers’ compensation, and a larger share of insurers reported that they reinsured between 1 and 75 percent of their deductible and co-payment exposure. Similar changes were reported between 2004 and 2005. Overall the data suggest insurers have reasonably good and improving access and ability to reinsure TRIA exposures in workers’ compensation.
Figure 6.3
Share of TRIA Deductibles and Co-Payments ReinsuredDistribution for Workers' Compensation
01020304050
No reinsurancefor TRIA for this
line
1 to 25% 26 to 50% 51 to 75% 76 to 100%
Perc
ent I
nsur
ers
2003 2004

- 114 -
Use of Reinsurance by Insurer Size In Chapter 4 we provided information on pre- and post-TRIA terrorism risk insurance coverage written by insurers in different asset size categories. Paralleling that presentation, the two figures that follow show use of reinsurance in general (Figure 6.4) and use of reinsurance for TRIA deductibles and co-payments (Figure 6.5) by insurers with less than $1 billion in assets, $1 to $10 billion in assets, and more than $10 billion in assets respectively.6
Figure 6.4
Overall Reinsurance Take-up Rates in 2004 by Total Assets
0
20
40
60
80
100
Under $1 billion $1 to 10 billion Over $10 billion
Perc
ent I
nsur
ers
Figure 6.5
Terrorism Reinsurance Take-up Rates by Total Assets
0102030405060708090
100
Under $1 billion $1 to 10 billion Over $10 billion
Perc
ent I
nsur
ers
2003 2004
The data in Figure 6.5 suggest that mid-sized insurers -- those in the $1 to $10 billion in assets range -- were the most likely to use reinsurance for TRIA exposure in 2004, followed closely by large insurers. Use of reinsurance by medium-sized insurers has been increasing through time, 6 Data from captive insurers are omitted from estimates presented by asset size class. Therefore estimates for all insurers, in Figures 6.1 through 6.3 are not directly comparable to those reported below for specific asset size classes.

- 115 -
including into 2005. Data from the first two months of 2005 suggest that small insurer use of reinsurance increased, after decreasing in 2004. In contrast, between 2003 and 2005 the use of reinsurance for TRIA exposure by the largest insurers decreased. The discussion below focuses on both the use and extent of use of reinsurance by insurers within specific lines and by insurer asset size class. The results suggest differences in the use of reinsurance across insurer size classes. Examining the extent of terrorism risk reinsurance purchased, however, we find that insurers with less than $10 billion in assets are much more likely than the largest insurers to reinsure a substantial percentage of their TRIA deductible and co-payment. Figures 6.7, 6.8 and 6.9 summarize data on insurers’ use of reinsurance for the TRIA deductible and co-payment (above the deductible), by broad insurance line and insurer size. The horizontal axis indicates the approximate amount of TRIA deductible and co-payment the insurer estimates they have reinsured while the vertical axis indicates the percent of insurers reporting reinsurance use. Figure 6.6 is for commercial property, Figure 6.7 is for other lines and liability, and Figure 6.8 is for workers’ compensation.

- 116 -
Figure 6.6
Share of TRIA-Eligible Deductibles and Co-Payments Reinsured By Insurer Asset Class: Commercial Property
Assets Less Than $1 Billion
010203040506070
No reinsurancefor TRIA for this
line
1 to 25% 26 to 50% 51 to 75% 76 to 100%
Perc
ent I
nsur
ers
2003 2004
Assets of $1 to $10 Billion
010203040506070
No reinsurancefor TRIA for this
line
1 to 25% 26 to 50% 51 to 75% 76 to 100%
Perc
ent I
nsur
ers
2003 2004
Assets Greater Than $10 Billion
010203040506070
No reinsurancefor TRIA for this
line
1 to 25% 26 to 50% 51 to 75% 76 to 100%
Perc
ent I
nsur
ers
2003 2004
Note: A missing bar indicates that no survey respondents provided an answer within the specified range. Item non-response rates for insurers with less than $1 billion in assets were eight percent in 2003 and seven percent in 2004; for insurers with $1 to $10 billion in assets item non-response was six percent in 2003.

- 117 -
Figure 6.7 Share of TRIA-Eligible Deductibles and Co-Payments Reinsured
By Insurer Asset Class: Other Liability and Casualty
Assets Less Than $1 Billion
010203040506070
No reinsurancefor TRIA for
this line
1 to 25% 26 to 50% 51 to 75% 76 to 100%
Perc
ent I
nsur
ers
2003 2004
Assets $1 Billion to $10 Billion
010203040506070
No reinsurancefor TRIA for
this line
1 to 25% 26 to 50% 51 to 75% 76 to 100%
Perc
ent I
nsur
ers
2003 2004
Assets Greater Than $10 Billion
010203040506070
No reinsurancefor TRIA for
this line
1 to 25% 26 to 50% 51 to 75% 76 to 100%
Perc
ent I
nsur
ers
2003 2004
Note: A missing bar indicates that no survey respondents provided an answer within the specified range. The item non-response rate for insurers with less than $1 billion in assets was seven percent in 2003.

- 118 -
Figure 6.8 Share of TRIA-Eligible Deductibles and Co-Payments Reinsured
By Insurer Asset Class: Workers’ Compensation
Assets Less Than $1 Billion
010203040506070
No reinsurancefor TRIA for
this line
1 to 25% 26 to 50% 51 to 75% 76 to 100%
Perc
ent I
nsur
ers
2003 2004
Assets of $1 Billion to $10 Billion
010203040506070
No reinsurancefor TRIA for
this line
1 to 25% 26 to 50% 51 to 75% 76 to 100%
Perc
ent I
nsur
ers
2003 2004
Assets Greater Than $10 Billion
010203040506070
No reinsurancefor TRIA for
this line
1 to 25% 26 to 50% 51 to 75% 76 to 100%
Perc
ent I
nsur
ers
2003 2004
Note: A missing bar indicates that no survey respondents provided an answer within the specified range.

- 119 -
In commercial property lines of insurance the use of reinsurance to diversify terrorism risks generally increased for medium insurers, but decreased among smaller and larger insurers in 2003 and 2004. Figure 6.6 shows a decline in use of reinsurance by insurers in the smallest asset size class between 2003 and 2004. Insurers in the medium, $1 to $10 billion, asset size categories increased use of reinsurance between 2003 and 2004. Data from the first two months of 2005 suggest that all small insurers have reinsurance for TRIA deductibles and co-payments in commercial property lines and use of reinsurance by medium-sized insurers also increases. There appears to be a general trend toward greater use and extent of reinsurance for terrorism risk insurance coverage in commercial property lines among insurers with less than $10 billion in assets. Conditional on having reinsurance, among smaller insurers there are substantial increases in the percentage reporting 26 to 75 percent of their exposure reinsured between 2003 and 2004. There is a slight net increase in medium-sized insurers reporting 26 to 75 percent of their exposure reinsured. Apart from the decline in the percentage of small insurers with reinsurance for 76 to 100 percent of their exposure, there appears to be a general trend toward greater extent of reinsurance for terrorism risk insurance coverage in commercial property lines among insurers with less than $10 billion in assets. In sharp contrast, there is a steady decline in the use of reinsurance for TRIA deductibles and co-payments among large insurers in commercial property lines. Among these larger insurers, use of any reinsurance for commercial property coverage declines, and among those using reinsurance the extent of coverage decreased. In 2003 a very small percentage of large insurers reported purchasing reinsurance for 51 to 75 percent of the terrorism risk insurance policies written, and none reported purchasing reinsurance for 76 to 100 percent of their deductibles and co-payments. In 2004, no large insurers reported purchasing terrorism risk reinsurance for 50 to 100 percent of their co-payment and deductible. Throughout this period the majority of large insurers purchasing terrorism risk reinsurance covered 1 to 25 percent of their deductible and co-payment, and the same is true in the first months of 2005. In other liability and casualty lines (Figure 6.7) the use of terrorism risk reinsurance between 2003 and 2004 declined among small insurers. This pattern is reversed in the 2005 data which suggest the use of reinsurance by these insurers with less than $10 billion in assets is increasing. In 2004 more than 30 percent of small and medium-sized insurers purchased reinsurance for 76 to 100 percent of their deductible and co-payment. In contrast, less than 10 percent of large insurers purchased reinsurance for 76 to 100 of their terrorism risk exposure in 2003 and 2004. Among large insurers the majority with reinsurance for TRIA deductibles and co-payments reinsure between 1 and 26 percent of their TRIA exposure. Data from the first two months of 2005 suggest the use of reinsurance by larger insurers remained largely unchanged from 2004. Finally, in workers’ compensation the data suggest a general trend towards greater use and coverage of reinsurance among insurers with less than $10 billion in total assets, as shown in Figure 6.8. Although the share of small insurers using reinsurance fell slightly between 2003 and 2004, data from the first two months of 2005 suggest use of reinsurance by small and

- 120 -
medium-sized insurers is on the rise. As in the other lines, the extent of use of reinsurance by small and medium-sized insurers with reinsurance is greater than among large insurers. More than 20 percent of small and medium insurers purchased reinsurance for 76 to 100 percent of their TRIA deductible and co-payments in 2003 and 2004. Only 5 percent of large insurers reported purchasing reinsurance coverage 76 to 100 percent of their TRIA deductibles and co-payments in 2003 and no large insurers purchased terrorism risk reinsurance for 51 to 100 percent of their deductible and co-payment in 2004, according to survey estimates. In the first two months of 2005 use of reinsurance by large insurers was largely unchanged from 2004. Overall we see that small and medium-sized insurers were much more likely, when using reinsurance, to reinsure a large share of their exposure from TRIA deductibles and co-payments. This is in contrast to large insurers who did not use reinsurance to the same degree. Reasons for Not Purchasing Reinsurance We asked insurers that sold certified coverage, but did not use reinsurance for terrorism risk, a series of questions on reasons why they chose not to purchase terrorism risk reinsurance. The surveys provided insurers with a selection of several possible reasons for not purchasing reinsurance. The responses offer some insight into the workings of the terrorism risk reinsurance market. In 2003 10 percent of insurers reported that they did not purchase reinsurance because the take-up rate among their clients was so low that they did not feel they needed reinsurance coverage; this estimate declined to 3 percent in 2004. In both 2003 and 2004, less than 5 percent of respondents reported that restrictive policy terms and conditions were the reason they did not purchase terrorism risk reinsurance. In the limited 2005 survey, nearly 10 percent of respondents cited this as a reason for not purchasing terrorism risk reinsurance. Virtually no insurers reported an inadequate amount of coverage offered as the reason to forgo reinsurance coverage. Approximately 20 percent of insurers reported they did not purchase reinsurance coverage in 2003 because the cost was too high. Only eight percent indicated that cost was one reason why they did not purchase terrorism risk reinsurance in 2004. Survey results from the first two months of 2005 suggest that, among insurers with no terrorism risk reinsurance in at least one broad line, five percent cited cost as a reason for their decision not to purchase reinsurance for their TRIA-eligible deductible and co-payment. These results may be due in part to increases in TRIA-eligible deductibles, although seasonal effects and attrition bias may also come into play. Non-Certified Reinsurance As discussed in Chapter 4, a significant number of insurers provide coverage for non-certified terrorism events. These are terrorism events that do not meet the TRIA definition of an act of terrorism and therefore would not be eligible for TRIA coverage if they occurred. As discussed in Chapter 4, non-certified coverage and the development of the non-certified market is of interest in our analysis because it may provide an insight into the development of a terrorism risk insurance market outside of TRIA, albeit one with different risk characteristics. Among insurers who wrote some non-certified terrorism risk insurance coverage, we estimate that the percentage of insurers purchasing coverage for non-certified coverage rose from 53 percent in 2003 to 56 percent between 2003 and 2004. This estimate increased to 77 percent in the first months of 2005.

Chapter 7 Terrorism Risk Insurance After TRIA As set out in Chapter 1, the Terrorism Risk Insurance Act requires the Treasury Department to assess the effectiveness of the Program and conditions in the terrorism risk insurance market at the end of the Program. In particular, TRIA specifies an evaluation of the “...likely capacity of the property and casualty insurance industry to offer insurance for terrorism risk after termination of the Program... ”1 The goal of this chapter is to present a framework and to provide evidence from our surveys and from insurance industry statistics, data, and information to inform such an assessment. Our evaluation is made with reference to the purpose of the legislation, which in part is “...to establish a temporary Federal program... in order to... allow for a transitional period for the private markets to stabilize, resume pricing of such insurance, and build capacity to absorb any future losses... ”. We evaluate the likely ability and capacity of the property and casualty insurance industry to offer insurance for terrorism risk after expiration of TRIA in terms of the general “insurability” of terrorism risk insurance and the likely provision of coverage after the expiration of TRIA. This chapter is organized as follows. In Section 7.1, we discuss developments in insurers’ ability to model and quantify terrorism loss exposure. In Section 7.2, we discuss developments in the insurance industry’s financial status since September 11th. In Section 7.3, we review evidence gathered from our surveys of insurers and policyholders. This section also discusses the implications of eliminating TRIA for insurance markets and for the economy more generally.
1 See Section 108(d) of TRIA.

- 122 -
7.1 Developments in Industry Capacity to Model Terrorism Risk In this section, we examine developments in insurers’ ability to model and quantify risks associated with terrorism. The ability of insurers to identify and quantify their risk of loss from large-scale terrorism attacks was in considerable doubt following September 11th. The survey data suggest that some insurers may have reacted to the attacks of September 11th using a very simple approach: excluding terrorism coverage for risky policyholders in 2002, but not charging lower-risk policyholders for terrorism coverage. Because insurers were re-assessing their exposure to such large-scale attacks and had experienced a shock that reduced surplus, customers in many locations considered to be at high risk throughout the nation found insurance not readily available or not affordable. Quantifying Risk The insurer makes a decision to provide coverage for a risk by comparing the revenue expected from the coverage to the costs. The revenue is the sum of premium and investment income generated from writing the coverage. The costs include the aggregate annual loss expected from the coverage, the direct and indirect expenses associated with writing, selling, and reinsuring the coverage, the cost of overhead, and the cost of holding additional surplus to protect sufficiently against the increased chance of insolvency associated with that coverage. The amount of capital or surplus held is guided most directly by the desire to maintain a good rating from the rating agencies because ratings are signals of quality to customers, regulators and financial markets, an important source of liquidity when claims volumes exceed predictions.2 Insurers seeking to ensure solvency and financial strength sufficient to maintain ratings acceptable to customers and financial markets carefully consider the range of possible losses and their probabilities. The range of losses is traditionally represented by a loss-exceedence curve, or equivalently a probable maximum loss (PML) curve. A loss-exceedence curve is a graphical depiction of the probability that losses from a peril will exceed certain amounts over a given time period, typically a year. The curves show the values and associated probabilities. The implications for solvency arise from consideration of the chances for loss and sizes of very large losses relative to the expected loss, referred to as the “tail” of the loss distribution. In order to decide how much reinsurance and surplus they want to hold, insurers consider various measures of the risk of insolvency from the tail losses. In the case of non-catastrophic risks, arising from independent attacks, the addition of more coverage from more policies increases the expectation of losses, but does not concomitantly increase the potential for outcomes that are very different from the expectation. In traditional insurance, the risk of the overall portfolio declines relative to its return, a mathematical result known as diversification. When a single attack could impact many policies at once, such as large-scale terrorism attacks or natural catastrophes, there is less diversification. Instead the insurer faces an accumulation risk. As coverage is increased in a footprint, insurers have incentives to hold more and more reinsurance and surplus to protect against insolvency. The
2 In this chapter we discuss insurers as if they are all organized as third party equity-owned corporations. Some commercial property and casualty insurers are organized as mutual insurers owned by their policyholders.

- 123 -
premium that the insurer charges for the coverage reflects not only the expected loss and expenses, but the cost of acquiring and holding the surplus. If the probabilities of high losses are quite uncertain, the insurer (and the rating agencies) does not truly know the degree of protection afforded by a given amount of surplus. Insurers hold surplus that protects against insolvency across the full range of uncertainty in the loss associated with that probability. For example, the insurer may not know with confidence whether, at a 1-in-500 probability, the loss amount, after reinsurance recovery, is $500 million or $1 billion. Modeling Terrorism Risk In order for insurance markets to operate efficiently, so that insurance is readily available and priced, insurers should be able to at least partially quantify their aggregate exposure to terrorism risk and measure and set premiums for individual customer risks. Insurers traditionally use actuarial analysis of potential losses, which examines historical information in order to derive statistical predictions of probability and severity of attacks, from which they can generate exceedence curves. In the case of catastrophic losses, including catastrophic terrorism losses, it is widely accepted that this approach is not feasible; there is simply not enough historical data to make accurate predictions. Instead insurers attempt utilize models of these risks, using scientific information – when they have it. There are two components to modeling: identifying and quantifying the severity of the insurers’ losses based on assumed risks and assessing the probability the loss will occur. When information is scarce, they may rely on the judgments of experts, but the results are subjective and have not been proven. Three major risk-modeling firms - EQECAT, Risk Management Solutions (RMS), and Applied Insurance Research (AIR) - have developed terrorism risk models and are actively researching terrorism risk modeling. The development of modeling by these firms has occurred in stages.3 The first stage was accumulation assessment. Accumulation assessment identifies and quantifies exposure concentration around potential terrorist targets, often within a simple circle based on the blast center of a conventional truck bomb. The identification of large accumulations allows the insurer to limit the amount of new business it writes in that area. The collection of data reporting locations and engineering characteristics of individual buildings within urban locations has made possible the development of deterministic modeling, an advance from accumulation analysis. Deterministic modeling imposes an attack’s damage “footprint” at a specified target in order to predict a weapon’s ability to do damage to the specific surroundings of a given target. Deterministic modeling is much more discriminating than the circle approach; a simple circle does not include the complex interaction of a weapon’s impact with the urban environment. The models can provide predictions of property losses at the ZIP code level and even by individual locations, allowing for risk differentiation within urban centers and between urban and other locales. Modelers have also made progress in measuring concentrations of workers’ compensation and business interruption risk, although these are harder to measure than property damage. Using this data, models can calculate the probability of damage being done to the terrorist target as well 3 John Tedeschi et al, “Terrorism Modeling,” Guy Carpenter, December 2004.

- 124 -
as to the surrounding buildings. The deterministic methodology, in effect, reduces the overall capacity problem to a series of questions answerable by engineering, chemical, and biological sciences, in which some core results are reasonably well established.4 Recent advances in deterministic modeling include client-based accumulation measurement and the ability to calculate the PML of entire areas, making possible risk assessments for more venues and scenarios. For example, modeling firms offer computer programs to calculate accumulations from multiple financial perspectives, including gross, net, and reinsurance costs. This software offers a total assessment of the possible damages to a specific location in the event of a major terrorist attack. The software will flag any location that exceeds the maximum accumulation thresholds for the given policy. This feature allows insurance companies to evaluate whether or not they can even offer coverage to businesses with high levels of exposure accumulation. The final refinement, probabilistic modeling, is an important factor in pricing terrorism risk insurance. The models all rely on subjective recommendations from terrorism experts to help determine the probabilities of attacks. Some include refinements such as game theoretic approaches which attempt to parameterize the terrorists’ strategic behavior and adaptive response to deterrence activity at specific targets in light of their goals and resources. Other models use a Delphi method, in which the opinions of experts are statistically combined into probability distributions. In the Delphi method, the experts analyze the possible types of attacks by terrorists and then decide which targets “present the lowest technical, logistical, and security barriers to (terrorist) mission success.”5 They then assign a probability to the location and the scenario. The Impact of Subjectivity Because of the difficulty inherent in assessing the probability of attack, use of terrorism predictive models is tempered by the large degree of uncertainty in their predictions. Comparative studies show that the three leading models yield strikingly different predictions. Figure 7.1 illustrates the magnitude of differences between two modelers’ predictions of workers’ compensation losses to which the insurance industry is exposed from all terrorist attacks. The figure shows that the predicted losses differ by more than 450 percent for the 100 year return period. Return period is the inverse of probability. For example, a 100 year return period corresponds to an attack with annual probability of 1-in-100 or 1 percent. According to one study, the primary reason the results differ so dramatically is that the models assign different probabilities to particular types of terrorism attacks, and there is no reliable basis for determining which one is right.6
4 Gordon Woo, “The Evolution of Terrorism Risk Modeling,” RMS Ltd., April 22, 2003. 5 “RMS Unveils Game Theory-Based Terrorism Risk Model,” Insurance Journal, September 2002. 6 Towers Perrin, “Workers’ Compensation Terrorism Reinsurance Pool Feasibility Study,” 2004, pp. 23-24.

- 125 -
Figure 7.1
Industry WC Loss By Return Period
05
101520253035404550
100 250 500Return Period (Years)
Mod
el L
oss (
$B's)
Model A Loss ($B)'s Model B Loss ($B)'s
Return period is the inverse of probability. For example, a 100 year return period corresponds to a 1-in-100 event with annual probability of 1 percent. Graph from presentation by Tim Tetlow, AXIS Specialty Limited, at the May 2005 Casualty Actuarial Society Meetings. The authors of the workers’ compensation study noted above conclude that the terrorism loss models can provide an order-of-magnitude indication of the size of potential terrorism losses. It is clear that today the losses of specific attacks are not known with certainty, and the probabilities assigned to attack occurrences are speculative.7 There are large differences even when the attack and the location are held constant across models. Predictions of property damage and workers’ compensation losses for a specific terrorism event for a specific building in New York vary similarly by 200 to 300 percent, suggesting that, even with the probability problems removed, the engineering assumptions for specific sites differ.8 The disparities in terrorism risk models are much greater than those for earthquakes or hurricanes.9 As long as model predictions differ so significantly and there is no reliable basis for determining which is more accurate, model users understandably assign a wide uncertainty to a model’s predicted outcomes. This degree of uncertainty is particularly important to users with greater exposure to the tails of the loss-exceedence curve predictions. The probability predictions for these attacks tend to be more uncertain than those of the lower loss portions of the loss-exceedence curve because they are heavily influenced by expert opinion and because differences among model predictions are larger for these attacks. Reinsurers, who typically insure the tails of loss distributions, have potentially even greater exposure to the uncertainties of the modeling.10 Furthermore, the availability of data enabling reinsurers to measure aggregations of risk in their portfolios of contracts with insurers has lagged behind that for insurers.11
7 Towers Perrin, “Pool Feasibility Study,”Ibid., p. 25. 8 Based on consultation with reinsurance industry representatives, May 2005. 9 Based on consultation with insurance industry broker representatives, April 2005. 10 Kenneth Froot, “Risk Management, Capital Budgeting, and Capital Structure Policy for Insurers and Reinsurers,” NBER Working Paper 10184, December 2003. 11 Based on consultation with reinsurance industry representatives, May 2005, and presentation by Tim Tetlow, AXIS Specialty Limited, at the May 2005 Casualty Actuarial Society Meetings; and Daniel Wolak et al, “Pricing for

- 126 -
Remaining Challenges The industry has clearly made progress in identifying aggregate exposure by location to estimate exposure to losses from physical damage. It has also made considerable progress in tracking aggregates of employees down to the level of individual locations to estimate exposure to workers’ compensation losses. Modelers have created and implemented sophisticated probabilistic loss estimates that are said to take account of terrorists’ shifting goals and strategies. Insurers writing coverage for high risk exposures are able to use multiple methods of assessing and managing terrorism risk. The critical challenge for catastrophic terrorism modeling, and the difficulty that distinguishes it from earthquake, hurricane, and other catastrophic modeling, is developing a quantitative, objective understanding of terrorist behavior. In order to effectively model the probability of terrorist attack – including identifying targets, estimating frequency of attacks, and forecasting attack size – modelers may need to be able to understand terrorists’ motivations, goals and resources, be they so-called foreign or domestic terrorists. In addition, modelers may need to understand terrorists’ adaptive reactions - changes in their methods and approaches - in response to improved deterrence. To the extent that these elements can be understood and parameterized mathematically, the use of subjective expert judgment, on which the models now rely, can be minimized. Other issues include predicting the spatial clustering of terrorist incidents, such as whether an attack in a particular location makes subsequent attacks more likely to take place nearby12 and in developing the ability to take into account mitigation efforts, such as existing and proposed security measures for a new location. An additional challenge for modeling the effects of nuclear, biological, chemical and radiological attacks is refining the modeling of the dispersion of the agents of these attacks, including incorporating the effects of weather and terrain on wind-borne contaminants, and simulating the effects of response in treating, quarantining and protecting populations exposed to outbreaks of disease agents.
Terrorism Risk in Group Life, Group Health, and Group Disability Products,” Section 23PD, Presentation at Society of Actuaries Spring Meeting 2003. 12 "Spatial and Temporal Determinants of Terrorism Risk,” Research Projects, RAND Center for Terrorism Risk Management Policy, www.rand.org/multi/ctrmp/projects/determinants_terrorism_risk.html, accessed June 2005.

- 127 -
7.2 Growth in Insurer Financial Capacity An insurer’s capacity to write coverage is limited to the maximum coverage it could provide, while retaining its ability to meet current and future obligations to its base of policyholders. The ability to meet its obligations is determined by its financial strength, which incorporates both balance sheet strength and operating performance, because a strong operating performance is needed to maintain balance sheet strength.13 The balance sheet strength is measured by the level of the insurer’s surplus, taking into consideration the exposure of surplus to losses from policyholder claims in relation to premiums it is charging, as well as other broad categories of risk to which the insurer is exposed. In this subsection we examine the financial strength of the insurers writing coverage in the TRIA lines. Below we briefly summarize a few measures of balance sheet strength and operating strength and implications, making 3rd quarter to 3rd quarter comparisons14 from 1999 to 2004. The purpose of the analysis is to assess the industry’s rebuilding since the September 11th terrorist attacks. We compare the latest available financial measures to their values at the inception of the loss shock induced by the September 11th terrorist attacks. The industry’s recovery from a loss shock follows a recognizable pattern or loss cycle. The effects of shocks and subsequent recoveries – insurance cycles – have been the subject of study by academic researchers.15 A general result is that insurers respond to a sudden loss of surplus caused by a large unexpected loss by contracting their underwriting, particularly in the affected lines, followed by slowly rebuilding the lost capital from earnings, as well as by raising (more costly) external capital. If the unexpected loss shock causes insurers to re-evaluate their understanding of the risk, then supply may be reduced even further, until insurers’ underwriting rules and procedures are revised to reflect their new understanding of the risk. The reduction in supply of coverage results in price increases. Price can be subject to additional upward pressure if the demand for insurance also rises as policyholders revise their expectations regarding their need for coverage upward. If there are no subsequent unexpected large losses, capital is replenished by profits from the higher prices. If the price spike is sufficiently severe, so that profits exceed the additional costs of raising external capital, external insurance capital enters as well. As a result, quantities supplied rise and prices moderate.16
13 This exposition of measures of balance sheet and operating strength is taken broadly from “Best’s Insurance Reports - Property/Casualty Edition,” 2004. 14 The quarterly data are the most recently available data. The data represent 12 month cumulative totals from the 3rd quarter of the previous year. 15 Recent studies include Gron, “Capacity Constraints and Cycles in Property-Casualty Insurance Markets,” The RAND Journal of Economics, Vol. 25, No. 1 (Spring 1994), Lai et al, “Great (And Not so Great) Expectations: An Endogeneous Economic Explication of Insurance Cycles and Liability Crises,” Journal of Risk and Insurance, Vol. 67, No. 4 (December 2000), pp. 617-652; Cummins and Doherty, “Federal Terrorism Reinsurance: An Analysis of Issues and Program Design Alternatives,” Wharton, Draft, December 7, 2001; Doherty, Lamm-Tennant and Starks, Ibid. 16 Additional difficulties may face insurers with a concentration in workers’ compensation. State laws do not permit insurers to avoid writing coverage, and, in addition, may closely regulate its price.

- 128 -
Our analysis only includes the insurance companies and groups writing coverage in the TRIA-eligible lines. As noted in Chapter 4, this is a large portion of the industry. Surplus is an important measure of an insurer’s ability to withstand loss because it is the ultimate source of claims-paying ability. Figure 7.2 shows the growth in policyholders’ surplus for the insurers writing coverage in the TRIA-eligible lines. As the figure shows, surplus has been rebuilt since September 11th: the increase from 3rd quarter 2001 to 2004 is about 33 percent. Surplus is in fact higher than during any time over the past five years. This is likely to be the result of the higher prices during the recent hard market, which has generated substantial amounts of premium revenue.
Figure 7.2
Policyholders' Surplus by Quarter All Insurers Providing Coverage in TRIA-Eligible Lines
050
100150200250300350400
Q1 Q2 Q3 Q4 Q1 Q2 Q3 Q4 Q1 Q2 Q3 Q4 Q1 Q2 Q3 Q4 Q1 Q2 Q3 Q4 Q1 Q2 Q3
1999 2000 2001 2002 2003 2004Quarter
Surp
lus
($bi
llion
s)
Source: A.M. Best We next examine ratios that measure financial strength. To examine whether there were differences in performance by size and markets, we categorize the insurers by size in the same way as we did in Chapter 2. All insurer groups writing more than $10 million in premiums in the TRIA-eligible lines were assigned to categories, defined by ranking by direct written premiums that broadly reflect the range of markets they serve. These categories are as follows: ● Top 25 Insurers – comprised of large national insurer groups generally writing in most or all
states. ● Insurers 26 to 50 – Approximately half national insurer groups, half large regional insurer
groups, including some specialty writer groups. ● Insurers 51 to 75 – Predominantly mid-size regional insurer groups. ● Insurers 76 to 100 – Predominately smaller regional groups and some large groups providing
insurance in only one or two states. ● Insurers 101 + – Remaining insurer groups, mainly providing coverage in one or two states. Comparison of current premiums with surplus is an important measure of ability to bear unanticipated loss relative to loss that has been priced for in the underwriting process. All else equal, a higher premiums-to-surplus ratio signals lower ability to bear unexpected losses. Figure

- 129 -
7.3 shows the premiums-to-surplus ratio from 3rd quarter 2000 to 3rd quarter 2004 for the insurers writing in the TRIA-eligible lines. As the figure shows, the ratio was at its highest in 2002, because premium growth outpaced surplus growth over that time, due to the increased prices; the ratio declined only slightly by 2003 and declined by a greater amount over 2004, because of the growth in surplus and the weakening of price growth.
Figure 7.3
Net Premiums to Surplus
0.0
0.5
1.0
1.5
2.0
1-to-25 26-to-50 51-to-75 76-to-100 101-to-End Total
Category
Rat
io
2000 2001 2002 2003 2004
Net premiums are after adjustment for reinsurance. Total refers to the total industry providing coverage in the TRIA-eligible lines. Source: A.M. Best. The risk-based capital (RBC) ratio, the ratio of total adjusted capital to required risk-based capital, is an alternative measure of risk-bearing ability. The RBC ratio compares surplus directly to measures of risk. Risk-adjusted surplus is surplus after applying NAIC statutory subtractions to an insurer’s surplus. Risk-based capital is the amount of capital required to support the three broad risk categories identified by the NAIC: underwriting risk, investment risk, and credit risk. Insurance regulators use RBC ratios to assist in assessing whether a company has sufficient capital to absorb the risk of losses and remain solvent. Regulators have defined a series of trigger capital levels, such that, if an insurer’s total adjusted capital dips below one of the trigger levels, the regulator may take certain actions. In particular, the minimum trigger level, the authorized control level RBC, is a signal of solvency concern; that is, if a company’s total adjusted capital falls to this trigger (RBC ratios of 100 percent or less), the company’s solvency is in question. Such a company may be placed under the control of the regulator. Figure 7.4 shows the RBC ratio for all the companies writing commercial property and casualty insurance over the period year end 1999 to 2003.17 As the figure shows, the ratio was at a low point during 2001 to 2002, but the sector had rebuilt its risk-based capital to some extent by 2003.
17 In contrast to the data for the other graphs, pertaining to the insurer group of which the insurer writing coverage in TRIA lines is a component, this ratio is specific to individual companies. The categories shown in Figure 7.4 are developed from rankings of individual companies. The figure compares year-end data because the latest available data from the NAIC was year-end 2003.

- 130 -
Figure 7.4
Regulatory Capital Adequacy Risk-Adjusted Surplus as a Multiple of Authorized Control Level Risk-Based Capital
012345678
1-to-25 26-to-50 51-to-75 76-to-100 101-to-End TotalCategory
Rat
io
1999 2000 2001 2002 2003
Source: NAIC The performance of this ratio is suggestive of ability to bear additional risk because it demonstrates that insurers have capital in excess of that required for known risks, which could be used to absorb losses from a terrorist attack without pulling the insurers below regulatory solvency minimums. This suggests that insurers could absorb some losses from unexpected terrorist attacks without having capital reduced below regulatory required minimums. However, the risk-adjustment formula for the required capital is not geared specifically to the loss or associated costs from terrorist attacks, so it does not take into account the capital needed to protect the insurer’s policyholders from subsequent losses from terrorism attacks. Also the value of the insurer’s investment portfolio may drop following a terrorist attack, lowering the insurer’s liquidity and, hence, its claims-paying ability until markets recover. The combined ratio measures the ability to generate profits from underwriting. It compares an insurer’s losses and expenses to premiums. A combined ratio of 90 percent leaves an underwriting profit of 10 percent. A ratio above 100 indicates that losses and expenses exceed premiums and there is an underwriting loss. This has often been the case, because insurers counted on investment income to generate a portion of overall revenues with which to cover losses and expenses. Figure 7.5 shows the changes in combined ratio from 3rd quarter 2000 to 3rd quarter 2004.

- 131 -
Figure 7.5
Combined Ratio
0
20
40
60
80
100
120
140
1-to-25 26-to-50 51-to-75 76-to-100 101-to-End Total
Category
Rat
io2000 2001 2002 2003 2004
Source: A.M. Best As the figure shows, combined ratios of all categories were above 100 from 2000 to 2002, and especially in 2001. In 2003 and 2004, however they are all very close to, or less than, 100 percent, again suggesting that insurers have quickly rebuilt underwriting profitability. The return on surplus is the profitability from both the insurer’s underwriting and investment activity, including unrealized capital gains. It is thus an overall measure of the insurer’s ability to generate business and add to capacity. Figure 7.6 shows the returns on surplus from 3rd quarter 2000 to 3rd quarter 2004.
Figure 7.6
Return on Surplus
-30
-20
-10
0
10
20
1-to-25 26-to-50 51-to-75 76-to-100 101-to-End TOTAL
Category
Rat
io
2000 2001 2002 2003 2004
Source: A.M. Best As the figure shows, overall returns for these insurers were negative in 2001 and 2002, but recovered considerably in 2003 and again in 2004, reflecting the recovery in underwriting profitability and the gains in investment return.

- 132 -
7.3 Terrorism Coverage Post-TRIA We note at the outset that the potential insurance market outcomes immediately after the expiration of TRIA (short term) may differ from the longer-term outcomes in the terrorism insurance market without the Federal backstop. The discussion in this section is focused on the immediate impact of removing TRIA, and should not be interpreted as an assessment of longer-term outcomes. Survey Results and Implications The results of the surveys described in Chapters 4, 5, and 6 lead us to conclude that terrorism risk in much of the country is now and has been broadly insurable and that it is partially insurable even for attacks that could lead to large losses. We briefly restate the main results of the insurer, policyholder and reinsurance analyses. Terrorism risk insurance capacity has increased Even as the TRIA deductible has risen over time (increasing the private market’s exposure), terrorism risk insurance take-up has continued to increase and insurers have written coverage on a similar or greater share of policies. Moreover insurer surplus, a major source of insurer capacity to write coverage, has exceeded pre-September 11th levels. Insurers are increasingly pricing terrorism risk insurance Fully 70 percent of policyholders with terrorism risk insurance in 2002 reported that they received coverage at no cost. Only 42 percent of policyholders in 2003 and 37 percent of policyholders in 2004 reported receiving free terrorism coverage. This decline in free terrorism risk insurance was observed as well for policyholders with locations in high risk areas. In the cities deemed as facing high risk of terrorism attack, more than 50 percent of policyholders received coverage at no cost in 2002, but less than 30 percent received free coverage in 2004. The insurer survey shows that coverage for terrorism risk was provided without an explicit price by more than 75 percent of insurers in 2002, 46 percent in 2003 and about 40 percent in 2004. Insurers reinsure a substantial portion of their retained risk, but reinsurance purchases have not increased Our survey results do not allow us to compare reinsurance purchases pre- and post-TRIA. The results do show that reinsurance is available and purchased, for a sizable portion of the retained risk. Seventy percent of insurers purchased reinsurance for TRIA-eligible risks in 2003. The results also indicate, however, that over the time period covered by our study, purchases of reinsurance have remained relatively flat.

- 133 -
Expiration of TRIA - Potential Insurance Market Outcomes TRIA provides publicly-subsidized reinsurance, essentially transferring risks associated with terrorism losses from the private to the public sector. Because TRIA was established as a temporary program, there is likely a range of expectations in the private market about the timing of its expiration. We should expect a general response not when TRIA actually expires, but rather when the market has fully internalized that TRIA will expire. We therefore evaluate the market response to a general expectation that TRIA will expire. We assess capacity in terms of the financial strength of insurers and reinsurers, which incorporates both balance sheet strength and operating performance. The range of market responses, including the amount of terrorism risk insurance coverage that is likely to be written, will vary over time. As such, the particular industry response immediately after the expiration of TRIA may differ from the long term response. In any given period, however, the amount of insurance and reinsurance written will likely be related to the amount of surplus held by insurers and reinsurers. Data from the industry show that total surplus of insurer groups (including U.S. authorized reinsurers) writing in TRIA-eligible lines was $373 billion at 3rd quarter 2004, $211 billion of which was surplus of the top 25 insurer groups. Not all this surplus is exposed to terrorism risk because not all insurers would be affected by a large terrorist attack. We consider the impact of a terrorist attack causing $50 to $60 billion in losses, substantially more than those of September 11th,18 and affecting the majority of insurers. Under assumptions about the distribution of losses in the market, such a very large attack could reduce surplus of insurers and reinsurers by 20 to 25 percent. Discussions with A.M. Best indicate that loss exposure to natural catastrophes significantly above 10 percent of surplus may raise ratings agency concerns. The degree of that agency’s concern depends on an insurer’s financial strength, ability to replace capital, and exposure to large scale attacks. The experience with natural catastrophe risk underwriting and assignment of agency ratings suggests that in order to avoid ratings downgrades, insurers may significantly alter their approach to terrorism risk insurance, once they are certain of TRIA’s expiration.19 Reinsurers are likewise sensitive to the risk of ratings downgrades. Insurers typically limit reinsurance purchases to reinsurers with at least A-ratings, and reinsurance contracts often contain cancellation clauses triggered by ratings downgrades or reductions in reinsurer surplus.20
18 We consider losses of this size because terrorist attacks causing such losses are possible, hence may be considered in determinations of the level of coverage to be offered. 19 Moody's also sees a rating impact potential should an insurer’s exposure to losses from terrorist attacks be more than 10 percent of policyholder surplus. Moody's is encouraging insurers with more than 10 percent of policyholder surplus so exposed to limit terrorism accumulations, use terrorism exclusions and purchase reinsurance or explore other risk transfer options. See James Eck et al, “Terrorism Risk Remains Material for Insurers as TRIA Expiration Looms,” Moody’s Special Comment, June 2005. 20 Benfield Group Limited, “Outrageous Fortune: Reinsurance Market and Renewals Review,” January 2005, 13-15.

- 134 -
Without the subsidized reinsurance provided by TRIA, several options are available to insurers to avoid the prospect of ratings downgrades: (1) continue to provide the same coverage but at higher market prices, and purchase additional reinsurance21 or raise capital to accommodate this coverage; (2) limit exposure (coverage); or (3) a combination of these responses. Overall, our assessment is that the immediate effect of the removal of the TRIA subsidy is likely to be less terrorism insurance written by insurers, higher prices and lower policyholder take-up. States have granted insurers conditional exclusions for terrorism risks after the expiration of TRIA. About half of all insurers report that on policies written in the first months of 2005 they do provide coverage that is comparable to TRIA-subsidized coverage for the term of the contract after the expiration of TRIA (i.e., the first months of 2006). Similarly, three quarters of policyholders report that their coverage begun in 2005 includes comparable terrorism coverage for the term of the contract after the expiration of TRIA. Consistent with our survey data, industry observers expect that some insurers will use these exclusions. Recent insurance broker reports of contract renewals post-TRIA confirm our survey results.22 Brokers report that some insurers are capping their loss exposure by writing separate limits on losses due to TRIA attacks and by applying aggregate limits to their exposure in locales thought to be at specific risk. Over time, we expect that the private market will develop additional terrorism insurance capacity. We anticipate that the initial response of premiums in the market will spur the buildup of surplus as insurers tap into capital markets; the development of private reinsurance and other risk-shifting mechanisms23; and additional mitigation and terrorism deterrence efforts by policyholders.
21 Non-authorized reinsurers, which are not included in the data used in the assessment, could reportedly offer some $5 billion or more of additional capacity at higher prices. (Treasury meeting with reinsurers and representatives of the Reinsurance Association of America, March 2005.) 22 April 2005 discussions with Edward Ryan, Aon; Jill Dalton and Steven Lundin, Marsh; Roderick Thaler and others, Willis. 23 After September 11th five new Bermuda reinsurers with capital of $6.4 billion (2001) were formed to take advantage of the hard markets. There is also interest by hedge funds in catastrophe reinsurance. Because these funds seek investments with quantifiable risks, uncorrelated with their existing portfolios, it is not clear how much capital they may make available over the longer term for terrorism risk reinsurance. See Benfield, “Outrageous Fortune,” Op. Cit., pp. 18-19.

- 135 -
Absence of Macroeconomic Effects Reaching firm, precise quantitative conclusions about the macroeconomic effects of providing subsidized terrorism insurance is, quite likely, impossible. Economic decisions concerning business investment, location of production plants, and individuals’ residential choices may well be influenced by the threat of terror activity for some time to come. Activities in high-risk areas may be reduced or, more likely, shifted. For example, manufacturing plants and office buildings may be located further from central cities. Such relocation may then stimulate economic activity in outlying areas. Moreover, industries and occupations engaged in security-enhancing activities may also be stimulated. An important factor impacting all such decisions will be the cost of insurance. As discussed in Chapter 2, in late 2001 and 2002, there was concern that there could be macroeconomic effects associated with the transition between a world in which terrorism coverage was provided for a negligible price and one where terrorism risk was considered a non-negligible risk. The economic climate during the discussion of TRIA and its enactment was highly uncertain. Industrial production had peaked in mid-2000, and by September 2001 had already fallen more than 5 percent. The terrorist attacks of September 11th created macroeconomic uncertainties that most analysts believed would translate into a further sharp downturn in economic activity that would last at least two additional quarters. Nonresidential building activity tumbled about 33 percent at an annual rate in the fourth quarter of 2001, and continued to experience declines well in excess of 15 percent in the subsequent three quarters. It was difficult at the time to assess whether the substantial declines in nonresidential building were due to the chilling effect of terrorist activity, terrorism insurance issues or the result of a cumulative unwinding of activity more typical of a recession. Helped by tax cuts and monetary stimulus, the economy has since improved substantially. GDP growth rose from just 2.3 percent in 2002 to 3.9 percent in 2004 (fourth quarter over fourth quarter). The unemployment rate, which was 6 percent in December 2002, fell to 5.1 percent in May 2005. Despite the rising economy and the enactment of TRIA, nonresidential building has rebounded only slightly. Nonresidential building is currently 4.2 percent higher than the trough reached in the first quarter of 2003, but remains substantially below the previous peak. From our current perspective it appears that neither the potential lack of terror risk insurance nor a general economic downturn were responsible for weakness in nonresidential building activity. In any case, nonresidential building is only 2.2 percent of GDP, and commercial office construction is only 12.2 percent of the nonresidential building total. When the economy is fragile, concerns over weakness even in very small sectors of the economy (nonresidential construction) can loom large, and appropriately so. Such concerns recede as the economy strengthens. Given the small size of nonresidential and commercial office construction, stimulating this sector (whether through TRIA or otherwise) would be neither effective nor warranted.


