TRIAXIAL COMPRESSION FOR DISTURBED SOILS AND BASE MATERIALS TXDOT DESIGNATION: TEX-117-E CONSTRUCTION DIVISION 1 – 22 08/02–12/09 Test Procedure for TRIAXIAL COMPRESSION FOR DISTURBED SOILS AND BASE MATERIALS TxDOT Designation: Tex-117-E Effective Dates: August 2002–December 2009 . 1. SCOPE 1.1 This method determines the shearing resistance, water absorption, and expansion of soils and/or soil-aggregate mixtures. 1.2 The values given in parentheses (if provided) are not standard and may not be exact mathematical conversions. Use each system of units separately. Combining values from the two systems may result in nonconformance with the standard. 2. DEFINITIONS 2.1 Triaxial Test—The triaxial test is one in which stresses are measured in three mutually perpendicular directions. 2.2 Axial Load—Axial load is the sum of the applied load and the dead load (including the weight of the top porous stone, metal block and bell housing) applied along the vertical axis of the test specimen. 2.3 Lateral Pressure (Minor Principal Stress)—Lateral pressure is the pressure supplied by air in the triaxial cell, applied in a radial or horizontal direction. 2.4 Axial (Major Principal Stress)—The axial load divided by the average area of the cylindrical specimen. 2.5 Strain—Strain is the vertical deformation of the specimen divided by the original height, often expressed as a percentage. 2.6 Mohr’s Diagram—Mohr's diagram is a graphical construction of combined principal stresses in static equilibrium. 2.7 Mohr’s Failure Cycle—Mohr's failure circle is a stress circle constructed from major and minor principal stresses of the specimen at failure. 2.8 Mohr’s Failure Envelope—Mohr's failure envelope is the common tangent to a series of failure circles constructed from different pairs of principal stresses required to fail the material. The envelope is generally curved, its curvature depending on the factors related to the characteristics of the material. Texas Department of Transportation
Transcript
TRIAXIAL COMPRESSION FOR DISTURBED SOILS AND BASE MATERIALS TXDOT DESIGNATION: TEX-117-E
CONSTRUCTION DIVISION 1 – 22 08/02–12/09
Test Procedure for
TRIAXIAL COMPRESSION FOR DISTURBED SOILS AND BASE MATERIALS
TxDOT Designation: Tex-117-E
Effective Dates: August 2002–December 2009.
1. SCOPE
1.1 This method determines the shearing resistance, water absorption, and expansion of soils and/or soil-aggregate mixtures.
1.2 The values given in parentheses (if provided) are not standard and may not be exact mathematical conversions. Use each system of units separately. Combining values from the two systems may result in nonconformance with the standard.
2. DEFINITIONS
2.1 Triaxial Test—The triaxial test is one in which stresses are measured in three mutually perpendicular directions.
2.2 Axial Load—Axial load is the sum of the applied load and the dead load (including the weight of the top porous stone, metal block and bell housing) applied along the vertical axis of the test specimen.
2.3 Lateral Pressure (Minor Principal Stress)—Lateral pressure is the pressure supplied by air in the triaxial cell, applied in a radial or horizontal direction.
2.4 Axial (Major Principal Stress)—The axial load divided by the average area of the cylindrical specimen.
2.5 Strain—Strain is the vertical deformation of the specimen divided by the original height, often expressed as a percentage.
2.6 Mohr’s Diagram—Mohr's diagram is a graphical construction of combined principal stresses in static equilibrium.
2.7 Mohr’s Failure Cycle—Mohr's failure circle is a stress circle constructed from major and minor principal stresses of the specimen at failure.
2.8 Mohr’s Failure Envelope—Mohr's failure envelope is the common tangent to a series of failure circles constructed from different pairs of principal stresses required to fail the material. The envelope is generally curved, its curvature depending on the factors related to the characteristics of the material.
Texas
Department
of Transportation
TRIAXIAL COMPRESSION FOR DISTURBED SOILS AND BASE MATERIALS TXDOT DESIGNATION: TEX-117-E
CONSTRUCTION DIVISION 2 – 22 08/02–12/09
3. APPARATUS
3.1 Apparatus, used in Tex-101-E, Tex-113-E, and Tex-114-E.
3.2.1 Base Material, 6.75 in. (171.5 mm) inside diameter (I.D.) and 12 in. (304.8 mm) in height.
3.2.2 Subgrade, 4 1/2 in. (114.3 mm) I.D. and 9 in. (228.6 mm) in height; fitted with standard air valve and tubular rubber membrane 6 in. (152.4 mm) in diameter.
3.3 Aspirator or other vacuum pump.
3.4 Air compressor.
3.5 Load frame and assembly.
3.6 Pressure regulator, gauges, and valves, to produce lateral pressure in curing and testing.
3.7 Equipment to measure deformation of specimen, accurate to 0.001 in. (0.025 mm).
3.8 Axial load measuring device, calibrated in accordance with Tex-902-K.
3.9 Circumference measuring device, accurate to 0.05 in. (1.0 mm).
3.10 Lead weights, for surcharge loads.
3.11 Pans, curing, at least 2 in. (51 mm) deep, with porous plates.
4. TEST RECORD FORMS
4.1 Record test data on:
Form 1964, 'Triaxial Compression Test Capillary Wetting Data'
Form 1176, 'M/D Triaxial Test Worksheet'
Form 1062, 'Triaxial Test Data Sheet'
4.2 After tests and calculations are completed, summarize results on:
TRIAXIAL COMPRESSION FOR DISTURBED SOILS AND BASE MATERIALS TXDOT DESIGNATION: TEX-117-E
CONSTRUCTION DIVISION 3 – 22 08/02–12/09
PART I—STANDARD TRIAXIAL COMPRESSION TEST
5. PROCEDURE
5.1 Determine optimum water content and maximum dry density of the material and molding of the triaxial test specimens, in accordance with Tex-113-E and Tex-114-E.
5.2 Mold seven specimens at optimum moisture and maximum dry density for base and sub-base materials.
5.2.1 For fine-grained sub-grade soils, mold six specimens at optimum moisture and maximum dry density.
5.2.2 These specimens should be 6 in. (152.4 mm) in diameter and 8 in. (203.2 mm) in height ± 0.25 in. (6.4 mm) or 4 in. (101.6 mm) in diameter and 6 in. (152.4 mm) in height using a straight edge to strike off the top and bottom.
5.2.3 These specimens should be wetted, mixed, molded, and finished as nearly identical as possible.
5.2.4 Identify each test specimen by laboratory number and specimen number.
5.3 Immediately after extruding the specimens from the molds, enclose the specimens in triaxial cells, with top and bottom porous stones in place, and allow all the specimens to remain undisturbed at room temperature until the entire set of test specimens has been molded. Record data on the 'M/D Triaxial Worksheet,' Form 1176.
Note 1—When a different compactive effort is desired, a complete new M/D Curve and test specimens must be molded.
5.4 After the entire test set has been completed, remove the triaxial cells. Described below are the appropriate dry curing procedures for various material types. Dry cure the specimens according to the type of material to avoid excessive cracking which will damage the specimen.
5.4.1 For flexible base materials and select granular soils with little or no tendency to shrink:
5.4.1.1 Place specimens in the oven air dryer and remove 1/3 to 1/2 of the molding moisture content at a temperature of 140°F (60°C). (This will require three to six hours, depending on the material, the optimum moisture content, and the load of other wet material in the oven).
5.4.1.2 Allow the specimens to return to room temperature before preparation for and subjection to capillarity.
5.4.2 For very plastic clay sub-grade soils that crack badly if subjected to large volume changes during shrinkage:
TRIAXIAL COMPRESSION FOR DISTURBED SOILS AND BASE MATERIALS TXDOT DESIGNATION: TEX-117-E
CONSTRUCTION DIVISION 4 – 22 08/02–12/09
5.4.2.1 Air dry these soils at room temperature, inspecting specimens frequently by looking at the sides of the specimens and raising the top porous stones to examine the extent of cracking at the top edges of the specimens.
5.4.2.2 When these cracks have formed to a depth of approximately 1/4 in. (6.4 mm), replace the triaxial cell and prepare the specimens for capillary wetting.
5.4.3 For moderately active soils that might crack badly if placed in an air dryer for the full curing time:
5.4.3.1 Dry at 140°F (60°C) and check frequently for the appearance of shrinkage cracks.
5.4.3.2 If cracks appear, examine the extent of cracking as described above, and allow some air-drying at room temperature during the cooling period before enclosing specimens in cells.
5.5 The specimens are now ready to be prepared for capillary wetting:
5.5.1 Do not change the porous stones or remove them until the specimens have been tested.
5.5.2 Weigh each specimen and its accompanying stones and record the mass.
5.5.3 Cut a piece of filter paper to 10 x 20 in. (254 x 508 mm), fold into 5 x 20 in. (127 x 508 mm), and make several cuts with scissors (Jack-o-lantern fashion). These cuts will prevent any restriction by the paper.
5.5.4 Unfold the filter paper and wrap it around the specimen and stones so the cuts are parallel with the length of the specimen, allowing the bottom of the paper to be near the bottom of the bottom porous stone, and fasten with a piece of tape.
5.5.5 Replace cell by applying a partial vacuum to the cell, deflating the rubber membrane, then place the cell over the specimen and release the vacuum.
5.6 Transfer the specimens to the damp room or temperature controlled environment and place them into the rectangular pans provided for capillary wetting. Adjust the water level on the lower porous stones to approximately 0.5 in. (12.5 mm) below the bottom of the specimens. Add water later to the pans, as necessary, to maintain this level (See Figure 1.)
5.7 Connect each cell to an air manifold and open the valve to apply a constant lateral pressure of 1 psi (6.9 kPa). Maintain this constant pressure throughout the period of absorption.
5.8 Next, place a suitable vertical surcharge load (which will depend upon the proposed use or location of the material in the roadway) on the top porous stone (See Table 1). When determining the mass for the surcharge, include the mass of the top porous stone as part of the surcharge mass.
5.9 Subject all flexible base materials and soils with plasticity index of 15 or less to capillary absorption for ten days. Use a period in days equal to the plasticity index of the material
TRIAXIAL COMPRESSION FOR DISTURBED SOILS AND BASE MATERIALS TXDOT DESIGNATION: TEX-117-E
CONSTRUCTION DIVISION 5 – 22 08/02–12/09
for sub-grade soils with PI above 15. Keep the specimens at 77 ± 9°F (25 ± 5°C) during the period of capillary absorption.
5.10 Disconnect air hose from cell, remove surcharge weight, and return specimens to laboratory for testing. Use a vacuum and deflate the rubber membrane to aid in removing the cell from specimens and discard filter paper. If any appreciable material clings to paper, carefully press it back into the available holes along the side of the specimen.
5.11 Weigh the specimens and record as total mass after capillary absorption. Note that the wet mass of the stones is obtained after the specimens are tested. Record on the 'Triaxial Compression Test Capillary Wetting Data Sheet,' Form 1964.
5.12 Measure the circumference of each specimen by means of the metal measuring tape. Measure the height of the specimen including the stones, and enter on the data sheet as height in/out capillarity. Record the height of each stone.
5.13 Ready the specimen to be tested by replacing the triaxial cell to eliminate any moisture loss from the specimen and then releasing the vacuum. When a specimen is designated to be tested at zero lateral pressure, remove the cell just before testing. It is important to keep the correct identification on the specimens at all times because weights, measurements, test values, and calculations are determined for each individual specimen.
5.14 Test the specimens in compression while they are being subjected to their assigned constant lateral pressure (See Figure 2). The motorized press should compress the sample at a rate of 2.0 ± 0.3% strain per minute. Take simultaneous readings of load and deformation at intervals of 0.02 in. (0.5 mm) deformation until specimen fails.
5.15 Lower the load frame platen far enough to have room to place the specimen, loading blocks and deformation measuring equipment in the press.
5.16 Center the specimen with upper and lower loading blocks in place in the load frame. Determine if the deformation gauge will compress or extend during testing and set the dial stem accordingly. Set the dial of the strain gauge to read zero.
5.17 Next, set the bell housing, if used, over the deformation gauge and adjust so that it does not touch the gauge or its mounting.
Note 2—The compressive stress will necessarily be applied along a vertical line through the center of the ball that is mounted in the top of the bell housing.
5.17.1 Shift the bell housing laterally to bring the ball directly over the axis of the specimen, since it is desirable to apply the compressive force along the vertical axis of the test specimen.
5.17.2 Raise the platen by means of the motor, align, and seat the ball on the bell housing into the socket in the proving ring. Then apply just enough pressure to obtain a perceptible reading on the proving ring gauge (not to exceed 5 lbs.).
5.17.3 Read the deformation gauge and record as deformation under dead load.
TRIAXIAL COMPRESSION FOR DISTURBED SOILS AND BASE MATERIALS TXDOT DESIGNATION: TEX-117-E
CONSTRUCTION DIVISION 6 – 22 08/02–12/09
5.18 Connect the airline to the triaxial cell and apply lateral pressure to the specimen. The usual lateral pressures used for a series of tests are 0 psi (0 kPa), 3 psi (20.7 kPa), 5 psi (34.5 kPa), 10 psi (69.0 kPa), 15 psi (103.5 kPa), and 20 psi (138.0 kPa).
5.18.1 In cases where the load or stress is high, 175 -180 psi (1207 - 1241 kPa), for the specimen tested at 15 psi (103.5 kPa) lateral pressure, use 7 psi (48.3 kPa) instead of 20 psi (138.0 kPa) for the last specimen.
5.18.2 The lateral pressure applied by the air will tend to change the initial reading of the gauge. As the air pressure is adjusted, start the motor momentarily to compress the specimen until the deformation gauge reads the same as recorded in Section 5.17.
5.18.3 Read the proving ring gauge and enter in load column opposite the initial deformation reading on the 'Triaxial Test Data Sheet,' Form 1176.
5.19 The test is ready to be started:
5.19.1 Turn on the motor and read the proving ring dial at each 0.02 in. (0.5 mm) deformation of the specimen.
5.19.2 Continue readings until 0.60 in. (15.2 mm) of deformation is reached or failure has occurred.
5.19.2.1 Failure is reached when the proving ring dial readings remain constant or decrease with further increments of deformation.
5.19.2.2 In testing specimens with aggregates, the slipping and shearing of aggregates will cause temporary decreases in proving ring readings.
5.19.3 Continue the test until true failure is reached.
5.19.4 After 0.60 in. (15.2 mm) of deformation the cross sectional area of the specimen has increased so that the subsequent small increase in load readings is little more than the increase in tension of the membrane acting as lateral pressure.
5.20 The above procedure also applies to an unconfined specimen except that no air or axial cell is used. For materials that contain a large amount of aggregate, test two specimens at zero lateral pressure. Use average of test results unless large rocks appear to have created point bearing; in this case use highest value.
5.21 Remove the cell and stones from the specimen over a flat, tared drying pan. Use a spatula to clean the material from the inside of cell and stones. Break up the specimen taking care to lose none of the material and place the identification tag in the tray.
5.22 Dry material to constant mass at a temperature of 230°F (110°C) and determine the dry mass.
5.23 Weigh the damp stones, then dry them at 140°F (60°C) and to constant mass.
TRIAXIAL COMPRESSION FOR DISTURBED SOILS AND BASE MATERIALS TXDOT DESIGNATION: TEX-117-E
CONSTRUCTION DIVISION 8 – 22 08/02–12/09
Figure 2—Press Assembly for Triaxial Press
Table 1—Vertical Surcharge Load
Mold Diameter Flexible Base Sub-grade Soil
6 in. (152 mm) 14.1 lb. (6.4 kg) 28.3 lb. (12.8 kg)
4 in. (102 mm) N/A 12.6 lb. (5.7 kg)
6. CALCULATIONS
6.1 Calculate dry density (DD) in lb./ft.3 (pcf):
D W VD D= /
Where:
V = volume of compacted specimen, ft3 (m3)
WD = dry mass of specimen, lbs. (kg).
TRIAXIAL COMPRESSION FOR DISTURBED SOILS AND BASE MATERIALS TXDOT DESIGNATION: TEX-117-E
CONSTRUCTION DIVISION 9 – 22 08/02–12/09
6.2 Calculate the percent molding moisture (MM):
M W W WM W D D= −[ ( ) / ]100
Where:
WW = wet mass of specimen, lbs. (kg).
6.3 Calculate the percent of volumetric swell (VS):
V V V VS A= −100( ) /
Where:
VA = volume of specimen after capillary absorption, ft3 (m3).
6.4 Calculate the percent moisture in the specimen after capillarity (MC):
M W W W WC A B D= − −100( ) /
Where: WA = wet mass of specimen and stones after absorption, lbs. (kg)
WB = wet mass of stones, lbs. (kg)
WD = correct oven-dry mass of specimen, lbs. (kg).
6.5 Calculate the percent moisture in the specimen before capillarity (MB):
M W W W WB C S D D= − −100( ) /
Where:
WS = dry mass of stones, lbs. (kg)
WC = mass of specimen and stones before capillarity, lbs. (kg).
6.6 Calculate the corrected vertical unit stress in psi (kPa). A correction is necessary because the area of the cross-section increases as the specimen is reduced in height. Assume that the specimen deforms at constant volume.
S d h percent strain= =100( / )
Where:
d = total vertical deformation at a given instant, in. (mm), by deformation gauge
h = the height of the specimen, in. (mm), measured after specimen is removed from capillarity.
6.7 Calculate the corrected vertical unit stress (p):
p P( S A in kPa or p P S A in psi= − = −9 81 1 100 1 100. [ / ) / ], [( / ) / ],
TRIAXIAL COMPRESSION FOR DISTURBED SOILS AND BASE MATERIALS TXDOT DESIGNATION: TEX-117-E
CONSTRUCTION DIVISION 10 – 22 08/02–12/09
Where:
A = the end area of the cylindrical specimen at the beginning of test, in2 (mm2)
P = the total vertical load on the specimen at any given deformation expressed in lbs. (g). It is the sum of the applied load measured by the proving ring plus the dead mass of the upper stone, loading block, and dial housing.
7. GRAPHS AND DIAGRAMS
7.1 Plot the moisture-density curve shown in Tex-113-E, Figure 1.
7.2 Plot the stress-strain diagram as shown in Figure 3, when requested.
7.3 Construct the 'Mohr's Diagram' of stress upon coordinate axes in which ordinates represent shear stress and abscissas represent normal stress, both expressed as psi (kPa) to the same scale (See Figure 4).
L = Minor principal stress which is the constant lateral pressure applied to the specimen during an individual test.
V = The major principal stress which is the ultimate compressive strength or the highest value of p determined at the given lateral pressure.
7.4 Show each individual test by one stress circle:
Plot L and V on the base line of normal stress.
Locate the center of each circle a distance of (V + L)/2 from the origin and construct a semi-circle with its radius equal to (V - L)/2 intersecting the base line at V and L.
Repeat these steps for each specimen tested at different lateral pressures to provide enough stress circles to define the failure envelope on the Mohr's diagram.
7.5 Draw the failure envelope tangent to all of the stress circles. Since it is practically impossible to avoid compacting an occasional specimen that is not identical with the other specimens in the same set, disregard any stress circle that is obviously out of line when drawing the tangent line.
TRIAXIAL COMPRESSION FOR DISTURBED SOILS AND BASE MATERIALS TXDOT DESIGNATION: TEX-117-E
CONSTRUCTION DIVISION 11 – 22 08/02–12/09
Figure 3—Stress-Strain Diagram
Figure 4—Mohr’s Diagram
TRIAXIAL COMPRESSION FOR DISTURBED SOILS AND BASE MATERIALS TXDOT DESIGNATION: TEX-117-E
CONSTRUCTION DIVISION 12 – 22 08/02–12/09
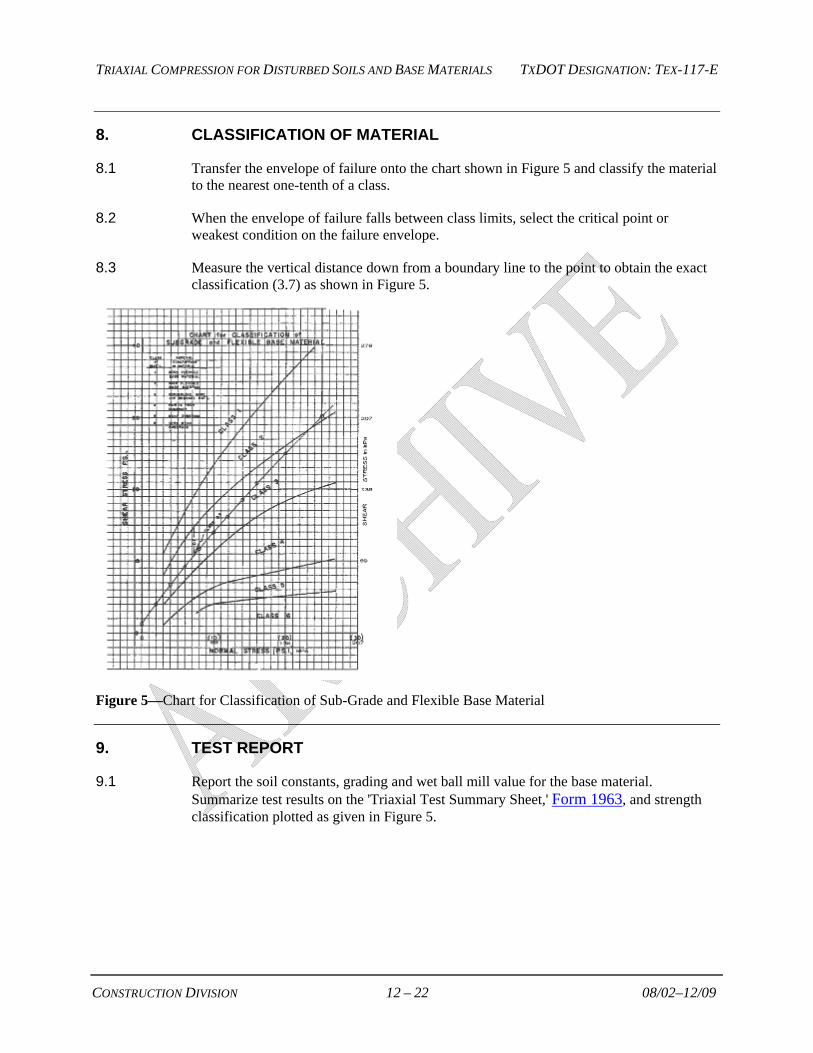
8. CLASSIFICATION OF MATERIAL
8.1 Transfer the envelope of failure onto the chart shown in Figure 5 and classify the material to the nearest one-tenth of a class.
8.2 When the envelope of failure falls between class limits, select the critical point or weakest condition on the failure envelope.
8.3 Measure the vertical distance down from a boundary line to the point to obtain the exact classification (3.7) as shown in Figure 5.
Figure 5—Chart for Classification of Sub-Grade and Flexible Base Material
9. TEST REPORT
9.1 Report the soil constants, grading and wet ball mill value for the base material. Summarize test results on the 'Triaxial Test Summary Sheet,' Form 1963, and strength classification plotted as given in Figure 5.
TRIAXIAL COMPRESSION FOR DISTURBED SOILS AND BASE MATERIALS TXDOT DESIGNATION: TEX-117-E
CONSTRUCTION DIVISION 13 – 22 08/02–12/09
PART II—ACCELERATED METHOD FOR TRIAXIAL COMPRESSION OF SOILS
10. SCOPE
10.1 This accelerated procedure is based on a correlation with Part I, performed on a large number of different types of soils. Generally, use the accelerated test to control the quality of base materials with low absorption in group (d) during stockpiling. In such cases, roadway samples will not be considered representative.
11. PROCEDURE
11.1 Prepare all materials in accordance with Tex-101-E, Part II.
11.2 Determine the optimum moisture and maximum density in accordance with Tex-113-E and Tex-114-E.
11.3 Group the soils into five general types of materials:
A. Fine granular materials with plasticity index less than 5.
B. Very low swelling soils with plasticity index of 5 through 11.
C. Swelling sub-grade soils, plasticity index of 12 or more.
D. Flexible base and sub-base materials with considerable amounts of aggregate.
E. Combination soil types.
Follow the correct procedure for the specimen soil type, as shown below
11.3.1 Group A – Fine Granular Materials with Plasticity Index Less Than 5:
11.3.1.1 Mold six specimens 6 in. (152.4 mm) in diameter and 8 in. (203.2 mm) in height at the optimum moisture and density in accordance with Tex-113-E.
11.3.1.2 Cover the specimen (with stones in place) with a triaxial cell immediately after removing from mold and allow to set overnight undisturbed at room temperature.
Note 3—Do not dry cure or subject specimens to capillary absorption.
11.3.1.3 Test the specimens at the usual lateral pressures.
11.3.1.4 Calculate unit stress, plot diagrams, and classify material.
11.3.2 Group B – Very Low Swelling Soils with Plasticity Index of 5 through 11:
11.3.2.1 Compact a set of six identical specimens at the optimum moisture and density condition in accordance with Tex-113-E.
TRIAXIAL COMPRESSION FOR DISTURBED SOILS AND BASE MATERIALS TXDOT DESIGNATION: TEX-117-E
CONSTRUCTION DIVISION 14 – 22 08/02–12/09
11.3.2.2 Use filter paper, lead surcharge weight, and air pressure for lateral support and subject the specimens to capillary absorption overnight as described in Part I, Sections 5.8 through 5.12.
11.3.2.3 The next morning, remove filter paper and test the specimens at the usual lateral pressure shown above. Calculate unit stress, plot diagrams, and classify material.
11.3.3 Group C – Swelling Sub-grade Soils, Plasticity Index of 12 or More:
11.3.3.1 Obtain the plasticity index and hygroscopic moisture of these soils in advance of molding specimens.
11.3.3.2 Determine the optimum moisture and dry density of the materials in accordance with Tex-113-E.
11.3.3.3 Calculate the Percent Molding Moisture = (1.4 x optimum moisture) – 2.2.
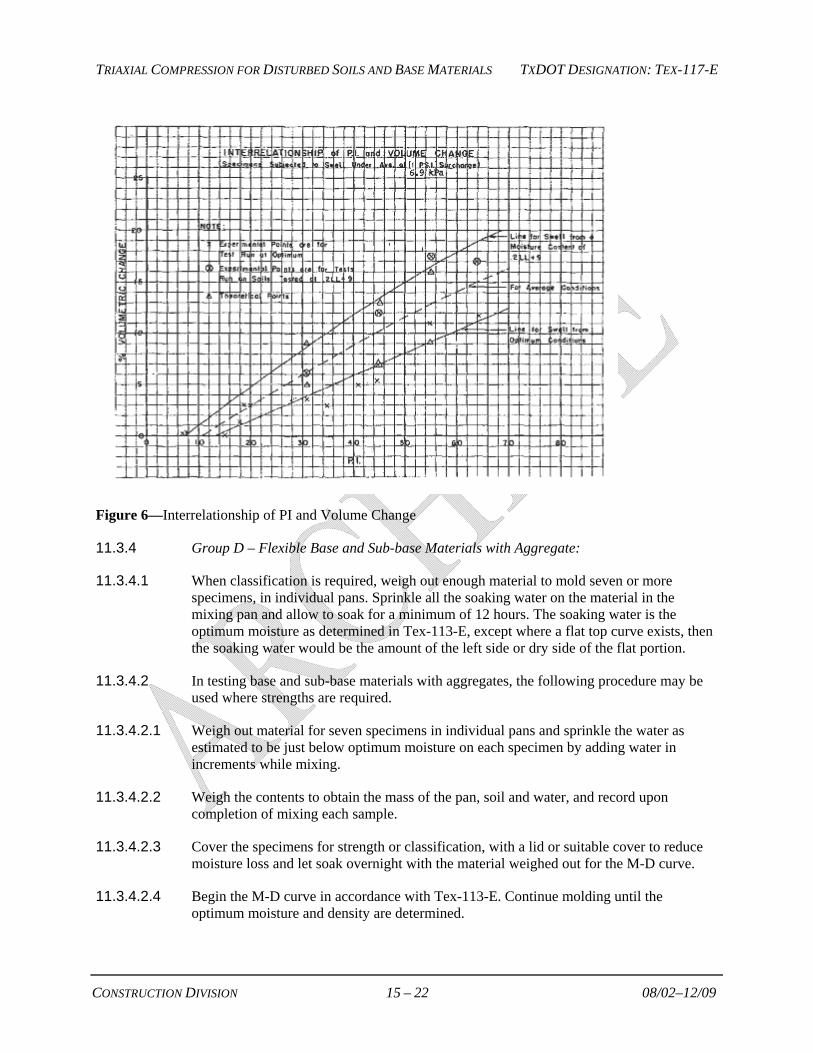
11.3.3.4 Obtain the desired molding density from the following expression:
Molded Dry Density = Optimum dry density (from Section 11.2) / [1 + (% volumetric swell / 100)]
To determine the percent volumetric swell to be expected, use average condition in chart shown in Figure 6. It is important to modify the percent volumetric swell by multiplying by percent soil binder divided by 100 to obtain the percent volumetric swell to be expected.
11.3.3.5 Use the moisture content (Section 11.3.3.3), adjusted if necessary, and adjust the blows per layer to obtain the desired density (Section 11.3.3.4). Where this moisture content is too great to permit the desired density, reduce the molding water slightly (usually about 1%) and continue molding. Mold six specimens, in accordance with Tex-114-E, at the water content established for the desired density. The specimens, being in capillarity overnight, will pick up the moisture that was left out.
11.3.3.6 When the six specimens have been molded, put them to capillary absorption (as in Part I ) overnight. Test at the usual lateral pressures and classify.
TRIAXIAL COMPRESSION FOR DISTURBED SOILS AND BASE MATERIALS TXDOT DESIGNATION: TEX-117-E
CONSTRUCTION DIVISION 15 – 22 08/02–12/09
Figure 6—Interrelationship of PI and Volume Change
11.3.4 Group D – Flexible Base and Sub-base Materials with Aggregate:
11.3.4.1 When classification is required, weigh out enough material to mold seven or more specimens, in individual pans. Sprinkle all the soaking water on the material in the mixing pan and allow to soak for a minimum of 12 hours. The soaking water is the optimum moisture as determined in Tex-113-E, except where a flat top curve exists, then the soaking water would be the amount of the left side or dry side of the flat portion.
11.3.4.2 In testing base and sub-base materials with aggregates, the following procedure may be used where strengths are required.
11.3.4.2.1 Weigh out material for seven specimens in individual pans and sprinkle the water as estimated to be just below optimum moisture on each specimen by adding water in increments while mixing.
11.3.4.2.2 Weigh the contents to obtain the mass of the pan, soil and water, and record upon completion of mixing each sample.
11.3.4.2.3 Cover the specimens for strength or classification, with a lid or suitable cover to reduce moisture loss and let soak overnight with the material weighed out for the M-D curve.
11.3.4.2.4 Begin the M-D curve in accordance with Tex-113-E. Continue molding until the optimum moisture and density are determined.
TRIAXIAL COMPRESSION FOR DISTURBED SOILS AND BASE MATERIALS TXDOT DESIGNATION: TEX-117-E
CONSTRUCTION DIVISION 16 – 22 08/02–12/09
11.3.4.2.5 The difference between optimum moisture and the water the specimens were sprinkled with must be added to the material in the pans. This amount should not exceed 2%. Let soak for at least one hour.
11.3.4.2.6 If, in the event the specimens have been wet with slightly more than optimum, not to exceed 1%, they may be dried back at room temperature, by constant stirring, to desired mass.
11.3.4.3 Replace any evaporated water, mix, and compact. Mold materials, which can be compacted to the desired density without the addition of more water, at optimum moisture ± 0.1%.
11.3.4.3.1 Many materials require the addition of small amounts of moisture to obtain the desired density.
11.3.4.3.2 If needed, add in the required amounts of additional water (by trial and error method) until the desired density is obtained, then compact a set of seven specimens using 13.26 ft-lbs/in3 (1100 kN-m/m3) effort.
11.3.4.3.3 The intent of this technique is to use the minimum amount of moisture equal to or above optimum moisture that will produce a set of accelerated test specimens whose average density is within 1/2 pcf (8.0 kg/m3) of the maximum unit dry density of the original moisture density curve.
Note 4—Excessive densities can sometimes be obtained in the accelerated set but these are almost always very wet specimens and their resultant strengths can be misleading.
11.3.4.4 Subject specimens to overnight capillarity.
11.3.4.5 Test, and if required, classify according to Part I. If strengths at 0 and 15 psi (0 and 103.4 kPa) lateral pressures are specified, test four specimens at zero lateral confinement and three of 15 psi 103.4 kPa) lateral confinement and average the three highest values for each state of confinement of the control values.
Note 5—When Grade one or two strength is specified, classification is not required.
Note 6—When strengths at zero and 15 psi (103.4 kPa) lateral pressures are specified, it is permitted to run correlation tests on a given source of material. The correlation should be as follows:
As soon as three satisfactory accelerated test specimens have been molded according to Section 11.3.4.2, test two of them at zero lateral pressure and average the results as one test.
Test the third specimen at 15 psi (103.4 kPa) lateral pressure.
If these specimens pass, it is safe to assume the set to be tested the next day will pass.
11.3.5 Group E – Combination Soil Types
11.3.5.1 This group includes all materials with enough soil binder to separate the aggregate particles or overfill the voids of the compacted specimen. For example, if the material is a clayey gravel with high plasticity:
TRIAXIAL COMPRESSION FOR DISTURBED SOILS AND BASE MATERIALS TXDOT DESIGNATION: TEX-117-E
CONSTRUCTION DIVISION 17 – 22 08/02–12/09
Treat the material as a swelling soil.
Allow the material to soak a minimum of 12 hours as in the case of aggregate materials.
11.3.5.2 Note that the total swelling is figured only for that part passing the No. 40 (425 μm) sieve. Other combinations must be recognized and tested in the proper group.
11.3.5.3 Subject all specimens to overnight capillarity, test, and classify.
11.3.5.4 When testing aggregate materials under Part II where classification is required:
11.3.5.4.1 Test two specimens at 0 psi (0 kPa).
11.3.5.4.2 Test the others at 3 psi (20.7 kPa), 5 psi (34.5 kPa), 10 psi (69.0 kPa), and 15 psi (103.4 kPa).
11.3.5.4.3 Average the result of the zero lateral pressure tests as one value.
11.3.5.4.4 Classify fine grain soils using lateral pressures of 0 psi (0 kPa), 3 psi (20.7 kPa), 5 psi (34.5 kPa), 10 psi (69.0 kPa), 15 psi (103.4 kPa).
12. REPORTING TEST RESULTS
12.1 The reports and forms are the same as given in Part I of this procedure.
PAVEMENT DESIGN NOTES
13. SCOPE
After materials have been classified according to Part I or Part II, and cohesiometer values for stabilized layers and surfacing have been determined, follow these steps for thickness design.
14. PROCEDURE
14.1 Obtain the current and projected traffic from the Department’s Transportation Planning and Programming Division.
14.2 Select a design wheel load from the traffic data and known local conditions. Use the ‘Flexible Base Design Chart’ (See Figure 7) to calculate total depth of pavement to protect the sub-grade.
14.3 Reduce total depth of pavement by using the ‘Thickness Reduction Chart for Stabilized Layers (See Figure 8), whenever stabilized layers are used in the pavement structure.
TRIAXIAL COMPRESSION FOR DISTURBED SOILS AND BASE MATERIALS TXDOT DESIGNATION: TEX-117-E
CONSTRUCTION DIVISION 18 – 22 08/02–12/09
14.3.1 Enter above depth (from two above) on ordinate of Figure 8 and follow across page until intersection of cohesiometer value selected for use is reached, then project to abscissa to read reduction in depth due to bridging effects.
14.3.2 Standard cohesiometer values (corrected to represent values from 3 in. [76 mm] height specimens) are used on Figure 8 regardless of thickness of stabilized layer except in the following cases:
14.3.2.1 Consideration should be given to increasing the design wheel load by 30% if traffic is anticipated to have over 50% tandem axles where asphaltic mixtures are used.
14.3.2.2 The modification of cohesiometer values for 3 in. (76.2 mm) high specimens for application to other thickness' of asphaltic mixtures is obtained by the equation:
C CtM = 2 9/
Where:
CM = Modified cohesiometer value
C = Standard cohesiometer value for a 3 in. (76.2 mm) height specimen
t = Proposed thickness of bituminous mixtures, in. (mm).
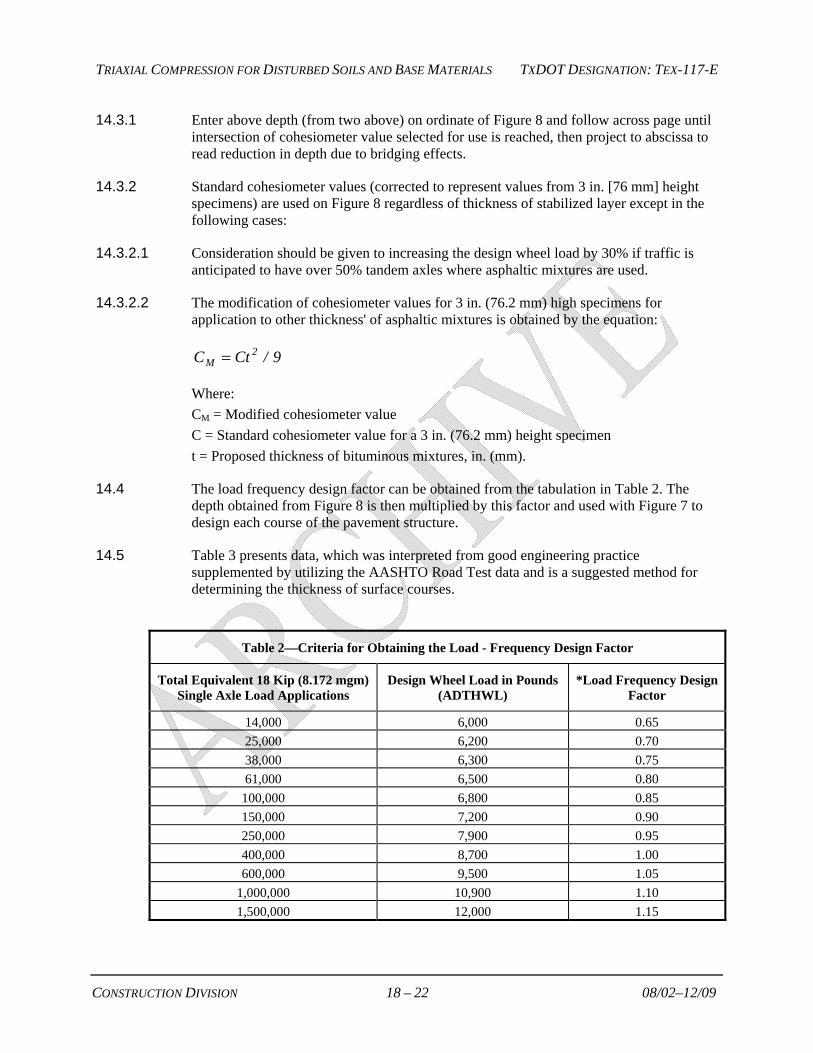
14.4 The load frequency design factor can be obtained from the tabulation in Table 2. The depth obtained from Figure 8 is then multiplied by this factor and used with Figure 7 to design each course of the pavement structure.
14.5 Table 3 presents data, which was interpreted from good engineering practice supplemented by utilizing the AASHTO Road Test data and is a suggested method for determining the thickness of surface courses.
Table 2—Criteria for Obtaining the Load - Frequency Design Factor
Total Equivalent 18 Kip (8.172 mgm) Single Axle Load Applications
Design Wheel Load in Pounds (ADTHWL)
*Load Frequency Design Factor
14,000 6,000 0.65
25,000 6,200 0.70
38,000 6,300 0.75
61,000 6,500 0.80
100,000 6,800 0.85
150,000 7,200 0.90
250,000 7,900 0.95
400,000 8,700 1.00
600,000 9,500 1.05
1,000,000 10,900 1.10
1,500,000 12,000 1.15
TRIAXIAL COMPRESSION FOR DISTURBED SOILS AND BASE MATERIALS TXDOT DESIGNATION: TEX-117-E
CONSTRUCTION DIVISION 19 – 22 08/02–12/09
Total Equivalent 18 Kip (8.172 mgm)
Single Axle Load Applications Design Wheel Load in Pounds
(ADTHWL) *Load Frequency Design
Factor
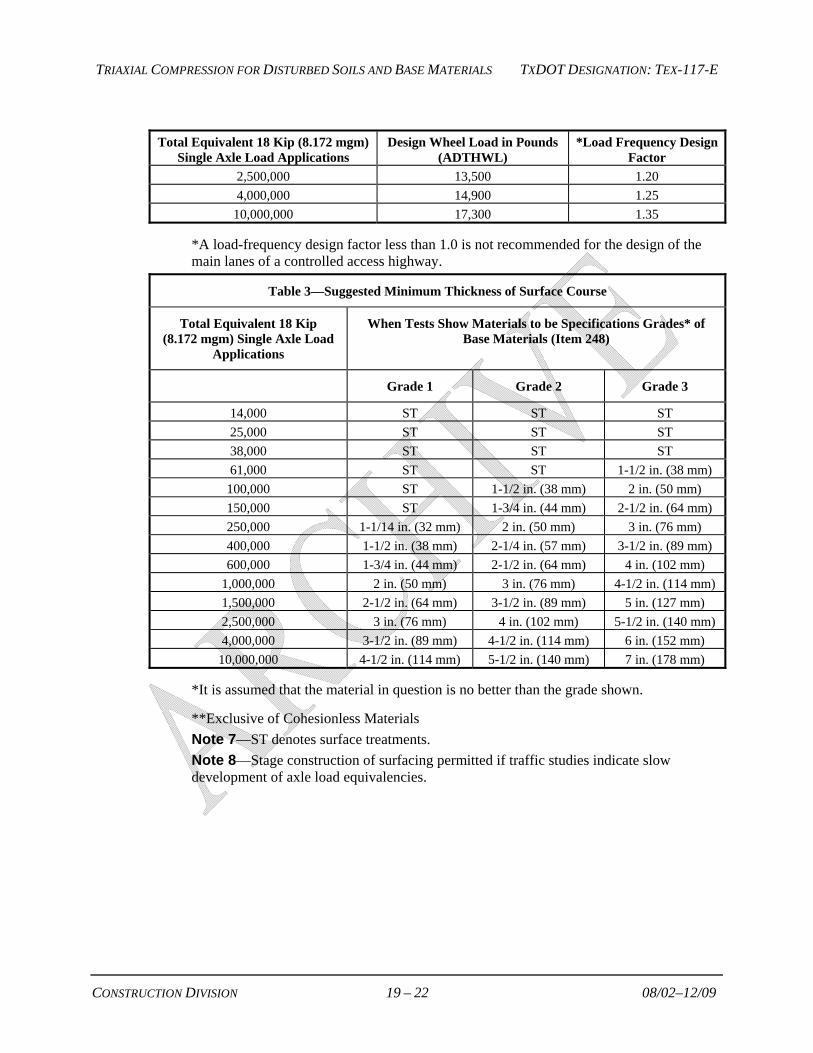
2,500,000 13,500 1.20
4,000,000 14,900 1.25
10,000,000 17,300 1.35
*A load-frequency design factor less than 1.0 is not recommended for the design of the main lanes of a controlled access highway.
Table 3—Suggested Minimum Thickness of Surface Course
Total Equivalent 18 Kip (8.172 mgm) Single Axle Load
Applications
When Tests Show Materials to be Specifications Grades* of Base Materials (Item 248)
Grade 1 Grade 2 Grade 3
14,000 ST ST ST
25,000 ST ST ST
38,000 ST ST ST
61,000 ST ST 1-1/2 in. (38 mm)
100,000 ST 1-1/2 in. (38 mm) 2 in. (50 mm)
150,000 ST 1-3/4 in. (44 mm) 2-1/2 in. (64 mm)
250,000 1-1/14 in. (32 mm) 2 in. (50 mm) 3 in. (76 mm)
400,000 1-1/2 in. (38 mm) 2-1/4 in. (57 mm) 3-1/2 in. (89 mm)
600,000 1-3/4 in. (44 mm) 2-1/2 in. (64 mm) 4 in. (102 mm)
1,000,000 2 in. (50 mm) 3 in. (76 mm) 4-1/2 in. (114 mm)
1,500,000 2-1/2 in. (64 mm) 3-1/2 in. (89 mm) 5 in. (127 mm)
2,500,000 3 in. (76 mm) 4 in. (102 mm) 5-1/2 in. (140 mm)
4,000,000 3-1/2 in. (89 mm) 4-1/2 in. (114 mm) 6 in. (152 mm)
10,000,000 4-1/2 in. (114 mm) 5-1/2 in. (140 mm) 7 in. (178 mm)
*It is assumed that the material in question is no better than the grade shown.
**Exclusive of Cohesionless Materials
Note 7—ST denotes surface treatments.
Note 8—Stage construction of surfacing permitted if traffic studies indicate slow development of axle load equivalencies.
TRIAXIAL COMPRESSION FOR DISTURBED SOILS AND BASE MATERIALS TXDOT DESIGNATION: TEX-117-E
CONSTRUCTION DIVISION 20 – 22 08/02–12/09
Figure 7—Flexible Base Design Chart
Figure 8—Thickness Reduction Chart for Stabilized Layers
TRIAXIAL COMPRESSION FOR DISTURBED SOILS AND BASE MATERIALS TXDOT DESIGNATION: TEX-117-E
CONSTRUCTION DIVISION 21 – 22 08/02–12/09
15. LIMITATIONS
15.1 For a 6 in. (152.6 mm) or greater layer thickness, use a value of 6 in. (152.6 mm) in the formula for ‘t.’
15.2 When adjacent layers of stabilization and asphaltic concrete are used, the cohesiometer value to be used with the 'Thickness Reduction Chart for Stabilized Layers' should be equal to the sum of the standard cohesiometer value for the stabilized layer and the modified cohesiometer value of the asphaltic concrete.
15.2.1 When two adjacent layers of stabilization are used, or if a layer of untreated flexible base material exists between asphaltic concrete and a stabilized layer, only the greater of the two cohesiometer values in Figure 8 should be used.
15.2.2 Considerable caution and good engineering judgment should be used in selecting cohesiometer values for use in reduction of base depths. This is especially true in cases where hot mix-cold laid asphaltic concrete is bid as an alternate to hot mix asphaltic concrete laid hot.
15.2.3 In the case of stabilized bases, sub-bases and sub-grades, average values rather than highest values should be selected for use in Figure 8.
16. GENERAL NOTES
16.1 Wetted stabilized materials taken from the roadway during construction should be screened over a 1/4 in. (6.3 mm) sieve at the field moisture content without drying.
16.1.1 Each of these two sizes is mixed for uniformity and weighed.
16.1.2 Specimens are then weighed and recombined to produce multiple identical specimens with the received gradation.
16.1.3 Moisture can be adjusted in each specimen by adding water to the material or removing from the material by a fan, as needed.
16.2 See the appropriate test method (listed below) for testing wetted stabilized materials taken form the roadway during construction:
Tex-120-E
Tex-121-E
Tex-127-E
16.3 In any event, the stabilized material should not be completely air-dried.
16.4 When molding a set of preliminary specimens for testing lime stabilized sub-grades and base materials, refer to ‘Recommended Amounts of Lime for Stabilization of Sub-grades and Bases' in Tex-121-E for the recommended amounts of lime to use.