95
Triennial Central Bank Survey Report on global foreign exchange market activity in 2010 Monetary and Economic Department December 2010 1
TriennialCentral Bank Survey
Report on global foreign exchange market activity in 2010
Monetary and Economic Department
December 2010
1
Queries concerning this report should be addressed to the authors listed below:
Sections A + B + C: Karsten von Kleist tel +41 61 280 8408 e-mail: [email protected]
Sections B + C + D: Carlos Mallo tel +41 61 280 8256 e-mail: [email protected]
Philippe Mesny tel +41 61 280 8425 e-mail: [email protected]
Section E: Serge Grouchko tel +41 61 280 8445 e-mail: [email protected]
Copies of publications are available from:
Bank for International Settlements Communications CH-4002 Basel, Switzerland
E-mail: [email protected]
Fax: +41 61 280 9100 and +41 61 280 8100
This publication is available on the BIS website (www.bis.org).
© Bank for International Settlements 2010. All rights reserved. Brief excerpts may be reproduced or translated provided the source is stated.
ISSN 1814-7348 (print) ISBN 92-9131-854-X (print)
ISSN 1814-7356 (online) ISBN 92-9197-854-X (online)
2
Participating institutions ............................................................................................................5 A. Summary of main findings on global foreign exchange markets .....................................6
1. Turnover in April 2010............................................................................................6 2. Amounts outstanding and market values at end-June 2010 ..................................7
B. Turnover in the global foreign exchange markets in April 2010 ......................................7 1. Growth of global foreign exchange turnover ..........................................................7 2. Turnover by counterparty .......................................................................................8 3. Turnover by instrument ........................................................................................10 4. Turnover by maturity ............................................................................................11 5. Turnover by currency ...........................................................................................11 6. Turnover by currency pair ....................................................................................15 7. Turnover by execution method.............................................................................16 8. Geographical distribution of turnover ...................................................................16
C. Amounts outstanding at end-June 2010........................................................................20 1. Growth of global foreign exchange positions .......................................................20 2. Positions by counterparty.....................................................................................21 3. Positions value by instrument ..............................................................................22 4. Positions by maturity ............................................................................................23 5. Positions by currency ...........................................................................................24
D. Methodology..................................................................................................................27 I. Background to the Triennial Central Bank Survey ...............................................27 II. Statistical notes ....................................................................................................27 1. Coverage and basic features of the 2010 survey.................................................28 2. Types of data collected ........................................................................................30
2.1 Turnover data..............................................................................................30 2.2 Nominal or notional amounts outstanding...................................................30 2.3 Gross market values ...................................................................................31
3. Instruments ..........................................................................................................32 4. Counterparties......................................................................................................32 5. Currency and other market risk breakdowns .......................................................33
5.1 Turnover......................................................................................................33 5.2 Amounts outstanding ..................................................................................34
6. Maturities..............................................................................................................34 6.1 Turnover......................................................................................................34 6.2 Amounts outstanding ..................................................................................35
7. Execution methods...............................................................................................35 8. Elimination of double-counting .............................................................................35
3
Double-counting and the specific case of overnetting......................................... 36 8.1 Double-counting: netting of turnover data ...................................................... 37 8.2 Double-counting: netting of data on amounts outstanding .............................. 37 8.3 Double-counting: netting of gross market values............................................ 37
9. Gaps in reporting................................................................................................... 37 10. Intertemporal comparisons.................................................................................. 38 11. Data at constant exchange rates......................................................................... 39 12. Annex tables........................................................................................................ 40
12.1 Turnover on foreign exchange markets (Section E.1)................................ 40 12.2 Positions (amounts outstanding) on derivatives markets (Section E.2) ..... 41
E. Statistical annex tables...................................................................................................... 42 1. Turnover in April 2010 ......................................................................................... 45 2. Amounts outstanding at end-June 2010.............................................................. 89
Conventions used in the tables and graphs
0 = Value close to zero.
... = Reported to be nil, not reported, not shown for reasons of confidentiality, not meaningful or not applicable.
Owing to rounding and incomplete reporting of various breakdowns, the component items do not always sum to the total for the category in question.
Lhs, rhs = left-hand scale, right-hand scale
4

Participating institutions
Data on foreign exchange national turnover and amounts outstanding were provided by the following institutions:
Argentina Central Bank of Argentina Australia Reserve Bank of Australia Austria Central Bank of the Republic of Austria Bahrain Bahrain Monetary Agency Belgium National Bank of Belgium Brazil Central Bank of Brazil Bulgaria Bulgarian National Bank Canada Bank of Canada Chile Central Bank of Chile China People’s Bank of China State Administration of Foreign Exchange Chinese Taipei Central Bank of China Colombia Bank of the Republic Czech Republic Czech National Bank Denmark National Bank of Denmark Estonia Bank of Estonia Finland Bank of Finland France Bank of France Germany Deutsche Bundesbank Greece Bank of Greece Hong Kong SAR Hong Kong Monetary Authority Hungary Magyar Nemzeti Bank India Reserve Bank of India Indonesia Bank Indonesia Ireland Central Bank of Ireland Israel Bank of Israel Italy Bank of Italy Japan Bank of Japan Korea Bank of Korea Latvia Bank of Latvia Lithuania Bank of Lithuania Luxembourg Central Bank of Luxembourg Malaysia Central Bank of Malaysia Mexico Bank of Mexico Netherlands Netherlands Bank New Zealand Reserve Bank of New Zealand Norway Central Bank of Norway Peru Central Reserve Bank of Peru Philippines Bangko Sentral ng Pilipinas Poland National Bank of Poland Portugal Bank of Portugal Romania National Bank of Romania Russia Central Bank of the Russian Federation Saudi Arabia Saudi Arabian Monetary Agency Singapore Monetary Authority of Singapore Slovakia National Bank of Slovakia South Africa South African Reserve Bank Spain Bank of Spain Sweden Sveriges Riksbank Statistics Sweden Switzerland Swiss National Bank Thailand Bank of Thailand Turkey Central Bank of the Republic of Turkey United Kingdom Bank of England United States Federal Reserve Bank of New York
5
A. Summary of main findings on global foreign exchange markets
Previous triennial surveys have used the expression “traditional foreign exchange markets” to refer to spot transactions, outright forwards and foreign exchange swaps. This expression excluded currency swaps and currency options, which were discussed separately. Starting with the 2010 survey, the expression “global foreign exchange markets” includes all five categories of foreign exchange instruments. The analysis distinguishes between spot transactions and other related foreign exchange instruments (outright forwards, foreign exchange swaps, currency swaps, currency options and other foreign exchange products).
In addition, the format of the 2010 survey includes the following main refinements and clarifications of reporting procedures compared with the 2007 survey:
The list of currency pairs has been expanded in order to capture transactions involving currencies typically used in carry trade strategies, namely AUD/JPY, NZD/JPY, USD/ZAR and USD/HKD. Trades in the Brazilian real, Chinese renminbi, Indian rupee and Korean won against the US dollar were also collected.
A more detailed counterparty breakdown for each instrument has been collected for identification of execution method in order to include a distinction between “with reporting dealers, local” and “with reporting dealers, cross-border”.
Despite these changes, the data presented here can be considered as being largely comparable with those of the previous triennial survey in 2007, notwithstanding the different structure of the results. Weighted average coverage of foreign exchange markets in reporting countries increased from 96% in 2007 to 97% in 2010.
1. Turnover in April 2010
Global foreign exchange market turnover was 20% higher in April 2010 than in April 2007, with average daily turnover of $4.0 trillion compared with $3.3 trillion. The increase was driven by the 48% growth in turnover of spot transactions, which represent 37% of foreign exchange market turnover. Spot turnover rose to $1.5 trillion in April 2010 from $1.0 trillion in April 2007.
The increase in turnover of other foreign exchange instruments was more modest at 7%, with average daily turnover of $2.5 trillion in April 2010. Turnover in outright forwards and currency swaps grew strongly (by 31% and 36%, respectively). Turnover in the large foreign exchange swaps segment was flat relative to the previous survey, while trading in currency options fell.
As regards counterparties, the higher global foreign exchange market turnover is associated with the increased trading activity of “other financial institutions” – a category that includes non-reporting banks, hedge funds, pension funds, mutual funds, insurance companies and central banks. Turnover by this category grew by 42%, rising to $1.9 trillion in April 2010 from $1.3 trillion in April 2007. At 13%, the share of trading with non-financial customers was the lowest since 2001.
Foreign exchange market activity became more global, with cross-border transactions representing 65% of trading activity in April 2010, while local transactions accounted for 35%, the lowest share ever.
The relative ranking of foreign exchange trading centres has changed slightly from the previous survey. Banks located in the United Kingdom accounted for 37% of all foreign exchange market turnover, against 35% in 2007, followed by the United States (18%), Japan (6%), Singapore (5%), Switzerland (5%), Hong Kong SAR (5%) and Australia (4%).
6
2. Amounts outstanding and market values at end-June 2010
Growth in the positions of OTC foreign exchange instruments was moderate at 9%, compared with an increase of 83% in notional amounts outstanding of currency instruments in the 2004–07 period.
In contrast, market values of these instruments almost doubled against a backdrop of increased financial market volatility during mid-April and early June 2010.
B. Turnover in the global foreign exchange markets in April 2010
1. Growth of global foreign exchange turnover
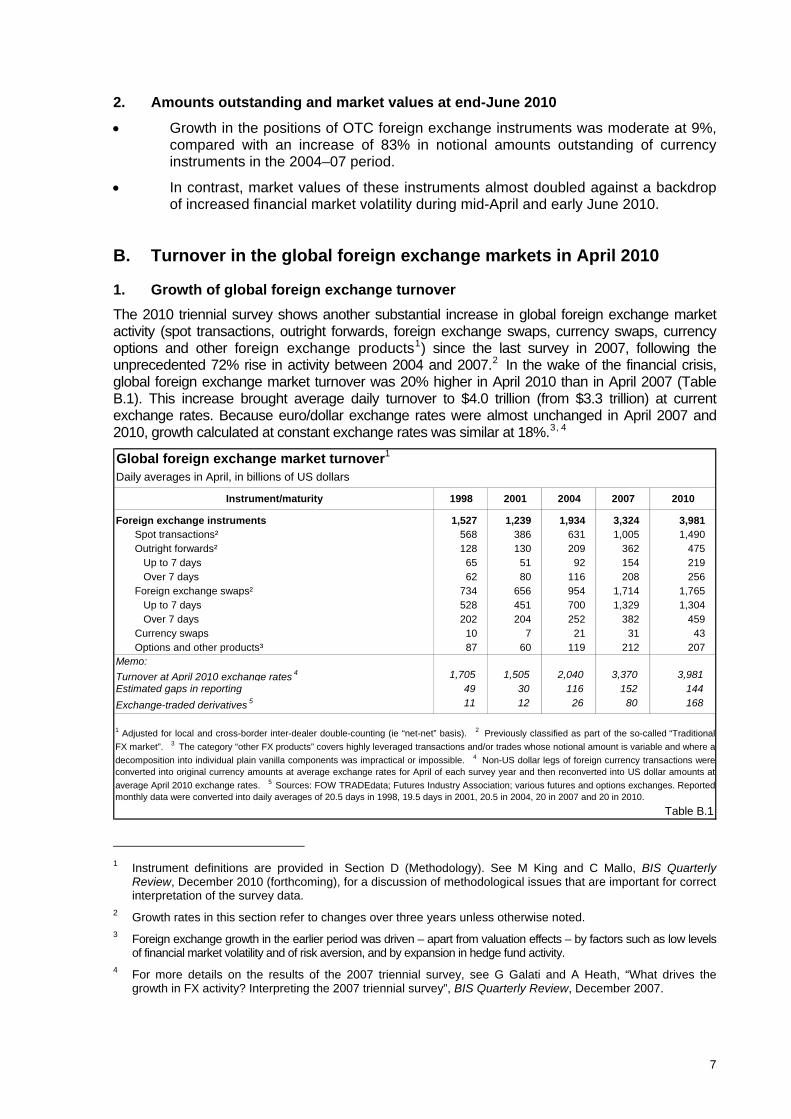
The 2010 triennial survey shows another substantial increase in global foreign exchange market activity (spot transactions, outright forwards, foreign exchange swaps, currency swaps, currency options and other foreign exchange products1) since the last survey in 2007, following the unprecedented 72% rise in activity between 2004 and 2007.2 In the wake of the financial crisis, global foreign exchange market turnover was 20% higher in April 2010 than in April 2007 (Table B.1). This increase brought average daily turnover to $4.0 trillion (from $3.3 trillion) at current exchange rates. Because euro/dollar exchange rates were almost unchanged in April 2007 and 2010, growth calculated at constant exchange rates was similar at 18%.3, 4
Instrument/maturity 1998 2001 2004 2007 2010
Foreign exchange instruments 1,527 1,239 1,934 3,324 3,981Spot transactions² 568 386 631 1,005 1,490Outright forwards² 128 130 209 362 475 Up to 7 days 65 51 92 154 219 Over 7 days 62 80 116 208 256Foreign exchange swaps² 734 656 954 1,714 1,765 Up to 7 days 528 451 700 1,329 1,304 Over 7 days 202 204 252 382 459Currency swaps 10 7 21 31 43Options and other products³ 87 60 119 212 207
Memo:
Turnover at April 2010 exchange rates 4 1,705 1,505 2,040 3,370 3,981Estimated gaps in reporting 49 30 116 152 144
Exchange-traded derivatives 5 11 12 26 80 168
Global foreign exchange market turnover1
Daily averages in April, in billions of US dollars
1 Adjusted for local and cross-border inter-dealer double-counting (ie “net-net” basis). 2 Previously classified as part of the so-called “Traditional
FX market”. 3 The category “other FX products” covers highly leveraged transactions and/or trades whose notional amount is variable and where a
decomposition into individual plain vanilla components was impractical or impossible. 4 Non-US dollar legs of foreign currency transactions wereconverted into original currency amounts at average exchange rates for April of each survey year and then reconverted into US dollar amounts at
average April 2010 exchange rates. 5 Sources: FOW TRADEdata; Futures Industry Association; various futures and options exchanges. Reportedmonthly data were converted into daily averages of 20.5 days in 1998, 19.5 days in 2001, 20.5 in 2004, 20 in 2007 and 20 in 2010.
Table B.1
1 Instrument definitions are provided in Section D (Methodology). See M King and C Mallo, BIS Quarterly
Review, December 2010 (forthcoming), for a discussion of methodological issues that are important for correct interpretation of the survey data.
2 Growth rates in this section refer to changes over three years unless otherwise noted. 3 Foreign exchange growth in the earlier period was driven – apart from valuation effects – by factors such as low levels
of financial market volatility and of risk aversion, and by expansion in hedge fund activity. 4 For more details on the results of the 2007 triennial survey, see G Galati and A Heath, “What drives the
growth in FX activity? Interpreting the 2007 triennial survey”, BIS Quarterly Review, December 2007.
7

Turnover of outright forwards, foreign exchange swaps, currency swaps, currency options and other OTC foreign exchange products continues to be many times larger than the volumes traded on organised exchanges. Daily turnover for currency instruments on organised exchanges was $168 billion, less than 7% of the $2.5 trillion average daily turnover in those instruments (Table B.1).
2. Turnover by counterparty
Data for turnover by counterparty show that the increase in global foreign exchange market turnover in 2010 is largely due to the enlarged trading activity of other financial institutions – a category that includes non-reporting banks, hedge funds, pension funds, mutual funds, insurance companies and central banks5 (Graph B.1). Turnover by this category grew by 42% to $1.9 trillion in April 2010 from $1.3 trillion in April 2007.
Reported foreign exchange market turnover by counterparty1 Daily averages in April
1995–20102 2007 2010
41.9%
17.8%
40.3%
Reporting dealersNon-financialcustomersOther financialinstitutions
3,000
38.9%
13.4%
47.7%2,000
1,000
0
1995 1998 2001 2004 2007 2010
1 Adjusted for local and cross-border inter-dealer double-counting, ie “net-net” basis. Excludes estimated gaps in reporting. Due to incomplete counterparty breakdown, components do not always sum to totals. 2 In billions of US dollars. Graph B.1
Although a surge in activity with other financial institutions had already accounted for most of the growth in total turnover in 2007, this category’s share (48%) surpassed transactions between reporting dealers (39%) for the first time in 2010 (Graph B.1). Other financial institutions increased their activity mainly in the spot market, with their share of turnover rising from 39% to 51%. In outright forwards, their share rose from 44% to 54% (Annex Table E.1).
Transactions between reporting dealers in the interbank market grew by 11% to $1.5 trillion in April 2010 from $1.4 trillion in April 2007 (Table B.2). Some of the factors identified as drivers of the downward trend in the share of the interbank market in analyses of previous triennial surveys, such as the increased concentration of the banking sector and the spread of electronic broking platforms, may also have had a dampening effect on interbank turnover.6
5 M King and D Rime, BIS Quarterly Review, December 2010 (forthcoming), analyse in depth how the trading
activity of participants in the “other financial institutions” sector has contributed to recent foreign exchange market turnover growth.
6 See G Galati and M Melvin, “Explaining the surge in FX turnover”, BIS Quarterly Review, December 2004, and G Galati, “Why has global FX turnover declined? Explaining the 2001 triennial survey”, BIS Quarterly Review, December 2001.
8
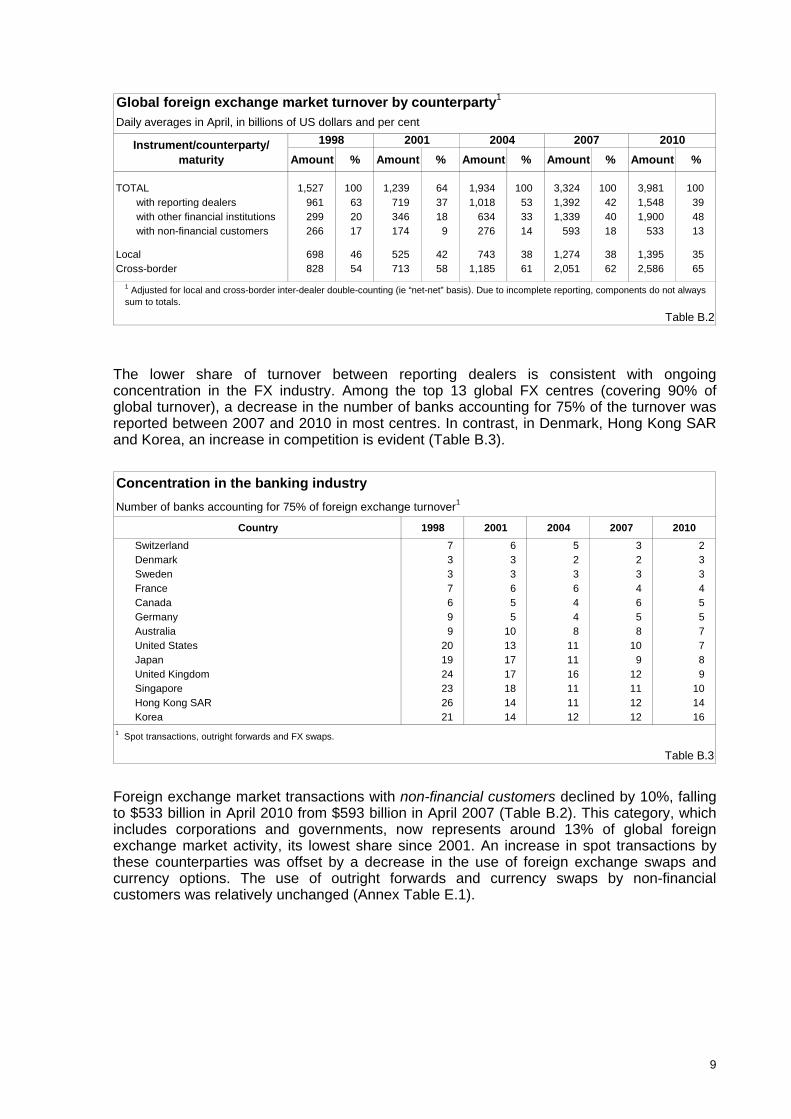
Amount % Amount % Amount % Amount % Amount %
TOTAL 1,527 100 1,239 64 1,934 100 3,324 100 3,981 100 with reporting dealers 961 63 719 37 1,018 53 1,392 42 1,548 39 with other financial institutions 299 20 346 18 634 33 1,339 40 1,900 48 with non-financial customers 266 17 174 9 276 14 593 18 533 13
Local 698 46 525 42 743 38 1,274 38 1,395 35Cross-border 828 54 713 58 1,185 61 2,051 62 2,586 65
Global foreign exchange market turnover by counterparty1
Daily averages in April, in billions of US dollars and per cent
Table B.2
1998 2001 2004 2007Instrument/counterparty/maturity
2010
1 Adjusted for local and cross-border inter-dealer double-counting (ie “net-net” basis). Due to incomplete reporting, components do not always sum to totals.
The lower share of turnover between reporting dealers is consistent with ongoing concentration in the FX industry. Among the top 13 global FX centres (covering 90% of global turnover), a decrease in the number of banks accounting for 75% of the turnover was reported between 2007 and 2010 in most centres. In contrast, in Denmark, Hong Kong SAR and Korea, an increase in competition is evident (Table B.3).
Country 1998 2001 2004 2007 2010
Switzerland 7 6 5 3 2Denmark 3 3 2 2 3Sweden 3 3 3 3 3France 7 6 6 4 4Canada 6 5 4 6 5Germany 9 5 4 5 5Australia 9 10 8 8 7United States 20 13 11 10 7Japan 19 17 11 9 8United Kingdom 24 17 16 12 9Singapore 23 18 11 11 10Hong Kong SAR 26 14 11 12 14Korea 21 14 12 12 1
Concentration in the banking industry
Number of banks accounting for 75% of foreign exchange turnover1
Table B.3
1 Spot transactions, outright forwards and FX swaps.
6
Foreign exchange market transactions with non-financial customers declined by 10%, falling to $533 billion in April 2010 from $593 billion in April 2007 (Table B.2). This category, which includes corporations and governments, now represents around 13% of global foreign exchange market activity, its lowest share since 2001. An increase in spot transactions by these counterparties was offset by a decrease in the use of foreign exchange swaps and currency options. The use of outright forwards and currency swaps by non-financial customers was relatively unchanged (Annex Table E.1).
9

3. Turnover by instrument
Foreign exchange spot turnover rose to $1.5 trillion in April 2010 from $1.0 trillion, an increase of 48% at current exchange rates (Table B.1). The increase in spot market turnover to a share of 37% of the global activity accounts for three quarters of the overall increase in global foreign exchange market activity relative to the previous survey (Graph B.2). The higher turnover in spot transactions is largely due to more active trading by other financial institutions, followed by inter-dealer trading (Annex Table E.1).
Reported foreign exchange market turnover by instrument1 Daily averages in April
1995–20102 2007 2010
30.2%
62.5%
6.4%
Spot transactionsOutright forwards and FX swapsCurrency swapsOptions and other
37.4%
56.3%
5.2%3,000
2,000
1,000
0
1995 1998 2001 2004 2007 2010
1 Adjusted for local and cross-border inter-dealer double-counting, ie “net-net” basis. Excludes estimated gaps in reporting. 2 In billions of US dollars. Graph B.2
Trading activity in other related foreign exchange instruments continued to expand, but at a much more moderate pace than in the three years to April 2007. Average daily turnover in these instruments grew by 7% to $2.5 trillion in April 2010, compared with an increase of 78% in the previous three-year period (Table B.1). Turnover in outright forwards increased by 31% to $475 billion. Trading in currency swaps also grew strongly, by 39%, albeit from a much lower level, to $43 billion.
Foreign exchange swaps, the most actively traded foreign exchange instrument by far, are widely used by banks to raise liquidity across money markets for different currencies.7 The dominance of reporting banks in this market has declined markedly over time, falling from 70% of total turnover in 1998, and around 60% in 2001 and 2004, to just 47% in 2010. At $1.8 trillion (+3%), the level of turnover is largely unchanged from the prior survey. The distribution of trading across other counterparties and maturities was also largely unchanged from 2007 (Annex Table E.1).
Finally, the use of currency options declined by 2% between surveys, with average daily turnover of $207 billion in April 2010. However, turnover in currency options with other financial institutions increased, their share in this sector rising from 43% to 55% (Annex Table E.1).
7 Disruptions to the foreign exchange swap market during the 2007–09 financial crisis attracted considerable
attention; see N Baba and F Packer, “From turmoil to crisis: dislocations in the FX swap market before and after the failure of Lehman Brothers”, BIS Working Papers, no 285, July 2009.
10
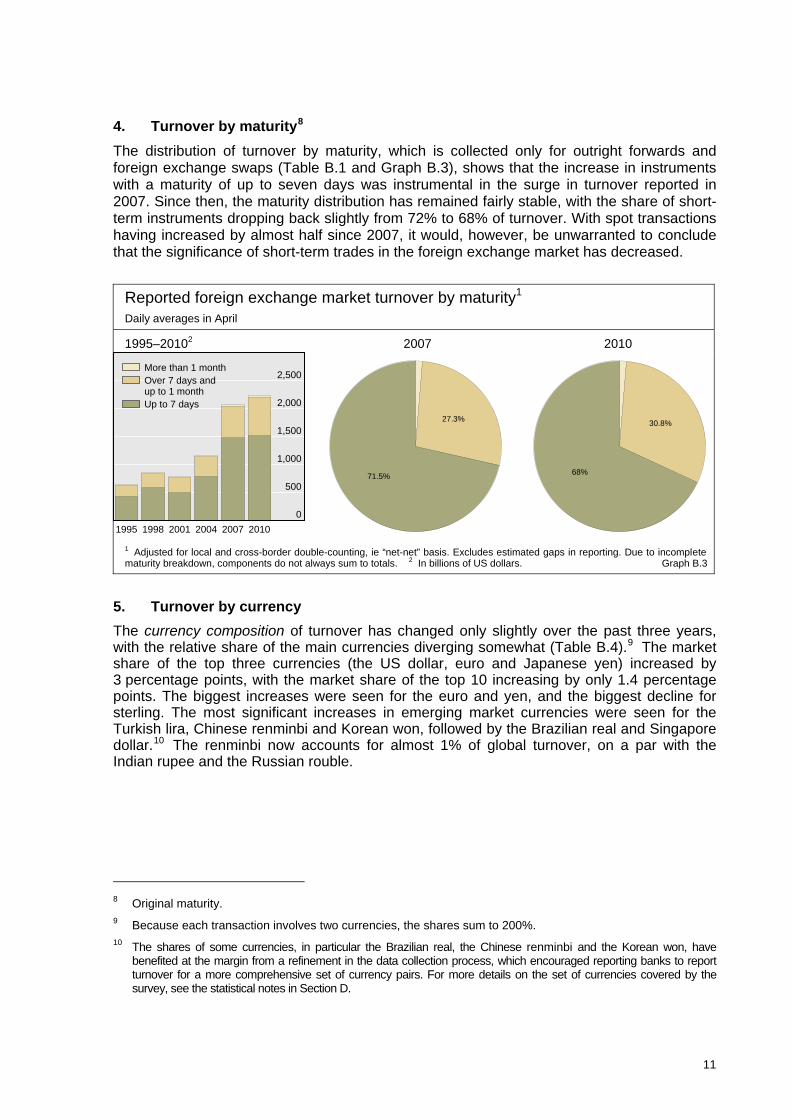
4. Turnover by maturity8
The distribution of turnover by maturity, which is collected only for outright forwards and foreign exchange swaps (Table B.1 and Graph B.3), shows that the increase in instruments with a maturity of up to seven days was instrumental in the surge in turnover reported in 2007. Since then, the maturity distribution has remained fairly stable, with the share of short-term instruments dropping back slightly from 72% to 68% of turnover. With spot transactions having increased by almost half since 2007, it would, however, be unwarranted to conclude that the significance of short-term trades in the foreign exchange market has decreased.
Reported foreign exchange market turnover by maturity1 Daily averages in April
1995–20102 2007 2010
27.3%
71.5%
More than 1 monthOver 7 days andup to 1 monthUp to 7 days
2,500
2,000
30.8%
68%
1,500
1,000
500
0
1995 1998 2001 2004 2007 2010
1 Adjusted for local and cross-border double-counting, ie “net-net” basis. Excludes estimated gaps in reporting. Due to incomplete maturity breakdown, components do not always sum to totals. 2 In billions of US dollars. Graph B.3
5. Turnover by currency
The currency composition of turnover has changed only slightly over the past three years, with the relative share of the main currencies diverging somewhat (Table B.4).9 The market share of the top three currencies (the US dollar, euro and Japanese yen) increased by 3 percentage points, with the market share of the top 10 increasing by only 1.4 percentage points. The biggest increases were seen for the euro and yen, and the biggest decline for sterling. The most significant increases in emerging market currencies were seen for the Turkish lira, Chinese renminbi and Korean won, followed by the Brazilian real and Singapore dollar.10 The renminbi now accounts for almost 1% of global turnover, on a par with the Indian rupee and the Russian rouble.
8 Original maturity. 9 Because each transaction involves two currencies, the shares sum to 200%. 10 The shares of some currencies, in particular the Brazilian real, the Chinese renminbi and the Korean won, have
benefited at the margin from a refinement in the data collection process, which encouraged reporting banks to report turnover for a more comprehensive set of currency pairs. For more details on the set of currencies covered by the survey, see the statistical notes in Section D.
11
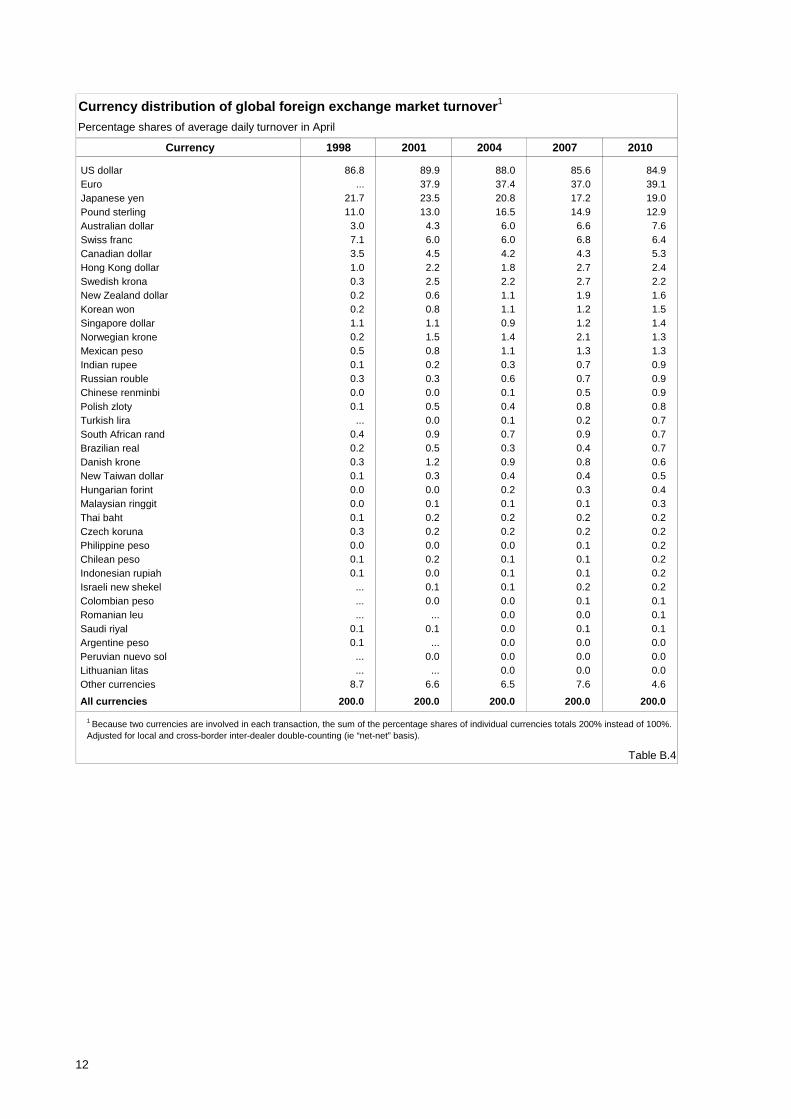
Currency 1998 2001 2004 2007 2010
US dollar 86.8 89.9 88.0 85.6 84.9Euro ... 37.9 37.4 37.0 39.1Japanese yen 21.7 23.5 20.8 17.2 19.0Pound sterling 11.0 13.0 16.5 14.9 12.9Australian dollar 3.0 4.3 6.0 6.6 7.6Swiss franc 7.1 6.0 6.0 6.8 6.4Canadian dollar 3.5 4.5 4.2 4.3 5.3Hong Kong dollar 1.0 2.2 1.8 2.7 2.4Swedish krona 0.3 2.5 2.2 2.7 2.2New Zealand dollar 0.2 0.6 1.1 1.9 1.6Korean won 0.2 0.8 1.1 1.2 1.5Singapore dollar 1.1 1.1 0.9 1.2 1.4Norwegian krone 0.2 1.5 1.4 2.1 1.3Mexican peso 0.5 0.8 1.1 1.3 1.3Indian rupee 0.1 0.2 0.3 0.7 0.9Russian rouble 0.3 0.3 0.6 0.7 0.9Chinese renminbi 0.0 0.0 0.1 0.5 0.9Polish zloty 0.1 0.5 0.4 0.8 0.8Turkish lira ... 0.0 0.1 0.2 0.7South African rand 0.4 0.9 0.7 0.9 0.7Brazilian real 0.2 0.5 0.3 0.4 0.7Danish krone 0.3 1.2 0.9 0.8 0.6New Taiwan dollar 0.1 0.3 0.4 0.4 0.5Hungarian forint 0.0 0.0 0.2 0.3 0.4Malaysian ringgit 0.0 0.1 0.1 0.1 0.3Thai baht 0.1 0.2 0.2 0.2 0.2Czech koruna 0.3 0.2 0.2 0.2 0.2Philippine peso 0.0 0.0 0.0 0.1 0.2Chilean peso 0.1 0.2 0.1 0.1 0.2Indonesian rupiah 0.1 0.0 0.1 0.1 0.2Israeli new shekel ... 0.1 0.1 0.2 0.2Colombian peso ... 0.0 0.0 0.1 0.1Romanian leu ... ... 0.0 0.0 0.1Saudi riyal 0.1 0.1 0.0 0.1 0.1Argentine peso 0.1 ... 0.0 0.0 0.0Peruvian nuevo sol ... 0.0 0.0 0.0 0.0Lithuanian litas ... ... 0.0 0.0 0.0Other currencies 8.7 6.6 6.5 7.6 4.6
All currencies 200.0 200.0 200.0 200.0 200.0
Table B.4
1 Because two currencies are involved in each transaction, the sum of the percentage shares of individual currencies totals 200% instead of 100%. Adjusted for local and cross-border inter-dealer double-counting (ie “net-net” basis).
Currency distribution of global foreign exchange market turnover1
Percentage shares of average daily turnover in April
12
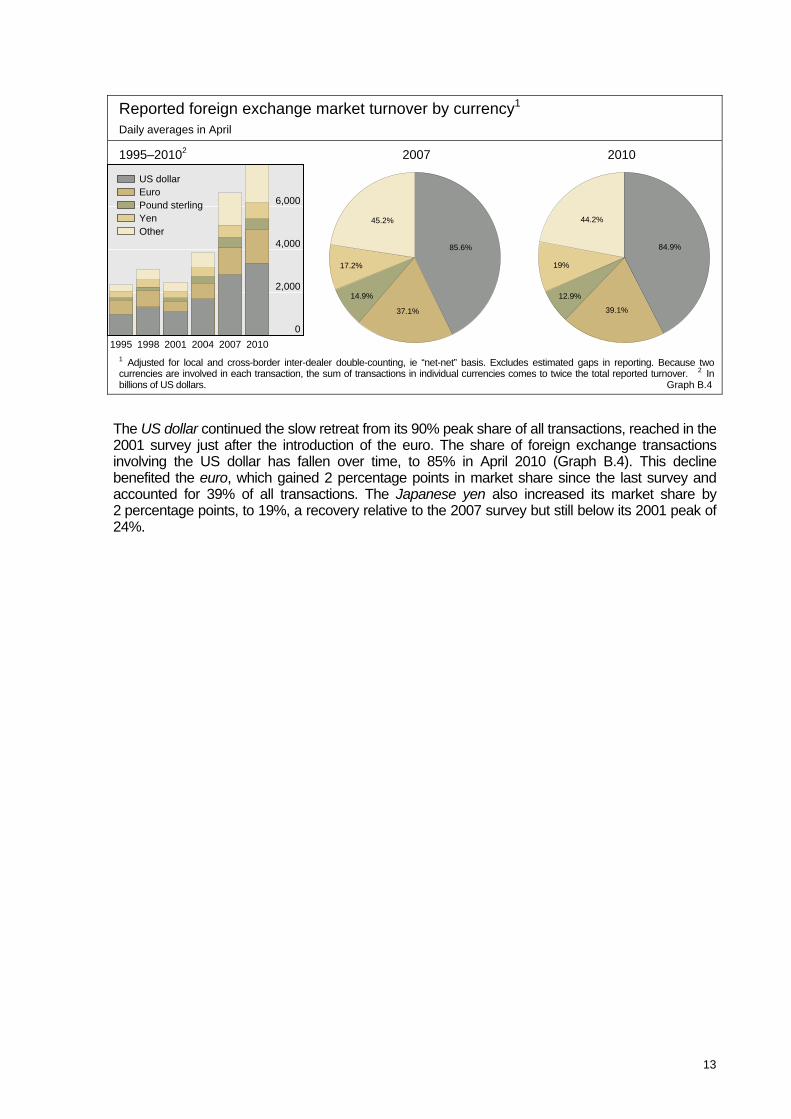
Reported foreign exchange market turnover by currency1 Daily averages in April
1995–20102 2007 2010
85.6%
17.2%
14.9%
37.1%
45.2%
US dollarEuroPound sterlingYenOther
6,000
84.9%
19%
12.9%
39.1%
44.2%
4,000
2,000
0
1995 1998 2001 2004 2007 20101 Adjusted for local and cross-border inter-dealer double-counting, ie “net-net” basis. Excludes estimated gaps in reporting. Because two currencies are involved in each transaction, the sum of transactions in individual currencies comes to twice the total reported turnover. 2 In billions of US dollars. Graph B.4
The US dollar continued the slow retreat from its 90% peak share of all transactions, reached in the 2001 survey just after the introduction of the euro. The share of foreign exchange transactions involving the US dollar has fallen over time, to 85% in April 2010 (Graph B.4). This decline benefited the euro, which gained 2 percentage points in market share since the last survey and accounted for 39% of all transactions. The Japanese yen also increased its market share by 2 percentage points, to 19%, a recovery relative to the 2007 survey but still below its 2001 peak of 24%.
Sterling gave up most of its post-euro gains, with its share returning to the immediate post-euro level of around 13%. Trading in the Swiss franc also declined marginally to 6.4% from 6.8% in April 2007. The Australian and Canadian dollars both increased their share by around 1 percentage point, to 7.6% and 5.3%, respectively.
13
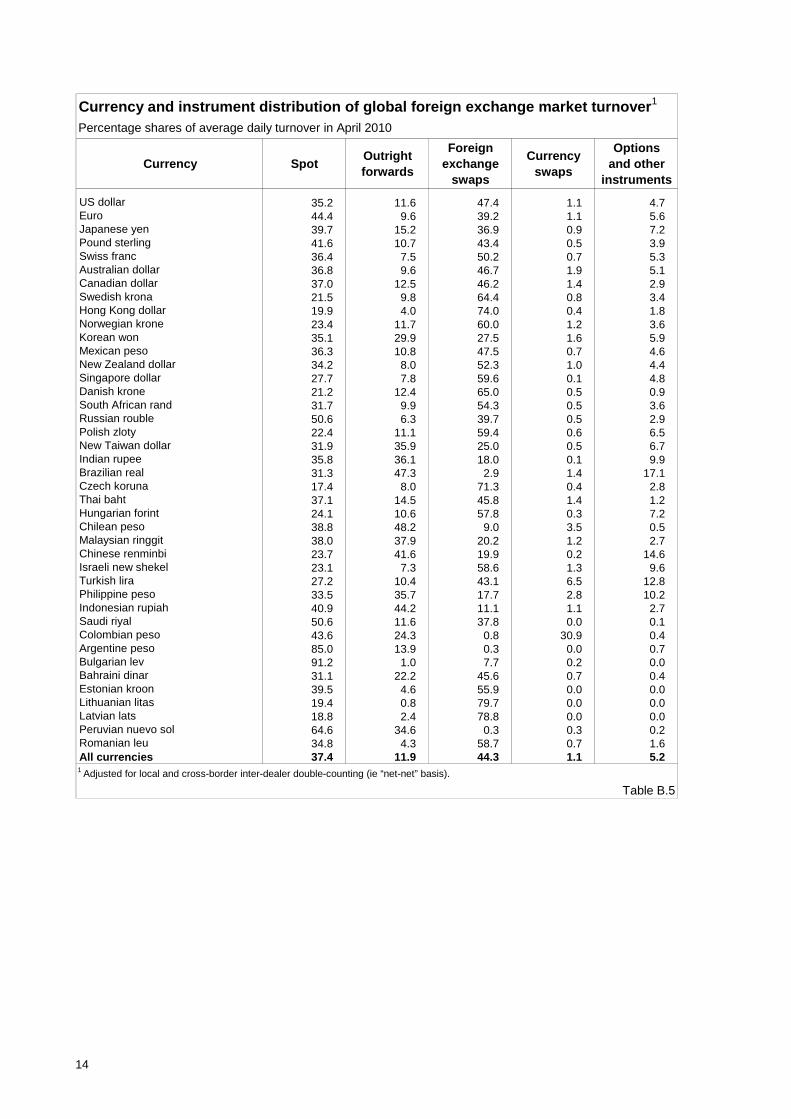
Currency SpotOutright forwards
Foreign exchange
swaps
Currency swaps
Options and other
instruments
US dollar 35.2 11.6 47.4 1.1 4.7Euro 44.4 9.6 39.2 1.1 5.6Japanese yen 39.7 15.2 36.9 0.9 7.2Pound sterling 41.6 10.7 43.4 0.5 3.9Swiss franc 36.4 7.5 50.2 0.7 5.3Australian dollar 36.8 9.6 46.7 1.9 5.1Canadian dollar 37.0 12.5 46.2 1.4 2.9Swedish krona 21.5 9.8 64.4 0.8 3.4Hong Kong dollar 19.9 4.0 74.0 0.4 1.8Norwegian krone 23.4 11.7 60.0 1.2 3.6Korean won 35.1 29.9 27.5 1.6 5.9Mexican peso 36.3 10.8 47.5 0.7 4.6New Zealand dollar 34.2 8.0 52.3 1.0 4.4Singapore dollar 27.7 7.8 59.6 0.1 4.8Danish krone 21.2 12.4 65.0 0.5 0.9South African rand 31.7 9.9 54.3 0.5 3.6Russian rouble 50.6 6.3 39.7 0.5 2.9Polish zloty 22.4 11.1 59.4 0.6 6.5New Taiwan dollar 31.9 35.9 25.0 0.5 6.7Indian rupee 35.8 36.1 18.0 0.1 9.9Brazilian real 31.3 47.3 2.9 1.4 17.1Czech koruna 17.4 8.0 71.3 0.4 2.8Thai baht 37.1 14.5 45.8 1.4 1.2Hungarian forint 24.1 10.6 57.8 0.3 7.2Chilean peso 38.8 48.2 9.0 3.5 0.5Malaysian ringgit 38.0 37.9 20.2 1.2 2.7Chinese renminbi 23.7 41.6 19.9 0.2 14.6Israeli new shekel 23.1 7.3 58.6 1.3 9.6Turkish lira 27.2 10.4 43.1 6.5 12.8Philippine peso 33.5 35.7 17.7 2.8 10.2Indonesian rupiah 40.9 44.2 11.1 1.1 2.7Saudi riyal 50.6 11.6 37.8 0.0 0.1Colombian peso 43.6 24.3 0.8 30.9 0.4Argentine peso 85.0 13.9 0.3 0.0 0.7Bulgarian lev 91.2 1.0 7.7 0.2 0.0Bahraini dinar 31.1 22.2 45.6 0.7 0.4Estonian kroon 39.5 4.6 55.9 0.0 0.0Lithuanian litas 19.4 0.8 79.7 0.0 0.0Latvian lats 18.8 2.4 78.8 0.0 0.0Peruvian nuevo sol 64.6 34.6 0.3 0.3 0.2Romanian leu 34.8 4.3 58.7 0.7 1.6All currencies 37.4 11.9 44.3 1.1 5.2
Table B.5
1 Adjusted for local and cross-border inter-dealer double-counting (ie “net-net” basis).
Currency and instrument distribution of global foreign exchange market turnover1
Percentage shares of average daily turnover in April 2010
14

6. Turnover by currency pair
Reported foreign exchange market turnover by currency pair1 Daily averages in April, in billions of US dollars
US dollar currency pairs Euro currency pairs New currency pairs in 2010
0
40
80
120
160
200
1998 2001 2004 2007 2010
YenSterlingSwiss franc
1,250 80EuroYenSterlingSwiss franc
USD/BRL
USD/CNY
USD/HKD
USD/INR
USD/KRW
USD/ZAR
JPY/AUD
JPY/NZD
1,00060
750
40
500
20250
0 0
1998 2001 2004 2007 20101 Adjusted for local and cross-border double-counting, ie “net-net” basis. Excludes estimated gaps in reporting. Graph B.5
Turnover by currency pair in April 2010 (Table B.6) showed no major changes in ranking from three years earlier, although absolute turnover in the major currency pairs tended to increase, with the exception of dollar/sterling transactions (Graph B.5). USD/EUR remained by far the dominant pair (with a 28% share), followed at some distance by USD/JPY with a slight increase to 14% of turnover. The USD/GBP pair continued to retreat from its 2004 peak to a 9% share or about the level reached in pre-euro 1998, but the EUR/GBP pair gained almost 60% in absolute terms.
Amount % Amount % Amount % Amount %
US dollar/euro 372 30 541 28 892 27 1,101 28US dollar/yen 250 20 328 17 438 13 568 14US dollar/sterling 129 10 259 13 384 12 360 9US dollar/Australian dollar 51 4 107 6 185 6 249 6US dollar/Swiss franc 59 5 83 4 151 5 168 4US dollar/Canadian dollar 54 4 77 4 126 4 182 5US dollar/Swedish krona 6 0 7 0 57 2 45 1US dollar/other 193 16 300 16 612 18 705 18Euro/yen 36 3 61 3 86 3 111 3Euro/sterling 27 2 47 2 69 2 109 3Euro/Swiss franc 13 1 30 2 62 2 72 2Euro/other 22 2 44 2 123 4 162 4Other currency pairs 28 2 50 3 139 4 149 4
All currency pairs 1,239 100 1,934 100 3,324 100 3,981 100
Table B.6
Global foreign exchange market turnover by currency pair1
Daily averages in April, in billions of US dollars and percentages
20102004 2007Currency pair
2001
1 Adjusted for local and cross-border inter-dealer double-counting (ie “net-net” basis).
The 2010 survey has expanded the detailed coverage of emerging economy currencies, including additional currency pairs. New currency pairs relate mainly to transactions between the US dollar and Asian currency pairs (Graph B.5).
15
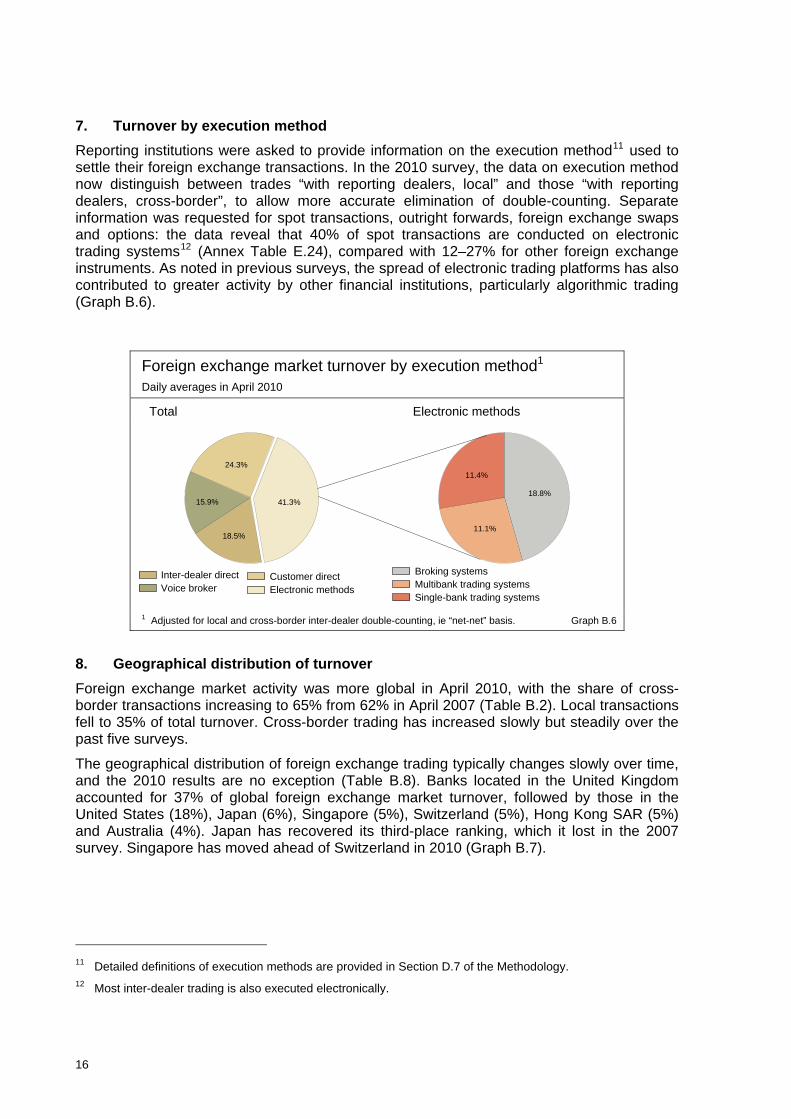
7. Turnover by execution method
Reporting institutions were asked to provide information on the execution method11 used to settle their foreign exchange transactions. In the 2010 survey, the data on execution method now distinguish between trades “with reporting dealers, local” and those “with reporting dealers, cross-border”, to allow more accurate elimination of double-counting. Separate information was requested for spot transactions, outright forwards, foreign exchange swaps and options: the data reveal that 40% of spot transactions are conducted on electronic trading systems12 (Annex Table E.24), compared with 12–27% for other foreign exchange instruments. As noted in previous surveys, the spread of electronic trading platforms has also contributed to greater activity by other financial institutions, particularly algorithmic trading (Graph B.6).
Foreign exchange market turnover by execution method1 Daily averages in April 2010
Total Electronic methods
41.3%15.9%
18.5%
24.3%
18.8%
11.1%
11.4%
Broking systemsMultibank trading systemsSingle-bank trading systems
Inter-dealer directVoice broker
Customer directElectronic methods
1 Adjusted for local and cross-border inter-dealer double-counting, ie “net-net” basis. Graph B.6
8. Geographical distribution of turnover
Foreign exchange market activity was more global in April 2010, with the share of cross-border transactions increasing to 65% from 62% in April 2007 (Table B.2). Local transactions fell to 35% of total turnover. Cross-border trading has increased slowly but steadily over the past five surveys.
The geographical distribution of foreign exchange trading typically changes slowly over time, and the 2010 results are no exception (Table B.8). Banks located in the United Kingdom accounted for 37% of global foreign exchange market turnover, followed by those in the United States (18%), Japan (6%), Singapore (5%), Switzerland (5%), Hong Kong SAR (5%) and Australia (4%). Japan has recovered its third-place ranking, which it lost in the 2007 survey. Singapore has moved ahead of Switzerland in 2010 (Graph B.7).
11 Detailed definitions of execution methods are provided in Section D.7 of the Methodology. 12 Most inter-dealer trading is also executed electronically.
16

Geographical distribution of foreign exchange market turnover1 Daily averages in April, in per cent
0
10
20
30
United United Japan Singapore Switzerland Hong Kong AustraliaKingdom States
199519982001200420072010
1 Adjusted for local double-counting, ie “net-gross” basis. Graph B.7
In dollar terms, the greatest increases in trading activity were in the United Kingdom ($370 billion), the United States ($159 billion), Japan ($62 billion) and Hong Kong SAR ($57 billion). Other countries that saw significant growth relative to the 2007 survey include Denmark, France, Singapore, Finland, Turkey, Australia and Spain.13
Regional foreign exchange turnover by instrument1 Daily averages in April 2010, in billions of US dollars
0
800
1,600
2,400
North Western Asia-PacificAmerica Europe
0
20
40
60
Eastern Latin Africa andEurope America Middle East
Spot transactionsOutright forwards and FX swapsCurrency swapsOptionsOther
1 Regional aggregates are adjusted for local inter-dealer double-counting, ie trades between reporting dealers located in the same countries were halved, ie “net-gross” basis. Regional aggregates are not adjusted for intra-regional double-counting, ie trades between reporting dealers located in different countries of the same region were not halved. Graph B.8
13 D Mihaljek and F Packer, BIS Quarterly Review, December 2010 (forthcoming), discuss in depth what
distinguishes turnover in FX derivatives in emerging markets from that in developed countries.
17
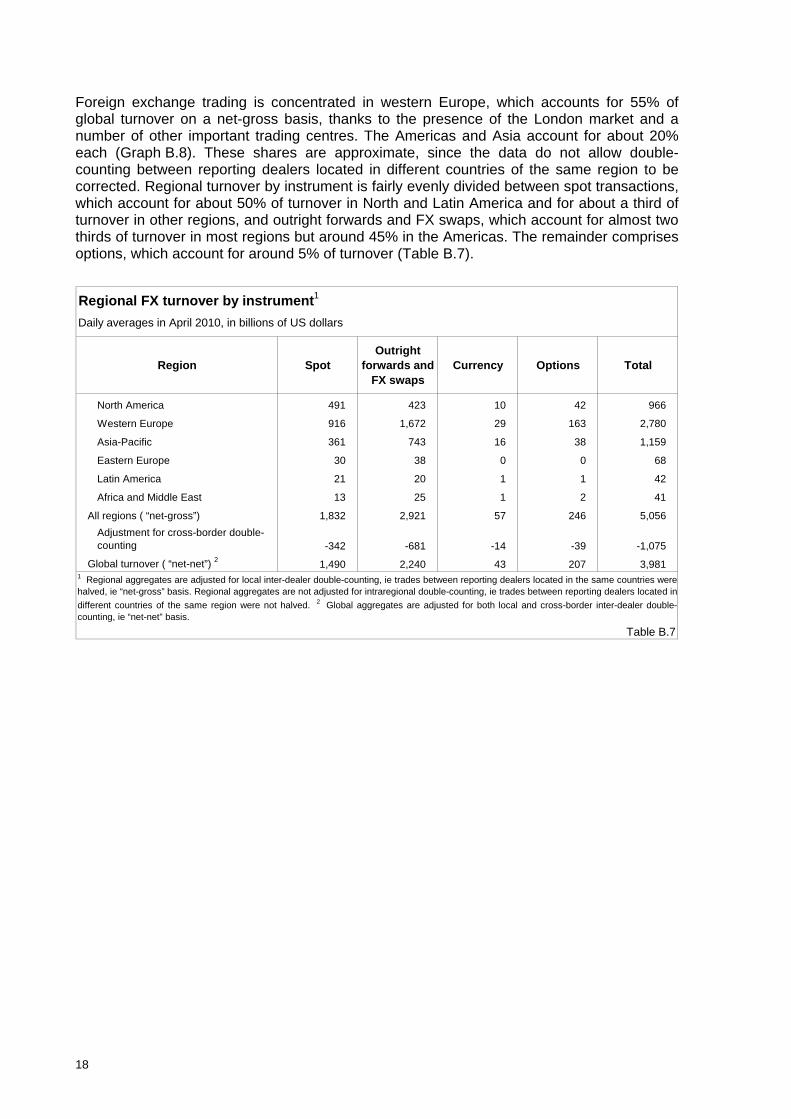
Foreign exchange trading is concentrated in western Europe, which accounts for 55% of global turnover on a net-gross basis, thanks to the presence of the London market and a number of other important trading centres. The Americas and Asia account for about 20% each (Graph B.8). These shares are approximate, since the data do not allow double-counting between reporting dealers located in different countries of the same region to be corrected. Regional turnover by instrument is fairly evenly divided between spot transactions, which account for about 50% of turnover in North and Latin America and for about a third of turnover in other regions, and outright forwards and FX swaps, which account for almost two thirds of turnover in most regions but around 45% in the Americas. The remainder comprises options, which account for around 5% of turnover (Table B.7).
Region SpotOutright
forwards and FX swaps
Currency Options Total
North America 491 423 10 42 966
Western Europe 916 1,672 29 163 2,780
Asia-Pacific 361 743 16 38 1,159
Eastern Europe 30 38 0 0 68
Latin America 21 20 1 1 42
Africa and Middle East 13 25 1 2 41
All regions ( “net-gross”) 1,832 2,921 57 246 5,056
Adjustment for cross-border double-counting -342 -681 -14 -39 -1,075
Global turnover ( “net-net”) 2 1,490 2,240 43 207 3,981
Table B.7
Regional FX turnover by instrument1
Daily averages in April 2010, in billions of US dollars
1 Regional aggregates are adjusted for local inter-dealer double-counting, ie trades between reporting dealers located in the same countries werehalved, ie “net-gross” basis. Regional aggregates are not adjusted for intraregional double-counting, ie trades between reporting dealers located in
different countries of the same region were not halved. 2 Global aggregates are adjusted for both local and cross-border inter-dealer double-counting, ie “net-net” basis.
18

Amount % Amount % Amount % Amount % Amount %
Argentina 2 0 … … 1 0 1 0 2 0 Australia 48 2 54 3 107 4 176 4 192 4 Austria 12 1 8 0 15 1 19 0 20 0 Bahrain 3 0 3 0 3 0 3 0 5 0 Belgium 27 1 10 1 21 1 50 1 33 1 Brazil² 5 0 6 0 4 0 6 0 14 0 Bulgaria … … … … … … 1 0 1 0 Canada 38 2 44 3 59 2 64 1 62 1 Chile 1 0 2 0 2 0 4 0 6 0 China³ 0 0 … … 1 0 9 0 20 0 Chinese Taipei 5 0 5 0 9 0 16 0 18 0 Colombia … … 0 0 1 0 2 0 3 0 Czech Republic 5 0 2 0 2 0 5 0 5 0 Denmark 28 1 24 1 42 2 88 2 120 2 Estonia … … … … 0 0 1 0 1 0 Finland 4 0 2 0 2 0 8 0 31 1 France 77 4 50 3 67 3 127 3 152 3 Germany 100 5 91 5 120 5 101 2 109 2 Greece 7 0 5 0 4 0 5 0 5 0 Hong Kong SAR 80 4 68 4 106 4 181 4 238 5 Hungary 1 0 1 0 3 0 7 0 4 0 India 2 0 3 0 7 0 38 1 27 1 Indonesia 2 0 4 0 2 0 3 0 3 0 Ireland 11 1 9 1 8 0 11 0 15 0 Israel … … 1 0 5 0 8 0 10 0 Italy 29 1 18 1 23 1 38 1 29 1 Japan 146 7 153 9 207 8 250 6 312 6 Korea 4 0 10 1 21 1 35 1 44 1 Latvia … … … … 2 0 3 0 2 0 Lithuania … … … … 1 0 1 0 1 0 Luxembourg 23 1 13 1 15 1 44 1 33 1 Malaysia 1 0 1 0 2 0 3 0 7 0 Mexico 9 0 9 1 15 1 15 0 17 0 Netherlands 43 2 31 2 52 2 25 1 18 0 New Zealand 7 0 4 0 7 0 13 0 9 0 Norway 9 0 13 1 14 1 32 1 22 0 Peru … … 0 0 0 0 1 0 1 0 Philippines 1 0 1 0 1 0 2 0 5 0 Poland 3 0 5 0 7 0 9 0 8 0 Portugal 4 0 2 0 2 0 4 0 4 0 Romania … … … … … … 3 0 3 0 Russia 7 0 10 1 30 1 50 1 42 1 Saudi Arabia 2 0 2 0 2 0 4 0 5 0 Singapore 145 7 104 6 134 5 242 6 266 5 Slovakia … … 1 0 2 0 3 0 0 0 Slovenia … … 0 0 0 0 0 0 … …South Africa 9 0 10 1 10 0 14 0 14 0 Spain 20 1 8 0 14 1 17 0 29 1 Sweden 16 1 25 1 32 1 44 1 45 1 Switzerland 92 4 76 4 85 3 254 6 263 5 Thailand 3 0 2 0 3 0 6 0 7 0 Turkey … … 1 0 3 0 4 0 17 0 United Kingdom 685 33 542 32 835 32 1,483 35 1,854 37 United States 383 18 273 16 499 19 745 17 904 18
Total4 2,099 100 1,705 100 2,608 100 4,281 100 5,056 100
Table B.8
1 Adjusted for local inter-dealer double-counting (ie “net-gross” basis). 2 Data for 1998 only cover spot transactions. 3 Data from 1998 to 2004
only cover spot transactions. 4 Estimated coverage of the FX market ranged between 90% and 100% in most countries.
Geographical distribution of global foreign exchange market turnover1
Daily averages in April, in billions of US dollars and per cent
2010Country
1998 2001 2004 2007
19

C. Amounts outstanding at end-June 2010
1. Growth of global foreign exchange positions
This part of the report focuses on the results of the second part of the Triennial Central Bank Survey of Foreign Exchange and Derivatives Market Activity together with those of the semiannual OTC derivatives market statistics, both at end-June 2010. The triennial survey provides a benchmark for the regular semiannual survey of positions in the global OTC derivatives market. Graph C.1 combines the triennial end-June survey data (blue dots on vertical lines) with the more frequent semiannual data. While the semiannual survey relies on data provided by 59 major dealers in the G10 countries, the triennial survey expands coverage to over 400 market participants in 42 countries and jurisdictions worldwide (including the regular semiannual participants). Both surveys cover the worldwide consolidated positions of reporting dealers (notional amounts outstanding and gross market values) of foreign exchange instruments traded in OTC markets (outright forwards, foreign exchange swaps, currency swaps, currency options and other foreign exchange instruments). The coverage of the triennial surveys has been 9% higher than that of the semiannual surveys in terms of amounts outstanding in both 2007 and 2010.
Global OTC foreign exchange market1 BIS triennial and semiannual surveys, notional amounts outstanding,2 in trillions of US dollars
By data type
0.00
1.25
2.50
3.75
0
20
40
60
1998 2001 2004 2007 2010
Gross market values (lhs)
1 Outright forwards, foreign exchange swaps, currency swaps, currency options and other foreign exchange instruments. 2 Dots mark triennial survey dates and notional amounts outstanding in the triennial survey data.
Source: BIS. Graph C.1
20

Notional amounts
Gross market values
%2 Notional amounts
Gross market values
%2
Foreign exchange contracts 57,604 1,612 2.8 62,933 3,158 5.0
Outright forwards and FX swaps 29,775 668 2.2 31,935 1,330 4.2
Currency swaps 14,130 666 4.7 18,890 1,372 7.3
Options 13,662 279 2.0 12,107 456 3.8
Other 37 ... ... 1 ... ...
Memo: Exchange-traded currency contracts3326 ... ... 386 ... ...
Global positions in OTC derivatives markets by type of instrument1
Amounts outstanding, in billions of US dollars
Table C.1
1 Adjusted for inter-dealer double-counting. 2 Gross market values as a percentage of notional amounts. 3 Sources: FOW TRADEdata; Futures Industry Association; various futures and options exchanges.
Positions at end-June 2007 Positions at end-June 2010
Growth in the positions of OTC foreign exchange instruments was moderate at 9%, compared with an increase of 83% in notional amounts outstanding of currency instruments in the 2004–07 period. The 2007 and 2010 BIS triennial surveys bracket a period of strong growth in amounts outstanding, as shown by comparison with the semiannual data in Graph C.1. Notional amounts outstanding in all instruments peaked in June 2008, declined thereafter and recovered somewhat by June 2010.
Notional amounts outstanding provide useful information on the structure of the OTC foreign exchange market but should not be interpreted as a measure of the counterparty risk of these positions. While no single comprehensive measure of risk exists, a useful concept is the cost of replacing all open contracts at the prevailing market prices. This measure, called gross market value, increased at a considerably higher rate (96%) than notional amounts during the reporting period, to $3.2 trillion at the end of June 2010.
Sharp asset price movements following the bankruptcy of Lehman Brothers in September 2008 resulted in a strong rise of gross market values (Graph C.1, left-hand scale) in the second half of 2008. Gross market values declined rapidly again in subsequent periods as prices moved closer to their pre-crisis values, but increased again in the first half of 2010 as foreign exchange markets went through another bout of turbulence.
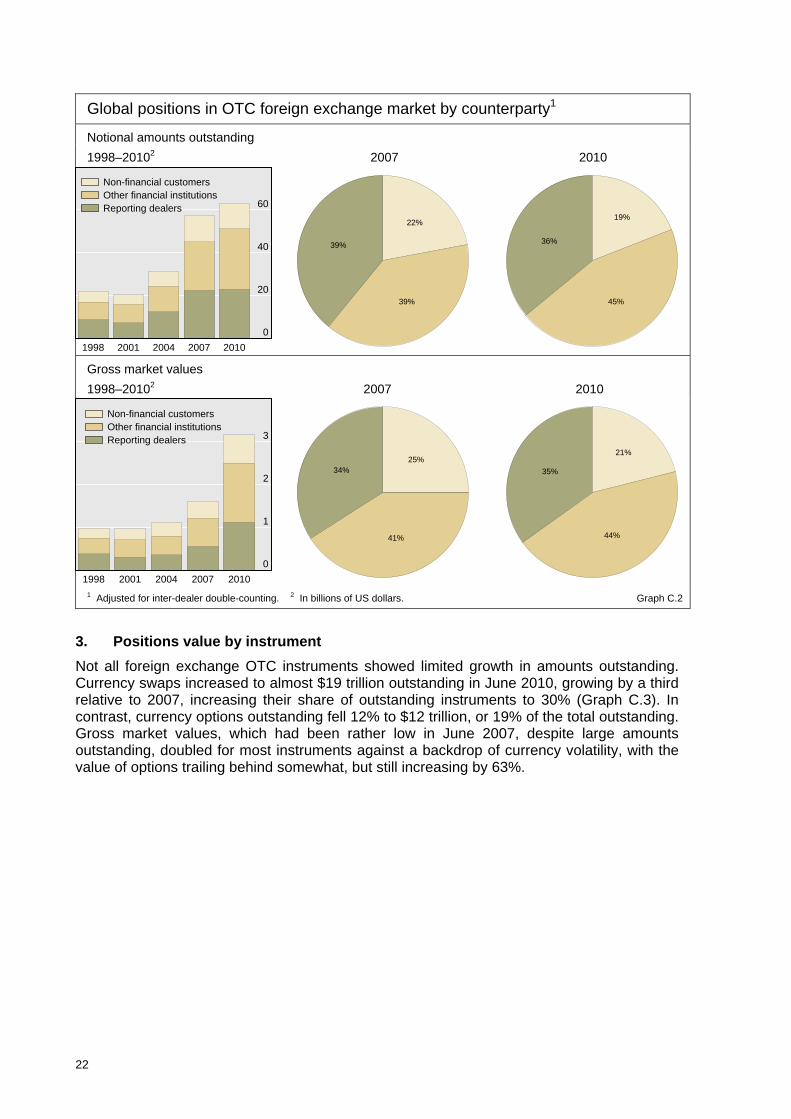
2. Positions by counterparty
Data for amounts outstanding by counterparty show that the increase in global foreign exchange market positions in 2010 is also due mainly to the enlarged trading activity of other financial institutions (counterparties such as non-reporting banks, hedge funds, pension funds, mutual funds, insurance companies and central banks). While a surge in activity with both reporting dealers and other financial institutions had already accounted for most of the growth in total amounts outstanding in 2007, the latter category’s share (45%) surpassed transactions between reporting dealers (36%) for the first time in 2010 (Graph C.2). Reporting dealers and non-financial customers had both accounted for a 39% share of outstanding OTC foreign exchange instruments in June 2007.
In terms of counterparty risk, as measured by gross market values, the position appears largely the same in relative terms. While absolute amounts at risk have doubled (Graph C.2), this doubling has been distributed fairly evenly in all market segments.
21
Global positions in OTC foreign exchange market by counterparty1
Notional amounts outstanding
1998–20102 2007 2010
22%
39%
39%
Non-financial customersOther financial institutionsReporting dealers 60
19%
45%
36%40
20
0
1998 2001 2004 2007 2010
Gross market values
1998–20102 2007 2010
25%
41%
34%
Non-financial customersOther financial institutionsReporting dealers
0
1
2
3
21%
44%
35%
1998 2001 2004 2007 2010
1 Adjusted for inter-dealer double-counting. 2 In billions of US dollars. Graph C.2
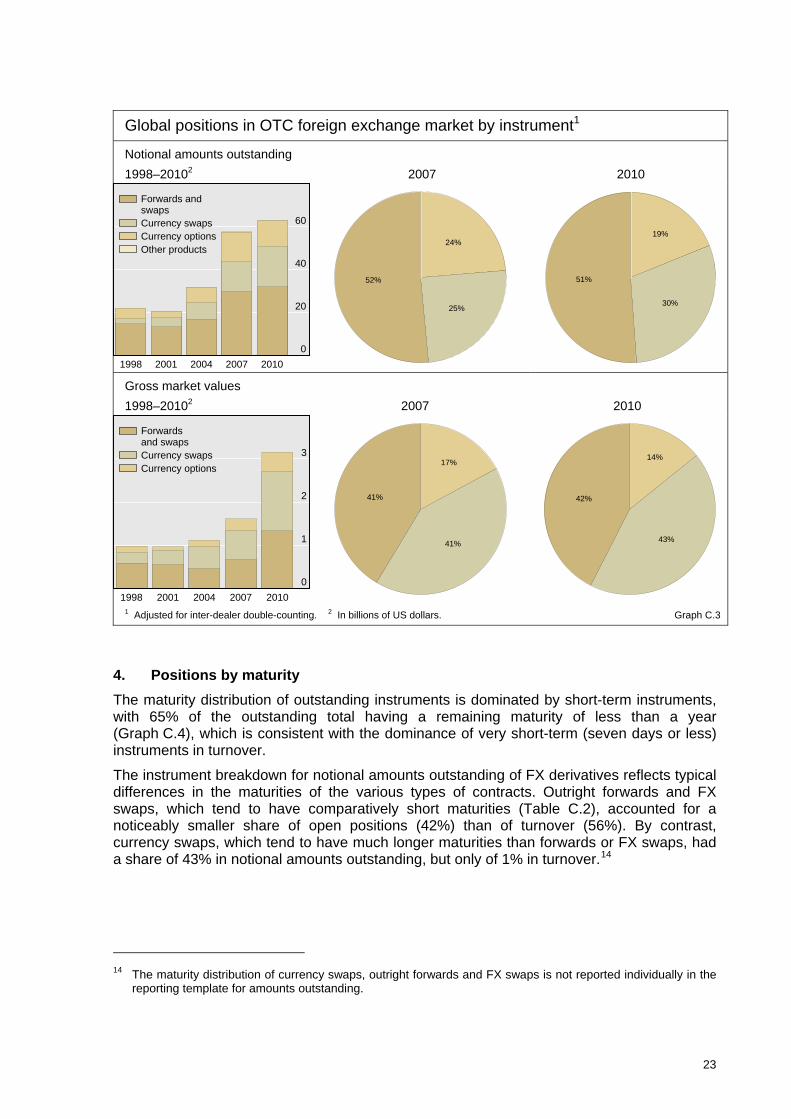
3. Positions value by instrument
Not all foreign exchange OTC instruments showed limited growth in amounts outstanding. Currency swaps increased to almost $19 trillion outstanding in June 2010, growing by a third relative to 2007, increasing their share of outstanding instruments to 30% (Graph C.3). In contrast, currency options outstanding fell 12% to $12 trillion, or 19% of the total outstanding. Gross market values, which had been rather low in June 2007, despite large amounts outstanding, doubled for most instruments against a backdrop of currency volatility, with the value of options trailing behind somewhat, but still increasing by 63%.
22
Global positions in OTC foreign exchange market by instrument1
Notional amounts outstanding
1998–20102 2007 2010
24%
25%
52%
Forwards andswapsCurrency swapsCurrency optionsOther products
6019%
30%
51%
40
20
0
1998 2001 2004 2007 2010
Gross market values
1998–20102 2007 2010
17%
41%
41%
Forwards and swapsCurrency swapsCurrency options
0
1
2
3 14%
43%
42%
1998 2001 2004 2007 20101 Adjusted for inter-dealer double-counting. 2 In billions of US dollars. Graph C.3
4. Positions by maturity
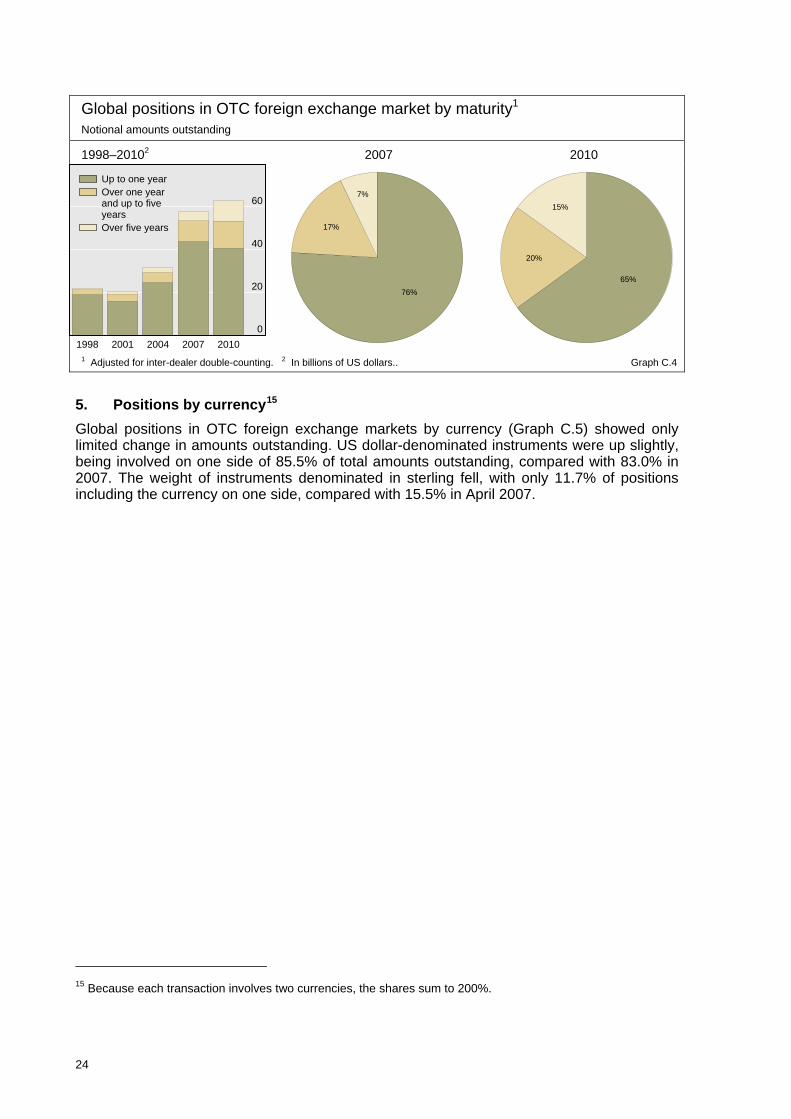
The maturity distribution of outstanding instruments is dominated by short-term instruments, with 65% of the outstanding total having a remaining maturity of less than a year (Graph C.4), which is consistent with the dominance of very short-term (seven days or less) instruments in turnover.
The instrument breakdown for notional amounts outstanding of FX derivatives reflects typical differences in the maturities of the various types of contracts. Outright forwards and FX swaps, which tend to have comparatively short maturities (Table C.2), accounted for a noticeably smaller share of open positions (42%) than of turnover (56%). By contrast, currency swaps, which tend to have much longer maturities than forwards or FX swaps, had a share of 43% in notional amounts outstanding, but only of 1% in turnover.14
14 The maturity distribution of currency swaps, outright forwards and FX swaps is not reported individually in the
reporting template for amounts outstanding.
23
Global positions in OTC foreign exchange market by maturity1 Notional amounts outstanding
1998–20102 2007 2010
76%
17%
7%
Up to one yearOver one yearand up to fiveyearsOver five years
60
65%
20%
15%
40
20
0
1998 2001 2004 2007 20101 Adjusted for inter-dealer double-counting. 2 In billions of US dollars.. Graph C.4
5. Positions by currency15
Global positions in OTC foreign exchange markets by currency (Graph C.5) showed only limited change in amounts outstanding. US dollar-denominated instruments were up slightly, being involved on one side of 85.5% of total amounts outstanding, compared with 83.0% in 2007. The weight of instruments denominated in sterling fell, with only 11.7% of positions including the currency on one side, compared with 15.5% in April 2007.
15 Because each transaction involves two currencies, the shares sum to 200%.
24

2004 2007 2010 2004 2007 2010 2004 2007 2010
Total 31,499 57,604 62,933 24,702 43,905 50,825 6,789 13,662 12,107
by currency US dollar 28,402 47,783 53,821 22,024 37,407 44,205 6,378 10,376 9,615 Euro 11,726 21,356 22,710 9,248 16,205 18,528 2,478 5,151 4,182 Yen 7,265 12,178 12,611 5,178 7,130 8,411 2,088 5,048 4,200 Pound sterling 5,078 8,933 7,383 4,013 7,701 6,426 1,065 1,232 957 Swiss franc 1,590 3,451 4,319 1,276 2,424 3,358 313 1,027 961 Canadian dollar 1,261 2,604 2,801 1,044 2,183 2,482 217 421 318 Australian dollar 1,583 3,056 3,892 1,169 2,344 3,265 414 712 627 Swedish krona 877 1,601 1,590 790 1,434 1,453 88 167 136 Other 5,216 14,246 16,739 4,663 10,984 13,521 538 3,189 3,216
by maturity4
One year or less 24,706 43,830 40,671 18,618 5,519 6,328 6,089 10,605 8,388 Over 1 year and up to 5 years 4,712 9,793 12,744 4,114 1,267 1,787 598 2,702 2,584 Over 5 years 2,067 4,222 9,526 1,966 535 746 101 375 1,136
Table C.2
1 Adjusted for inter-dealer double-counting. 2 Including “other” instruments. Counting both currency sides of every foreign exchange transaction
means that the currency breakdown sums to 200% of the aggregate. 3 Outright forwards, foreign exchange swaps and currency swaps. 4 Due to incomplete maturity breakdown, components do not always sum to totals.
Options
Global positions in OTC foreign exchange markets1
Amounts outstanding at end-June, in billions of US dollars
Total2Of which
Forwards and swaps3
25

Gross market values increased particularly strongly in euro- and sterling-denominated instruments by end-June 2010. Market values for US dollar-denominated instruments declined on a relative basis from 91% of the total to 81% (Graph C.5).
Global positions in OTC foreign exchange market by currency1
Notional amounts outstanding
1995–20102 2007 2010
83%
21%
16%
37%
43%
US dollarEuroPound sterlingYenOther
100
80
86%
20%
12%36%
47%
60
40
20
0
1998 2001 2004 2007 2010
Gross market values
1998–20102 2007 2010
91%
13%
35%
28%
34%
US dollarEuroPound sterlingYenOther
0
1
2
3
4
5
81%
21%
44%
24%
29%
1998 2001 2004 2007 2010
1 Adjusted for inter-dealer double-counting. 2 In billions of US dollars. Graph C.5
26

D. Methodology
I. Background to the Triennial Central Bank Survey
In April and at end-June of this year, 53 and 42 central banks and monetary authorities, respectively, participated in both parts of the eighth Triennial Central Bank Survey of Foreign Exchange and Derivatives Market Activity (“the triennial survey”). The objective of the survey is to provide the most comprehensive and internationally consistent information on the size and structure of global foreign exchange markets, allowing policymakers and market participants to better monitor patterns of activity in the global financial system.16 Coordinated by the BIS, participating institutions collect data in April from 1,30917 banks and other dealers (so-called reporting dealers) on turnover in foreign exchange instruments. For the survey, each participating institution is requested to collect data from the reporting dealers in its jurisdiction and calculate aggregate national data. These data are then provided to the BIS, which compiles and publishes the global aggregates. In addition, more than 4,000 institutions located around the world participated in the second part of the triennial survey, which covers data on amounts outstanding at end-June 2010 and complements the turnover data collected in the first part of the survey.18 The triennial survey has been conducted every three years since April 1989, covering data on amounts outstanding since 1995.
It should be noted that previous triennial surveys have used the expression “traditional foreign exchange markets” to refer to spot transactions, outright forwards and foreign exchange swaps. This expression excludes currency swaps, currency options and other foreign exchange instruments, which are classified under OTC derivative instruments. Starting with the 2010 survey, the expression “global foreign exchange markets” includes all six foreign exchange instruments. The analysis will henceforth distinguish between spot transactions and other related foreign exchange instruments (outright forwards, foreign exchange swaps, currency swaps, currency options and other foreign exchange products).
II. Statistical notes
This section contains a description of the methodology, general definitions, classification principles and compilation procedures for the most recent Triennial Central Bank Survey of Foreign Exchange and Derivatives Market Activity carried out by central banks and monetary authorities in April and at end-June 2010. The main purpose of the statistics collected by the triennial survey is to provide a measure of the size and structure of foreign exchange and other derivatives markets and to monitor key developments in these segments. In conjunction with the banking and securities statistics, the data provide a more comprehensive picture of activity in global financial markets.
Two main statistical frameworks are implemented by the BIS for the collection of foreign exchange and derivatives statistics: the triennial survey and the semiannual OTC derivatives market statistics. The triennial survey covers data not only on turnover in foreign exchange in the month of April, ie the first part of the triennial survey, but also on OTC derivatives amounts outstanding at end-June, ie the second part of the triennial survey. The amounts outstanding part of the survey covers positions across a wider range of market risk categories and is used to benchmark the representativeness of the more frequent semiannual survey on OTC derivatives market activity.19
16 The triennial survey complements more frequent regional surveys conducted in the following financial centres by local
foreign exchange committees: Australia, Canada, Hong Kong SAR, London, New York, Singapore and Tokyo. 17 Compared with 1,260 in 2007. 18 The second part of the triennial survey is conducted on a consolidated basis and covers not only positions in FX-related
instruments but also those in interest rate, equity-linked, commodity, credit and other derivative products. 19 Detailed results of the June 2010 semiannual and triennial Surveys are available on the BIS website at
www.bis.org/publ/otc_hy1011.htm.
27
The present report is focused exclusively on the statistics covering foreign exchange market instruments.
The format of the 2010 survey includes the following main refinements and clarifications of reporting procedures as compared with the previous survey:
– The list of currency pairs has been expanded in order to capture transactions involving currencies typically used in carry trade strategies, namely AUD/JPY, NZD/JPY, USD/ZAR and USD/HKD. Trades in the Brazilian real, Chinese renminbi, Indian rupee and Korean won against the US dollar were also collected.
– A more detailed counterparty breakdown for each instrument has been collected for identification of execution method in order to include a distinction between “with reporting dealers, local” and “with reporting dealers, cross-border”. The more detailed counterparty breakdown allows for a more accurate correction of inter-dealer double-counting.
Despite these changes, the data presented here can be considered as being largely comparable with those of the previous triennial survey in 2007, notwithstanding the different structure of the results. Weighted average coverage of foreign exchange markets in reporting countries increased from 96% in 2007 to 97% in 2010.
1. Coverage and basic features of the 2010 survey
The triennial survey collects data on the following foreign exchange instruments that can be divided into two groups: spot transactions, for which only turnover data are collected; and outright forwards, foreign exchange swaps, currency swaps, currency options and other foreign exchange instruments, for which both turnover and amounts outstanding are reported.
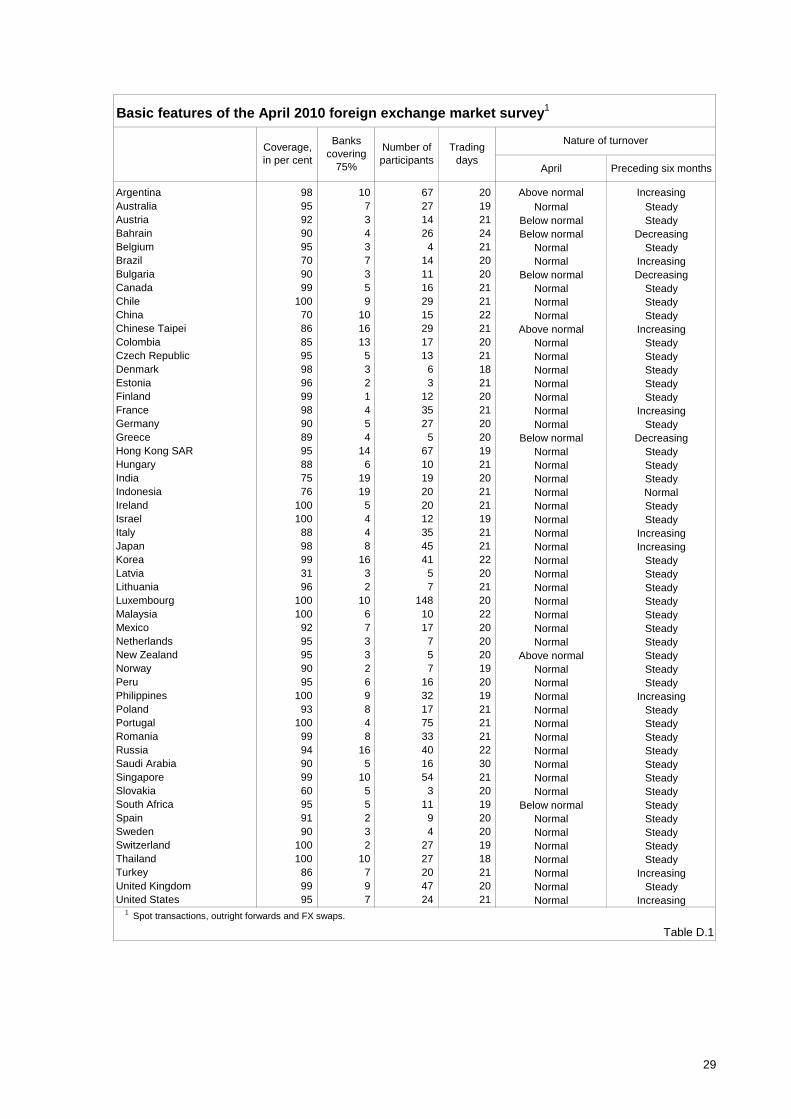
In the turnover part, the instrument breakdown distinguishes between spot transactions, forwards, swaps, options and other foreign exchange products (see Section B.3). The counterparty breakdown distinguishes between transactions with reporting dealers, with other financial institutions and with non-financial customers. A further local/cross-border breakdown was requested (see Section B.4). The currency breakdown includes separate reporting of all reporting countries’ currencies (see Section B.5). The maturity breakdown distinguishes between transactions with original maturity up to seven days, over seven days and up to one year, and over one year (see Section B.6). Information on the execution method was also requested for foreign exchange transactions (see Section B.7). Central banks and monetary authorities were also requested to provide information on the percentage coverage of the survey in their country, the number of banks covering 75% of the reported totals, the number of participants, the number of trading days20 and the nature of the turnover in April 2010 and during the preceding six months. The results are shown in Table D.1.
The second part of the triennial survey covers notional amounts outstanding and gross market values of foreign exchange, but also of interest rate, equity, commodity, credit and other derivatives. The following instrument breakdown was requested for the foreign exchange market risk category: forwards and swaps,21 currency swaps, currency options sold, currency options bought and other foreign exchange products. As in the turnover part of the survey, data for the OTC foreign exchange instruments are broken down by counterparty (see Section C.2), currency (see Section C.5) and remaining maturity (see Section C.4).
20 Trading days are requested so that daily averages can be calculated. 21 This category covers outright forwards and foreign exchange swaps.
28
April Preceding six months
Argentina 98 10 67 20 Above normal IncreasingAustralia 95 7 27 19 Normal SteadyAustria 92 3 14 21 Below normal SteadyBahrain 90 4 26 24 Below normal DecreasingBelgium 95 3 4 21 Normal SteadyBrazil 70 7 14 20 Normal IncreasingBulgaria 90 3 11 20 Below normal DecreasingCanada 99 5 16 21 Normal SteadyChile 100 9 29 21 Normal SteadyChina 70 10 15 22 Normal SteadyChinese Taipei 86 16 29 21 Above normal IncreasingColombia 85 13 17 20 Normal SteadyCzech Republic 95 5 13 21 Normal SteadyDenmark 98 3 6 18 Normal SteadyEstonia 96 2 3 21 Normal SteadyFinland 99 1 12 20 Normal SteadyFrance 98 4 35 21 Normal IncreasingGermany 90 5 27 20 Normal SteadyGreece 89 4 5 20 Below normal DecreasingHong Kong SAR 95 14 67 19 Normal SteadyHungary 88 6 10 21 Normal SteadyIndia 75 19 19 20 Normal SteadyIndonesia 76 19 20 21 Normal NormalIreland 100 5 20 21 Normal SteadyIsrael 100 4 12 19 Normal SteadyItaly 88 4 35 21 Normal IncreasingJapan 98 8 45 21 Normal IncreasingKorea 99 16 41 22 Normal SteadyLatvia 31 3 5 20 Normal SteadyLithuania 96 2 7 21 Normal SteadyLuxembourg 100 10 148 20 Normal SteadyMalaysia 100 6 10 22 Normal SteadyMexico 92 7 17 20 Normal SteadyNetherlands 95 3 7 20 Normal SteadyNew Zealand 95 3 5 20 Above normal SteadyNorway 90 2 7 19 Normal SteadyPeru 95 6 16 20 Normal SteadyPhilippines 100 9 32 19 Normal IncreasingPoland 93 8 17 21 Normal SteadyPortugal 100 4 75 21 Normal SteadyRomania 99 8 33 21 Normal SteadyRussia 94 16 40 22 Normal SteadySaudi Arabia 90 5 16 30 Normal SteadySingapore 99 10 54 21 Normal SteadySlovakia 60 5 3 20 Normal SteadySouth Africa 95 5 11 19 Below normal SteadySpain 91 2 9 20 Normal SteadySweden 90 3 4 20 Normal SteadySwitzerland 100 2 27 19 Normal SteadyThailand 100 10 27 18 Normal SteadyTurkey 86 7 20 21 Normal IncreasingUnited Kingdom 99 9 47 20 Normal SteadyUnited States 95 7 24 21 Normal Increasing
Table D.1
Basic features of the April 2010 foreign exchange market survey1
Nature of turnoverTrading
daysNumber of participants
Banks covering
75%
Coverage, in per cent
1 Spot transactions, outright forwards and FX swaps.
29

2. Types of data collected
2.1 Turnover data
Turnover data provide a measure of market activity as well as an indication of market liquidity. Turnover is defined as the absolute gross value of all new deals entered into during the month of April 2010, and is measured in terms of the nominal or notional amount of the contracts.
No distinction is made between sales and purchases (ie a purchase of $5 million against sterling and a sale of $7 million against sterling would amount to a gross turnover of $12 million). Direct cross-currency transactions are counted as single transactions; however, cross-currency transactions passing through a vehicle currency are recorded as two separate deals against the vehicle currency. The gross amount of each transaction is recorded once, and netting arrangements and offsets are ignored. For turnover of transactions with variable nominal or notional principal amounts, the nominal or notional principal amount on the transaction date is reported.
The basis for reporting is in principle the location of the sales desk of any trade, even if deals entered into in different locations are booked in a central location. Thus, transactions concluded by offices located abroad are not reported by the country of location of the head office, but by that of the office abroad (insofar as the latter is a reporting institution in one of the other 52 reporting countries). Where no sales desk was involved in a deal, the trading desk is used to determine the location of deals.
In all cases, transactions are reported to the BIS in US dollar equivalents, with non-dollar amounts generally converted into US dollars using the exchange rate prevailing on the date of the trade.
As in the previous triennial foreign exchange market surveys, turnover data are collected over a one-month period, the month of April, in order to reduce the likelihood of very short-term variations in activity contaminating the data. The data collected for the survey reflect all transactions entered into during the calendar month of April 2010, regardless of whether delivery or settlement was made during that month.
In order to allow a comparison across countries, daily turnover averages are computed by dividing aggregate monthly turnover for the country in question by the number of days in April on which the foreign exchange and derivatives markets in that country were open. The number of trading days ranged from 18 to 22 in April 2010, with the exception of Saudi Arabia (30 days) and Bahrain (24 days).
2.2 Nominal or notional amounts outstanding
Nominal or notional amounts outstanding provide a measure of market size, and can also provide a rough proxy for the potential transfer of price risk in derivatives markets. They are also comparable to measures of market size in related underlying cash markets and shed useful light on the relative size and growth of cash and derivatives markets.
Nominal or notional amounts outstanding are defined as the absolute gross nominal or notional value of all deals concluded and still open on the last business day of June 2010; end-June is chosen to provide consistency with the semiannual OTC derivatives market statistics for the G10 countries.
As in the case of the turnover data, no distinction is made between sales and purchases of derivative instruments and the resulting claims and liabilities of open contracts. In the case of foreign exchange swaps, which are concluded as spot/forward transactions, only the unsettled forward part of the deal is reported. If foreign exchange swaps are executed on a forward/forward basis, amounts outstanding are reported separately for both legs. For other forward contracts and swaps, the transactions are always reported as one transaction only. For transactions with variable notional principal amounts, notional principal amounts at the reporting date are provided.
30
In contrast to the turnover part of the survey, data on notional amounts outstanding data are collected on a consolidated basis, ie including positions of all branches and (majority-owned) subsidiaries of a given institution. All these positions were added together and reported by the parent institution only to the monetary institution in the country where the parent institution had its head office. In addition, all in-house deals and deals with other domestic and foreign offices of the same institution were netted out.
Amounts outstanding are reported to the BIS in US dollar equivalents, with non-dollar amounts converted into US dollars using end-of-period exchange rates.
2.3 Gross market values
Another measure of the size of derivatives markets is provided by the gross market values. Gross market values also supply information about the scale of gross transfer of price risks in the derivatives markets. Furthermore, gross market values at current market prices provide a measure of derivatives market size and economic significance that is readily comparable across markets and products.
Gross market values are defined as the sums of the absolute values of all open contracts with either positive or negative replacement values calculated at market prices prevailing on the reporting date. Replacement value denotes the price to be received or paid if the instrument were sold in the market at the time of reporting. Market values are therefore the amounts at which a contract could be exchanged in a current transaction between willing parties, other than in a forced or liquidation sale. If a quoted price was available for a contract, the number of trading units was multiplied by that market price. If a quoted market price was not available, the reporting institution provided its best estimate of market value based on the quoted price of a similar contract or on valuation techniques such as discounted cash flows.
Gross market value is defined as the value of all open contracts before counterparty or any other netting. Thus, the gross positive market value of a firm’s outstanding contracts is the sum of all positive replacement values of a firm’s contracts. Similarly, the gross negative market value is the sum of all negative values of a firm’s contracts.
The term “gross” is used to indicate that contracts with positive and negative replacement values with the same counterparty should not be netted. Nor should the sums of positive and negative contract values be set off against each other within a risk category.
In the case of forwards and swaps, the market (or replacement) value of outstanding contracts to which the reporter is a counterparty is either positive, zero or negative, depending on how underlying prices have moved since the contract’s initiation.
Unlike forwards or swaps, OTC options have a market value at initiation, which is equal to the premium paid to the writer of the option. Throughout their life, option contracts can only have a positive market value for the buyer and a negative market value for the seller. If a quoted market price is available for a contract, the market value for that contract is the product of the number of trading units of the contract multiplied by that market price. If a quoted market price is not available, the market value of an outstanding option contract is determined on the basis of secondary market prices for options with the same strike prices and remaining maturities as the options being valued, or by using option pricing models. In an option pricing model, current quotes of forward prices for the underlying (spot prices for American options) and the implied volatility and market interest rate relevant to the option’s maturity would normally be used to calculate the “market” values.
In the case of options, the gross positive market value is the sum of the current market values of all purchased options, and gross negative market value is the sum of the values of sold options. As is the case for other instruments, options sold and purchased with the same counterparty are not netted against each other, nor are options that are bought and sold against the same underlying offset against each other.
Data on gross market values are reported, in US dollar equivalents, with non-dollar amounts converted into US dollars using end-of-period exchange rates.
31
3. Instruments
Foreign exchange transactions are broken down into spot transactions and three types of plain vanilla derivative instrument, ie forwards, swaps and options. Plain vanilla instruments are defined as products traded in generally liquid markets according to more or less standardised contracts and market conventions. If a transaction is composed of several plain vanilla components, each part is in principle to be reported separately. In addition, there is a separate category for “other foreign exchange products”. This mainly includes transactions with a variable notional principal amount or contract features which act to multiply leverage.
The definitions used for foreign exchange market instruments are the following:
Spot transaction: single outright transaction involving the exchange of two currencies at a rate agreed on the date of the contract for value or delivery (cash settlement) within two business days.
Outright forward: transaction involving the exchange of two currencies at a rate agreed on the date of the contract for value or delivery (cash settlement) at some time in the future (more than two business days later). This category also includes non-deliverable forwards and other forward contracts for differences.
Foreign exchange swap: transaction which involves the actual exchange of two currencies (principal amount only) on a specific date at a rate agreed at the time of the conclusion of the contract (the short leg), and a reverse exchange of the same two currencies at a date further in the future at a rate (generally different from the rate applied to the short leg) agreed at the time of the contract (the long leg).
Currency swap: contract which commits two counterparties to exchange streams of interest payments in different currencies for an agreed period of time and usually to exchange principal amounts in different currencies at a pre-agreed exchange rate at maturity.
Currency option/warrant: option contract that gives the right to buy or sell a currency with another currency at a specified exchange rate during a specified period. This category also includes exotic currency options such as average rate options and barrier options.
Currency swaption: option to enter into a currency swap contract.
Other foreign exchange products: the options section takes precedence in the instrument classification, so that any foreign exchange derivative product with an embedded option is to be reported as an option. All other foreign exchange derivative products are in principle to be reported in the forwards or swaps section. However, foreign exchange derivative instruments which involve several features and where a breakdown into individual plain vanilla components is impractical or impossible, such as swaps with underlying notional principal in one currency and fixed or floating interest rate payments based on interest rates in currencies other than the notional (differential swaps or diff swaps), are to be allocated to the residual category of “other” foreign exchange products.
4. Counterparties
Following the methodology of previous triennial central bank surveys, reporting institutions were requested to provide a counterparty breakdown for each instrument depending on whether the counterparty was a reporting dealer, another financial institution or a non-financial customer.22 In the turnover part of the survey, reporters were also requested to
22 One of the main purposes of this counterparty breakdown is to eliminate double-counting; see Section 8.
32
provide separate information on local and cross-border transactions according to the location of the counterparty.23
To enable survey participants to identify other reporting dealers and thereby perform the counterparty allocation, a list containing all institutions that participated in the turnover part of the survey was circulated to all market participants together with the main reporting templates. For the amounts outstanding part, however, the list of institutions circulated for the counterparty allocation comprised only those 59 reporters that regularly participate in the semiannual OTC derivatives survey. The reason for not including all reporting institutions was to ensure consistency with the regular derivatives market statistics and to limit the reporting burden. While this approach makes it difficult to accurately eliminate double-counting of trades between non-regular reporters (see Section 8), the amounts involved are believed to be small.
The following three counterparty categories are covered in both parts of the triennial survey:
“Reporting dealers” are defined as financial institutions that actively participate in local and global foreign exchange and derivatives markets. These are mainly large commercial and investment banks and securities houses that (i) participate in the inter-dealer market and/or (ii) have active business with large customers, such as large corporate firms, governments and other non-reporting financial institutions; in other words, reporting dealers are institutions that are actively buying and selling currency and OTC derivatives both for their own account and/or to meet customer demand. In practice, reporting dealers are often those institutions that actively or regularly deal through electronic platforms, such as EBS or Reuters dealing facilities. The category of reporting dealers also includes the branches and subsidiaries of institutions operating in multiple locations that have sales desks, but not necessarily trading desks, which conduct active business with large customers.
“Other financial institutions” are defined as those financial institutions that are not classified as reporting dealers. Thus, the term mainly covers all other financial institutions, such as smaller commercial banks, investment banks and securities houses, and in addition mutual funds, pension funds, hedge funds, currency funds, money market funds, building societies, leasing companies, insurance companies, financial subsidiaries of corporate firms and central banks.
“Non-financial customers” are defined as any counterparty other than those described above, ie mainly non-financial end users, such as corporations and governments.
5. Currency and other market risk breakdowns
5.1 Turnover
In order to obtain consistent data on turnover in principal currency segments of the foreign exchange market, reporting institutions are asked to report turnover data on foreign exchange contracts and to identify the main currency pairs. Thus, data should be provided separately for trading in the domestic currency, the US dollar and the euro against each other and against the individual currencies listed below.
JPY: Japanese yen
GBP: pound sterling
CHF: Swiss franc
CAD: Canadian dollar
AUD: Australian dollar
SEK: Swedish krona
Other currencies
23 In other words, not according to its nationality.
33

Due to the importance of carry trade activities, data are also collected for transactions involving certain combination of currencies that – not being explicitly listed with the main currency pairs above – are typically present in carry trade strategies, namely USD/ZAR, USD/HKD, AUD/JPY and NZD/JPY. Data on trades in the Brazilian real, Chinese renminbi, Indian rupee and Korean won against the US dollar were also collected.
Moreover, given the increasing interest in the identification of turnover in all reporting countries’ currencies, reporting dealers were requested to provide supplementary information on total turnover for the following currencies:
Argentine peso, Australian dollar, Bahraini dinar, Brazilian real, Bulgarian lev, Canadian dollar, Chilean peso, Chinese renminbi, New Taiwan dollar, Colombian peso, Czech koruna, Danish krone, Estonian kroon, Hong Kong dollar, Hungarian forint, Indian rupee, Indonesian rupiah, Israeli new shekel, Japanese yen, Korean won, Latvian lats, Lithuanian litas, Malaysian ringgit, Mexican peso, New Zealand dollar, Norwegian krone, Peruvian new sol, Philippine peso, Polish zloty, Romanian leu, Russian rouble, Saudi riyal, Singapore dollar, South African rand, Swedish krona, Swiss franc, Thai baht, Turkish lira and pound sterling.
5.2 Amounts outstanding
For amounts outstanding of foreign exchange contracts, the following currency breakdown was requested: USD, EUR, JPY, GBP, CHF and other currencies.
In addition, reporting institutions were asked to identify amounts for other individual currencies if they had a material amount of outstanding contracts in those currencies, ie if a notional amount outstanding in a currency for a given instrument was greater than 2% of the total notional amounts outstanding for that instrument. However, participating central banks had discretion in defining a “material” amount for reporting of other individual currencies.
In contrast to the turnover part of the survey, amounts outstanding of foreign exchange contracts are broken down on a single currency basis. This means that the notional amount outstanding and the gross positive or negative market value of each contract are reported twice, according to the currencies making up the two “legs” of the contract. The total of the amounts reported for individual currencies thus sums to 200% of total contracts outstanding, while total reported contracts represent only half of the sum of the individual currency components. For example, a reporting institution entering into a forward contract to purchase US dollars in exchange for euros with a notional principal amount of $100 million will have reported $100 million in the US dollar column, another $100 million in the euro column and $100 million in the “Total” column.
6. Maturities
6.1 Turnover
Transactions in outright forwards and foreign exchange swaps are broken down on an original maturity basis according to the following maturity bands:
seven days or less
over seven days and up to one year
over one year
For outright forward contracts, the maturity band of the transaction is determined by the difference between the delivery date and the date of the initiation of the contract. For both spot/forward and forward/forward foreign exchange swaps, the maturity band for the contract is determined by the difference between the due date of the second or long leg of the swap and the date of the initiation of the contract.
34
6.2 Amounts outstanding
For amounts outstanding of foreign exchange contracts, a breakdown is requested by residual maturity between the following bands:
one year or less over one year and up to five years over five years
In the case of transactions where the first leg has not come due, the remaining maturity of each leg is determined as the difference between the reporting date and the settlement or due date, respectively, of the near- and far-end legs of the transaction.
7. Execution methods
Reporting institutions were asked to provide information on the execution method used to settle their foreign exchange transactions. Separate information was requested for spot, outright forwards, foreign exchange swaps and currency options.
Amounts outstanding are reported separately according to the following categories:
Interbank direct (inter-reporting dealer)
Executed between two dealers participating in the triennial survey and not intermediated by a third party. For example, a transaction executed via direct telephone communication or direct electronic dealing systems such as Reuters Conversational Dealing.
Customer direct (inter- dealer/customer)
Executed between a reporting dealer and either a customer or a non-reporting dealer, and not intermediated by a third party. For example, a deal executed via direct telephone communication or direct electronic dealing systems such as Reuters Conversational Dealing.
Electronic broking systems Executed via automated order matching system for foreign exchange dealers. Examples of such systems are EBS and Reuters Matching 2000/2.
Electronic trading systems Executed via a single-bank proprietary platform or a multibank dealing system. These systems are generally geared towards customers. Examples of multibank systems include FXAll, Currenex, FXConnect, Globalink and eSpeed.
Voice broker Executed via telephone communication with a foreign exchange voice broker.
8. Elimination of double-counting
Double-counting arises because transactions between two reporting entities are recorded by each of them, ie twice. In order to derive meaningful measures of overall market size, it is therefore necessary to halve the data on transactions between reporting dealers. To permit this, reporters are asked to distinguish deals contracted with other reporters (dealers) (see Section 4). The following methods of adjustment are applied for the three different types of data collected in the survey: turnover, notional amounts outstanding and gross market values.
35
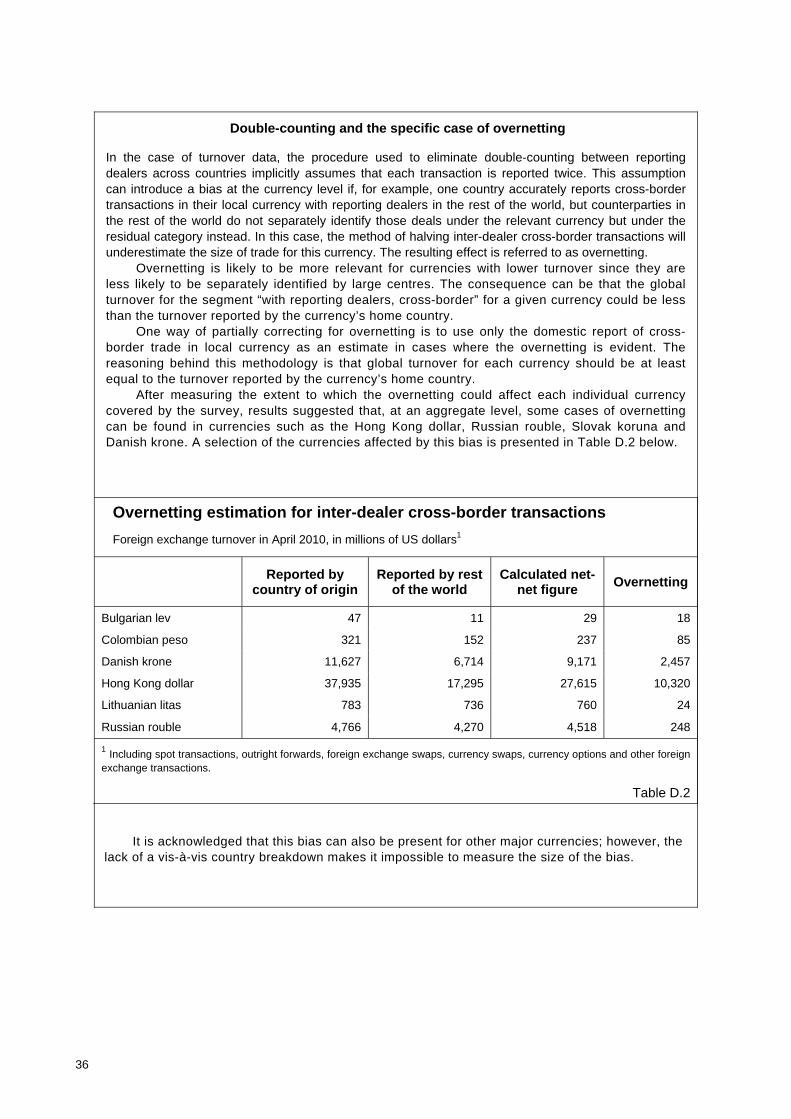
Double-counting and the specific case of overnetting
In the case of turnover data, the procedure used to eliminate double-counting between reporting dealers across countries implicitly assumes that each transaction is reported twice. This assumption can introduce a bias at the currency level if, for example, one country accurately reports cross-border transactions in their local currency with reporting dealers in the rest of the world, but counterparties in the rest of the world do not separately identify those deals under the relevant currency but under the residual category instead. In this case, the method of halving inter-dealer cross-border transactions will underestimate the size of trade for this currency. The resulting effect is referred to as overnetting.
Overnetting is likely to be more relevant for currencies with lower turnover since they are less likely to be separately identified by large centres. The consequence can be that the global turnover for the segment “with reporting dealers, cross-border” for a given currency could be less than the turnover reported by the currency’s home country.
One way of partially correcting for overnetting is to use only the domestic report of cross-border trade in local currency as an estimate in cases where the overnetting is evident. The reasoning behind this methodology is that global turnover for each currency should be at least equal to the turnover reported by the currency’s home country.
After measuring the extent to which the overnetting could affect each individual currency covered by the survey, results suggested that, at an aggregate level, some cases of overnetting can be found in currencies such as the Hong Kong dollar, Russian rouble, Slovak koruna and Danish krone. A selection of the currencies affected by this bias is presented in Table D.2 below.
Overnetting estimation for inter-dealer cross-border transactions
Foreign exchange turnover in April 2010, in millions of US dollars1
Reported by country of origin
Reported by rest of the world
Calculated net-net figure
Overnetting
Bulgarian lev 47 11 29 18
Colombian peso 321 152 237 85
Danish krone 11,627 6,714 9,171 2,457
Hong Kong dollar 37,935 17,295 27,615 10,320
Lithuanian litas 783 736 760 24
Russian rouble 4,766 4,270 4,518 248
1 Including spot transactions, outright forwards, foreign exchange swaps, currency swaps, currency options and other foreign exchange transactions.
Table D.2
It is acknowledged that this bias can also be present for other major currencies; however, the lack of a vis-à-vis country breakdown makes it impossible to measure the size of the bias.
36
8.1 Double-counting: netting of turnover data
In the case of turnover data, in order to obtain country aggregates, the BIS deducts one half of the amounts reported under “with local reporting dealers” to arrive at the so-called “net-gross” figure, ie country aggregates net of local inter-dealer double-counting. In a second step, to obtain global aggregates, the BIS performs an additional calculation, which is the deduction of one half of the amount reported under “with cross-border reporting dealers”, to arrive at the so-called “net-net” figure, ie the overall global turnover figure net of local and cross-border inter-dealer double-counting. Based on this principle, country aggregates are systematically shown in all tables as net-gross figures while global aggregates are presented as net-net totals.24
8.2 Double-counting: netting of data on amounts outstanding
The same methodology is applied to notional amounts outstanding. The only distinction from the turnover data is that amounts outstanding are collected on a worldwide consolidated basis, which implies that there is no relevant local/cross-border distinction. Double-counting is therefore eliminated by deducting half of the amount reported under “with reporting dealers”.
8.3 Double-counting: netting of gross market values
In the case of gross market values, for which data are also collected on a worldwide consolidated basis without distinction between local and cross-border deals, the adjustments for double-counting are performed as follows: in a first step, gross positive and negative market values of contracts held by reporting institutions are added together to obtain data on a “gross-gross” basis; in a second step, the gross negative market value of contracts with other reporting dealers is subtracted from the “gross-gross” data to immediately arrive at “net-net” figures. For gross market values reported by non-regular reporting institutions, ie dealers that did not participate in the regular derivatives market statistics exercise in the G10 countries, the adjustments for double-counting are assumed to be proportionate to those of the regular reporting institutions.
9. Gaps in reporting
Gaps in reporting stem from two sources: incomplete reporting, ie deals between two non-reporters in the countries providing data, and less than full country coverage. The second type of gap is mitigated by the existence of counterparty reports. The bulk of the cross-border business of institutions located in non-reporting countries is very likely to be captured by the reports of their counterparties if they are reporting dealers in countries participating in the survey. However, transactions between dealers in non-reporting countries, and between non-reporting dealers and customers or other financial institutions, are not captured.
An estimate of both gaps is provided for turnover in foreign exchange instruments (see Table D.3). The basis for estimating gaps due to incomplete reporting in the countries providing the data is the information supplied on the coverage of the survey in each participating country. For example, if in a given country the coverage of the survey as compared with total market activity was 90%, the gap from incomplete reporting is estimated to represent the remaining 10% of the total market turnover in that country.
Gaps are not estimated for notional amounts outstanding and gross market values because it can be assumed that the coverage for the two latter types of data is almost complete due to the worldwide consolidated reporting by all major dealers in the participating countries.
24 In some cases, tables by country also include gross-gross aggregates for information purposes.
37
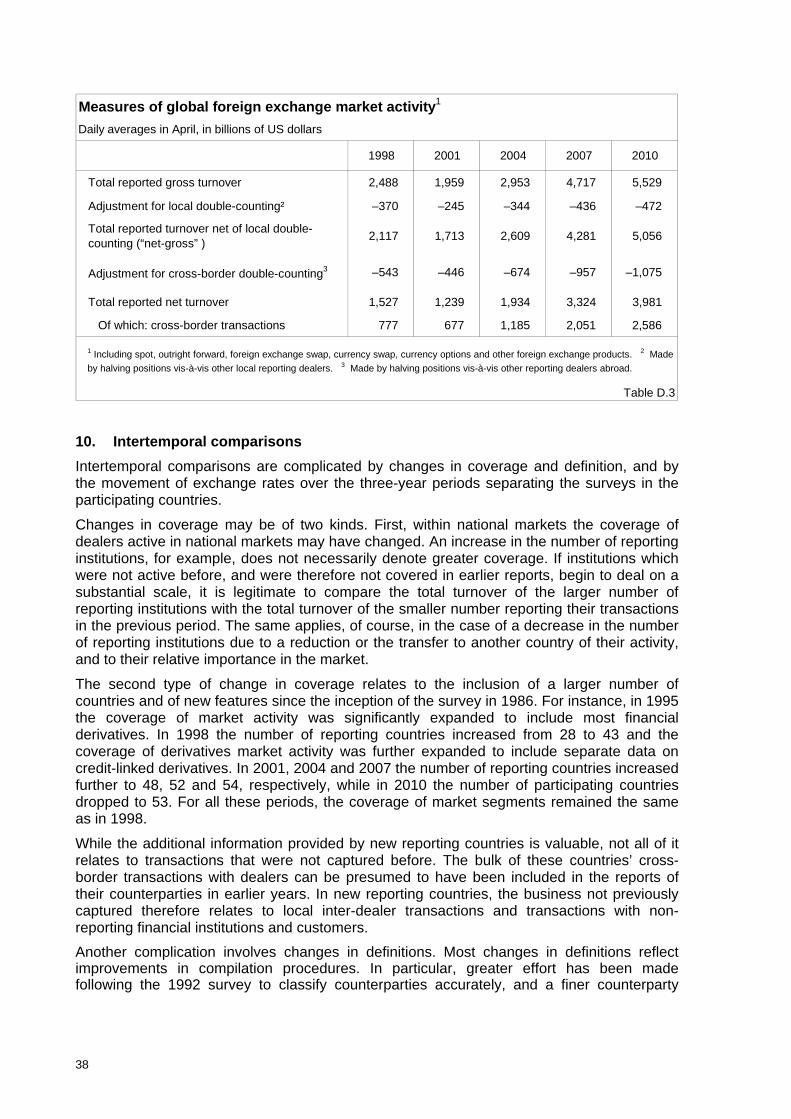
Daily averages in April, in billions of US dollars
1998 2001 2004 2007 2010
Total reported gross turnover 2,488 1,959 2,953 4,717 5,529
Adjustment for local double-counting² –370 –245 –344 –436 –472
Total reported turnover net of local double-counting (“net-gross” )
2,117 1,713 2,609 4,281 5,056
Adjustment for cross-border double-counting3 –543 –446 –674 –957 –1,075
Total reported net turnover 1,527 1,239 1,934 3,324 3,981
Of which: cross-border transactions 777 677 1,185 2,051 2,586
Measures of global foreign exchange market activity1
1 Including spot, outright forward, foreign exchange swap, currency swap, currency options and other foreign exchange products. 2 Made
by halving positions vis-à-vis other local reporting dealers. 3 Made by halving positions vis-à-vis other reporting dealers abroad.
Table D.3
10. Intertemporal comparisons
Intertemporal comparisons are complicated by changes in coverage and definition, and by the movement of exchange rates over the three-year periods separating the surveys in the participating countries.
Changes in coverage may be of two kinds. First, within national markets the coverage of dealers active in national markets may have changed. An increase in the number of reporting institutions, for example, does not necessarily denote greater coverage. If institutions which were not active before, and were therefore not covered in earlier reports, begin to deal on a substantial scale, it is legitimate to compare the total turnover of the larger number of reporting institutions with the total turnover of the smaller number reporting their transactions in the previous period. The same applies, of course, in the case of a decrease in the number of reporting institutions due to a reduction or the transfer to another country of their activity, and to their relative importance in the market.
The second type of change in coverage relates to the inclusion of a larger number of countries and of new features since the inception of the survey in 1986. For instance, in 1995 the coverage of market activity was significantly expanded to include most financial derivatives. In 1998 the number of reporting countries increased from 28 to 43 and the coverage of derivatives market activity was further expanded to include separate data on credit-linked derivatives. In 2001, 2004 and 2007 the number of reporting countries increased further to 48, 52 and 54, respectively, while in 2010 the number of participating countries dropped to 53. For all these periods, the coverage of market segments remained the same as in 1998.
While the additional information provided by new reporting countries is valuable, not all of it relates to transactions that were not captured before. The bulk of these countries’ cross-border transactions with dealers can be presumed to have been included in the reports of their counterparties in earlier years. In new reporting countries, the business not previously captured therefore relates to local inter-dealer transactions and transactions with non-reporting financial institutions and customers.
Another complication involves changes in definitions. Most changes in definitions reflect improvements in compilation procedures. In particular, greater effort has been made following the 1992 survey to classify counterparties accurately, and a finer counterparty
38
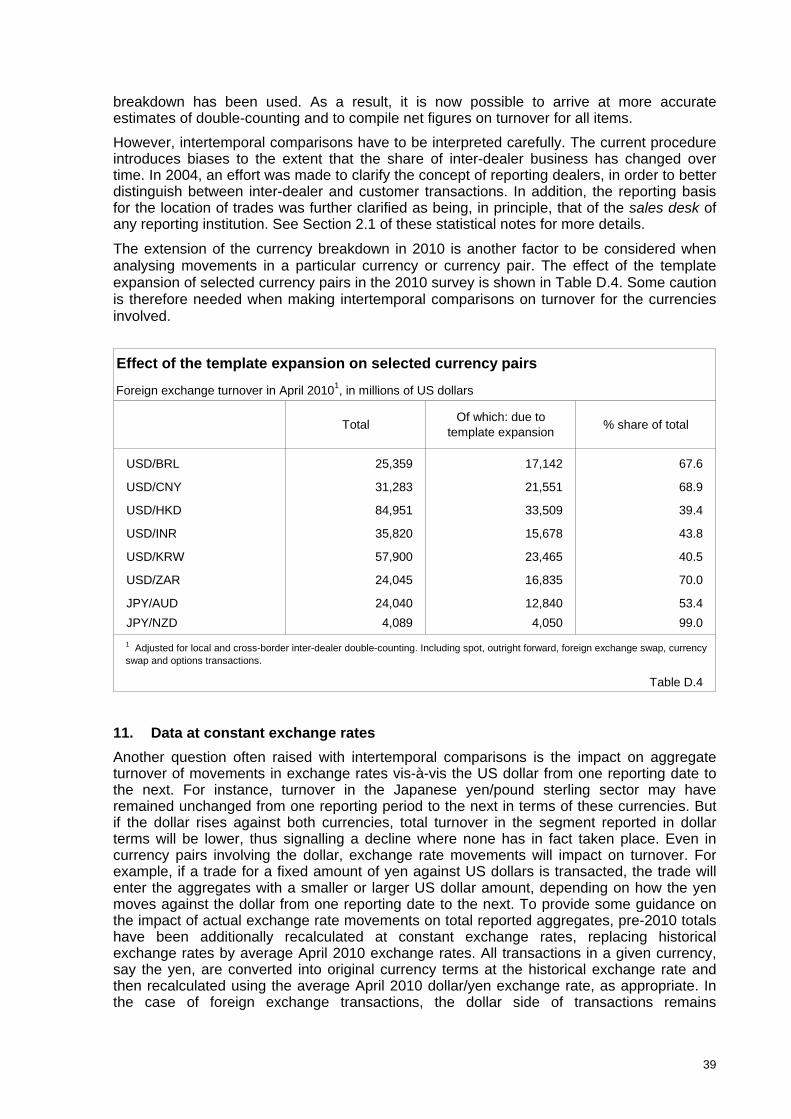
breakdown has been used. As a result, it is now possible to arrive at more accurate estimates of double-counting and to compile net figures on turnover for all items.
However, intertemporal comparisons have to be interpreted carefully. The current procedure introduces biases to the extent that the share of inter-dealer business has changed over time. In 2004, an effort was made to clarify the concept of reporting dealers, in order to better distinguish between inter-dealer and customer transactions. In addition, the reporting basis for the location of trades was further clarified as being, in principle, that of the sales desk of any reporting institution. See Section 2.1 of these statistical notes for more details.
The extension of the currency breakdown in 2010 is another factor to be considered when analysing movements in a particular currency or currency pair. The effect of the template expansion of selected currency pairs in the 2010 survey is shown in Table D.4. Some caution is therefore needed when making intertemporal comparisons on turnover for the currencies involved.
TotalOf which: due to
template expansion% share of total
USD/BRL 25,359 17,142 67.6
USD/CNY 31,283 21,551 68.9
USD/HKD 84,951 33,509 39.4
USD/INR 35,820 15,678 43.8
USD/KRW 57,900 23,465 40.5
USD/ZAR 24,045 16,835 70.0
JPY/AUD 24,040 12,840 53.4
JPY/NZD 4,089 4,050 99.0
Table D.4
1 Adjusted for local and cross-border inter-dealer double-counting. Including spot, outright forward, foreign exchange swap, currency swap and options transactions.
Effect of the template expansion on selected currency pairs
Foreign exchange turnover in April 20101, in millions of US dollars
11. Data at constant exchange rates
Another question often raised with intertemporal comparisons is the impact on aggregate turnover of movements in exchange rates vis-à-vis the US dollar from one reporting date to the next. For instance, turnover in the Japanese yen/pound sterling sector may have remained unchanged from one reporting period to the next in terms of these currencies. But if the dollar rises against both currencies, total turnover in the segment reported in dollar terms will be lower, thus signalling a decline where none has in fact taken place. Even in currency pairs involving the dollar, exchange rate movements will impact on turnover. For example, if a trade for a fixed amount of yen against US dollars is transacted, the trade will enter the aggregates with a smaller or larger US dollar amount, depending on how the yen moves against the dollar from one reporting date to the next. To provide some guidance on the impact of actual exchange rate movements on total reported aggregates, pre-2010 totals have been additionally recalculated at constant exchange rates, replacing historical exchange rates by average April 2010 exchange rates. All transactions in a given currency, say the yen, are converted into original currency terms at the historical exchange rate and then recalculated using the average April 2010 dollar/yen exchange rate, as appropriate. In the case of foreign exchange transactions, the dollar side of transactions remains
39
unchanged, since the exchange rate for dollar amounts is constant (and equal to one) over time. The sums of all recalculated transactions are divided by two. This takes account of the joint contribution of two currencies to each foreign exchange transaction.
12. Annex tables
The detailed aggregated results of the Central Bank Survey of Foreign Exchange and Derivatives Market Activity in April and at end-June 2010, as far as foreign exchange instruments are concerned, are presented in the following set of annex tables in two separate sections (E.1 and E.2):
Section E.1 covers turnover in global foreign exchange markets, ie turnover in spot transactions, outright forwards, foreign exchange swaps, currency swaps, currency options and other foreign exchange products.
Section E.2 comprises notional amounts outstanding and gross market values of OTC foreign exchange derivatives markets.
Country aggregates are systematically shown in all tables as net-gross figures, while global aggregates are presented as net-net totals (see Section 8).
In some cases, the sum of sub-items does not equal the total for particular categories. Apart from rounding, this can result from incomplete classification of data, use of residual categories and suppression of data for confidentiality reasons.
12.1 Turnover on foreign exchange markets (Section E.1)
Tables E.1 to E.4 show total reported foreign exchange market turnover net of both local and cross-border inter-dealer double-counting25 by market segment, counterparty and currency. No adjustments were made for gaps in reporting in these or any other annex tables.
Because two currencies are involved in each deal, the sum of transactions in all individual currencies shown in Table E.1 equals twice the total shown in the first column. Information by currency pair is shown for the US dollar in Table E.2, for the euro in Table E.3 and for the yen in Table E.4. Because the data in these latter tables relate to currency pairs, the sum of all transactions equals the total for the currency in question, not twice that total. The totals for the currencies in Tables E.2, E.3 and E.4 therefore correspond to the figures in the second, third and fourth columns of Table E.1. The information on currencies relates only to separately reported transactions. If transactions in a given currency were not identified separately, but placed with residual (or other) currencies, global turnover in that currency may be understated (see Section 8 and the box on overnetting). For the major currencies, the amount of underestimation from this source can be presumed to be minimal.
The data on transactions in “currencies of other reporting countries” relate to transactions that have been individually identified as the local currency of another country participating in the survey (see Section 5 for the full list of currencies identified in the survey). Data in the “residual currencies” column represent the difference between the total and sum of components.
Tables E.5 to E.9 provide information on reported foreign exchange market turnover by country and currency net of local inter-dealer double-counting. No adjustment was made for cross-border inter-dealer double-counting or for gaps in reporting. The totals at the foot of these tables are the sum of the items in the columns in question. They do not correspond to those in Tables E.1 to E.4 because of the absence of an adjustment for cross-border inter-dealer double-counting.
25 See Section 8.
40
As in Table E.1, the sum of transactions in each individual currency in Table E.5 equals twice the total transactions because two currencies figure in every deal. Because the data in Tables E.6 to E.9 relate to currency pairs, the total for all transactions sums to the total for the currency, not to twice the total.
Tables E.10 to E.15 contain information on reported foreign exchange market turnover by country, counterparty and market segment, and on the maturity breakdown of reported outright forward and foreign exchange swap transactions by country net of local double-counting. No adjustment was made for cross-border inter-dealer double-counting.
Tables E.16 and E.17 contain information on the maturity breakdown of reported outright forward and foreign exchange swap transactions by currency net of local and cross-border inter-dealer double-counting.
Tables E.18 to E.23 provide an intertemporal comparison of reported foreign exchange turnover net of local inter-dealer double-counting by country and market segment.
Table E.24 provides information on reported turnover of foreign exchange contracts by execution method. The data broken down by instrument are calculated net of both local and cross-border double-counting.
12.2 Positions (amounts outstanding) on derivatives markets (Section E.2)
Table E.25 contains detailed data on reported notional amounts outstanding of foreign exchange derivatives, broken down by instrument, counterparty and market risk factor (ie mainly currency). The data are adjusted for inter-dealer double-counting.
Table E.26 contains detailed data on reported gross positive and negative market values of foreign exchange derivatives by instrument, counterparty and market risk factor (ie mainly currency). The data are not adjusted for inter-dealer double-counting.
Table E.27 provides information on the maturity breakdown of notional amounts outstanding of foreign exchange derivatives by instrument and counterparty. The data are adjusted for inter-dealer double-counting.
Table E.28 provides an intertemporal comparison of reported notional amounts outstanding and gross market values of foreign exchange derivatives by instrument and counterparty. The data are adjusted for inter-dealer double-counting.
41
E. Statistical annex tables
1. Global foreign exchange turnover in April 201026
By instrument, counterparty and currency
E.1 Specified currency against all other currencies ............................................................ 41
E.2 US dollar against individual currencies ........................................................................ 49
E.3 Euro against individual currencies ................................................................................ 53
E.4 Yen against individual currencies ................................................................................. 57
By country and currency
E.5 Specified currency against all other currencies ............................................................ 59
E.6 US dollar against individual currencies......................................................................... 61
E.7 Euro against individual currencies ................................................................................ 63
E.8 Yen against individual currencies ................................................................................ 65
E.9 Local currency against individual currencies ................................................................ 67
By country and counterparty
E.10 Total turnover................................................................................................................ 69
E.11 Spot transactions.......................................................................................................... 70
E.12 Outright forwards .......................................................................................................... 71
E.13 Foreign exchange swaps.............................................................................................. 72
E.14 Currency swaps............................................................................................................ 73
E.15 Currency options........................................................................................................... 74
26 Spot transactions, outright forwards, foreign exchange swaps, currency swaps, currency options and other
foreign exchange intruments.
42
By country and maturity
E.16 Outright forwards...........................................................................................................75
E.17 Foreign exchange swaps .............................................................................................76
Intertemporal comparison of turnover by country
E.18 Total turnover ................................................................................................................77
E.19 Spot transactions...........................................................................................................78
E.20 Outright forwards...........................................................................................................39
E.21 Foreign exchange swaps ..............................................................................................80
E.22 Currency swaps.............................................................................................................81
E.23 Currency options ...........................................................................................................82
By execution methods
E.24 Turnover by execution method......................................................................................83
2. Amounts outstanding at end-June 2010
E.25 Notional amounts outstanding by instrument, counterparty and currency.....................85
E.26 Gross market values by instrument, counterparty and currency ...................................87
E.27 Notional amounts outstanding by instrument, counterparty and remaining maturity.....89
E.28 Intertemporal comparison of amounts outstanding .......................................................90
Conventions used in the tables
0 = Value close to zero.
... = Reported to be nil, not reported, not shown for reasons of confidentiality, not meaningful or not applicable.
Owing to rounding and incomplete reporting of various breakdowns, the component items do not always sum to the total for the category in question.
“Gross” refers to data for which no adjustment has been made for estimated double-counting; “net-gross” refers to data for which adjustments have been made for estimated local double-counting; and “net-net”, or “net”, refers to data adjusted for both local and cross-border double-counting.
43

44

1. Turnover in April 2010
45
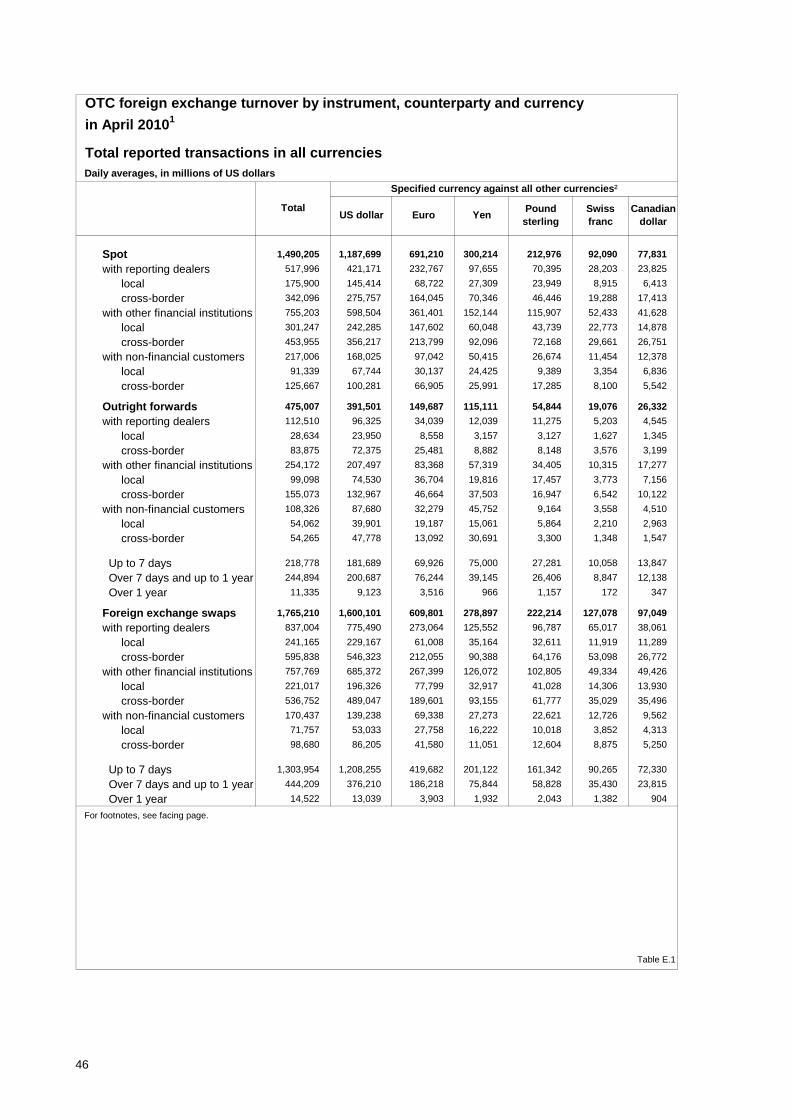
OTC foreign exchange turnover by instrument, counterparty and currency
in April 20101
Total reported transactions in all currenciesDaily averages, in millions of US dollars
Spot 1,490,205 1,187,699 691,210 300,214 212,976 92,090 77,831
with reporting dealers 517,996 421,171 232,767 97,655 70,395 28,203 23,825
local 175,900 145,414 68,722 27,309 23,949 8,915 6,413
cross-border 342,096 275,757 164,045 70,346 46,446 19,288 17,413
with other financial institutions 755,203 598,504 361,401 152,144 115,907 52,433 41,628
local 301,247 242,285 147,602 60,048 43,739 22,773 14,878
cross-border 453,955 356,217 213,799 92,096 72,168 29,661 26,751
with non-financial customers 217,006 168,025 97,042 50,415 26,674 11,454 12,378
local 91,339 67,744 30,137 24,425 9,389 3,354 6,836
cross-border 125,667 100,281 66,905 25,991 17,285 8,100 5,542
Outright forwards 475,007 391,501 149,687 115,111 54,844 19,076 26,332
with reporting dealers 112,510 96,325 34,039 12,039 11,275 5,203 4,545
local 28,634 23,950 8,558 3,157 3,127 1,627 1,345
cross-border 83,875 72,375 25,481 8,882 8,148 3,576 3,199
with other financial institutions 254,172 207,497 83,368 57,319 34,405 10,315 17,277
local 99,098 74,530 36,704 19,816 17,457 3,773 7,156
cross-border 155,073 132,967 46,664 37,503 16,947 6,542 10,122
with non-financial customers 108,326 87,680 32,279 45,752 9,164 3,558 4,510
local 54,062 39,901 19,187 15,061 5,864 2,210 2,963
cross-border 54,265 47,778 13,092 30,691 3,300 1,348 1,547
Up to 7 days 218,778 181,689 69,926 75,000 27,281 10,058 13,847
Over 7 days and up to 1 year 244,894 200,687 76,244 39,145 26,406 8,847 12,138
Over 1 year 11,335 9,123 3,516 966 1,157 172 347
Foreign exchange swaps 1,765,210 1,600,101 609,801 278,897 222,214 127,078 97,049
with reporting dealers 837,004 775,490 273,064 125,552 96,787 65,017 38,061
local 241,165 229,167 61,008 35,164 32,611 11,919 11,289
cross-border 595,838 546,323 212,055 90,388 64,176 53,098 26,772
with other financial institutions 757,769 685,372 267,399 126,072 102,805 49,334 49,426
local 221,017 196,326 77,799 32,917 41,028 14,306 13,930
cross-border 536,752 489,047 189,601 93,155 61,777 35,029 35,496
with non-financial customers 170,437 139,238 69,338 27,273 22,621 12,726 9,562
local 71,757 53,033 27,758 16,222 10,018 3,852 4,313
cross-border 98,680 86,205 41,580 11,051 12,604 8,875 5,250
Up to 7 days 1,303,954 1,208,255 419,682 201,122 161,342 90,265 72,330
Over 7 days and up to 1 year 444,209 376,210 186,218 75,844 58,828 35,430 23,815
Over 1 year 14,522 13,039 3,903 1,932 2,043 1,382 904
Table E.1
For footnotes, see facing page.
Total
Specified currency against all other currencies²
US dollar Euro YenPound sterling
Swiss franc
Canadian dollar
46
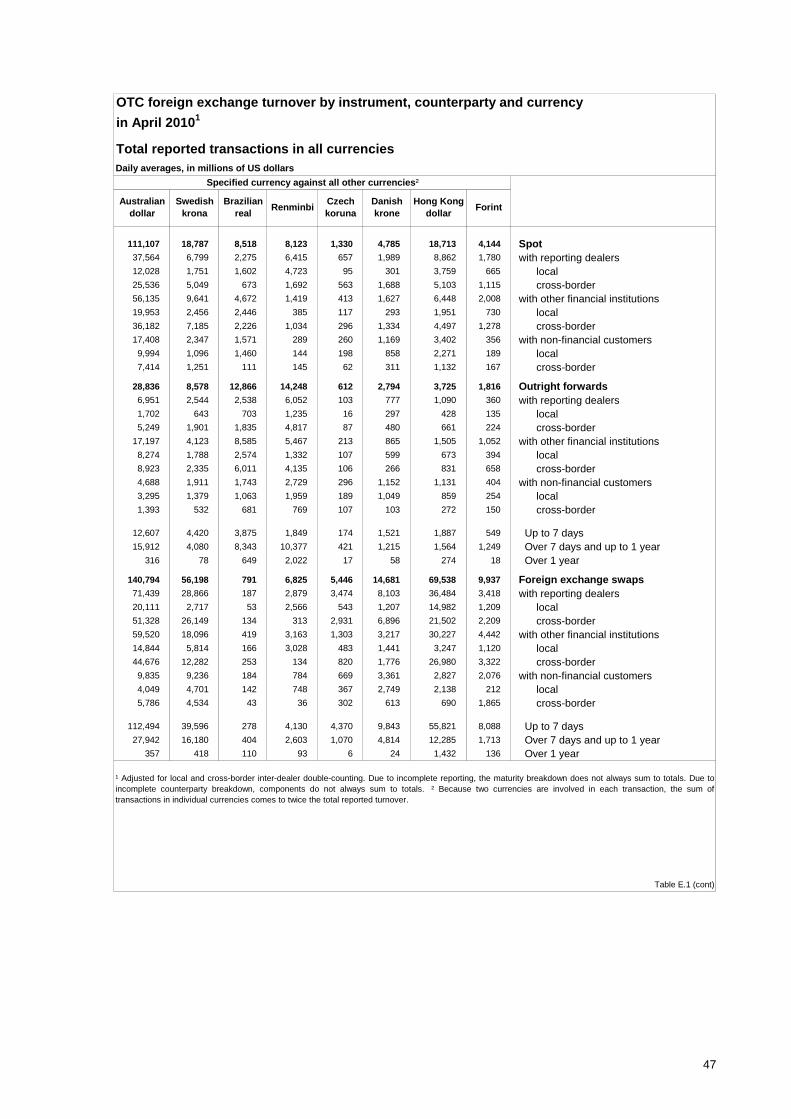
OTC foreign exchange turnover by instrument, counterparty and currency
in April 20101
Total reported transactions in all currenciesDaily averages, in millions of US dollars
111,107 18,787 8,518 8,123 1,330 4,785 18,713 4,144 Spot 37,564 6,799 2,275 6,415 657 1,989 8,862 1,780 with reporting dealers 12,028 1,751 1,602 4,723 95 301 3,759 665 local 25,536 5,049 673 1,692 563 1,688 5,103 1,115 cross-border 56,135 9,641 4,672 1,419 413 1,627 6,448 2,008 with other financial institutions 19,953 2,456 2,446 385 117 293 1,951 730 local 36,182 7,185 2,226 1,034 296 1,334 4,497 1,278 cross-border 17,408 2,347 1,571 289 260 1,169 3,402 356 with non-financial customers 9,994 1,096 1,460 144 198 858 2,271 189 local 7,414 1,251 111 145 62 311 1,132 167 cross-border
28,836 8,578 12,866 14,248 612 2,794 3,725 1,816 Outright forwards 6,951 2,544 2,538 6,052 103 777 1,090 360 with reporting dealers 1,702 643 703 1,235 16 297 428 135 local 5,249 1,901 1,835 4,817 87 480 661 224 cross-border 17,197 4,123 8,585 5,467 213 865 1,505 1,052 with other financial institutions 8,274 1,788 2,574 1,332 107 599 673 394 local 8,923 2,335 6,011 4,135 106 266 831 658 cross-border 4,688 1,911 1,743 2,729 296 1,152 1,131 404 with non-financial customers 3,295 1,379 1,063 1,959 189 1,049 859 254 local 1,393 532 681 769 107 103 272 150 cross-border
12,607 4,420 3,875 1,849 174 1,521 1,887 549 Up to 7 days 15,912 4,080 8,343 10,377 421 1,215 1,564 1,249 Over 7 days and up to 1 year 316 78 649 2,022 17 58 274 18 Over 1 year
140,794 56,198 791 6,825 5,446 14,681 69,538 9,937 Foreign exchange swaps 71,439 28,866 187 2,879 3,474 8,103 36,484 3,418 with reporting dealers 20,111 2,717 53 2,566 543 1,207 14,982 1,209 local 51,328 26,149 134 313 2,931 6,896 21,502 2,209 cross-border 59,520 18,096 419 3,163 1,303 3,217 30,227 4,442 with other financial institutions 14,844 5,814 166 3,028 483 1,441 3,247 1,120 local 44,676 12,282 253 134 820 1,776 26,980 3,322 cross-border 9,835 9,236 184 784 669 3,361 2,827 2,076 with non-financial customers 4,049 4,701 142 748 367 2,749 2,138 212 local 5,786 4,534 43 36 302 613 690 1,865 cross-border
112,494 39,596 278 4,130 4,370 9,843 55,821 8,088 Up to 7 days 27,942 16,180 404 2,603 1,070 4,814 12,285 1,713 Over 7 days and up to 1 year 357 418 110 93 6 24 1,432 136 Over 1 year
Table E.1 (cont)
Specified currency against all other currencies²
Swedish krona
Brazilian real
¹ Adjusted for local and cross-border inter-dealer double-counting. Due to incomplete reporting, the maturity breakdown does not always sum to totals. Due toincomplete counterparty breakdown, components do not always sum to totals. ² Because two currencies are involved in each transaction, the sum oftransactions in individual currencies comes to twice the total reported turnover.
RenminbiHong Kong
dollarCzech koruna
Danish krone
Australian dollar
Forint
47

OTC foreign exchange turnover by instrument, counterparty and currency
in April 20101
Total reported transactions in all currenciesDaily averages, in millions of US dollars
Spot 13,527 2,464 21,144 18,158 12,335 21,643 2,249 7,193
with reporting dealers 7,081 1,436 12,821 6,925 4,475 7,798 1,679 3,108
local 5,544 803 9,769 2,125 1,156 2,636 1,123 960
cross-border 1,537 633 3,052 4,800 3,319 5,162 556 2,148
with other financial institutions 2,947 621 6,229 8,366 6,105 11,299 375 3,176
local 878 176 3,183 2,812 1,285 3,416 201 950
cross-border 2,070 445 3,046 5,555 4,820 7,883 174 2,226
with non-financial customers 3,498 407 2,094 2,867 1,755 2,546 195 909
local 2,881 350 1,714 1,599 830 1,330 159 604
cross-border 618 56 380 1,268 925 1,216 36 305
Outright forwards 13,620 2,659 18,018 5,392 6,153 5,076 2,396 3,559
with reporting dealers 4,811 1,368 11,002 1,425 1,619 1,324 1,248 693
local 1,466 337 1,667 434 366 380 170 201
cross-border 3,345 1,031 9,335 992 1,253 944 1,079 492
with other financial institutions 5,059 1,070 5,639 3,014 3,301 2,976 891 2,159
local 1,513 322 1,865 1,140 1,649 1,354 217 923
cross-border 3,546 749 3,774 1,874 1,652 1,621 674 1,236
with non-financial customers 3,750 221 1,377 952 1,233 776 257 707
local 3,259 175 942 318 941 457 213 430
cross-border 491 45 435 634 292 319 44 277
Up to 7 days 3,263 552 2,590 2,117 3,102 2,621 370 1,160
Over 7 days and up to 1 year 9,458 2,071 14,808 3,164 2,986 2,398 1,983 2,334
Over 1 year 899 37 620 111 64 57 43 65
Foreign exchange swaps 6,789 667 16,597 23,735 31,602 33,148 1,188 19,074
with reporting dealers 6,030 569 13,823 10,683 14,863 16,028 1,004 7,083
local 5,243 417 12,908 2,302 2,269 4,894 841 1,986
cross-border 787 152 915 8,382 12,594 11,134 163 5,097
with other financial institutions 637 68 1,781 9,742 11,984 14,450 171 7,653
local 381 54 1,046 3,270 3,077 3,700 170 1,900
cross-border 257 13 736 6,472 8,906 10,750 1 5,753
with non-financial customers 121 30 992 3,310 4,755 2,670 14 4,338
local 99 26 908 767 2,216 872 14 632
cross-border 22 4 84 2,543 2,539 1,799 ... 3,706
Up to 7 days 3,290 447 7,387 20,278 22,222 28,699 555 15,680
Over 7 days and up to 1 year 2,931 220 8,329 3,359 9,231 4,296 628 3,280
Over 1 year 568 1 881 98 149 162 4 113
Table E.1 (cont)
For footnotes, see facing page.
Indian rupee
Philippine peso
Specified currency against all other currencies²
Rupiah WonMexican
pesoNorwegian
krone
New Zealand dollar
Zloty
48

OTC foreign exchange turnover by instrument, counterparty and currency
in April 20101
Total reported transactions in all currenciesDaily averages, in millions of US dollars
18,139 9,111 15,616 6,064 2,836 7,955 15,092 69,356 Spot 5,936 4,040 6,746 2,102 1,096 4,328 5,664 20,399 with reporting dealers 4,610 1,344 1,868 1,201 445 1,750 3,667 7,151 local 1,325 2,696 4,878 901 650 2,578 1,997 13,248 cross-border 6,342 4,059 6,227 1,952 617 3,234 5,028 39,448 with other financial institutions 4,428 1,026 2,235 1,126 97 1,017 2,909 17,101 local 1,913 3,033 3,992 826 520 2,218 2,119 22,347 cross-border 5,861 1,011 2,643 2,010 1,123 392 4,400 9,510 with non-financial customers 2,103 733 758 1,463 1,051 301 4,213 4,497 local 3,759 277 1,885 548 72 91 187 5,013 cross-border
2,262 2,856 4,416 6,820 1,107 3,032 9,837 32,787 Outright forwards 699 689 1,093 3,456 80 964 4,235 6,471 with reporting dealers 361 320 283 641 20 498 1,106 2,097 local 339 370 810 2,815 59 466 3,129 4,375 cross-border 1,261 1,588 2,359 2,584 134 1,786 4,313 21,022 with other financial institutions 449 635 987 630 55 690 1,767 8,823 local 812 954 1,371 1,955 79 1,095 2,546 12,198 cross-border 301 578 965 779 894 282 1,289 5,295 with non-financial customers 167 413 613 457 870 204 1,110 2,320 local 134 165 352 323 24 78 179 2,975 cross-border
704 1,144 1,708 1,547 268 1,820 2,687 7,220 Up to 7 days 1,472 1,673 2,614 5,196 826 1,182 6,786 24,208 Over 7 days and up to 1 year 85 39 94 77 13 29 364 1,360 Over 1 year
14,240 15,628 33,594 4,761 3,503 12,634 10,324 63,590 Foreign exchange swaps 5,817 9,622 20,726 929 2,675 6,034 4,501 24,800 with reporting dealers 3,215 3,669 7,481 830 1,914 1,837 1,721 6,259 local 2,602 5,953 13,245 99 761 4,198 2,779 18,542 cross-border 7,556 5,031 11,032 3,184 636 6,310 4,461 30,045 with other financial institutions 4,224 1,131 3,841 3,112 303 2,103 1,195 6,078 local 3,332 3,900 7,191 72 333 4,207 3,266 23,968 cross-border 866 974 1,835 648 192 289 1,363 8,744 with non-financial customers 343 677 721 647 131 183 941 4,039 local 524 298 1,115 0 61 106 423 4,705 cross-border
13,047 12,112 26,598 347 1,914 9,886 7,690 50,139 Up to 7 days 1,067 3,400 6,795 4,159 1,511 2,696 2,532 10,628 Over 7 days and up to 1 year 126 117 201 254 78 52 103 359 Over 1 year
Table E.1 (cont)
Specified currency against all other currencies²
RandSingapore
dollarRouble
New Taiwan dollar
Turkish lira
1 Adjusted for local and cross-border inter-dealer double-counting. Due to incomplete reporting, the maturity breakdown does not always sum to totals. Due to
incomplete counterparty breakdown, components do not always sum to totals. 2 Because two currencies are involved in each transaction, the sum of
transactions in individual currencies comes to twice the total reported turnover. 3 Includes all participating countries’ currencies other than the ones listed.4 Calculated as the difference between the total and the sum of the listed components.
Baht
Currencies of other
reporting
countries3
Residual
currencies4
49
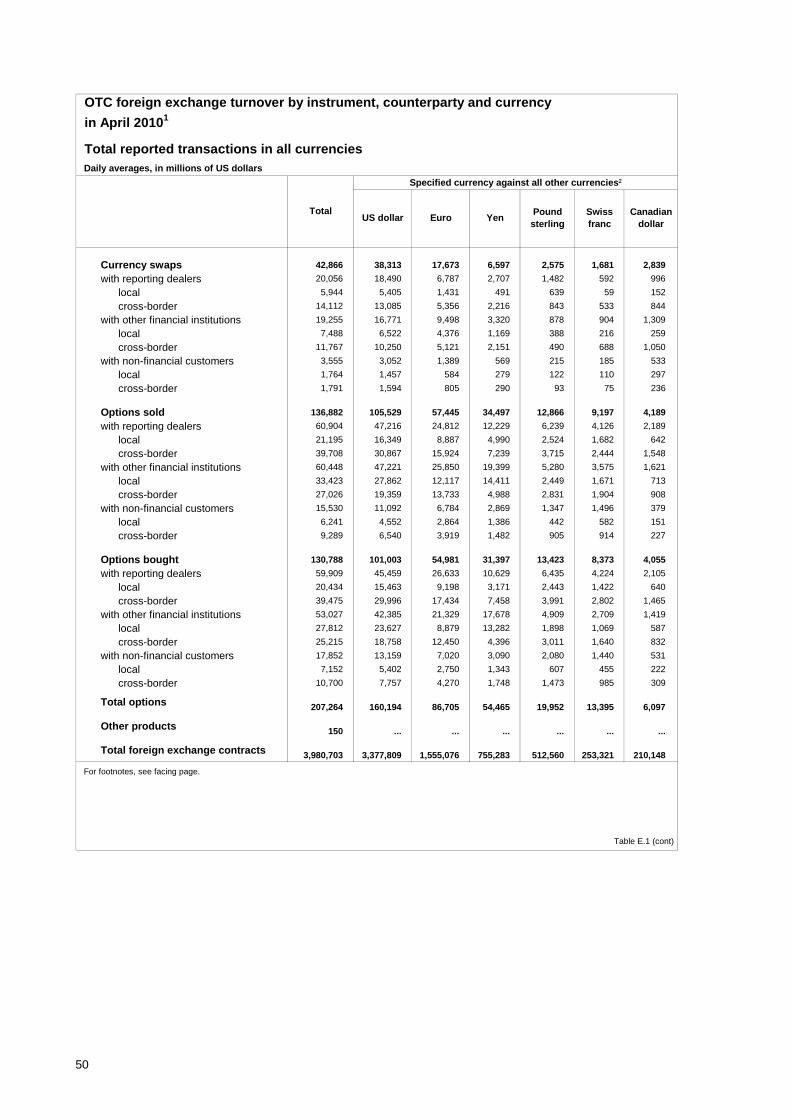
OTC foreign exchange turnover by instrument, counterparty and currency
in April 20101
Total reported transactions in all currenciesDaily averages, in millions of US dollars
Currency swaps 42,866 38,313 17,673 6,597 2,575 1,681 2,839
with reporting dealers 20,056 18,490 6,787 2,707 1,482 592 996
local 5,944 5,405 1,431 491 639 59 152
cross-border 14,112 13,085 5,356 2,216 843 533 844
with other financial institutions 19,255 16,771 9,498 3,320 878 904 1,309
local 7,488 6,522 4,376 1,169 388 216 259
cross-border 11,767 10,250 5,121 2,151 490 688 1,050
with non-financial customers 3,555 3,052 1,389 569 215 185 533
local 1,764 1,457 584 279 122 110 297
cross-border 1,791 1,594 805 290 93 75 236
Options sold 136,882 105,529 57,445 34,497 12,866 9,197 4,189
with reporting dealers 60,904 47,216 24,812 12,229 6,239 4,126 2,189
local 21,195 16,349 8,887 4,990 2,524 1,682 642
cross-border 39,708 30,867 15,924 7,239 3,715 2,444 1,548
with other financial institutions 60,448 47,221 25,850 19,399 5,280 3,575 1,621
local 33,423 27,862 12,117 14,411 2,449 1,671 713
cross-border 27,026 19,359 13,733 4,988 2,831 1,904 908
with non-financial customers 15,530 11,092 6,784 2,869 1,347 1,496 379
local 6,241 4,552 2,864 1,386 442 582 151
cross-border 9,289 6,540 3,919 1,482 905 914 227
Options bought 130,788 101,003 54,981 31,397 13,423 8,373 4,055
with reporting dealers 59,909 45,459 26,633 10,629 6,435 4,224 2,105
local 20,434 15,463 9,198 3,171 2,443 1,422 640
cross-border 39,475 29,996 17,434 7,458 3,991 2,802 1,465
with other financial institutions 53,027 42,385 21,329 17,678 4,909 2,709 1,419
local 27,812 23,627 8,879 13,282 1,898 1,069 587
cross-border 25,215 18,758 12,450 4,396 3,011 1,640 832
with non-financial customers 17,852 13,159 7,020 3,090 2,080 1,440 531
local 7,152 5,402 2,750 1,343 607 455 222
cross-border 10,700 7,757 4,270 1,748 1,473 985 309
Total options 207,264 160,194 86,705 54,465 19,952 13,395 6,097
Other products 150 ... ... ... ... ... ...
Total foreign exchange contracts 3,980,703 3,377,809 1,555,076 755,283 512,560 253,321 210,148
Table E.1 (cont)
For footnotes, see facing page.
Total
Specified currency against all other currencies²
US dollar Euro YenPound sterling
Swiss franc
Canadian dollar
50

OTC foreign exchange turnover by instrument, counterparty and currency
in April 20101
Total reported transactions in all currenciesDaily averages, in millions of US dollars
5,649 699 391 65 30 117 347 45 Currency swaps
2,984 466 39 31 19 22 215 44 with reporting dealers
441 286 22 3 2 8 32 3 local
2,543 180 17 28 17 14 184 41 cross-border
2,406 219 155 22 10 87 56 0 with other financial institutions
714 126 142 1 1 74 11 ... local
1,691 93 13 21 9 13 45 0 cross-border
259 14 198 12 1 9 76 1 with non-financial customers
55 10 197 6 0 9 25 1 local
204 4 1 6 1 ... 52 ... cross-border
10,444 1,808 3,040 3,164 148 186 1,156 825 Options sold 5,713 795 1,506 1,626 69 167 513 360 with reporting dealers 1,561 261 637 447 12 0 96 136 local 4,152 534 869 1,179 57 167 416 223 cross-border 3,755 723 1,389 1,197 47 4 303 366 with other financial institutions 1,752 243 457 668 6 ... 125 147 local 2,003 479 932 529 41 4 178 218 cross-border 976 290 145 342 32 15 340 100 with non-financial customers 432 158 59 107 10 13 185 30 local 545 133 86 234 22 2 155 70 cross-border
10,663 1,972 3,187 3,517 127 110 1,123 804 Options bought 5,832 865 1,634 1,736 49 19 662 413 with reporting dealers 1,524 300 631 399 0 0 154 210 local 4,308 565 1,004 1,337 49 19 508 204 cross-border 3,151 669 1,456 1,280 28 32 180 305 with other financial institutions 1,415 193 426 673 12 23 51 100 local 1,735 476 1,030 607 16 8 129 204 cross-border 1,680 438 97 501 50 60 281 86 with non-financial customers 756 239 41 213 15 31 182 27 local 924 200 56 288 35 29 99 59 cross-border
15,334 2,950 4,657 5,000 216 203 1,692 1,243 Total options
... ... ... ... ... ... ... ... Other products
301,719 87,212 27,224 34,261 7,634 22,581 94,015 17,184 Total foreign exchange contracts
Table E.1 (cont)
ForintCzech koruna
RenminbiAustralian
dollar
¹ Adjusted for local and cross-border inter-dealer double-counting. Due to incomplete reporting, the maturity breakdown does not always sum to totals. Dueto incomplete counterparty breakdown, components do not always sum to totals. While data on total options are shown on a net basis, separate data onoptions sold and options bought are recorded on a gross basis, ie not adjusted for inter-dealer double-counting. ² Because two currencies are involved ineach transaction, the sum of transactions in individual currencies comes to twice the total reported turnover.
Danish krone
Hong Kong dollar
Specified currency against all other currencies²
Swedish krona
Brazilian real
51
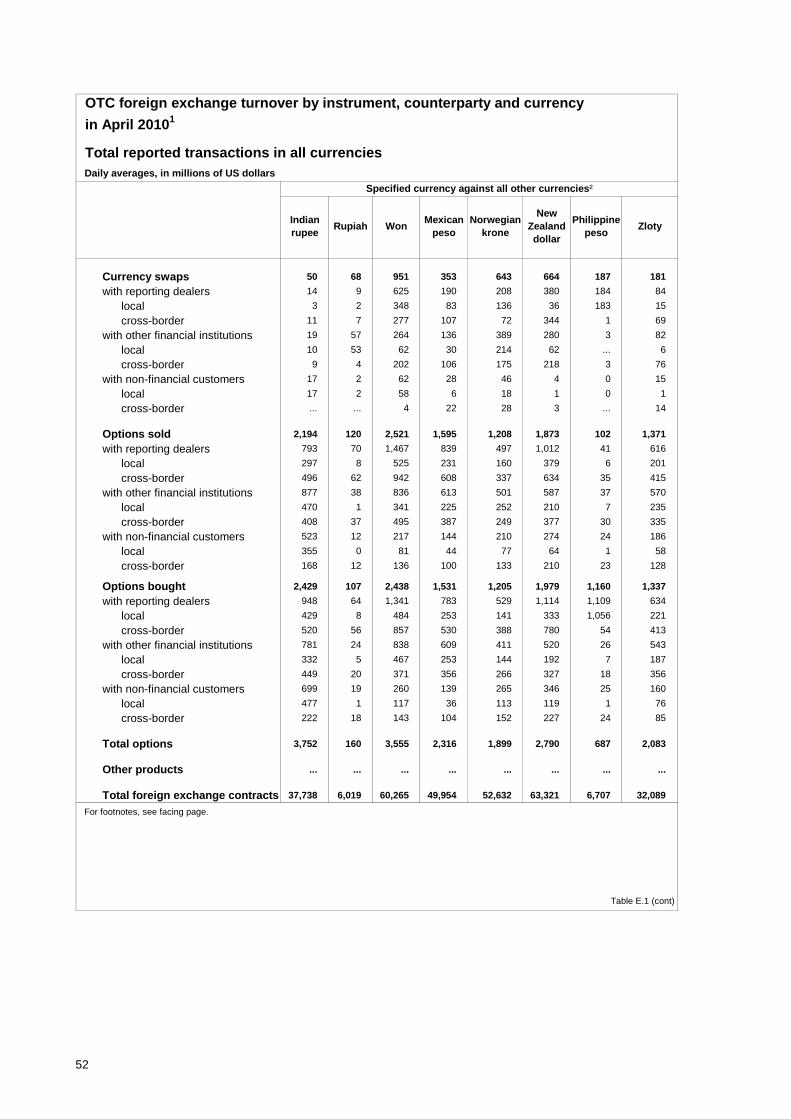
OTC foreign exchange turnover by instrument, counterparty and currency
in April 20101
Total reported transactions in all currenciesDaily averages, in millions of US dollars
Currency swaps 50 68 951 353 643 664 187 181
with reporting dealers 14 9 625 190 208 380 184 84
local 3 2 348 83 136 36 183 15
cross-border 11 7 277 107 72 344 1 69
with other financial institutions 19 57 264 136 389 280 3 82
local 10 53 62 30 214 62 ... 6
cross-border 9 4 202 106 175 218 3 76
with non-financial customers 17 2 62 28 46 4 0 15
local 17 2 58 6 18 1 0 1
cross-border ... ... 4 22 28 3 ... 14
Options sold 2,194 120 2,521 1,595 1,208 1,873 102 1,371
with reporting dealers 793 70 1,467 839 497 1,012 41 616
local 297 8 525 231 160 379 6 201
cross-border 496 62 942 608 337 634 35 415
with other financial institutions 877 38 836 613 501 587 37 570
local 470 1 341 225 252 210 7 235
cross-border 408 37 495 387 249 377 30 335
with non-financial customers 523 12 217 144 210 274 24 186
local 355 0 81 44 77 64 1 58
cross-border 168 12 136 100 133 210 23 128
Options bought 2,429 107 2,438 1,531 1,205 1,979 1,160 1,337
with reporting dealers 948 64 1,341 783 529 1,114 1,109 634
local 429 8 484 253 141 333 1,056 221
cross-border 520 56 857 530 388 780 54 413
with other financial institutions 781 24 838 609 411 520 26 543
local 332 5 467 253 144 192 7 187
cross-border 449 20 371 356 266 327 18 356
with non-financial customers 699 19 260 139 265 346 25 160
local 477 1 117 36 113 119 1 76
cross-border 222 18 143 104 152 227 24 85
Total options 3,752 160 3,555 2,316 1,899 2,790 687 2,083
Other products ... ... ... ... ... ... ... ...
Total foreign exchange contracts 37,738 6,019 60,265 49,954 52,632 63,321 6,707 32,089
Table E.1 (cont)
For footnotes, see facing page.
Rupiah WonMexican
pesoIndian rupee
Specified currency against all other currencies²
Philippine peso
Norwegian krone
New Zealand dollar
Zloty
52

OTC foreign exchange turnover by instrument, counterparty and currency
in April 20101
Total reported transactions in all currenciesDaily averages, in millions of US dollars
182 150 67 103 111 1,908 1,692 1,400 Currency swaps 65 91 44 34 62 1,238 1,369 640 with reporting dealers
29 9 1 21 59 692 1,255 43 local
36 82 42 13 3 546 114 597 cross-border
102 49 19 26 20 589 192 651 with other financial institutions
33 7 6 17 18 283 61 114 local
69 43 13 9 2 305 131 536 cross-border
15 10 4 43 29 81 131 110 with non-financial customers
12 3 4 37 29 16 119 53 local
3 7 0 5 ... 65 12 56 cross-border
766 775 1,750 914 50 2,559 572 10,901 Options sold 491 523 915 485 11 1,090 199 5,199 with reporting dealers 288 234 236 150 9 431 74 936 local 204 289 679 335 2 658 124 4,263 cross-border 208 201 633 349 1 1,286 276 3,156 with other financial institutions 89 56 362 138 0 714 68 1,054 local 119 145 271 211 1 572 208 2,101 cross-border 67 50 203 79 38 183 98 2,546 with non-financial customers 11 24 57 44 37 97 86 477 local 56 26 146 36 0 87 12 2,069 cross-border
761 782 1,846 862 55 2,260 602 7,486 Options bought 466 521 922 519 9 1,033 182 2,948 with reporting dealers 239 228 285 112 7 468 74 974 local 227 293 637 407 2 565 108 1,974 cross-border 223 195 662 250 2 820 331 2,290 with other financial institutions 91 59 345 96 1 192 79 937 local 133 136 317 154 1 628 252 1,353 cross-border 72 67 262 92 43 407 89 2,248 with non-financial customers 18 40 110 55 43 330 76 413 local 54 27 151 37 0 76 13 1,835 cross-border
1,049 1,035 2,678 1,273 95 3,757 984 14,313 Total options
... ... ... ... ... ... ... 300 Other products
35,870 28,780 56,371 19,021 7,652 29,285 37,929 181,746 Total foreign exchange contracts
Table E.1 (cont)
¹ Adjusted for local and cross-border inter-dealer double-counting. Due to incomplete reporting, the maturity breakdown does not always sum to totals. Dueto incomplete counterparty breakdown, components do not always sum to totals. While data on total options are shown on a net basis, separate data onoptions sold and options bought are recorded on a gross basis, ie not adjusted for inter-dealer double-counting. ² Because two currencies are involved ineach transaction, the sum of transactions in individual currencies comes to twice the total reported turnover. ³ Includes all participating countries’ currencies
other than the ones listed. 4 Calculated as the difference between the total and the sum of the listed components.
Specified currency against all other currencies²
RandRoubleResidual
currencies4
New Taiwan dollar
BahtSingapore
dollarTurkish
lira
Currencies of other
reporting countries³
53
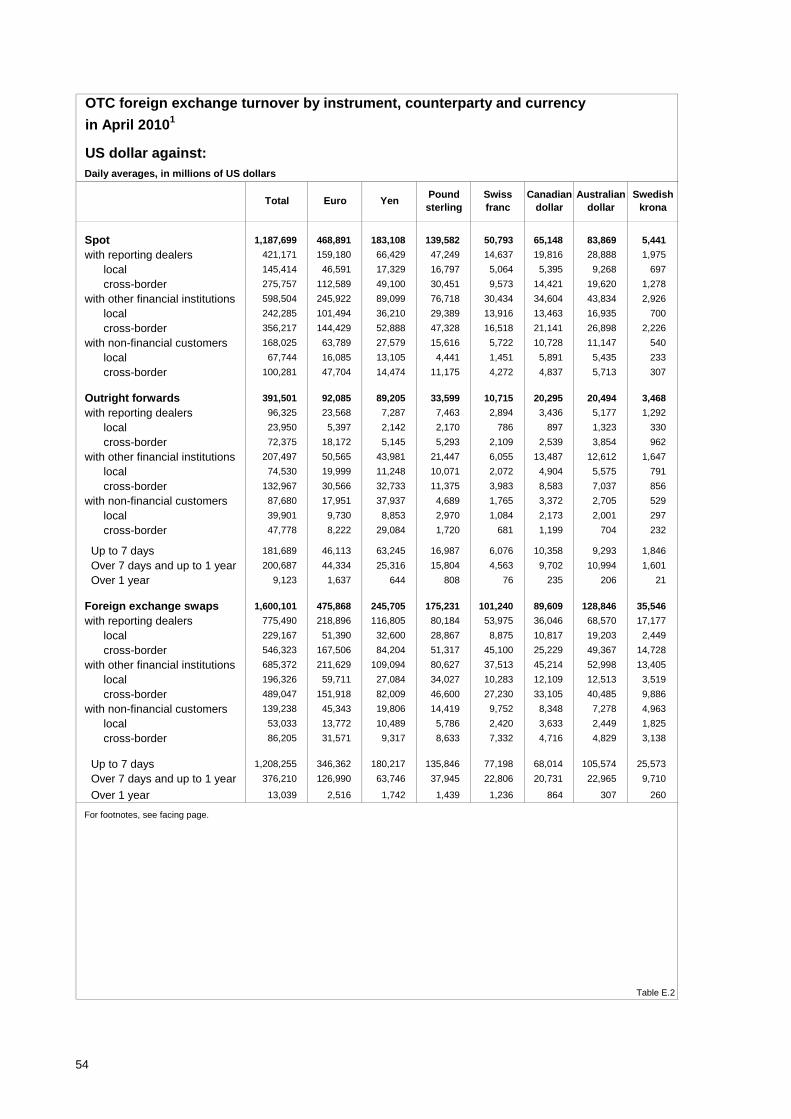
OTC foreign exchange turnover by instrument, counterparty and currency
in April 20101
US dollar against:Daily averages, in millions of US dollars
Spot 1,187,699 468,891 183,108 139,582 50,793 65,148 83,869 5,441
with reporting dealers 421,171 159,180 66,429 47,249 14,637 19,816 28,888 1,975
local 145,414 46,591 17,329 16,797 5,064 5,395 9,268 697
cross-border 275,757 112,589 49,100 30,451 9,573 14,421 19,620 1,278
with other financial institutions 598,504 245,922 89,099 76,718 30,434 34,604 43,834 2,926
local 242,285 101,494 36,210 29,389 13,916 13,463 16,935 700
cross-border 356,217 144,429 52,888 47,328 16,518 21,141 26,898 2,226
with non-financial customers 168,025 63,789 27,579 15,616 5,722 10,728 11,147 540
local 67,744 16,085 13,105 4,441 1,451 5,891 5,435 233
cross-border 100,281 47,704 14,474 11,175 4,272 4,837 5,713 307
Outright forwards 391,501 92,085 89,205 33,599 10,715 20,295 20,494 3,468
with reporting dealers 96,325 23,568 7,287 7,463 2,894 3,436 5,177 1,292
local 23,950 5,397 2,142 2,170 786 897 1,323 330
cross-border 72,375 18,172 5,145 5,293 2,109 2,539 3,854 962
with other financial institutions 207,497 50,565 43,981 21,447 6,055 13,487 12,612 1,647
local 74,530 19,999 11,248 10,071 2,072 4,904 5,575 791
cross-border 132,967 30,566 32,733 11,375 3,983 8,583 7,037 856
with non-financial customers 87,680 17,951 37,937 4,689 1,765 3,372 2,705 529
local 39,901 9,730 8,853 2,970 1,084 2,173 2,001 297
cross-border 47,778 8,222 29,084 1,720 681 1,199 704 232
Up to 7 days 181,689 46,113 63,245 16,987 6,076 10,358 9,293 1,846
Over 7 days and up to 1 year 200,687 44,334 25,316 15,804 4,563 9,702 10,994 1,601
Over 1 year 9,123 1,637 644 808 76 235 206 21
Foreign exchange swaps 1,600,101 475,868 245,705 175,231 101,240 89,609 128,846 35,546
with reporting dealers 775,490 218,896 116,805 80,184 53,975 36,046 68,570 17,177
local 229,167 51,390 32,600 28,867 8,875 10,817 19,203 2,449
cross-border 546,323 167,506 84,204 51,317 45,100 25,229 49,367 14,728
with other financial institutions 685,372 211,629 109,094 80,627 37,513 45,214 52,998 13,405
local 196,326 59,711 27,084 34,027 10,283 12,109 12,513 3,519
cross-border 489,047 151,918 82,009 46,600 27,230 33,105 40,485 9,886
with non-financial customers 139,238 45,343 19,806 14,419 9,752 8,348 7,278 4,963
local 53,033 13,772 10,489 5,786 2,420 3,633 2,449 1,825
cross-border 86,205 31,571 9,317 8,633 7,332 4,716 4,829 3,138
Up to 7 days 1,208,255 346,362 180,217 135,846 77,198 68,014 105,574 25,573
Over 7 days and up to 1 year 376,210 126,990 63,746 37,945 22,806 20,731 22,965 9,710
Over 1 year 13,039 2,516 1,742 1,439 1,236 864 307 260
Table E.2
Yen
For footnotes, see facing page.
Australian dollar
Swedish krona
Total EuroCanadian
dollarPound sterling
Swiss franc
54
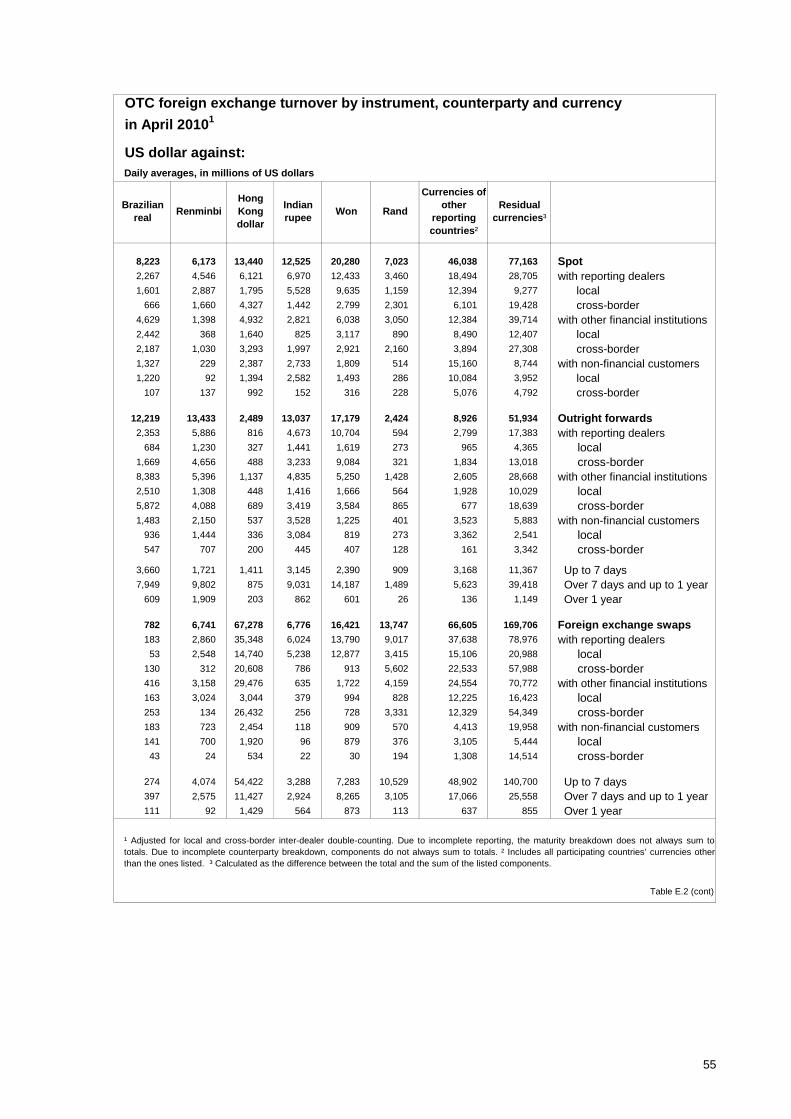
in April 20101
US dollar against:Daily averages, in millions of US dollars
8,223 6,173 13,440 12,525 20,280 7,023 46,038 77,163 Spot 2,267 4,546 6,121 6,970 12,433 3,460 18,494 28,705 with reporting dealers 1,601 2,887 1,795 5,528 9,635 1,159 12,394 9,277 local 666 1,660 4,327 1,442 2,799 2,301 6,101 19,428 cross-border 4,629 1,398 4,932 2,821 6,038 3,050 12,384 39,714 with other financial institutions 2,442 368 1,640 825 3,117 890 8,490 12,407 local 2,187 1,030 3,293 1,997 2,921 2,160 3,894 27,308 cross-border 1,327 229 2,387 2,733 1,809 514 15,160 8,744 with non-financial customers 1,220 92 1,394 2,582 1,493 286 10,084 3,952 local 107 137 992 152 316 228 5,076 4,792 cross-border
12,219 13,433 2,489 13,037 17,179 2,424 8,926 51,934 Outright forwards 2,353 5,886 816 4,673 10,704 594 2,799 17,383 with reporting dealers 684 1,230 327 1,441 1,619 273 965 4,365 local 1,669 4,656 488 3,233 9,084 321 1,834 13,018 cross-border 8,383 5,396 1,137 4,835 5,250 1,428 2,605 28,668 with other financial institutions 2,510 1,308 448 1,416 1,666 564 1,928 10,029 local 5,872 4,088 689 3,419 3,584 865 677 18,639 cross-border 1,483 2,150 537 3,528 1,225 401 3,523 5,883 with non-financial customers 936 1,444 336 3,084 819 273 3,362 2,541 local 547 707 200 445 407 128 161 3,342 cross-border
3,660 1,721 1,411 3,145 2,390 909 3,168 11,367 Up to 7 days 7,949 9,802 875 9,031 14,187 1,489 5,623 39,418 Over 7 days and up to 1 year 609 1,909 203 862 601 26 136 1,149 Over 1 year
782 6,741 67,278 6,776 16,421 13,747 66,605 169,706 Foreign exchange swaps 183 2,860 35,348 6,024 13,790 9,017 37,638 78,976 with reporting dealers 53 2,548 14,740 5,238 12,877 3,415 15,106 20,988 local 130 312 20,608 786 913 5,602 22,533 57,988 cross-border 416 3,158 29,476 635 1,722 4,159 24,554 70,772 with other financial institutions 163 3,024 3,044 379 994 828 12,225 16,423 local 253 134 26,432 256 728 3,331 12,329 54,349 cross-border 183 723 2,454 118 909 570 4,413 19,958 with non-financial customers 141 700 1,920 96 879 376 3,105 5,444 local 43 24 534 22 30 194 1,308 14,514 cross-border
274 4,074 54,422 3,288 7,283 10,529 48,902 140,700 Up to 7 days 397 2,575 11,427 2,924 8,265 3,105 17,066 25,558 Over 7 days and up to 1 year 111 92 1,429 564 873 113 637 855 Over 1 year
Table E.2 (cont)
OTC foreign exchange turnover by instrument, counterparty and currency
¹ Adjusted for local and cross-border inter-dealer double-counting. Due to incomplete reporting, the maturity breakdown does not always sum tototals. Due to incomplete counterparty breakdown, components do not always sum to totals. ² Includes all participating countries’ currencies otherthan the ones listed. ³ Calculated as the difference between the total and the sum of the listed components.
Renminbi RandHong Kong dollar
WonBrazilian
real
Currencies of other
reporting countries²
Residual currencies³
Indian rupee
55

OTC foreign exchange turnover by instrument, counterparty and currency
in April 20101
US dollar against:Daily averages, in millions of US dollars
Currency swaps 38,313 13,507 5,646 1,831 927 2,683 5,333 365
with reporting dealers 18,490 5,323 2,576 1,141 356 991 2,885 204
local 5,405 910 467 545 42 151 438 90
cross-border 13,085 4,414 2,109 595 314 839 2,447 114
with other financial institutions 16,771 7,185 2,572 573 527 1,247 2,200 156
local 6,522 3,438 677 258 122 248 704 123
cross-border 10,250 3,747 1,894 316 405 999 1,496 33
with non-financial customers 3,052 999 499 117 44 445 248 5
local 1,457 376 216 46 3 279 50 5
cross-border 1,594 623 282 71 41 166 198 ...
Options sold 105,529 33,397 27,545 6,682 3,265 3,001 7,000 177
with reporting dealers 47,216 14,664 9,130 3,293 1,574 1,652 3,812 86
local 16,349 5,211 3,983 1,220 686 430 957 18
cross-border 30,867 9,454 5,147 2,073 888 1,222 2,855 68
with other financial institutions 47,221 15,230 16,315 2,694 1,188 1,074 2,560 60
local 27,862 7,567 13,298 1,206 599 505 1,233 12
cross-border 19,359 7,662 3,017 1,488 589 569 1,327 48
with non-financial customers 11,092 3,503 2,099 695 502 275 628 31
local 4,552 1,410 1,023 209 152 116 296 15
cross-border 6,540 2,093 1,076 486 350 160 332 16
Options bought 101,003 32,624 24,865 6,832 2,207 2,893 7,121 192
with reporting dealers 45,459 15,573 7,550 3,259 1,038 1,599 3,967 90
local 15,463 5,362 2,252 1,093 336 409 963 21
cross-border 29,996 10,212 5,299 2,166 702 1,190 3,004 69
with other financial institutions 42,385 13,270 15,048 2,458 783 901 2,022 51
local 23,627 5,675 12,199 903 321 365 915 8
cross-border 18,758 7,595 2,849 1,554 462 536 1,107 43
with non-financial customers 13,159 3,782 2,267 1,115 387 393 1,132 50
local 5,402 1,487 1,007 320 92 168 482 29
cross-border 7,757 2,294 1,259 795 294 225 650 21
Total options 160,194 50,903 44,070 10,238 4,166 4,268 10,232 280
Other products ... ... ... ... ... ... ... ...
3,377,809 1,101,254 567,734 360,481 167,841 182,002 248,775 45,100
Table E.2 (cont)
Total foreign exchange contracts
YenAustralian
dollar
For footnotes, see facing page.
Swedish Krona
Total EuroPound sterling
Canadian dollar
Swiss franc
56

OTC foreign exchange turnover by instrument, counterparty and currency
in April 20101
US dollar against:Daily averages, in millions of US dollars
381 58 313 45 918 134 1,436 4,735 Currency swaps 39 31 195 13 615 89 852 3,180 with reporting dealers 22 3 27 3 340 9 300 2,058 local 17 28 168 10 275 80 552 1,122 cross-border 155 22 49 18 243 37 423 1,365 with other financial institutions 142 1 11 9 42 5 265 477 local 13 21 38 9 202 32 158 888 cross-border 188 6 69 14 60 8 160 190 with non-financial customers 187 3 19 14 56 2 148 53 local 1 3 50 ... 4 6 12 137 cross-border
2,407 3,089 1,031 2,004 2,183 572 1,349 11,826 Options sold 1,193 1,601 437 724 1,269 423 711 6,646 with reporting dealers 546 447 85 287 512 181 126 1,661 local 647 1,154 351 437 756 242 586 4,986 cross-border 1,086 1,185 289 844 781 124 302 3,489 with other financial institutions 376 668 120 450 319 32 84 1,393 local 710 517 170 394 463 92 218 2,096 cross-border 128 303 305 436 133 25 337 1,691 with non-financial customers 59 90 152 347 79 19 273 313 local 69 213 153 90 55 6 64 1,378 cross-border
2,611 3,442 884 2,230 2,156 571 2,419 9,954 Options bought 1,336 1,706 532 874 1,208 430 1,569 4,728 with reporting dealers 526 399 147 408 462 186 1,170 1,730 local 809 1,307 385 465 747 244 399 2,999 cross-border 1,181 1,267 165 750 771 102 321 3,294 with other financial institutions 367 673 48 310 446 28 88 1,282 local 814 593 118 440 325 75 233 2,013 cross-border 94 469 187 607 177 39 529 1,931 with non-financial customers 40 195 98 466 102 29 471 414 local 54 274 89 141 75 10 58 1,517 cross-border
3,754 4,877 1,431 3,436 3,101 717 2,629 16,092 Total options
... ... ... ... ... ... ... ... Other products
25,359 31,283 84,951 35,820 57,900 24,045 125,634 319,631
Table E.2 (cont)
Currencies of other
reporting countries²
¹ Adjusted for local and cross-border inter-dealer double-counting. Due to incomplete reporting, the maturity breakdown does not always sum tototals. Due to incomplete counterparty breakdown, components do not always sum to totals. While data on total options are shown on a net basis,separate data on options sold and options bought are recorded on a gross basis, ie not adjusted for inter-dealer double-counting. ² Includes allparticipating countries’ currencies other than the ones listed. ³ Calculated as the difference between the total and the sum of the listed components.
RenminbiHong Kong dollar
Brazilian real
Residual currencies³
RandWonIndian rupee
Total foreign exchange contracts
57
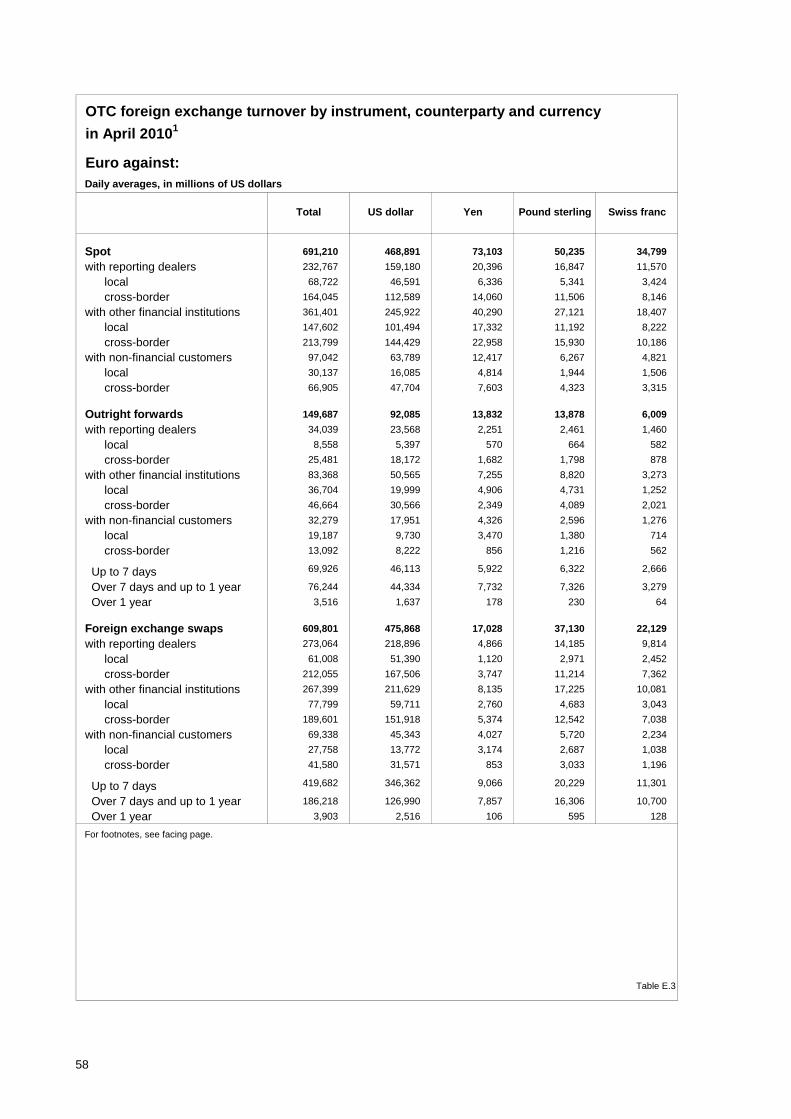
in April 20101
Euro against:Daily averages, in millions of US dollars
Spot 691,210 468,891 73,103 50,235 34,799
with reporting dealers 232,767 159,180 20,396 16,847 11,570
local 68,722 46,591 6,336 5,341 3,424
cross-border 164,045 112,589 14,060 11,506 8,146
with other financial institutions 361,401 245,922 40,290 27,121 18,407
local 147,602 101,494 17,332 11,192 8,222
cross-border 213,799 144,429 22,958 15,930 10,186
with non-financial customers 97,042 63,789 12,417 6,267 4,821
local 30,137 16,085 4,814 1,944 1,506
cross-border 66,905 47,704 7,603 4,323 3,315
Outright forwards 149,687 92,085 13,832 13,878 6,009
with reporting dealers 34,039 23,568 2,251 2,461 1,460
local 8,558 5,397 570 664 582
cross-border 25,481 18,172 1,682 1,798 878
with other financial institutions 83,368 50,565 7,255 8,820 3,273
local 36,704 19,999 4,906 4,731 1,252
cross-border 46,664 30,566 2,349 4,089 2,021
with non-financial customers 32,279 17,951 4,326 2,596 1,276
local 19,187 9,730 3,470 1,380 714
cross-border 13,092 8,222 856 1,216 562
Up to 7 days 69,926 46,113 5,922 6,322 2,666
Over 7 days and up to 1 year 76,244 44,334 7,732 7,326 3,279
Over 1 year 3,516 1,637 178 230 64
Foreign exchange swaps 609,801 475,868 17,028 37,130 22,129
with reporting dealers 273,064 218,896 4,866 14,185 9,814
local 61,008 51,390 1,120 2,971 2,452
cross-border 212,055 167,506 3,747 11,214 7,362
with other financial institutions 267,399 211,629 8,135 17,225 10,081
local 77,799 59,711 2,760 4,683 3,043
cross-border 189,601 151,918 5,374 12,542 7,038
with non-financial customers 69,338 45,343 4,027 5,720 2,234
local 27,758 13,772 3,174 2,687 1,038
cross-border 41,580 31,571 853 3,033 1,196
Up to 7 days 419,682 346,362 9,066 20,229 11,301
Over 7 days and up to 1 year 186,218 126,990 7,857 16,306 10,700
Over 1 year 3,903 2,516 106 595 128
Table E.3
For footnotes, see facing page.
Pound sterling Swiss francTotal US dollar
OTC foreign exchange turnover by instrument, counterparty and currency
Yen
58
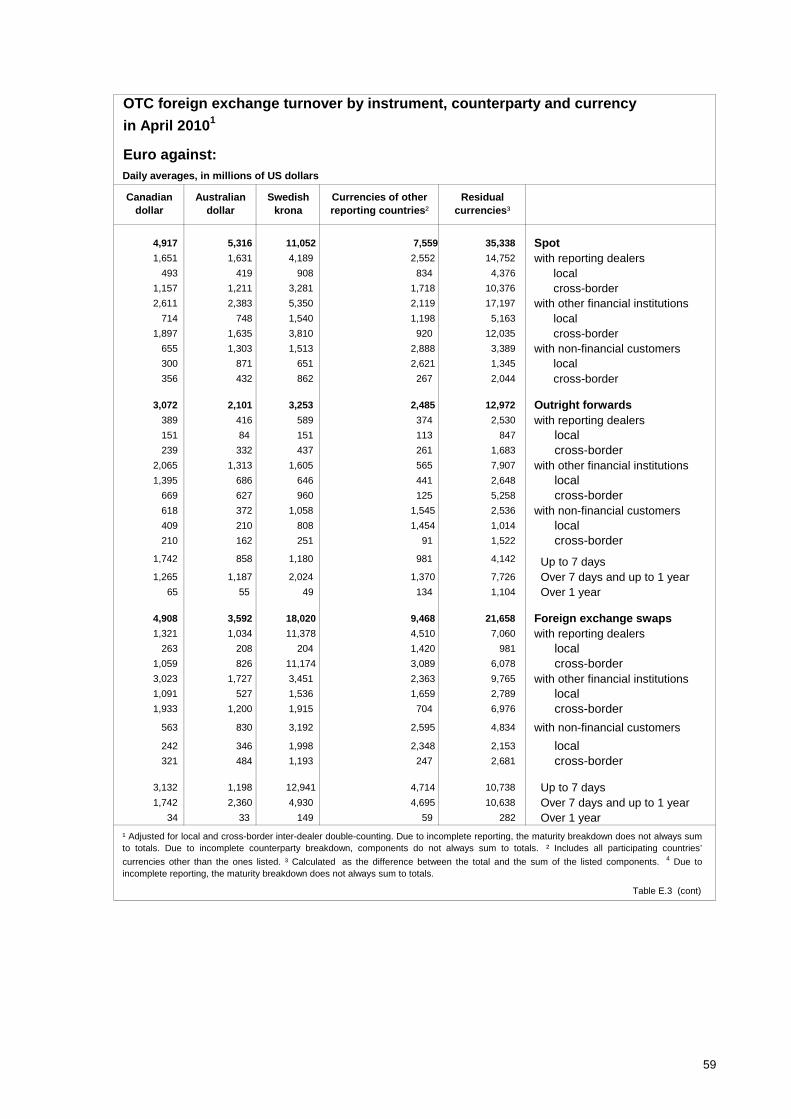
OTC foreign exchange turnover by instrument, counterparty and currency
in April 20101
Euro against:Daily averages, in millions of US dollars
4,917 5,316 11,052 7,559 35,338 Spot 1,651 1,631 4,189 2,552 14,752 with reporting dealers 493 419 908 834 4,376 local 1,157 1,211 3,281 1,718 10,376 cross-border 2,611 2,383 5,350 2,119 17,197 with other financial institutions 714 748 1,540 1,198 5,163 local 1,897 1,635 3,810 920 12,035 cross-border 655 1,303 1,513 2,888 3,389 with non-financial customers 300 871 651 2,621 1,345 local 356 432 862 267 2,044 cross-border
3,072 2,101 3,253 2,485 12,972 Outright forwards 389 416 589 374 2,530 with reporting dealers 151 84 151 113 847 local 239 332 437 261 1,683 cross-border 2,065 1,313 1,605 565 7,907 with other financial institutions 1,395 686 646 441 2,648 local 669 627 960 125 5,258 cross-border 618 372 1,058 1,545 2,536 with non-financial customers 409 210 808 1,454 1,014 local 210 162 251 91 1,522 cross-border
1,742 858 1,180 981 4,142 Up to 7 days 1,265 1,187 2,024 1,370 7,726 Over 7 days and up to 1 year 65 55 49 134 1,104 Over 1 year
4,908 3,592 18,020 9,468 21,658 Foreign exchange swaps 1,321 1,034 11,378 4,510 7,060 with reporting dealers 263 208 204 1,420 981 local 1,059 826 11,174 3,089 6,078 cross-border 3,023 1,727 3,451 2,363 9,765 with other financial institutions 1,091 527 1,536 1,659 2,789 local 1,933 1,200 1,915 704 6,976 cross-border
563 830 3,192 2,595 4,834 with non-financial customers
242 346 1,998 2,348 2,153 local 321 484 1,193 247 2,681 cross-border
3,132 1,198 12,941 4,714 10,738 Up to 7 days 1,742 2,360 4,930 4,695 10,638 Over 7 days and up to 1 year 34 33 149 59 282 Over 1 year
Table E.3 (cont)
¹ Adjusted for local and cross-border inter-dealer double-counting. Due to incomplete reporting, the maturity breakdown does not always sumto totals. Due to incomplete counterparty breakdown, components do not always sum to totals. ² Includes all participating countries’
currencies other than the ones listed. ³ Calculated as the difference between the total and the sum of the listed components. 4 Due toincomplete reporting, the maturity breakdown does not always sum to totals.
Canadian dollar
Currencies of other reporting countries²
Residual currencies³
Australian dollar
Swedish krona
59

OTC foreign exchange turnover by instrument, counterparty and currency
in April 20101
Euro against:Daily averages, in millions of US dollars
Currency swaps 17,673 13,507 770 651 710
with reporting dealers 6,787 5,323 95 320 222
local 1,431 910 18 89 15
cross-border 5,356 4,414 78 231 207
with other financial institutions 9,498 7,185 664 279 348
local 4,376 3,438 478 119 90
cross-border 5,121 3,747 186 160 258
with non-financial customers 1,389 999 11 53 140
local 584 376 4 39 106
cross-border 805 623 7 14 34
Options sold 57,445 33,397 4,070 4,565 5,213
with reporting dealers 24,812 14,664 1,606 2,159 2,190
local 8,887 5,211 551 940 840
cross-border 15,924 9,454 1,056 1,220 1,350
with other financial institutions 25,850 15,230 1,935 1,900 2,098
local 12,117 7,567 655 969 1,001
cross-border 13,733 7,662 1,280 931 1,098
with non-financial customers 6,784 3,503 529 506 925
local 2,864 1,410 310 175 414
cross-border 3,919 2,093 219 331 511
Options bought 54,981 32,624 3,492 4,881 5,296
with reporting dealers 26,633 15,573 1,619 2,398 2,821
local 9,198 5,362 509 1,018 904
cross-border 17,434 10,212 1,110 1,380 1,916
with other financial institutions 21,329 13,270 1,420 1,811 1,584
local 8,879 5,675 610 753 666
cross-border 12,450 7,595 810 1,058 918
with non-financial customers 7,020 3,782 453 671 891
local 2,750 1,487 226 186 301
cross-border 4,270 2,294 227 485 590
Total options 86,705 50,903 5,950 7,167 8,004
Other products ... ... ... ... ...
Total foreign exchange contracts 1,555,076 1,101,254 110,684 109,061 71,650
Table E.3 (cont)
Yen Pound sterling
For footnotes, see facing page.
Swiss francTotal US dollar
60
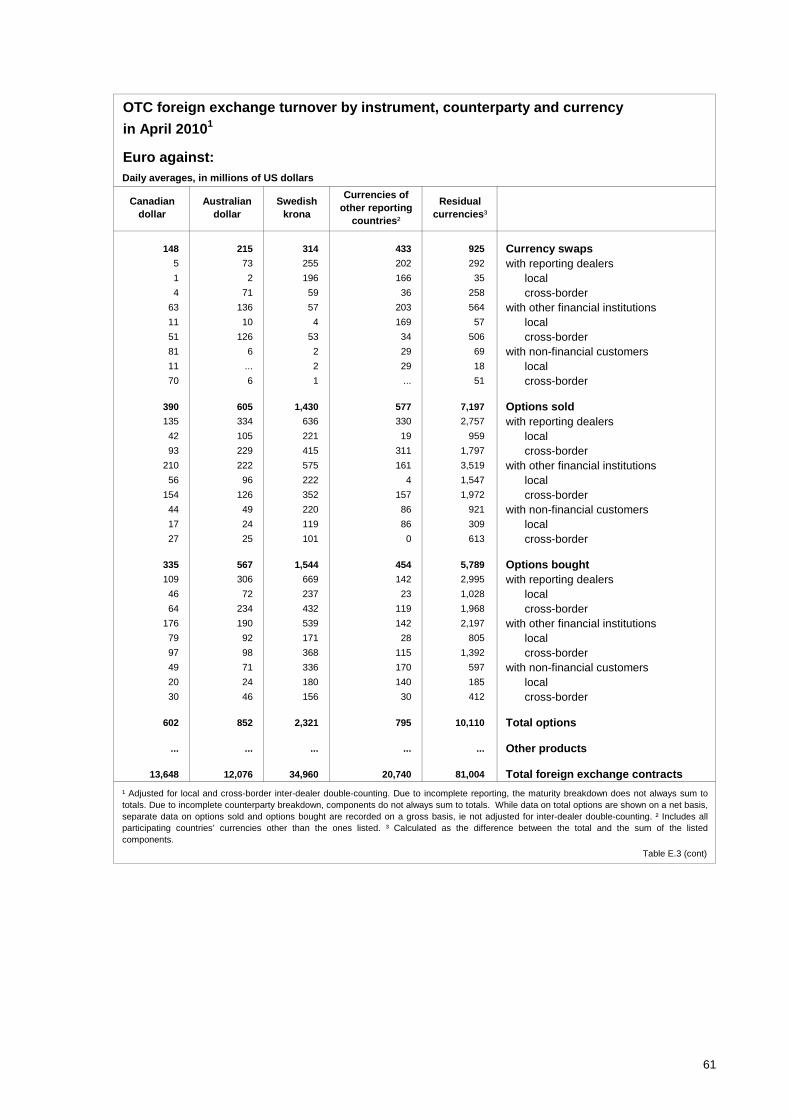
in April 20101
Euro against:Daily averages, in millions of US dollars
148 215 314 433 925 Currency swaps 5 73 255 202 292 with reporting dealers 1 2 196 166 35 local 4 71 59 36 258 cross-border 63 136 57 203 564 with other financial institutions 11 10 4 169 57 local 51 126 53 34 506 cross-border 81 6 2 29 69 with non-financial customers 11 ... 2 29 18 local 70 6 1 ... 51 cross-border
390 605 1,430 577 7,197 Options sold 135 334 636 330 2,757 with reporting dealers 42 105 221 19 959 local 93 229 415 311 1,797 cross-border 210 222 575 161 3,519 with other financial institutions 56 96 222 4 1,547 local 154 126 352 157 1,972 cross-border 44 49 220 86 921 with non-financial customers 17 24 119 86 309 local 27 25 101 0 613 cross-border
335 567 1,544 454 5,789 Options bought 109 306 669 142 2,995 with reporting dealers 46 72 237 23 1,028 local 64 234 432 119 1,968 cross-border 176 190 539 142 2,197 with other financial institutions 79 92 171 28 805 local 97 98 368 115 1,392 cross-border 49 71 336 170 597 with non-financial customers 20 24 180 140 185 local 30 46 156 30 412 cross-border
602 852 2,321 795 10,110 Total options
... ... ... ... ... Other products
13,648 12,076 34,960 20,740 81,004 Total foreign exchange contracts
Table E.3 (cont)
Residual currencies³
¹ Adjusted for local and cross-border inter-dealer double-counting. Due to incomplete reporting, the maturity breakdown does not always sum tototals. Due to incomplete counterparty breakdown, components do not always sum to totals. While data on total options are shown on a net basis,separate data on options sold and options bought are recorded on a gross basis, ie not adjusted for inter-dealer double-counting. ² Includes allparticipating countries’ currencies other than the ones listed. ³ Calculated as the difference between the total and the sum of the listedcomponents.
Australian dollar
Currencies of other reporting
countries²
Canadian dollar
Swedish krona
OTC foreign exchange turnover by instrument, counterparty and currency
61
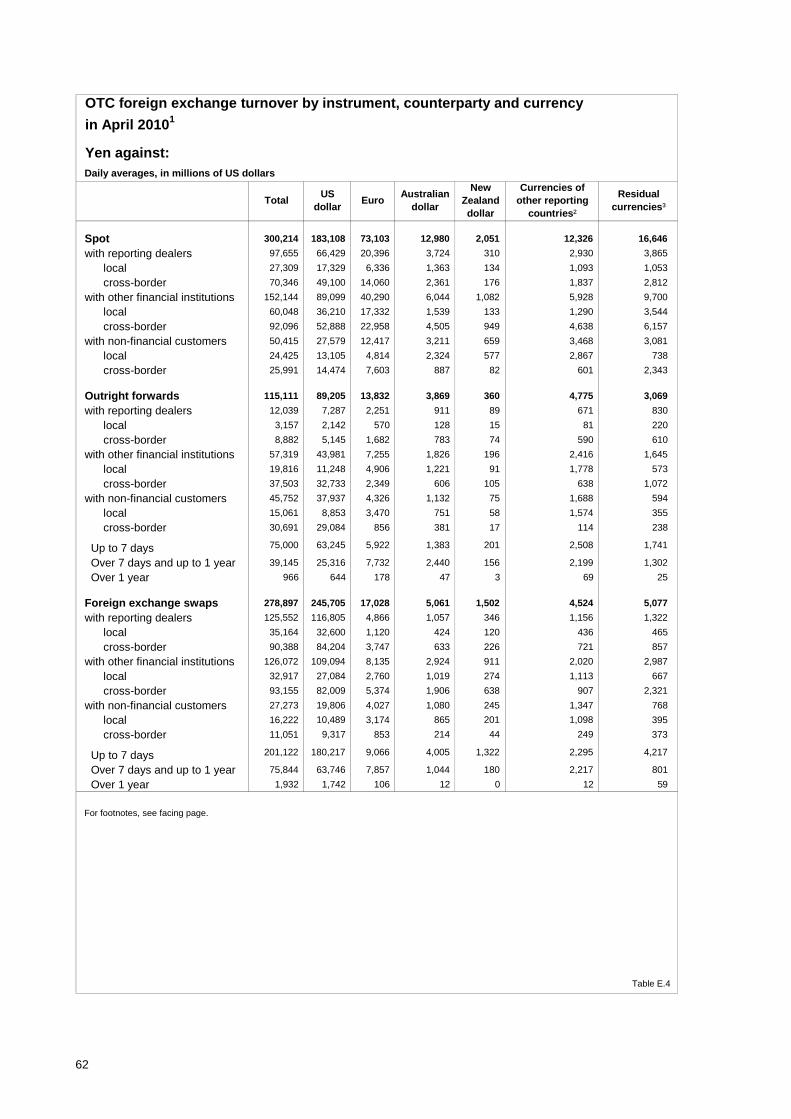
OTC foreign exchange turnover by instrument, counterparty and currency
in April 20101
Yen against:Daily averages, in millions of US dollars
Spot 300,214 183,108 73,103 12,980 2,051 12,326 16,646
with reporting dealers 97,655 66,429 20,396 3,724 310 2,930 3,865
local 27,309 17,329 6,336 1,363 134 1,093 1,053
cross-border 70,346 49,100 14,060 2,361 176 1,837 2,812
with other financial institutions 152,144 89,099 40,290 6,044 1,082 5,928 9,700
local 60,048 36,210 17,332 1,539 133 1,290 3,544
cross-border 92,096 52,888 22,958 4,505 949 4,638 6,157
with non-financial customers 50,415 27,579 12,417 3,211 659 3,468 3,081
local 24,425 13,105 4,814 2,324 577 2,867 738
cross-border 25,991 14,474 7,603 887 82 601 2,343
Outright forwards 115,111 89,205 13,832 3,869 360 4,775 3,069
with reporting dealers 12,039 7,287 2,251 911 89 671 830
local 3,157 2,142 570 128 15 81 220
cross-border 8,882 5,145 1,682 783 74 590 610
with other financial institutions 57,319 43,981 7,255 1,826 196 2,416 1,645
local 19,816 11,248 4,906 1,221 91 1,778 573
cross-border 37,503 32,733 2,349 606 105 638 1,072
with non-financial customers 45,752 37,937 4,326 1,132 75 1,688 594
local 15,061 8,853 3,470 751 58 1,574 355
cross-border 30,691 29,084 856 381 17 114 238
Up to 7 days 75,000 63,245 5,922 1,383 201 2,508 1,741
Over 7 days and up to 1 year 39,145 25,316 7,732 2,440 156 2,199 1,302
Over 1 year 966 644 178 47 3 69 25
Foreign exchange swaps 278,897 245,705 17,028 5,061 1,502 4,524 5,077
with reporting dealers 125,552 116,805 4,866 1,057 346 1,156 1,322
local 35,164 32,600 1,120 424 120 436 465
cross-border 90,388 84,204 3,747 633 226 721 857
with other financial institutions 126,072 109,094 8,135 2,924 911 2,020 2,987
local 32,917 27,084 2,760 1,019 274 1,113 667
cross-border 93,155 82,009 5,374 1,906 638 907 2,321
with non-financial customers 27,273 19,806 4,027 1,080 245 1,347 768
local 16,222 10,489 3,174 865 201 1,098 395
cross-border 11,051 9,317 853 214 44 249 373
Up to 7 days 201,122 180,217 9,066 4,005 1,322 2,295 4,217
Over 7 days and up to 1 year 75,844 63,746 7,857 1,044 180 2,217 801
Over 1 year 1,932 1,742 106 12 0 12 59
Table E.4
US dollar
New Zealand dollar
Australian dollar
For footnotes, see facing page.
EuroCurrencies of
other reporting countries²
Residual currencies³
Total
62

OTC foreign exchange turnover by instrument, counterparty and currency
in April 20101
Yen against:Daily averages, in millions of US dollars
Currency swaps 6,597 5,646 770 73 ... 68 40
with reporting dealers 2,707 2,576 95 8 ... 6 22
local 491 467 18 0 ... 2 4
cross-border 2,216 2,109 78 8 ... 4 18
with other financial institutions 3,320 2,572 664 61 ... 12 12
local 1,169 677 478 ... ... 11 3
cross-border 2,151 1,894 186 61 ... 1 8
with non-financial customers 569 499 11 3 ... 50 6
local 279 216 4 3 ... 49 6
cross-border 290 282 7 0 ... 1 0
Options sold 34,497 27,545 4,070 1,374 99 469 940
with reporting dealers 12,229 9,130 1,606 683 56 256 498
local 4,990 3,983 551 157 18 138 143
cross-border 7,239 5,147 1,056 526 38 119 354
with other financial institutions 19,399 16,315 1,935 556 36 188 368
local 14,411 13,298 655 213 10 83 151
cross-border 4,988 3,017 1,280 343 26 106 216
with non-financial customers 2,869 2,099 529 134 7 24 75
local 1,386 1,023 310 21 3 14 15
cross-border 1,482 1,076 219 113 4 10 60
Options bought 31,397 24,865 3,492 1,375 163 454 1,047
with reporting dealers 10,629 7,550 1,619 701 116 211 431
local 3,171 2,252 509 154 17 101 138
cross-border 7,458 5,299 1,110 546 100 110 293
with other financial institutions 17,678 15,048 1,420 508 30 206 466
local 13,282 12,199 610 217 11 91 153
cross-border 4,396 2,849 810 291 19 114 312
with non-financial customers 3,090 2,267 453 166 17 37 150
local 1,343 1,007 226 38 6 22 42
cross-border 1,748 1,259 227 128 10 15 108
Total options 54,465 44,070 5,950 2,057 176 689 1,523
Other products ... ... ... ... ... ... ...
Total foreign exchange contracts 755,283 567,734 110,684 24,040 4,089 22,381 26,356
Table E.4 (cont)
¹ Adjusted for local and cross-border inter-dealer double-counting. Due to incomplete reporting, the maturity breakdown does not always sum tototals. Due to incomplete counterparty breakdown, components do not always sum to totals. While data on total options are shown on a net basis,separate data on options sold and options bought are recorded on a gross basis, ie not adjusted for inter-dealer double-counting. ² Includes allparticipating countries’ currencies other than the ones listed. ³ Calculated as the difference between the total and the sum of the listed components.
New Zealand dollar
Currencies of other reporting
countries²
Residual currencies³
Australian dollar
Total US dollar Euro
63
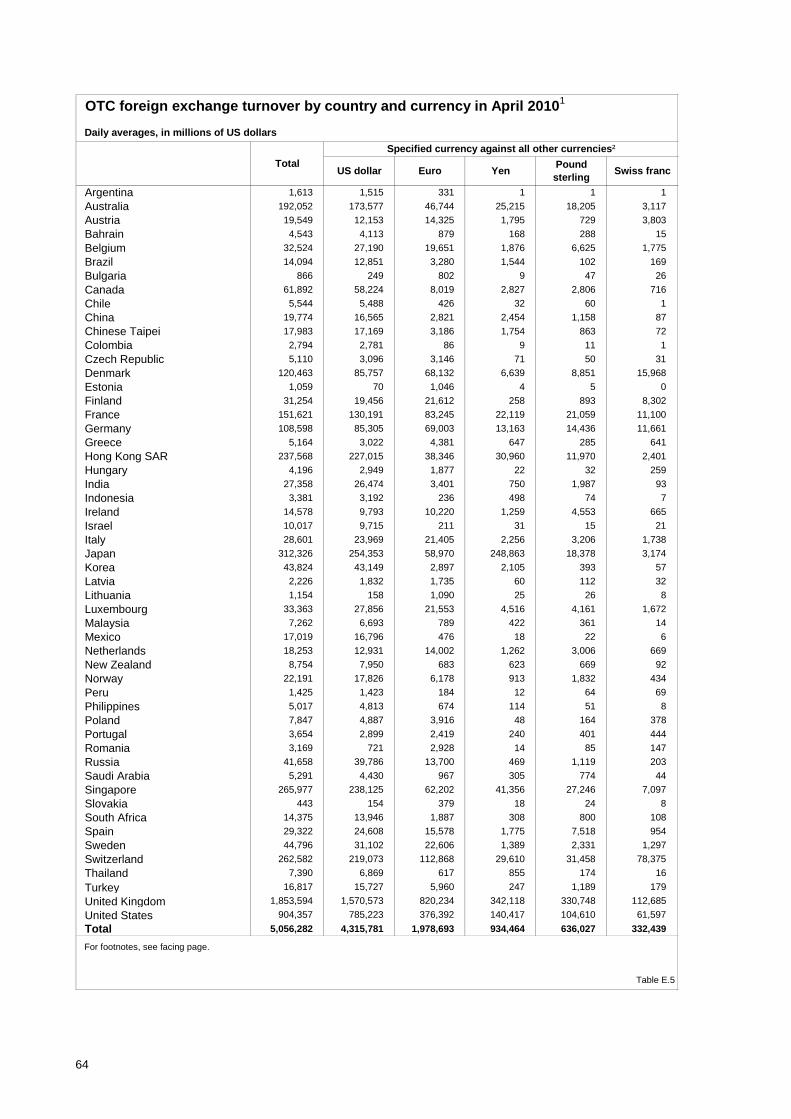
OTC foreign exchange turnover by country and currency in April 20101
Daily averages, in millions of US dollars
1,613 1,515 331 1 1 1
192,052 173,577 46,744 25,215 18,205 3,117
19,549 12,153 14,325 1,795 729 3,803
4,543 4,113 879 168 288 15
32,524 27,190 19,651 1,876 6,625 1,775
14,094 12,851 3,280 1,544 102 169
866 249 802 9 47 26
61,892 58,224 8,019 2,827 2,806 716
5,544 5,488 426 32 60 1
19,774 16,565 2,821 2,454 1,158 87
17,983 17,169 3,186 1,754 863 72
2,794 2,781 86 9 11 1
5,110 3,096 3,146 71 50 31
120,463 85,757 68,132 6,639 8,851 15,968
1,059 70 1,046 4 5 0
31,254 19,456 21,612 258 893 8,302
151,621 130,191 83,245 22,119 21,059 11,100
108,598 85,305 69,003 13,163 14,436 11,661
5,164 3,022 4,381 647 285 641
237,568 227,015 38,346 30,960 11,970 2,401
4,196 2,949 1,877 22 32 259
27,358 26,474 3,401 750 1,987 93
3,381 3,192 236 498 74 7
14,578 9,793 10,220 1,259 4,553 665
10,017 9,715 211 31 15 21
28,601 23,969 21,405 2,256 3,206 1,738
312,326 254,353 58,970 248,863 18,378 3,174
43,824 43,149 2,897 2,105 393 57
2,226 1,832 1,735 60 112 32
1,154 158 1,090 25 26 8
33,363 27,856 21,553 4,516 4,161 1,672
7,262 6,693 789 422 361 14
17,019 16,796 476 18 22 6
18,253 12,931 14,002 1,262 3,006 669
8,754 7,950 683 623 669 92
22,191 17,826 6,178 913 1,832 434
1,425 1,423 184 12 64 69
5,017 4,813 674 114 51 8
7,847 4,887 3,916 48 164 378
3,654 2,899 2,419 240 401 444
3,169 721 2,928 14 85 147
41,658 39,786 13,700 469 1,119 203
5,291 4,430 967 305 774 44
265,977 238,125 62,202 41,356 27,246 7,097
443 154 379 18 24 8
14,375 13,946 1,887 308 800 108
29,322 24,608 15,578 1,775 7,518 954
44,796 31,102 22,606 1,389 2,331 1,297
262,582 219,073 112,868 29,610 31,458 78,375
7,390 6,869 617 855 174 16
Turkey 16,817 15,727 5,960 247 1,189 179
United Kingdom 1,853,594 1,570,573 820,234 342,118 330,748 112,685
United States 904,357 785,223 376,392 140,417 104,610 61,597
5,056,282 4,315,781 1,978,693 934,464 636,027 332,439
Table E.5
For footnotes, see facing page.
Brazil
Specified currency against all other currencies²
EstoniaDenmark
Belgium
Czech Republic
ChinaChileCanadaBulgaria
SwedenSwitzerlandThailand
RomaniaRussiaSaudi ArabiaSingapore
PeruPhilippines
Total
SlovakiaSouth AfricaSpain
PolandPortugal
MexicoNetherlandsNew ZealandNorway
LithuaniaLuxembourgMalaysia
ItalyJapanKoreaLatvia
IndiaIndonesiaIrelandIsrael
GermanyGreeceHong Kong SARHungary
FinlandFrance
ColombiaChinese Taipei
ArgentinaAustraliaAustriaBahrain
YenPound sterling
Swiss francTotal
US dollar Euro
64
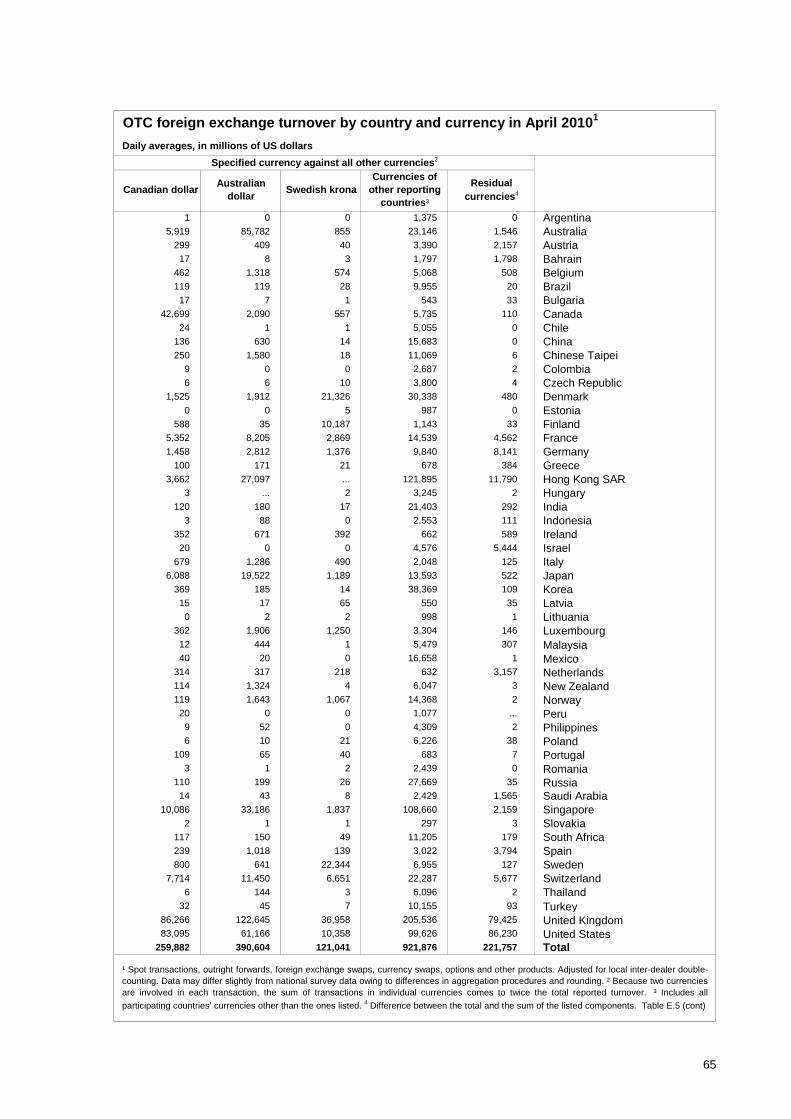
OTC foreign exchange turnover by country and currency in April 20101
Daily averages, in millions of US dollars
1 0 0 1,375 0
5,919 85,782 855 23,146 1,546 Australia 299 409 40 3,390 2,157 Austria 17 8 3 1,797 1,798 Bahrain 462 1,318 574 5,068 508 Belgium 119 119 28 9,955 20 Brazil 17 7 1 543 33
42,699 2,090 557 5,735 110
24 1 1 5,055 0
136 630 14 15,683 0
250 1,580 18 11,069 6
9 0 0 2,687 2
6 6 10 3,800 4
1,525 1,912 21,326 30,338 480
0 0 5 987 0
588 35 10,187 1,143 33
5,352 8,205 2,869 14,539 4,562
1,458 2,812 1,376 9,840 8,141
100 171 21 678 384
3,662 27,097 ... 121,895 11,790
3 ... 2 3,245 2
120 180 17 21,403 292
3 88 0 2,553 111
352 671 392 662 589
20 0 0 4,576 5,444
679 1,286 490 2,048 125
6,088 19,522 1,189 13,593 522
369 185 14 38,369 109
15 17 65 550 35
0 2 2 998 1
362 1,906 1,250 3,304 146
12 444 1 5,479 307 Malaysia 40 20 0 16,658 1 Mexico 314 317 218 632 3,157 Netherlands 114 1,324 4 6,047 3 New Zealand 119 1,643 1,067 14,368 2 Norway 20 0 0 1,077 ... Peru 9 52 0 4,309 2 Philippines 6 10 21 6,226 38 Poland 109 65 40 683 7 Portugal 3 1 2 2,439 0 Romania 110 199 26 27,669 35 Russia 14 43 8 2,429 1,565
10,086 33,186 1,837 108,660 2,159
2 1 1 297 3
117 150 49 11,205 179
239 1,018 139 3,022 3,794
800 641 22,344 6,955 127
7,714 11,450 6,651 22,287 5,677
6 144 3 6,096 2
32 45 7 10,155 93 Turkey 86,266 122,645 36,958 205,536 79,425 United Kingdom 83,095 61,166 10,358 99,626 86,230 United States 259,882 390,604 121,041 921,876 221,757
Thailand
Total
South AfricaSpainSwedenSwitzerland
Slovakia
KoreaLatviaLithuaniaLuxembourg
Saudi ArabiaSingapore
IrelandIsraelItalyJapan
Hong Kong SARHungaryIndiaIndonesia
FinlandFranceGermanyGreece
Bulgaria
¹ Spot transactions, outright forwards, foreign exchange swaps, currency swaps, options and other products. Adjusted for local inter-dealer double-counting. Data may differ slightly from national survey data owing to differences in aggregation procedures and rounding. ² Because two currenciesare involved in each transaction, the sum of transactions in individual currencies comes to twice the total reported turnover. ³ Includes all
participating countries’ currencies other than the ones listed. 4 Difference between the total and the sum of the listed components. Table E.5 (cont)
CanadaChileChinaChinese TaipeiColombiaCzech Republic
EstoniaDenmark
Argentina
Canadian dollarAustralian
dollar
Currencies of other reporting
countries³
Residual currencies4
Specified currency against all other currencies2
Swedish krona
65
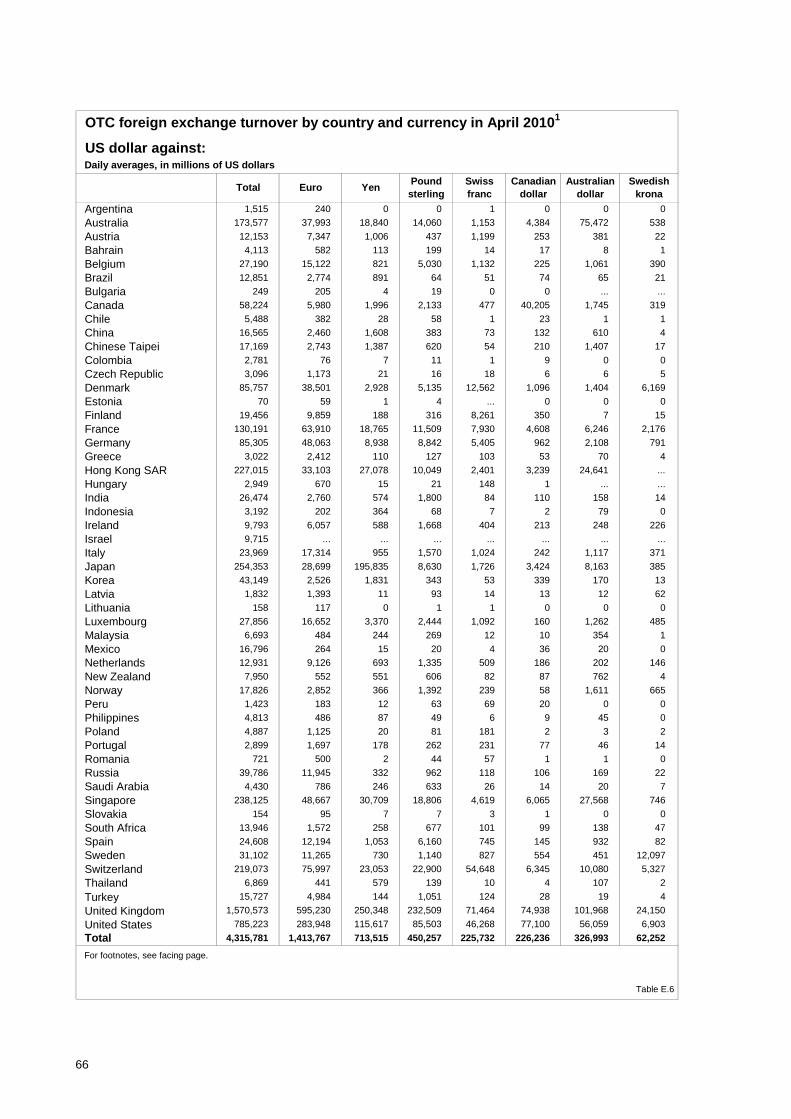
OTC foreign exchange turnover by country and currency in April 20101
US dollar against:Daily averages, in millions of US dollars
1,515 240 0 0 1 0 0 0
173,577 37,993 18,840 14,060 1,153 4,384 75,472 538
12,153 7,347 1,006 437 1,199 253 381 22
4,113 582 113 199 14 17 8 1
27,190 15,122 821 5,030 1,132 225 1,061 390
12,851 2,774 891 64 51 74 65 21
249 205 4 19 0 0 ... ...
58,224 5,980 1,996 2,133 477 40,205 1,745 319
5,488 382 28 58 1 23 1 1
16,565 2,460 1,608 383 73 132 610 4
17,169 2,743 1,387 620 54 210 1,407 17
2,781 76 7 11 1 9 0 0
3,096 1,173 21 16 18 6 6 5
85,757 38,501 2,928 5,135 12,562 1,096 1,404 6,169
70 59 1 4 ... 0 0 0
19,456 9,859 188 316 8,261 350 7 15
130,191 63,910 18,765 11,509 7,930 4,608 6,246 2,176
85,305 48,063 8,938 8,842 5,405 962 2,108 791
3,022 2,412 110 127 103 53 70 4
227,015 33,103 27,078 10,049 2,401 3,239 24,641 ...
2,949 670 15 21 148 1 ... ...
26,474 2,760 574 1,800 84 110 158 14
3,192 202 364 68 7 2 79 0
9,793 6,057 588 1,668 404 213 248 226
9,715 ... ... ... ... ... ... ...
23,969 17,314 955 1,570 1,024 242 1,117 371
254,353 28,699 195,835 8,630 1,726 3,424 8,163 385
43,149 2,526 1,831 343 53 339 170 13
1,832 1,393 11 93 14 13 12 62
158 117 0 1 1 0 0 0
27,856 16,652 3,370 2,444 1,092 160 1,262 485
6,693 484 244 269 12 10 354 1
16,796 264 15 20 4 36 20 0
12,931 9,126 693 1,335 509 186 202 146
7,950 552 551 606 82 87 762 4
17,826 2,852 366 1,392 239 58 1,611 665
1,423 183 12 63 69 20 0 0
4,813 486 87 49 6 9 45 0
4,887 1,125 20 81 181 2 3 2
2,899 1,697 178 262 231 77 46 14
721 500 2 44 57 1 1 0
39,786 11,945 332 962 118 106 169 22
4,430 786 246 633 26 14 20 7
238,125 48,667 30,709 18,806 4,619 6,065 27,568 746
154 95 7 7 3 1 0 0
13,946 1,572 258 677 101 99 138 47
24,608 12,194 1,053 6,160 745 145 932 82
31,102 11,265 730 1,140 827 554 451 12,097
219,073 75,997 23,053 22,900 54,648 6,345 10,080 5,327
6,869 441 579 139 10 4 107 2
Turkey 15,727 4,984 144 1,051 124 28 19 4
United Kingdom 1,570,573 595,230 250,348 232,509 71,464 74,938 101,968 24,150
United States 785,223 283,948 115,617 85,503 46,268 77,100 56,059 6,903
4,315,781 1,413,767 713,515 450,257 225,732 226,236 326,993 62,252
Table E.6
For footnotes, see facing page.
Euro YenAustralian
dollar
AustriaBahrain
FinlandFrance
ColombiaChinese Taipei
Swedish krona
ArgentinaAustralia
TotalPound sterling
Swiss franc
Canadian dollar
Brazil
EstoniaDenmark
Belgium
Bulgaria
Czech Republic
ChinaChileCanada
GermanyGreeceHong Kong SARHungaryIndiaIndonesiaIrelandIsrael
LithuaniaLuxembourgMalaysia
ItalyJapanKoreaLatvia
MexicoNetherlandsNew ZealandNorwayPeruPhilippinesPolandPortugal
SlovakiaSouth AfricaSpain
RomaniaRussiaSaudi ArabiaSingapore
SwedenSwitzerlandThailand
Total
66
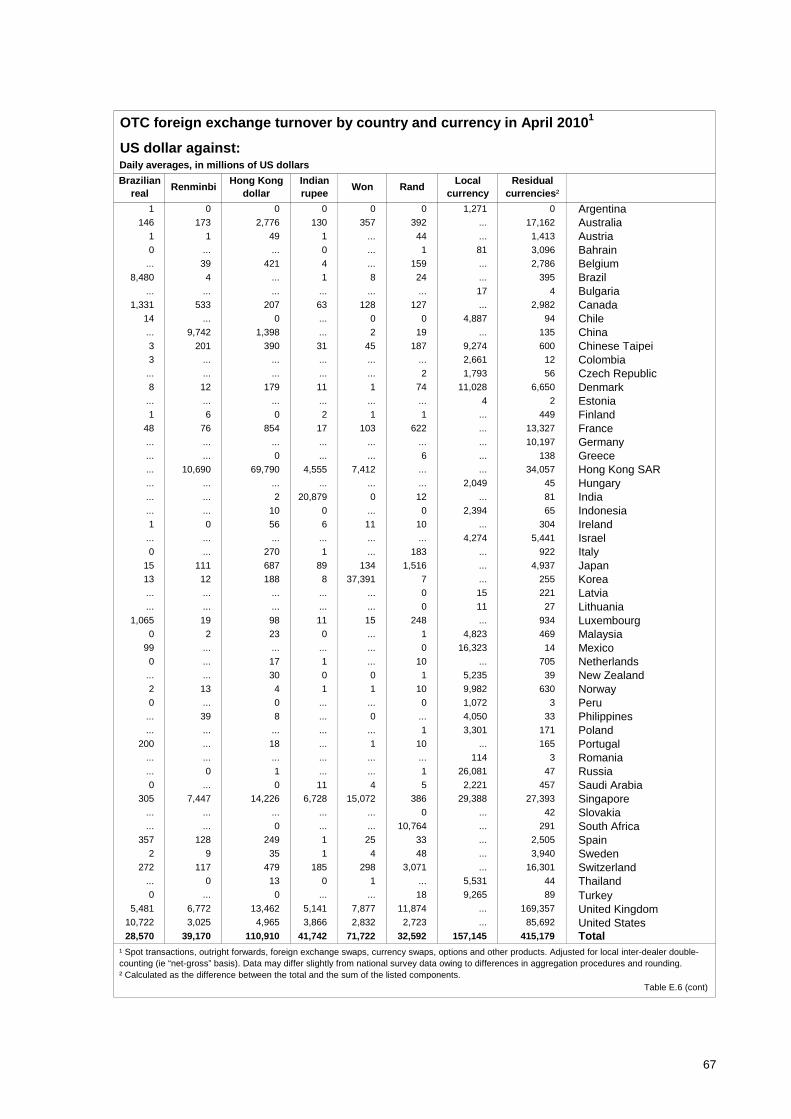
OTC foreign exchange turnover by country and currency in April 20101
US dollar against:Daily averages, in millions of US dollars
1 0 0 0 0 0 1,271 0
146 173 2,776 130 357 392 ... 17,162
1 1 49 1 ... 44 ... 1,413
0 ... ... 0 ... 1 81 3,096
... 39 421 4 ... 159 ... 2,786
8,480 4 ... 1 8 24 ... 395
... ... ... ... ... ... 17 4
1,331 533 207 63 128 127 ... 2,982
14 ... 0 ... 0 0 4,887 94
... 9,742 1,398 ... 2 19 ... 135
3 201 390 31 45 187 9,274 600
3 ... ... ... ... ... 2,661 12
... ... ... ... ... 2 1,793 56
8 12 179 11 1 74 11,028 6,650
... ... ... ... ... ... 4 2
1 6 0 2 1 1 ... 449
48 76 854 17 103 622 ... 13,327
... ... ... ... ... ... ... 10,197
... ... 0 ... ... 6 ... 138
... 10,690 69,790 4,555 7,412 ... ... 34,057
... ... ... ... ... ... 2,049 45
... ... 2 20,879 0 12 ... 81
... ... 10 0 ... 0 2,394 65
1 0 56 6 11 10 ... 304
... ... ... ... ... ... 4,274 5,441
0 ... 270 1 ... 183 ... 922
15 111 687 89 134 1,516 ... 4,937
13 12 188 8 37,391 7 ... 255
... ... ... ... ... 0 15 221
... ... ... ... ... 0 11 27
1,065 19 98 11 15 248 ... 934
0 2 23 0 ... 1 4,823 469
99 ... ... ... ... 0 16,323 14
0 ... 17 1 ... 10 ... 705
... ... 30 0 0 1 5,235 39
2 13 4 1 1 10 9,982 630
0 ... 0 ... ... 0 1,072 3
... 39 8 ... 0 ... 4,050 33
... ... ... ... ... 1 3,301 171
200 ... 18 ... 1 10 ... 165
... ... ... ... ... ... 114 3
... 0 1 ... ... 1 26,081 47
0 ... 0 11 4 5 2,221 457
305 7,447 14,226 6,728 15,072 386 29,388 27,393
... ... ... ... ... 0 ... 42
... ... 0 ... ... 10,764 ... 291
357 128 249 1 25 33 ... 2,505
2 9 35 1 4 48 ... 3,940
272 117 479 185 298 3,071 ... 16,301
... 0 13 0 1 ... 5,531 44
0 ... 0 ... ... 18 9,265 89 Turkey 5,481 6,772 13,462 5,141 7,877 11,874 ... 169,357 United Kingdom 10,722 3,025 4,965 3,866 2,832 2,723 ... 85,692 United States 28,570 39,170 110,910 41,742 71,722 32,592 157,145 415,179
Slovakia
Thailand
Luxembourg
Saudi ArabiaSingapore
NetherlandsNew Zealand
Poland
NorwayPeruPhilippines
MalaysiaMexico
JapanKoreaLatviaLithuania
IndonesiaIrelandIsraelItaly
GreeceHong Kong SARHungaryIndia
Won
Chinese TaipeiColombiaCzech Republic
Bahrain
Argentina
BelgiumBrazilBulgaria
Brazilian real
AustraliaAustria
RenminbiLocal
currencyResidual
currencies²Hong Kong
dollarRand
Indian rupee
FranceGermany
CanadaChileChina
EstoniaDenmark
Finland
Table E.6 (cont)
PortugalRomaniaRussia
¹ Spot transactions, outright forwards, foreign exchange swaps, currency swaps, options and other products. Adjusted for local inter-dealer double-counting (ie “net-gross” basis). Data may differ slightly from national survey data owing to differences in aggregation procedures and rounding. ² Calculated as the difference between the total and the sum of the listed components.
Total
South AfricaSpainSwedenSwitzerland
67
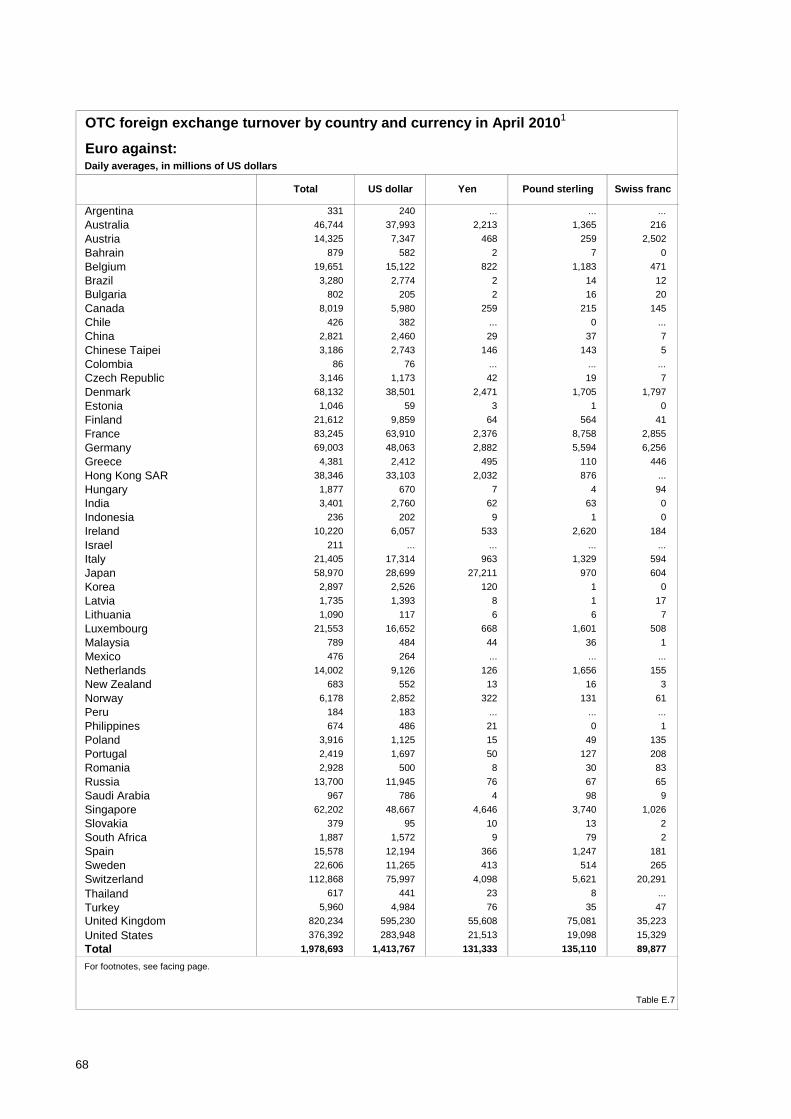
OTC foreign exchange turnover by country and currency in April 20101
Euro against:Daily averages, in millions of US dollars
331 240 ... ... ...
46,744 37,993 2,213 1,365 216
14,325 7,347 468 259 2,502
879 582 2 7 0
19,651 15,122 822 1,183 471
3,280 2,774 2 14 12
802 205 2 16 20
8,019 5,980 259 215 145
426 382 ... 0 ...
2,821 2,460 29 37 7
3,186 2,743 146 143 5
86 76 ... ... ...
3,146 1,173 42 19 7
68,132 38,501 2,471 1,705 1,797
1,046 59 3 1 0
21,612 9,859 64 564 41
83,245 63,910 2,376 8,758 2,855
69,003 48,063 2,882 5,594 6,256
4,381 2,412 495 110 446
38,346 33,103 2,032 876 ...
1,877 670 7 4 94
3,401 2,760 62 63 0
236 202 9 1 0
10,220 6,057 533 2,620 184
211 ... ... ... ...
21,405 17,314 963 1,329 594
58,970 28,699 27,211 970 604
2,897 2,526 120 1 0
1,735 1,393 8 1 17
1,090 117 6 6 7
21,553 16,652 668 1,601 508
789 484 44 36 1
476 264 ... ... ...
14,002 9,126 126 1,656 155
683 552 13 16 3
6,178 2,852 322 131 61
184 183 ... ... ...
674 486 21 0 1
3,916 1,125 15 49 135
2,419 1,697 50 127 208
2,928 500 8 30 83
13,700 11,945 76 67 65
967 786 4 98 9
62,202 48,667 4,646 3,740 1,026
379 95 10 13 2
1,887 1,572 9 79 2
15,578 12,194 366 1,247 181
22,606 11,265 413 514 265
112,868 75,997 4,098 5,621 20,291
Thailand 617 441 23 8 ...
Turkey 5,960 4,984 76 35 47
820,234 595,230 55,608 75,081 35,223
United States 376,392 283,948 21,513 19,098 15,329
1,978,693 1,413,767 131,333 135,110 89,877
Table E.7
Bulgaria
Czech Republic
ChinaChileCanada
SlovakiaSouth AfricaSpain
For footnotes, see facing page.
SwedenSwitzerland
United Kingdom
Total
RomaniaRussiaSaudi ArabiaSingapore
PeruPhilippinesPolandPortugal
MexicoNetherlandsNew ZealandNorway
LithuaniaLuxembourgMalaysia
ItalyJapanKoreaLatvia
IndiaIndonesiaIrelandIsrael
GermanyGreeceHong Kong SARHungary
AustriaBahrain
FinlandFrance
ColombiaChinese Taipei
Brazil
EstoniaDenmark
Belgium
Total
ArgentinaAustralia
US dollar Yen Pound sterling Swiss franc
68
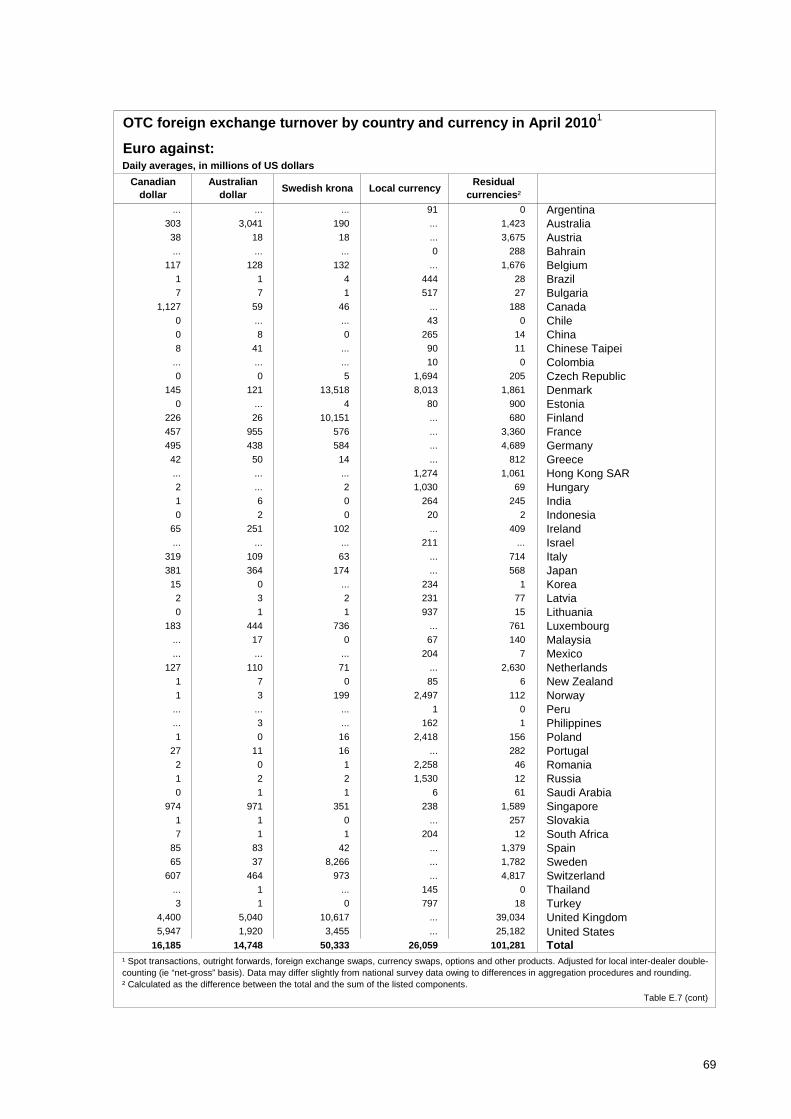
OTC foreign exchange turnover by country and currency in April 20101
Euro against:Daily averages, in millions of US dollars
... ... ... 91 0
303 3,041 190 ... 1,423
38 18 18 ... 3,675
... ... ... 0 288
117 128 132 ... 1,676
1 1 4 444 28
7 7 1 517 27
1,127 59 46 ... 188
0 ... ... 43 0
0 8 0 265 14
8 41 ... 90 11
... ... ... 10 0
0 0 5 1,694 205
145 121 13,518 8,013 1,861
0 ... 4 80 900
226 26 10,151 ... 680
457 955 576 ... 3,360
495 438 584 ... 4,689
42 50 14 ... 812
... ... ... 1,274 1,061
2 ... 2 1,030 69
1 6 0 264 245
0 2 0 20 2
65 251 102 ... 409
... ... ... 211 ...
319 109 63 ... 714
381 364 174 ... 568
15 0 ... 234 1
2 3 2 231 77
0 1 1 937 15
183 444 736 ... 761
... 17 0 67 140
... ... ... 204 7
127 110 71 ... 2,630
1 7 0 85 6
1 3 199 2,497 112
... ... ... 1 0
... 3 ... 162 1
1 0 16 2,418 156
27 11 16 ... 282
2 0 1 2,258 46
1 2 2 1,530 12
0 1 1 6 61
974 971 351 238 1,589
1 1 0 ... 257
7 1 1 204 12
85 83 42 ... 1,379
65 37 8,266 ... 1,782
607 464 973 ... 4,817
... 1 ... 145 0 Thailand 3 1 0 797 18 Turkey 4,400 5,040 10,617 ... 39,034
5,947 1,920 3,455 ... 25,182 United States 16,185 14,748 50,333 26,059 101,281
Czech Republic
ChileChinaChinese TaipeiColombia
AustriaBahrainBelgiumBrazil
Switzerland
Saudi ArabiaSingapore
New ZealandNorwayPeruPhilippinesPolandPortugalRomania
Canadian dollar
Residual currencies²
Swedish krona
Russia
KoreaLatvia
IndiaIndonesiaIreland
Australian dollar
GermanyGreeceHong Kong SARHungary
Sweden
LithuaniaLuxembourg
IsraelItalyJapan
Local currency
FinlandFrance
Argentina
BulgariaCanada
EstoniaDenmark
Australia
Table E.7 (cont)
¹ Spot transactions, outright forwards, foreign exchange swaps, currency swaps, options and other products. Adjusted for local inter-dealer double-counting (ie “net-gross” basis). Data may differ slightly from national survey data owing to differences in aggregation procedures and rounding. ² Calculated as the difference between the total and the sum of the listed components.
MalaysiaMexicoNetherlands
Slovakia
United Kingdom
Total
South AfricaSpain
69

OTC foreign exchange turnover by country and currency in April 20101
Yen against:Daily averages, in millions of US dollars
1 0 ... ... ... 1 ...
25,215 18,840 2,213 2,769 180 ... 1,211
1,795 1,006 468 6 1 ... 314
168 113 2 ... ... 1 53
1,876 821 822 25 7 ... 202
1,544 891 2 52 98 63 439
9 4 2 ... ... 0 3
2,827 1,996 259 62 58 ... 452
32 28 ... ... ... 4 0
2,454 1,608 29 10 ... 73 735
1,754 1,387 146 64 21 68 67
9 7 ... ... ... 0 2
71 21 42 ... ... 7 1
6,639 2,928 2,471 220 16 105 900
4 1 3 ... ... ... 0
258 188 64 0 ... ... 6
22,119 18,765 2,376 552 13 ... 413
13,163 8,938 2,882 266 ... ... 1,078
647 110 495 28 1 ... 14
30,960 27,078 2,032 904 92 238 615
22 15 7 ... ... 0 0
750 574 62 1 0 37 77
498 364 9 2 0 63 60
1,259 588 533 8 1 ... 128
31 ... ... ... ... 31 ...
2,256 955 963 23 37 ... 278
248,863 195,835 27,211 10,336 2,025 ... 13,456
2,105 1,831 120 3 0 144 7
60 11 8 1 ... ... 40
25 0 6 0 ... 0 18
4,516 3,370 668 179 94 ... 205
422 244 44 8 0 37 89
18 15 ... ... ... 2 1
1,262 693 126 2 ... ... 441
623 551 13 15 40 ... 4
913 366 322 ... ... 198 26
12 12 ... ... ... ... ...
114 87 21 1 ... 2 3
48 20 15 6 ... 6 1
240 178 50 ... ... ... 12
14 2 8 ... ... 1 2
469 332 76 2 ... 2 57
305 246 4 10 2 4 39
41,356 30,709 4,646 1,671 249 285 3,796
18 7 10 ... ... ... 2
308 258 9 4 ... 14 23
1,775 1,053 366 3 0 ... 352
1,389 730 413 12 2 ... 233
29,610 23,053 4,098 221 35 ... 2,204
Thailand 855 579 23 0 ... 246 8
Turkey 247 144 76 0 ... 22 5
342,118 250,348 55,608 7,835 1,437 ... 26,890
United States 140,417 115,617 21,513 3,061 226 ... 0
934,464 713,515 131,333 28,361 4,633 1,657 54,965
Table E.8
¹ Spot transactions, outright forwards, foreign exchange swaps, currency swaps, options and other products. Adjusted for local inter-dealer double-counting (ie “net-gross” basis). Data may differ slightly from national survey data owing to differences in aggregation procedures and rounding.² Calculated as the difference between the total and the sum of the listed components.
Bulgaria
Czech Republic
ChinaChileCanada
SwedenSwitzerland
United Kingdom
Total
SlovakiaSouth AfricaSpain
RomaniaRussiaSaudi ArabiaSingapore
PeruPhilippinesPolandPortugal
MexicoNetherlandsNew ZealandNorway
LithuaniaLuxembourgMalaysia
ItalyJapanKoreaLatvia
IndiaIndonesiaIrelandIsrael
GermanyGreeceHong Kong SARHungary
AustriaBahrain
FinlandFrance
ColombiaChinese Taipei
Brazil
EstoniaDenmark
Belgium
Total
ArgentinaAustralia
US dollarNew Zealand
dollarLocal
currencyResidual
currencies²Euro
Australian dollar
70

71
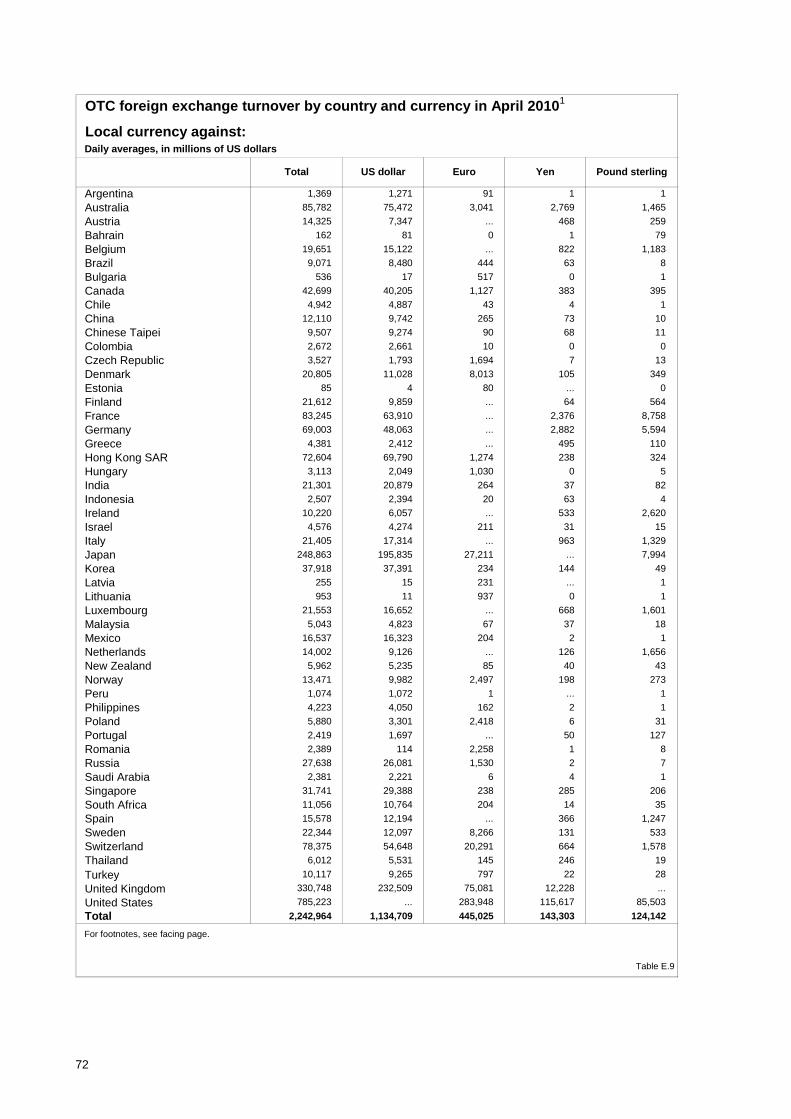
OTC foreign exchange turnover by country and currency in April 20101
Local currency against:Daily averages, in millions of US dollars
1,369 1,271 91 1 1
85,782 75,472 3,041 2,769 1,465
14,325 7,347 ... 468 259
162 81 0 1 79
19,651 15,122 ... 822 1,183
9,071 8,480 444 63 8
536 17 517 0 1
42,699 40,205 1,127 383 395
4,942 4,887 43 4 1
12,110 9,742 265 73 10
9,507 9,274 90 68 11
2,672 2,661 10 0 0
3,527 1,793 1,694 7 13
20,805 11,028 8,013 105 349
85 4 80 ... 0
21,612 9,859 ... 64 564
83,245 63,910 ... 2,376 8,758
69,003 48,063 ... 2,882 5,594
4,381 2,412 ... 495 110
72,604 69,790 1,274 238 324
3,113 2,049 1,030 0 5
21,301 20,879 264 37 82
2,507 2,394 20 63 4
10,220 6,057 ... 533 2,620
4,576 4,274 211 31 15
21,405 17,314 ... 963 1,329
248,863 195,835 27,211 ... 7,994
37,918 37,391 234 144 49
255 15 231 ... 1
953 11 937 0 1
21,553 16,652 ... 668 1,601
5,043 4,823 67 37 18
16,537 16,323 204 2 1
14,002 9,126 ... 126 1,656
5,962 5,235 85 40 43
13,471 9,982 2,497 198 273
1,074 1,072 1 ... 1
4,223 4,050 162 2 1
5,880 3,301 2,418 6 31
2,419 1,697 ... 50 127
2,389 114 2,258 1 8
27,638 26,081 1,530 2 7
2,381 2,221 6 4 1
31,741 29,388 238 285 206
11,056 10,764 204 14 35
15,578 12,194 ... 366 1,247
22,344 12,097 8,266 131 533
78,375 54,648 20,291 664 1,578
6,012 5,531 145 246 19
Turkey 10,117 9,265 797 22 28
United Kingdom 330,748 232,509 75,081 12,228 ...
United States 785,223 ... 283,948 115,617 85,503
2,242,964 1,134,709 445,025 143,303 124,142
Table E.9
For footnotes, see facing page.
US dollar Euro Yen
AustraliaAustriaBahrain
FinlandFrance
Colombia
Brazil
EstoniaDenmark
Pound sterlingTotal
Argentina
Belgium
GermanyGreeceHong Kong SAR
Bulgaria
Czech Republic
ChinaChileCanada
Chinese Taipei
HungaryIndiaIndonesiaIrelandIsrael
LithuaniaLuxembourgMalaysia
ItalyJapanKoreaLatvia
MexicoNetherlandsNew ZealandNorwayPeruPhilippinesPolandPortugal
South AfricaSpain
RomaniaRussiaSaudi ArabiaSingapore
SwedenSwitzerland
Total
Thailand
72
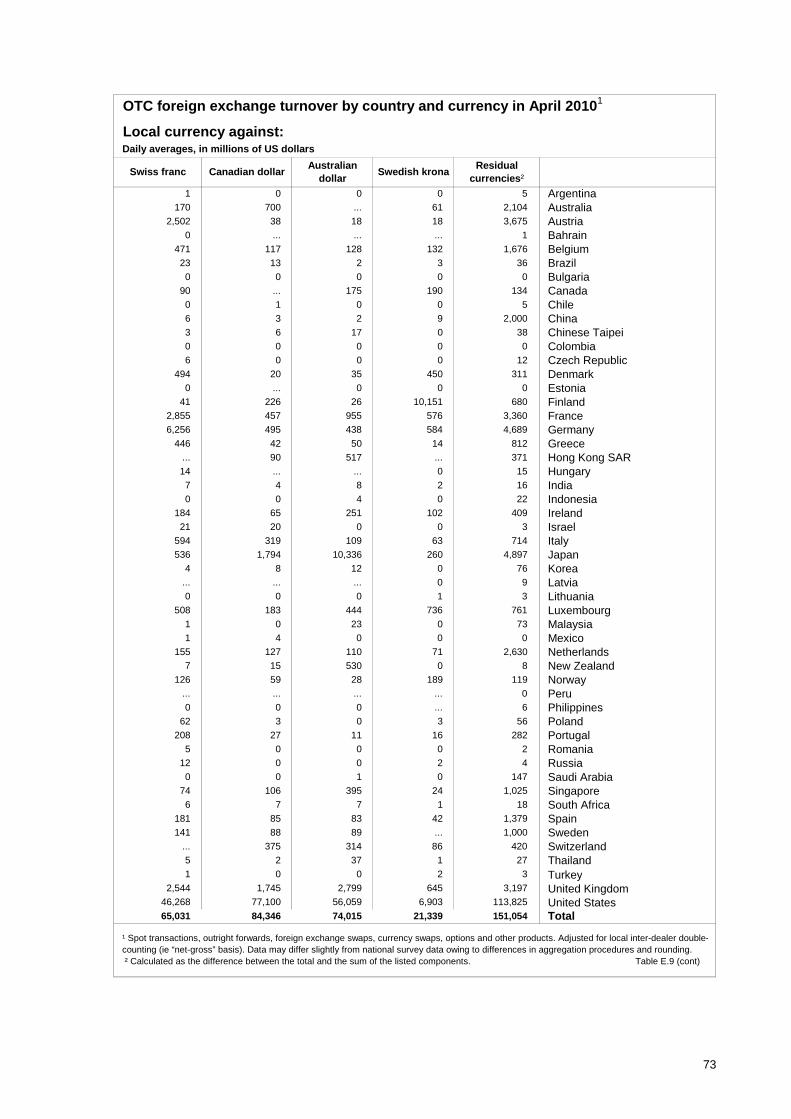
OTC foreign exchange turnover by country and currency in April 20101
Local currency against:Daily averages, in millions of US dollars
1 0 0 0 5
170 700 ... 61 2,104
2,502 38 18 18 3,675
0 ... ... ... 1
471 117 128 132 1,676
23 13 2 3 36
0 0 0 0 0
90 ... 175 190 134
0 1 0 0 5
6 3 2 9 2,000
3 6 17 0 38
0 0 0 0 0
6 0 0 0 12
494 20 35 450 311
0 ... 0 0 0
41 226 26 10,151 680
2,855 457 955 576 3,360
6,256 495 438 584 4,689
446 42 50 14 812
... 90 517 ... 371
14 ... ... 0 15
7 4 8 2 16
0 0 4 0 22
184 65 251 102 409
21 20 0 0 3
594 319 109 63 714
536 1,794 10,336 260 4,897
4 8 12 0 76
... ... ... 0 9
0 0 0 1 3
508 183 444 736 761
1 0 23 0 73
1 4 0 0 0
155 127 110 71 2,630
7 15 530 0 8
126 59 28 189 119
... ... ... ... 0
0 0 0 ... 6
62 3 0 3 56
208 27 11 16 282
5 0 0 0 2
12 0 0 2 4
0 0 1 0 147
74 106 395 24 1,025
6 7 7 1 18
181 85 83 42 1,379
141 88 89 ... 1,000
... 375 314 86 420
5 2 37 1 27
1 0 0 2 3 Turkey 2,544 1,745 2,799 645 3,197 United Kingdom 46,268 77,100 56,059 6,903 113,825 United States 65,031 84,346 74,015 21,339 151,054
Peru
IndiaIndonesiaIrelandIsrael
Australian dollar
Canadian dollarSwiss francResidual
currencies²Swedish krona
Total
South AfricaSpainSwedenSwitzerland
Singapore
Thailand
LithuaniaLuxembourg
Saudi Arabia
MalaysiaMexicoNetherlandsNew Zealand
Russia
PhilippinesPolandPortugalRomania
Norway
GermanyGreeceHong Kong SARHungary
ItalyJapanKoreaLatvia
Argentina
BulgariaCanada
AustraliaAustriaBahrainBelgiumBrazil
¹ Spot transactions, outright forwards, foreign exchange swaps, currency swaps, options and other products. Adjusted for local inter-dealer double-counting (ie “net-gross” basis). Data may differ slightly from national survey data owing to differences in aggregation procedures and rounding. ² Calculated as the difference between the total and the sum of the listed components. Table E.9 (cont)
ChileChinaChinese TaipeiColombiaCzech Republic
EstoniaDenmark
FinlandFrance
73

Foreign exchange turnover by country and counterparty in April 20101
Daily averages, in millions of US dollars
1,895 1,613 282 ... 349 982
218,158 192,052 26,106 91,598 61,045 13,304
20,039 19,549 490 13,029 5,327 704
4,619 4,543 76 2,881 1,476 110
32,770 32,524 247 19,824 10,832 1,621
15,609 14,094 1,516 3,854 5,951 2,773
874 866 9 288 411 158
68,546 61,892 6,654 27,090 22,765 5,383
7,229 5,544 1,684 1,428 1,430 1,001
27,486 19,774 7,712 2,411 5,738 3,913
20,034 17,983 2,050 6,060 5,740 4,132
3,822 2,794 1,028 403 721 641
5,489 5,110 379 3,822 168 742
123,231 120,463 2,767 82,165 12,189 23,342
1,063 1,059 4 997 10 48
31,316 31,254 62 28,911 507 1,775
162,906 151,509 11,397 90,000 39,438 10,674
115,740 108,598 7,142 58,985 34,452 8,019
5,244 5,164 79 3,702 812 571
257,327 237,542 19,785 160,049 44,587 13,121
4,763 4,196 567 2,172 1,077 379
38,857 27,358 11,499 5,413 2,340 8,106
4,632 3,381 1,251 1,197 387 546
14,994 14,578 416 7,305 6,003 854
10,333 10,017 317 ... 7,771 1,929
29,695 28,601 1,093 23,328 2,877 1,303
337,389 312,326 25,063 163,998 77,739 45,526
67,241 43,824 23,417 10,470 5,840 4,096
2,359 2,226 133 340 804 950
1,183 1,154 29 903 88 134
34,408 33,363 1,045 22,581 8,426 1,313
8,262 7,262 1,000 1,736 2,130 2,396
18,156 17,019 1,137 12,594 2,005 1,282
18,626 18,253 372 9,892 6,690 1,300
9,460 8,754 706 2,557 4,811 680
22,450 22,191 260 13,078 5,363 3,490
1,856 1,425 431 455 200 338
7,649 5,017 2,632 1,491 514 379
8,632 7,847 785 4,812 1,479 771
3,831 3,654 177 1,976 1,090 411
3,518 3,169 349 2,063 375 383
49,217 41,658 7,559 10,793 15,520 7,785
6,136 5,291 845 3,082 597 766
278,929 265,899 13,030 161,046 72,693 19,131
445 443 1 297 50 95
17,092 14,375 2,717 9,994 799 865
29,794 29,322 472 17,662 2,061 9,127
45,640 44,796 844 16,548 17,529 9,874
273,640 262,582 11,058 149,097 79,536 22,890
9,649 7,390 2,259 2,206 819 2,107
Turkey 17,677 16,817 860 13,913 918 1,127
United Kingdom 2,065,334 1,853,594 211,741 597,232 866,375 178,246
United States 963,283 904,357 58,926 283,301 451,019 111,111
5,528,525 5,056,067 472,459 2,151,028 1,899,874 532,706
With reporting dealers abroad
With other financial
institutions
With non-financial
customers
Gross turnover² Total
With reporting
local dealers
ArgentinaAustraliaAustriaBahrain
FinlandFrance
ColombiaChinese Taipei
GermanyGreeceHong Kong SARHungaryIndiaIndonesiaIrelandIsrael
LithuaniaLuxembourgMalaysia
ItalyJapanKoreaLatvia
Portugal
Sweden
MexicoNetherlandsNew ZealandNorway
Total
SlovakiaSouth AfricaSpain
Bulgaria
SwitzerlandThailand
RomaniaRussiaSaudi ArabiaSingapore
PeruPhilippinesPoland
¹ Spot transactions, outright forwards, foreign exchange swaps, currency swaps, options and other products. Data may differ slightly from national survey data owing to differences in aggregation procedures and rounding. ² Not adjusted for inter-dealer double-counting (ie “gross-gross” basis). ³ Adjusted for local inter-dealer double-counting (ie “net-gross” basis). Table E.10
Brazil
Net turnover³
EstoniaDenmark
Belgium
Czech Republic
ChinaChileCanada
74
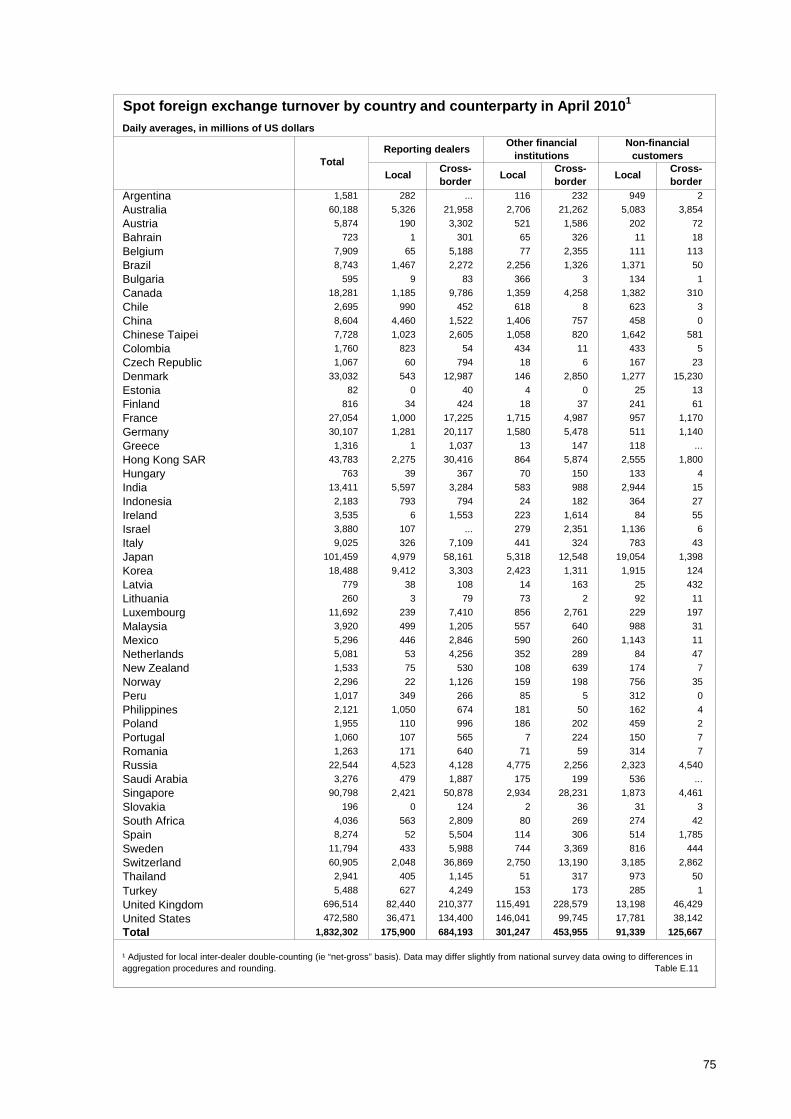
Spot foreign exchange turnover by country and counterparty in April 20101
Daily averages, in millions of US dollars
1,581 282 ... 116 232 949 2
60,188 5,326 21,958 2,706 21,262 5,083 3,854
5,874 190 3,302 521 1,586 202 72
723 1 301 65 326 11 18
7,909 65 5,188 77 2,355 111 113
8,743 1,467 2,272 2,256 1,326 1,371 50
595 9 83 366 3 134 1
18,281 1,185 9,786 1,359 4,258 1,382 310
2,695 990 452 618 8 623 3
8,604 4,460 1,522 1,406 757 458 0
7,728 1,023 2,605 1,058 820 1,642 581
1,760 823 54 434 11 433 5
1,067 60 794 18 6 167 23
33,032 543 12,987 146 2,850 1,277 15,230
82 0 40 4 0 25 13
816 34 424 18 37 241 61
27,054 1,000 17,225 1,715 4,987 957 1,170
30,107 1,281 20,117 1,580 5,478 511 1,140
1,316 1 1,037 13 147 118 ...
43,783 2,275 30,416 864 5,874 2,555 1,800
763 39 367 70 150 133 4
13,411 5,597 3,284 583 988 2,944 15
2,183 793 794 24 182 364 27
3,535 6 1,553 223 1,614 84 55
3,880 107 ... 279 2,351 1,136 6
9,025 326 7,109 441 324 783 43
101,459 4,979 58,161 5,318 12,548 19,054 1,398
18,488 9,412 3,303 2,423 1,311 1,915 124
779 38 108 14 163 25 432
260 3 79 73 2 92 11
11,692 239 7,410 856 2,761 229 197
3,920 499 1,205 557 640 988 31
5,296 446 2,846 590 260 1,143 11
5,081 53 4,256 352 289 84 47
1,533 75 530 108 639 174 7
2,296 22 1,126 159 198 756 35
1,017 349 266 85 5 312 0
2,121 1,050 674 181 50 162 4
1,955 110 996 186 202 459 2
1,060 107 565 7 224 150 7
1,263 171 640 71 59 314 7
22,544 4,523 4,128 4,775 2,256 2,323 4,540
3,276 479 1,887 175 199 536 ...
90,798 2,421 50,878 2,934 28,231 1,873 4,461
196 0 124 2 36 31 3
4,036 563 2,809 80 269 274 42
8,274 52 5,504 114 306 514 1,785
11,794 433 5,988 744 3,369 816 444
60,905 2,048 36,869 2,750 13,190 3,185 2,862
2,941 405 1,145 51 317 973 50
Turkey 5,488 627 4,249 153 173 285 1
United Kingdom 696,514 82,440 210,377 115,491 228,579 13,198 46,429
United States 472,580 36,471 134,400 146,041 99,745 17,781 38,142
1,832,302 175,900 684,193 301,247 453,955 91,339 125,667
Non-financial customers
LocalLocalCross-border
Cross-border
Other financial institutions
Total
TotalLocal
FinlandFrance
ColombiaChinese Taipei
EstoniaDenmark
Germany
Czech Republic
GreeceHong Kong SARHungaryIndiaIndonesiaIrelandIsrael
LithuaniaLuxembourgMalaysia
ItalyJapanKoreaLatvia
PolandPortugal
PeruPhilippines
MexicoNetherlandsNew ZealandNorway
South AfricaSpain
Slovakia
RomaniaRussiaSaudi ArabiaSingapore
Bulgaria
AustriaBahrain
Reporting dealers
ArgentinaAustralia
¹ Adjusted for local inter-dealer double-counting (ie “net-gross” basis). Data may differ slightly from national survey data owing to differences in aggregation procedures and rounding. Table E.11
BrazilBelgium
Cross-border
ChinaChileCanada
SwedenSwitzerlandThailand
75
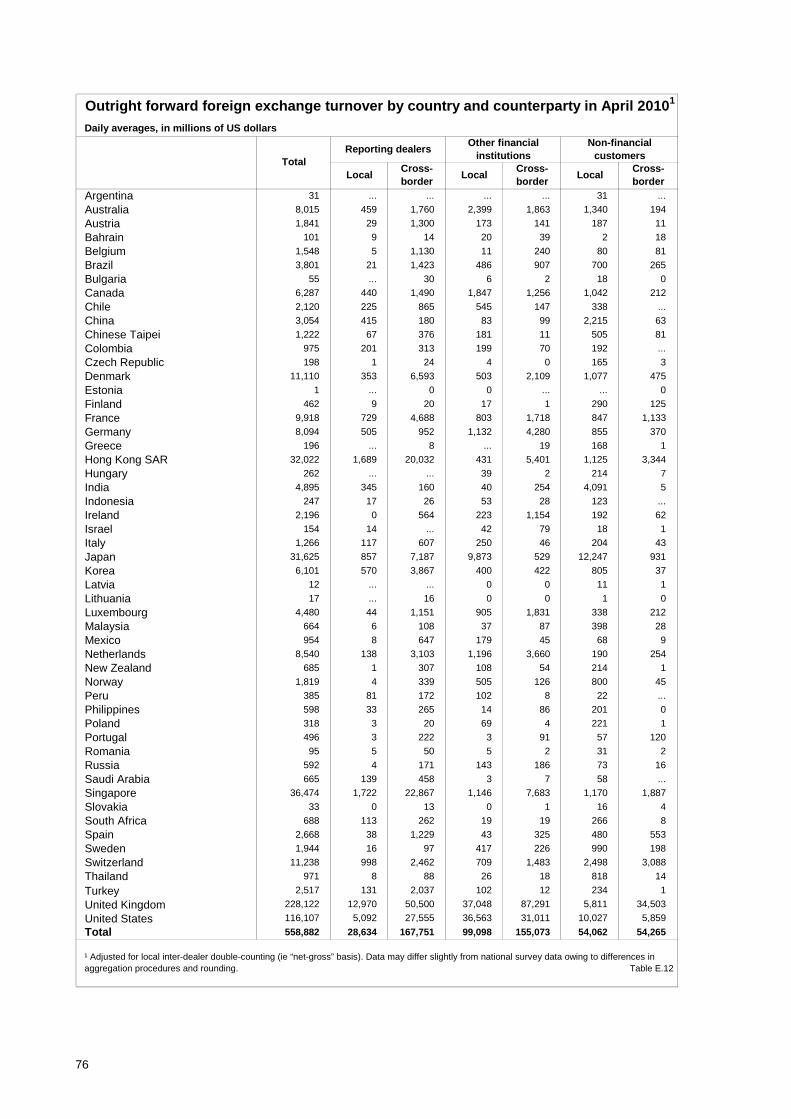
Outright forward foreign exchange turnover by country and counterparty in April 20101
Daily averages, in millions of US dollars
31 ... ... ... ... 31 ...
8,015 459 1,760 2,399 1,863 1,340 194
1,841 29 1,300 173 141 187 11
101 9 14 20 39 2 18
1,548 5 1,130 11 240 80 81
3,801 21 1,423 486 907 700 265
55 ... 30 6 2 18 0
6,287 440 1,490 1,847 1,256 1,042 212
2,120 225 865 545 147 338 ...
3,054 415 180 83 99 2,215 63
1,222 67 376 181 11 505 81
975 201 313 199 70 192 ...
198 1 24 4 0 165 3
11,110 353 6,593 503 2,109 1,077 475
1 ... 0 0 ... ... 0
462 9 20 17 1 290 125
9,918 729 4,688 803 1,718 847 1,133
8,094 505 952 1,132 4,280 855 370
196 ... 8 ... 19 168 1
32,022 1,689 20,032 431 5,401 1,125 3,344
262 ... ... 39 2 214 7
4,895 345 160 40 254 4,091 5
247 17 26 53 28 123 ...
2,196 0 564 223 1,154 192 62
154 14 ... 42 79 18 1
1,266 117 607 250 46 204 43
31,625 857 7,187 9,873 529 12,247 931
6,101 570 3,867 400 422 805 37
12 ... ... 0 0 11 1
17 ... 16 0 0 1 0
4,480 44 1,151 905 1,831 338 212
664 6 108 37 87 398 28
954 8 647 179 45 68 9
8,540 138 3,103 1,196 3,660 190 254
685 1 307 108 54 214 1
1,819 4 339 505 126 800 45
385 81 172 102 8 22 ...
598 33 265 14 86 201 0
318 3 20 69 4 221 1
496 3 222 3 91 57 120
95 5 50 5 2 31 2
592 4 171 143 186 73 16
665 139 458 3 7 58 ...
36,474 1,722 22,867 1,146 7,683 1,170 1,887
33 0 13 0 1 16 4
688 113 262 19 19 266 8
2,668 38 1,229 43 325 480 553
1,944 16 97 417 226 990 198
11,238 998 2,462 709 1,483 2,498 3,088
971 8 88 26 18 818 14
Turkey 2,517 131 2,037 102 12 234 1
United Kingdom 228,122 12,970 50,500 37,048 87,291 5,811 34,503
United States 116,107 5,092 27,555 36,563 31,011 10,027 5,859
558,882 28,634 167,751 99,098 155,073 54,062 54,265
¹ Adjusted for local inter-dealer double-counting (ie “net-gross” basis). Data may differ slightly from national survey data owing to differences in aggregation procedures and rounding. Table E.12
Non-financial customers
LocalLocalCross-border
Cross-border
Other financial institutions
TotalLocal
Cross-border
Reporting dealers
ArgentinaAustraliaAustriaBahrain
FinlandFrance
ColombiaChinese Taipei
GermanyGreeceHong Kong SARHungaryIndiaIndonesiaIrelandIsrael
LithuaniaLuxembourgMalaysia
ItalyJapanKoreaLatvia
Switzerland
MexicoNetherlandsNew ZealandNorway
RomaniaRussiaSaudi ArabiaSingapore
Thailand
PeruPhilippines
Total
SlovakiaSouth AfricaSpain
PolandPortugal
Sweden
Brazil
EstoniaDenmark
Belgium
Czech Republic
ChinaChileCanadaBulgaria
76
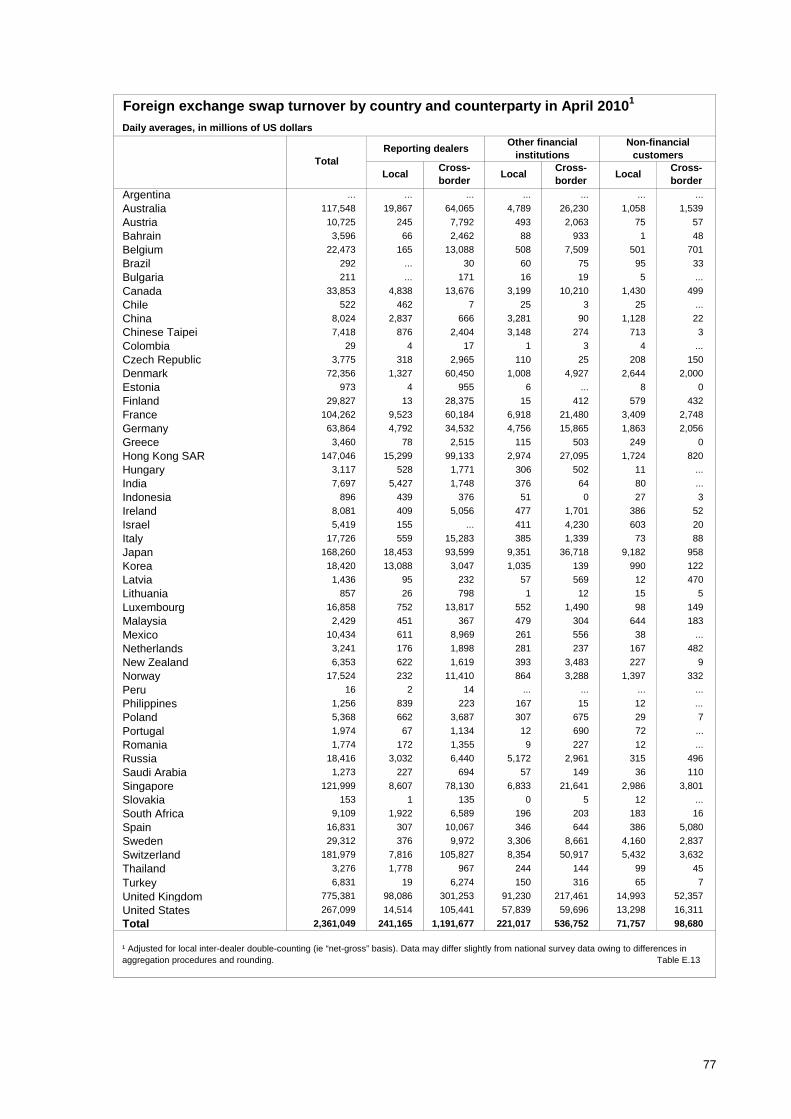
Foreign exchange swap turnover by country and counterparty in April 20101
Daily averages, in millions of US dollars
... ... ... ... ... ... ...
117,548 19,867 64,065 4,789 26,230 1,058 1,539
10,725 245 7,792 493 2,063 75 57
3,596 66 2,462 88 933 1 48
22,473 165 13,088 508 7,509 501 701
292 ... 30 60 75 95 33
211 ... 171 16 19 5 ...
33,853 4,838 13,676 3,199 10,210 1,430 499
522 462 7 25 3 25 ...
8,024 2,837 666 3,281 90 1,128 22
7,418 876 2,404 3,148 274 713 3
29 4 17 1 3 4 ...
3,775 318 2,965 110 25 208 150
72,356 1,327 60,450 1,008 4,927 2,644 2,000
973 4 955 6 ... 8 0
29,827 13 28,375 15 412 579 432
104,262 9,523 60,184 6,918 21,480 3,409 2,748
63,864 4,792 34,532 4,756 15,865 1,863 2,056
3,460 78 2,515 115 503 249 0
147,046 15,299 99,133 2,974 27,095 1,724 820
3,117 528 1,771 306 502 11 ...
7,697 5,427 1,748 376 64 80 ...
896 439 376 51 0 27 3
8,081 409 5,056 477 1,701 386 52
5,419 155 ... 411 4,230 603 20
17,726 559 15,283 385 1,339 73 88
168,260 18,453 93,599 9,351 36,718 9,182 958
18,420 13,088 3,047 1,035 139 990 122
1,436 95 232 57 569 12 470
857 26 798 1 12 15 5
16,858 752 13,817 552 1,490 98 149
2,429 451 367 479 304 644 183
10,434 611 8,969 261 556 38 ...
3,241 176 1,898 281 237 167 482
6,353 622 1,619 393 3,483 227 9
17,524 232 11,410 864 3,288 1,397 332
16 2 14 ... ... ... ...
1,256 839 223 167 15 12 ...
5,368 662 3,687 307 675 29 7
1,974 67 1,134 12 690 72 ...
1,774 172 1,355 9 227 12 ...
18,416 3,032 6,440 5,172 2,961 315 496
1,273 227 694 57 149 36 110
121,999 8,607 78,130 6,833 21,641 2,986 3,801
153 1 135 0 5 12 ...
9,109 1,922 6,589 196 203 183 16
16,831 307 10,067 346 644 386 5,080
29,312 376 9,972 3,306 8,661 4,160 2,837
181,979 7,816 105,827 8,354 50,917 5,432 3,632
3,276 1,778 967 244 144 99 45
Turkey 6,831 19 6,274 150 316 65 7
United Kingdom 775,381 98,086 301,253 91,230 217,461 14,993 52,357
United States 267,099 14,514 105,441 57,839 59,696 13,298 16,311
2,361,049 241,165 1,191,677 221,017 536,752 71,757 98,680
Non-financial customers
LocalLocalCross-border
Cross-border
Other financial institutions
TotalLocal
Cross-border
Reporting dealers
ArgentinaAustraliaAustriaBahrain
FinlandFrance
ColombiaChinese Taipei
GermanyGreeceHong Kong SARHungaryIndiaIndonesiaIrelandIsrael
LithuaniaLuxembourgMalaysia
ItalyJapanKoreaLatvia
MexicoNetherlandsNew ZealandNorwayPeruPhilippines
Total
SlovakiaSouth AfricaSpain
PolandPortugal
SwedenSwitzerlandThailand
RomaniaRussiaSaudi ArabiaSingapore
ChinaChileCanadaBulgaria
¹ Adjusted for local inter-dealer double-counting (ie “net-gross” basis). Data may differ slightly from national survey data owing to differences in aggregation procedures and rounding. Table E.13
Brazil
EstoniaDenmark
Belgium
Czech Republic
77
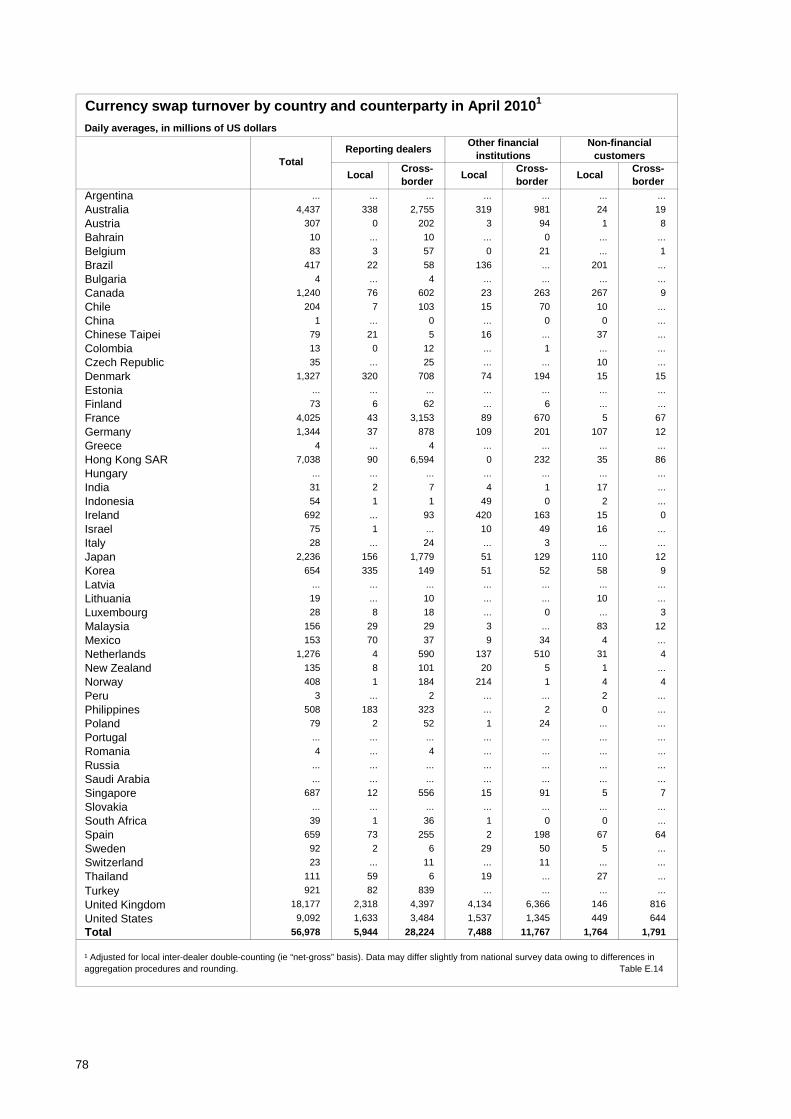
Currency swap turnover by country and counterparty in April 20101
Daily averages, in millions of US dollars
... ... ... ... ... ... ...
4,437 338 2,755 319 981 24 19
307 0 202 3 94 1 8
10 ... 10 ... 0 ... ...
83 3 57 0 21 ... 1
417 22 58 136 ... 201 ...
4 ... 4 ... ... ... ...
1,240 76 602 23 263 267 9
204 7 103 15 70 10 ...
1 ... 0 ... 0 0 ...
79 21 5 16 ... 37 ...
13 0 12 ... 1 ... ...
35 ... 25 ... ... 10 ...
1,327 320 708 74 194 15 15
... ... ... ... ... ... ...
73 6 62 ... 6 ... ...
4,025 43 3,153 89 670 5 67
1,344 37 878 109 201 107 12
4 ... 4 ... ... ... ...
7,038 90 6,594 0 232 35 86
... ... ... ... ... ... ...
31 2 7 4 1 17 ...
54 1 1 49 0 2 ...
692 ... 93 420 163 15 0
75 1 ... 10 49 16 ...
28 ... 24 ... 3 ... ...
2,236 156 1,779 51 129 110 12
654 335 149 51 52 58 9
... ... ... ... ... ... ...
19 ... 10 ... ... 10 ...
28 8 18 ... 0 ... 3
156 29 29 3 ... 83 12
153 70 37 9 34 4 ...
1,276 4 590 137 510 31 4
135 8 101 20 5 1 ...
408 1 184 214 1 4 4
3 ... 2 ... ... 2 ...
508 183 323 ... 2 0 ...
79 2 52 1 24 ... ...
... ... ... ... ... ... ...
4 ... 4 ... ... ... ...
... ... ... ... ... ... ...
... ... ... ... ... ... ...
687 12 556 15 91 5 7
... ... ... ... ... ... ...
39 1 36 1 0 0 ...
659 73 255 2 198 67 64
92 2 6 29 50 5 ...
23 ... 11 ... 11 ... ...
111 59 6 19 ... 27 ...
Turkey 921 82 839 ... ... ... ...
United Kingdom 18,177 2,318 4,397 4,134 6,366 146 816
United States 9,092 1,633 3,484 1,537 1,345 449 644
56,978 5,944 28,224 7,488 11,767 1,764 1,791
¹ Adjusted for local inter-dealer double-counting (ie “net-gross” basis). Data may differ slightly from national survey data owing to differences in aggregation procedures and rounding. Table E.14
Brazil
EstoniaDenmark
Belgium
Czech Republic
ChinaChileCanadaBulgaria
Thailand
RomaniaRussiaSaudi ArabiaSingapore
PeruPhilippines
Total
SlovakiaSouth AfricaSpain
PolandPortugal
SwedenSwitzerland
MexicoNetherlandsNew ZealandNorway
LithuaniaLuxembourgMalaysia
ItalyJapanKoreaLatvia
IndiaIndonesiaIrelandIsrael
GermanyGreeceHong Kong SARHungary
FinlandFrance
ColombiaChinese Taipei
ArgentinaAustraliaAustriaBahrain
TotalLocal
Cross-border
Reporting dealersNon-financial
customers
LocalLocalCross-border
Cross-border
Other financial institutions
78
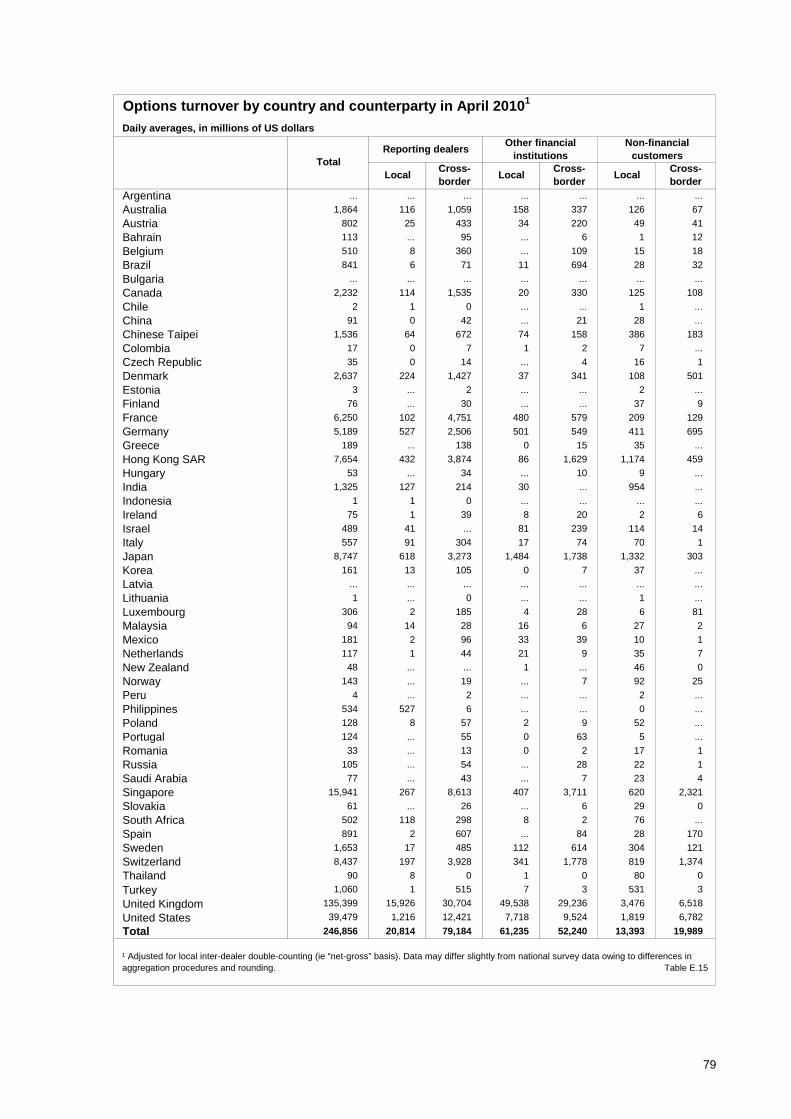
Options turnover by country and counterparty in April 20101
Daily averages, in millions of US dollars
... ... ... ... ... ... ...
1,864 116 1,059 158 337 126 67
802 25 433 34 220 49 41
113 ... 95 ... 6 1 12
510 8 360 ... 109 15 18
841 6 71 11 694 28 32
... ... ... ... ... ... ...
2,232 114 1,535 20 330 125 108
2 1 0 ... ... 1 ...
91 0 42 ... 21 28 ...
1,536 64 672 74 158 386 183
17 0 7 1 2 7 ...
35 0 14 ... 4 16 1
2,637 224 1,427 37 341 108 501
3 ... 2 ... ... 2 ...
76 ... 30 ... ... 37 9
6,250 102 4,751 480 579 209 129
5,189 527 2,506 501 549 411 695
189 ... 138 0 15 35 ...
7,654 432 3,874 86 1,629 1,174 459
53 ... 34 ... 10 9 ...
1,325 127 214 30 ... 954 ...
1 1 0 ... ... ... ...
75 1 39 8 20 2 6
489 41 ... 81 239 114 14
557 91 304 17 74 70 1
8,747 618 3,273 1,484 1,738 1,332 303
161 13 105 0 7 37 ...
... ... ... ... ... ... ...
1 ... 0 ... ... 1 ...
306 2 185 4 28 6 81
94 14 28 16 6 27 2
181 2 96 33 39 10 1
117 1 44 21 9 35 7
48 ... ... 1 ... 46 0
143 ... 19 ... 7 92 25
4 ... 2 ... ... 2 ...
534 527 6 ... ... 0 ...
128 8 57 2 9 52 ...
124 ... 55 0 63 5 ...
33 ... 13 0 2 17 1
105 ... 54 ... 28 22 1
77 ... 43 ... 7 23 4
15,941 267 8,613 407 3,711 620 2,321
61 ... 26 ... 6 29 0
502 118 298 8 2 76 ...
891 2 607 ... 84 28 170
1,653 17 485 112 614 304 121
8,437 197 3,928 341 1,778 819 1,374
90 8 0 1 0 80 0
Turkey 1,060 1 515 7 3 531 3
United Kingdom 135,399 15,926 30,704 49,538 29,236 3,476 6,518
United States 39,479 1,216 12,421 7,718 9,524 1,819 6,782
246,856 20,814 79,184 61,235 52,240 13,393 19,989
Non-financial customers
LocalLocalCross-border
Cross-border
Other financial institutions
TotalLocal
Cross-border
Reporting dealers
ArgentinaAustraliaAustriaBahrain
FinlandFrance
ColombiaChinese Taipei
GermanyGreeceHong Kong SARHungaryIndiaIndonesiaIrelandIsrael
LithuaniaLuxembourgMalaysia
ItalyJapanKoreaLatvia
MexicoNetherlandsNew ZealandNorwayPeruPhilippines
Total
SlovakiaSouth AfricaSpain
PolandPortugal
SwedenSwitzerlandThailand
RomaniaRussiaSaudi ArabiaSingapore
ChinaChileCanadaBulgaria
¹ Adjusted for local inter-dealer double-counting (ie “net-gross” basis). Data may differ slightly from national survey data owing to differences in aggregation procedures and rounding. Table E.15
Brazil
EstoniaDenmark
Belgium
Czech Republic
79
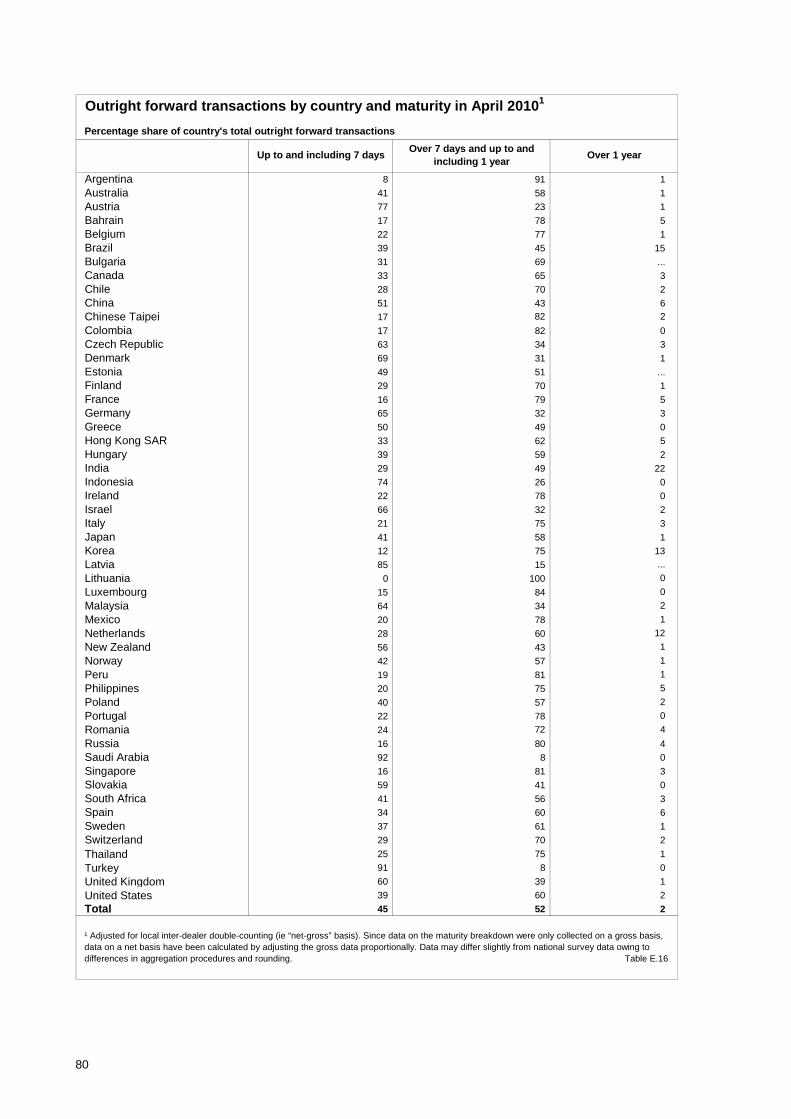
Outright forward transactions by country and maturity in April 20101
Percentage share of country's total outright forward transactions
8 91 1
41 58 1
77 23 1
17 78 5
22 77 1
39 45 15
31 69 ...
33 65 3
28 70 2
51 43 6
17 82 2
17 82 0
63 34 3
69 31 1
49 51 ...
29 70 1
16 79 5
65 32 3
50 49 0
33 62 5
39 59 2
29 49 22
74 26 0
22 78 0
66 32 2
21 75 3
41 58 1
12 75 13
85 15 ...
0 100 0
15 84 0
64 34 2
20 78 1
28 60 12
56 43 1
42 57 1
19 81 1
20 75 5
40 57 2
22 78 0
24 72 4
16 80 4
92 8 0
16 81 3
59 41 0
41 56 3
34 60 6
37 61 1
29 70 2
Thailand 25 75 1
Turkey 91 8 0
United Kingdom 60 39 1
United States 39 60 2
45 52 2
RomaniaRussiaSaudi ArabiaSingapore
PeruPhilippines
Total
SlovakiaSouth AfricaSpain
PolandPortugal
SwedenSwitzerland
MexicoNetherlandsNew ZealandNorway
Israel
LithuaniaLuxembourgMalaysia
ItalyJapanKoreaLatvia
HungaryIndiaIndonesiaIreland
GermanyGreeceHong Kong SAR
Bulgaria
Czech Republic
ChinaChileCanada
France
Bahrain
Finland
ColombiaChinese Taipei
Brazil
EstoniaDenmark
Belgium
¹ Adjusted for local inter-dealer double-counting (ie “net-gross” basis). Since data on the maturity breakdown were only collected on a gross basis, data on a net basis have been calculated by adjusting the gross data proportionally. Data may differ slightly from national survey data owing to differences in aggregation procedures and rounding. Table E.16
Over 7 days and up to and including 1 year
Over 1 yearUp to and including 7 days
ArgentinaAustraliaAustria
80
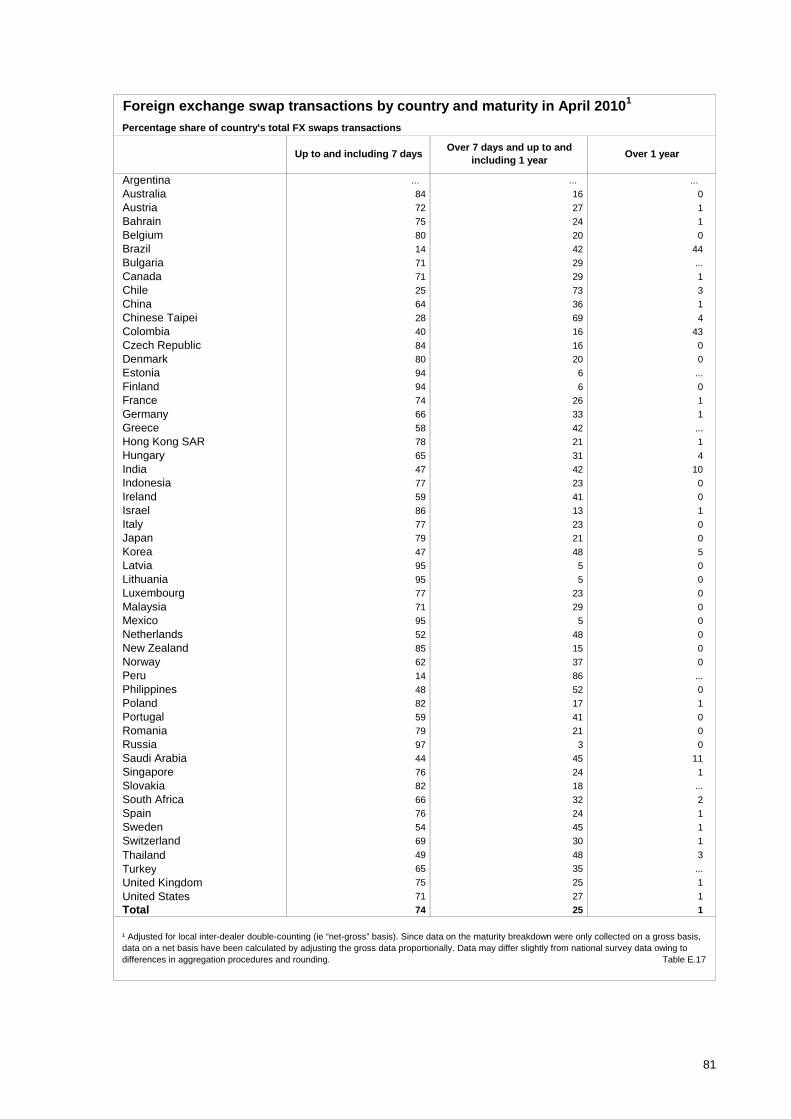
Foreign exchange swap transactions by country and maturity in April 20101
Percentage share of country's total FX swaps transactions
... ... ...
84 16 0
72 27 1
75 24 1
80 20 0
14 42 44
71 29 ...
71 29 1
25 73 3
64 36 1
28 69 4
40 16 43
84 16 0
80 20 0
94 6 ...
94 6 0
74 26 1
66 33 1
58 42 ...
78 21 1
65 31 4
47 42 10
77 23 0
59 41 0
86 13 1
77 23 0
79 21 0
47 48 5
95 5 0
95 5 0
77 23 0
71 29 0
95 5 0
52 48 0
85 15 0
62 37 0
14 86 ...
48 52 0
82 17 1
59 41 0
79 21 0
97 3 0
44 45 11
76 24 1
82 18 ...
66 32 2
76 24 1
54 45 1
69 30 1
Thailand 49 48 3
Turkey 65 35 ...
United Kingdom 75 25 1
United States 71 27 1
74 25 1
¹ Adjusted for local inter-dealer double-counting (ie “net-gross” basis). Since data on the maturity breakdown were only collected on a gross basis, data on a net basis have been calculated by adjusting the gross data proportionally. Data may differ slightly from national survey data owing to differences in aggregation procedures and rounding. Table E.17
Over 7 days and up to and including 1 year
Over 1 yearUp to and including 7 days
ArgentinaAustraliaAustriaBahrain
Finland
ColombiaChinese Taipei
Brazil
EstoniaDenmark
Belgium
GermanyGreeceHong Kong SAR
Bulgaria
Czech Republic
ChinaChileCanada
France
HungaryIndiaIndonesiaIrelandIsrael
LithuaniaLuxembourgMalaysia
ItalyJapanKoreaLatvia
MexicoNetherlandsNew ZealandNorwayPeruPhilippines
Total
SlovakiaSouth AfricaSpain
PolandPortugal
SwedenSwitzerland
RomaniaRussiaSaudi ArabiaSingapore
81
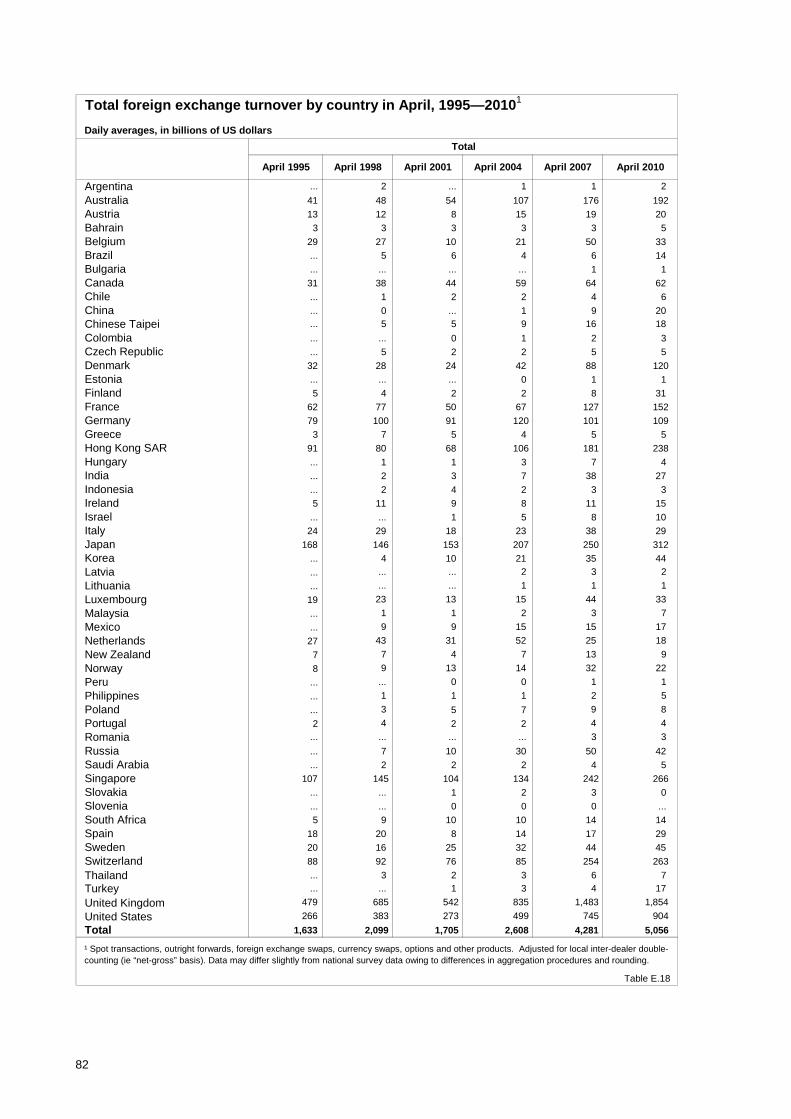
Total foreign exchange turnover by country in April, 1995—20101
Daily averages, in billions of US dollars
... 2 ... 1 1 2
41 48 54 107 176 192
13 12 8 15 19 20
3 3 3 3 3 5
29 27 10 21 50 33
... 5 6 4 6 14
... ... ... ... 1 1
31 38 44 59 64 62
... 1 2 2 4 6
... 0 ... 1 9 20 ... 5 5 9 16 18
... ... 0 1 2 3
... 5 2 2 5 5
32 28 24 42 88 120
... ... ... 0 1 1
5 4 2 2 8 31
62 77 50 67 127 152
79 100 91 120 101 109
3 7 5 4 5 5
91 80 68 106 181 238
... 1 1 3 7 4
... 2 3 7 38 27
... 2 4 2 3 3
5 11 9 8 11 15
... ... 1 5 8 10
24 29 18 23 38 29
168 146 153 207 250 312
... 4 10 21 35 44
... ... ... 2 3 2
... ... ... 1 1 1
19 23 13 15 44 33
... 1 1 2 3 7
... 9 9 15 15 17
27 43 31 52 25 18
7 7 4 7 13 9
8 9 13 14 32 22
... ... 0 0 1 1
... 1 1 1 2 5
... 3 5 7 9 8
2 4 2 2 4 4
... ... ... ... 3 3
... 7 10 30 50 42
... 2 2 2 4 5
107 145 104 134 242 266
... ... 1 2 3 0
... ... 0 0 0 ...
5 9 10 10 14 14
18 20 8 14 17 29
20 16 25 32 44 45
88 92 76 85 254 263
Thailand ... 3 2 3 6 7 ... ... 1 3 4 17
United Kingdom 479 685 542 835 1,483 1,854
United States 266 383 273 499 745 904
1,633 2,099 1,705 2,608 4,281 5,056
Table E.18
ChileCanada
April 1995
Colombia
Belgium
Bulgaria
Total
April 2001 April 2007
Chinese Taipei
ArgentinaAustraliaAustria
April 2004
Bahrain
April 2010April 1998
Hong Kong SAR
Brazil
EstoniaDenmarkCzech Republic
China
FranceGermanyGreece
Finland
HungaryIndiaIndonesiaIrelandIsrael
LithuaniaLuxembourgMalaysia
ItalyJapanKoreaLatvia
MexicoNetherlandsNew ZealandNorwayPeruPhilippines
Total
SloveniaSouth AfricaSpain
PolandPortugal
Sweden
Slovakia
¹ Spot transactions, outright forwards, foreign exchange swaps, currency swaps, options and other products. Adjusted for local inter-dealer double-counting (ie “net-gross” basis). Data may differ slightly from national survey data owing to differences in aggregation procedures and rounding.
Switzerland
Turkey
RomaniaRussiaSaudi ArabiaSingapore
82
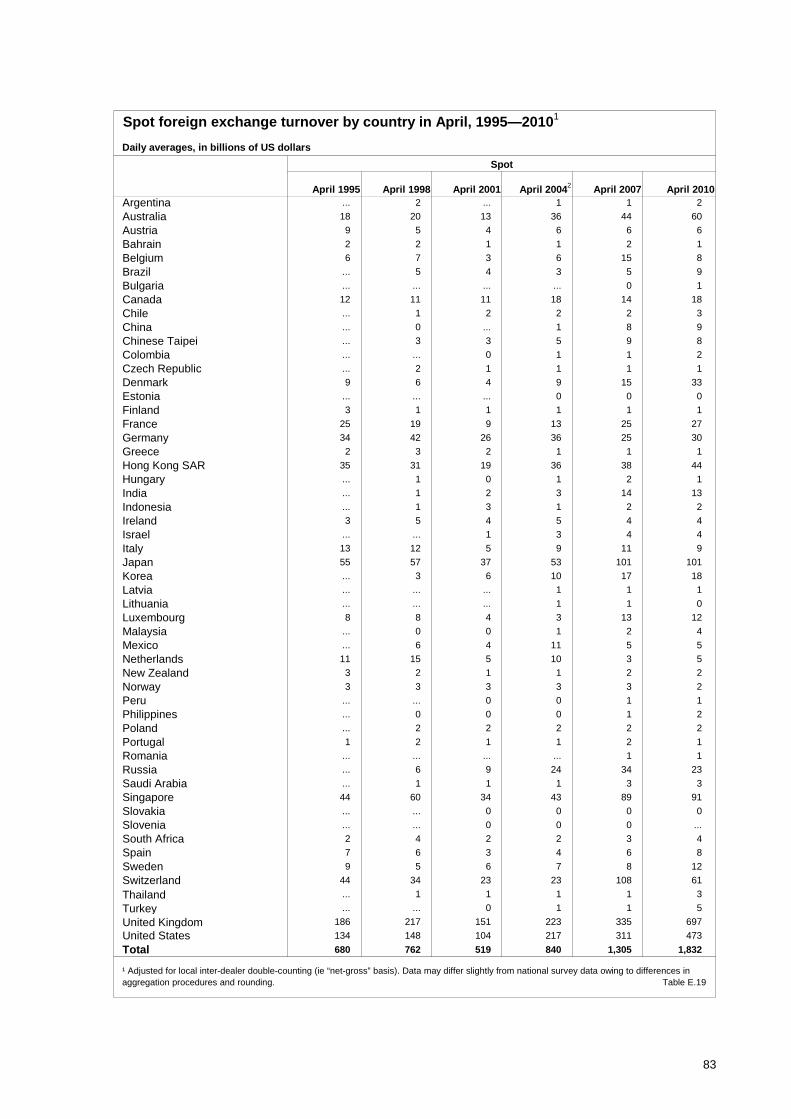
Spot foreign exchange turnover by country in April, 1995—20101
Daily averages, in billions of US dollars
... 2 ... 1 1 2
18 20 13 36 44 60
9 5 4 6 6 6
2 2 1 1 2 1
6 7 3 6 15 8
... 5 4 3 5 9
... ... ... ... 0 1
12 11 11 18 14 18
... 1 2 2 2 3
... 0 ... 1 8 9
... 3 3 5 9 8
... ... 0 1 1 2
... 2 1 1 1 1
9 6 4 9 15 33
... ... ... 0 0 0
3 1 1 1 1 1
25 19 9 13 25 27
34 42 26 36 25 30
2 3 2 1 1 1
35 31 19 36 38 44
... 1 0 1 2 1
... 1 2 3 14 13
... 1 3 1 2 2
3 5 4 5 4 4
... ... 1 3 4 4
13 12 5 9 11 9
55 57 37 53 101 101
... 3 6 10 17 18
... ... ... 1 1 1
... ... ... 1 1 0
8 8 4 3 13 12
... 0 0 1 2 4
... 6 4 11 5 5
11 15 5 10 3 5
3 2 1 1 2 2
3 3 3 3 3 2
... ... 0 0 1 1
... 0 0 0 1 2
... 2 2 2 2 2
1 2 1 1 2 1
... ... ... ... 1 1
... 6 9 24 34 23
... 1 1 1 3 3
44 60 34 43 89 91
... ... 0 0 0 0
... ... 0 0 0 ...
2 4 2 2 3 4
7 6 3 4 6 8
9 5 6 7 8 12
44 34 23 23 108 61
Thailand ... 1 1 1 1 3
Turkey ... ... 0 1 1 5
United Kingdom 186 217 151 223 335 697
134 148 104 217 311 473
680 762 519 840 1,305 1,832
United States
RomaniaRussiaSaudi ArabiaSingaporeSlovakia
PeruPhilippines
Total
SloveniaSouth AfricaSpain
PolandPortugal
SwedenSwitzerland
MexicoNetherlandsNew ZealandNorway
LithuaniaLuxembourgMalaysia
ItalyJapanKoreaLatvia
IndiaIndonesiaIrelandIsrael
ChinaChinese Taipei
Chile
Germany
Belgium
CanadaBulgaria
April 20042
ArgentinaAustraliaAustriaBahrain
Brazil
Spot
April 1995 April 1998 April 2001 April 2010April 2007
¹ Adjusted for local inter-dealer double-counting (ie “net-gross” basis). Data may differ slightly from national survey data owing to differences in aggregation procedures and rounding. Table E.19
Colombia
FinlandFrance
Hong Kong SAR
EstoniaDenmarkCzech Republic
Greece
Hungary
83
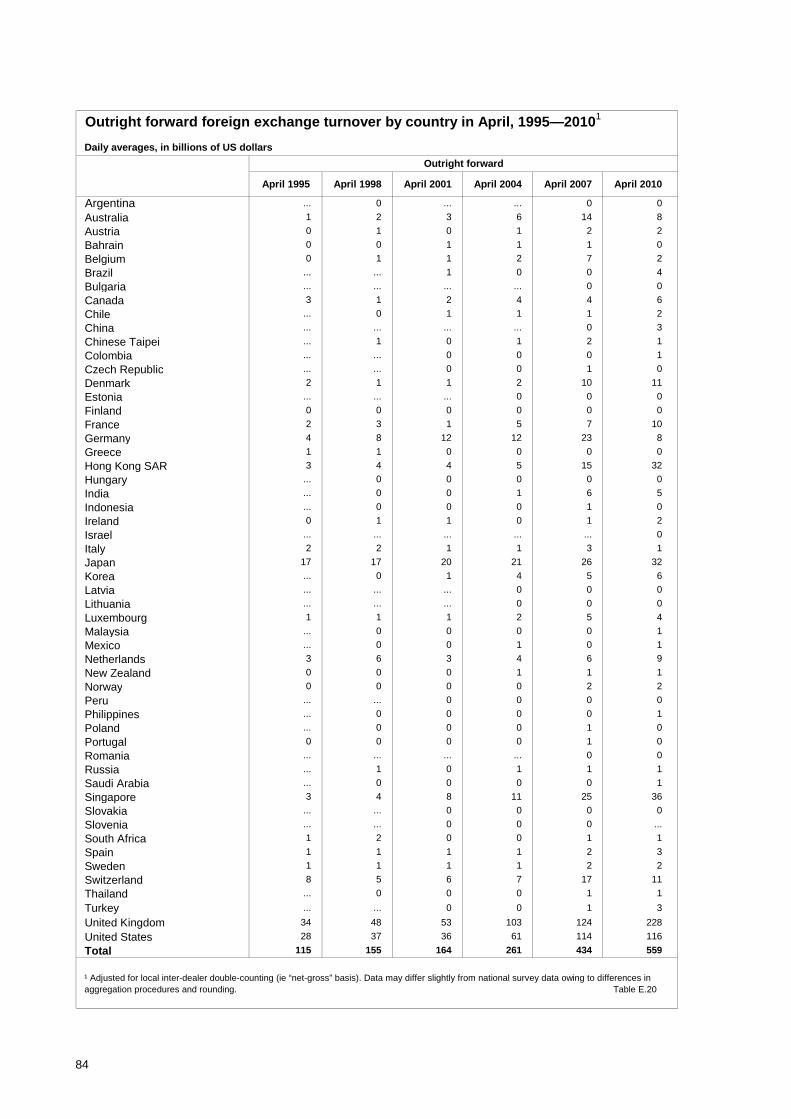
Outright forward foreign exchange turnover by country in April, 1995—20101
Daily averages, in billions of US dollars
Argentina ... 0 ... ... 0 0
Australia 1 2 3 6 14 8
Austria 0 1 0 1 2 2
Bahrain 0 0 1 1 1 0
Belgium 0 1 1 2 7 2
Brazil ... ... 1 0 0 4
Bulgaria ... ... ... ... 0 0
Canada 3 1 2 4 4 6
Chile ... 0 1 1 1 2
China ... ... ... ... 0 3
Chinese Taipei ... 1 0 1 2 1
Colombia ... ... 0 0 0 1
Czech Republic ... ... 0 0 1 0
Denmark 2 1 1 2 10 11
Estonia ... ... ... 0 0 0
Finland 0 0 0 0 0 0
France 2 3 1 5 7 10
Germany 4 8 12 12 23 8
Greece 1 1 0 0 0 0
Hong Kong SAR 3 4 4 5 15 32
Hungary ... 0 0 0 0 0
India ... 0 0 1 6 5
Indonesia ... 0 0 0 1 0
Ireland 0 1 1 0 1 2
Israel ... ... ... ... ... 0
Italy 2 2 1 1 3 1
Japan 17 17 20 21 26 32
Korea ... 0 1 4 5 6
Latvia ... ... ... 0 0 0
Lithuania ... ... ... 0 0 0
Luxembourg 1 1 1 2 5 4
Malaysia ... 0 0 0 0 1
Mexico ... 0 0 1 0 1
Netherlands 3 6 3 4 6 9
New Zealand 0 0 0 1 1 1
Norway 0 0 0 0 2 2
Peru ... ... 0 0 0 0
Philippines ... 0 0 0 0 1
Poland ... 0 0 0 1 0
Portugal 0 0 0 0 1 0
Romania ... ... ... ... 0 0
Russia ... 1 0 1 1 1
Saudi Arabia ... 0 0 0 0 1
Singapore 3 4 8 11 25 36
Slovakia ... ... 0 0 0 0
Slovenia ... ... 0 0 0 ...
South Africa 1 2 0 0 1 1
Spain 1 1 1 1 2 3
Sweden 1 1 1 1 2 2
Switzerland 8 5 6 7 17 11
Thailand ... 0 0 0 1 1
Turkey ... ... 0 0 1 3
United Kingdom 34 48 53 103 124 228
United States 28 37 36 61 114 116
Total 115 155 164 261 434 559
Outright forward
April 1995 April 1998 April 2001 April 2004 April 2007
¹ Adjusted for local inter-dealer double-counting (ie “net-gross” basis). Data may differ slightly from national survey data owing to differences in aggregation procedures and rounding. Table E.20
April 2010
84
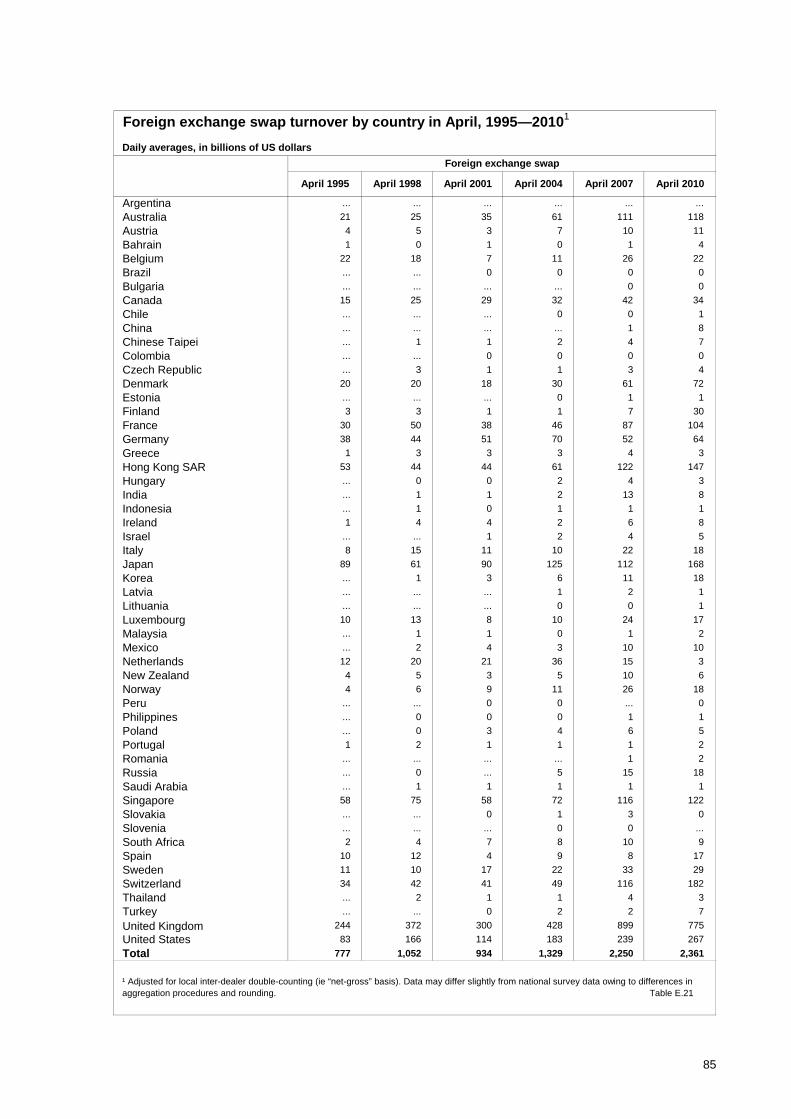
Foreign exchange swap turnover by country in April, 1995—20101
Daily averages, in billions of US dollars
... ... ... ... ... ...
21 25 35 61 111 118
4 5 3 7 10 11
1 0 1 0 1 4
22 18 7 11 26 22
... ... 0 0 0 0
... ... ... ... 0 0
15 25 29 32 42 34
... ... ... 0 0 1
... ... ... ... 1 8
... 1 1 2 4 7
... ... 0 0 0 0
... 3 1 1 3 4
20 20 18 30 61 72
... ... ... 0 1 1
3 3 1 1 7 30
30 50 38 46 87 104
38 44 51 70 52 64
1 3 3 3 4 3
53 44 44 61 122 147
... 0 0 2 4 3
... 1 1 2 13 8
... 1 0 1 1 1
1 4 4 2 6 8
... ... 1 2 4 5
8 15 11 10 22 18
89 61 90 125 112 168
... 1 3 6 11 18
... ... ... 1 2 1
... ... ... 0 0 1
10 13 8 10 24 17
... 1 1 0 1 2
... 2 4 3 10 10
12 20 21 36 15 3
4 5 3 5 10 6
4 6 9 11 26 18
... ... 0 0 ... 0
... 0 0 0 1 1
... 0 3 4 6 5
1 2 1 1 1 2
... ... ... ... 1 2
... 0 ... 5 15 18
... 1 1 1 1 1
58 75 58 72 116 122
... ... 0 1 3 0
... ... ... 0 0 ...
2 4 7 8 10 9
10 12 4 9 8 17
11 10 17 22 33 29
34 42 41 49 116 182
... 2 1 1 4 3
... ... 0 2 2 7
United Kingdom 244 372 300 428 899 775
83 166 114 183 239 267
777 1,052 934 1,329 2,250 2,361
Slovakia
April 2001April 1995
ArgentinaAustralia
April 1998
RussiaSaudi ArabiaSingapore
PeruPhilippinesPolandPortugalRomania
Total
SloveniaSouth AfricaSpainSwedenSwitzerland
United States
ThailandTurkey
MexicoNetherlandsNew ZealandNorway
Austria
LuxembourgMalaysia
ItalyJapanKoreaLatvia
ChileCanada
Finland
April 2004
Foreign exchange swap
April 2010
Hong Kong SAR
Brazil
EstoniaDenmark
Belgium
Czech Republic
China
Israel
Lithuania
IndiaIndonesiaIreland
April 2007
¹ Adjusted for local inter-dealer double-counting (ie “net-gross” basis). Data may differ slightly from national survey data owing to differences in aggregation procedures and rounding. Table E.21
Bahrain
Colombia
Bulgaria
Hungary
France
Chinese Taipei
GermanyGreece
85
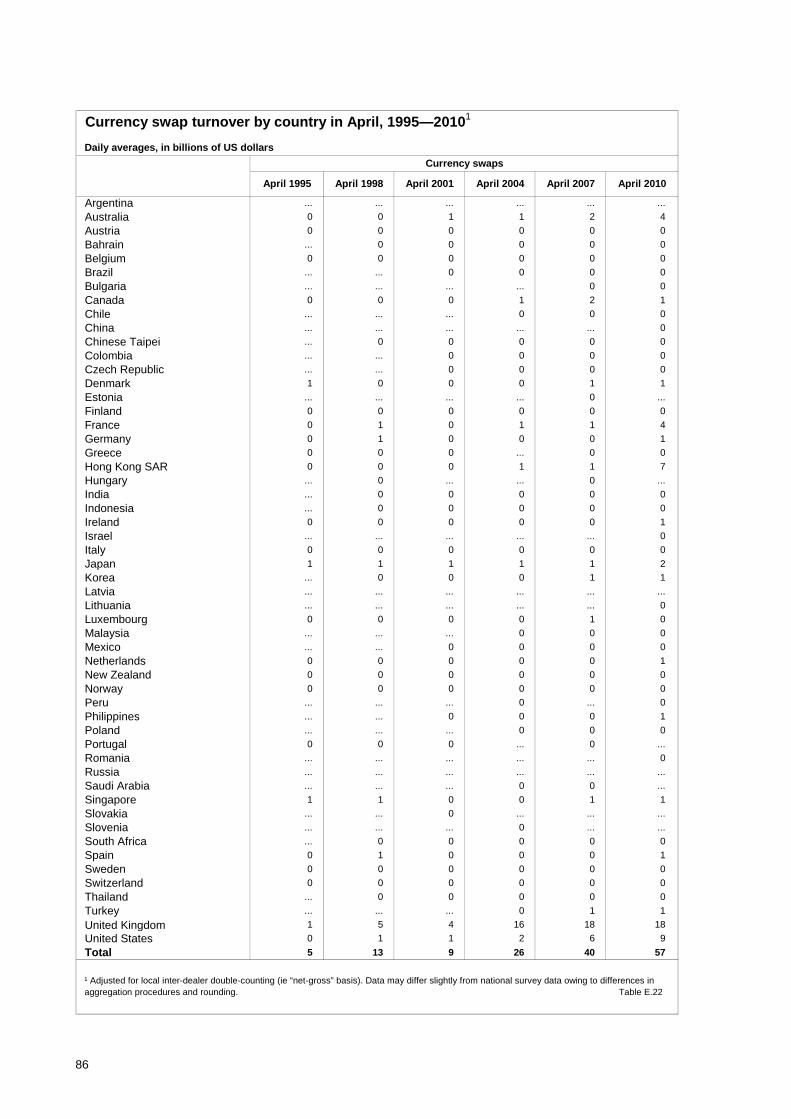
Currency swap turnover by country in April, 1995—20101
Daily averages, in billions of US dollars
... ... ... ... ... ...
0 0 1 1 2 4
0 0 0 0 0 0
... 0 0 0 0 0
0 0 0 0 0 0
... ... 0 0 0 0
... ... ... ... 0 0
0 0 0 1 2 1
... ... ... 0 0 0
... ... ... ... ... 0
... 0 0 0 0 0
... ... 0 0 0 0
... ... 0 0 0 0
1 0 0 0 1 1
... ... ... ... 0 ...
0 0 0 0 0 0
0 1 0 1 1 4
0 1 0 0 0 1
0 0 0 ... 0 0
0 0 0 1 1 7
... 0 ... ... 0 ...
... 0 0 0 0 0
... 0 0 0 0 0
0 0 0 0 0 1
... ... ... ... ... 0
0 0 0 0 0 0
1 1 1 1 1 2
... 0 0 0 1 1
... ... ... ... ... ...
... ... ... ... ... 0
0 0 0 0 1 0
... ... ... 0 0 0
... ... 0 0 0 0
0 0 0 0 0 1
0 0 0 0 0 0
0 0 0 0 0 0
... ... ... 0 ... 0
... ... 0 0 0 1
... ... ... 0 0 0
0 0 0 ... 0 ...
... ... ... ... ... 0
... ... ... ... ... ...
... ... ... 0 0 ...
1 1 0 0 1 1
... ... 0 ... ... ...
... ... ... 0 ... ...
... 0 0 0 0 0
0 1 0 0 0 1
0 0 0 0 0 0
0 0 0 0 0 0
... 0 0 0 0 0
... ... ... 0 1 1
United Kingdom 1 5 4 16 18 18
0 1 1 2 6 9
5 13 9 26 40 57
April 2007
¹ Adjusted for local inter-dealer double-counting (ie “net-gross” basis). Data may differ slightly from national survey data owing to differences in aggregation procedures and rounding. Table E.22
Bahrain
Colombia
Bulgaria
Hungary
France
Chinese Taipei
GermanyGreece
Israel
Lithuania
IndiaIndonesiaIreland
April 2004
Currency swaps
April 2010
Hong Kong SAR
Brazil
EstoniaDenmark
Belgium
Czech Republic
China
Austria
LuxembourgMalaysia
ItalyJapanKoreaLatvia
ChileCanada
Finland
MexicoNetherlandsNew ZealandNorway
Romania
Total
SloveniaSouth AfricaSpainSwedenSwitzerland
United States
ThailandTurkey
PeruPhilippinesPolandPortugal
Slovakia
April 2001April 1995
ArgentinaAustralia
April 1998
RussiaSaudi ArabiaSingapore
86
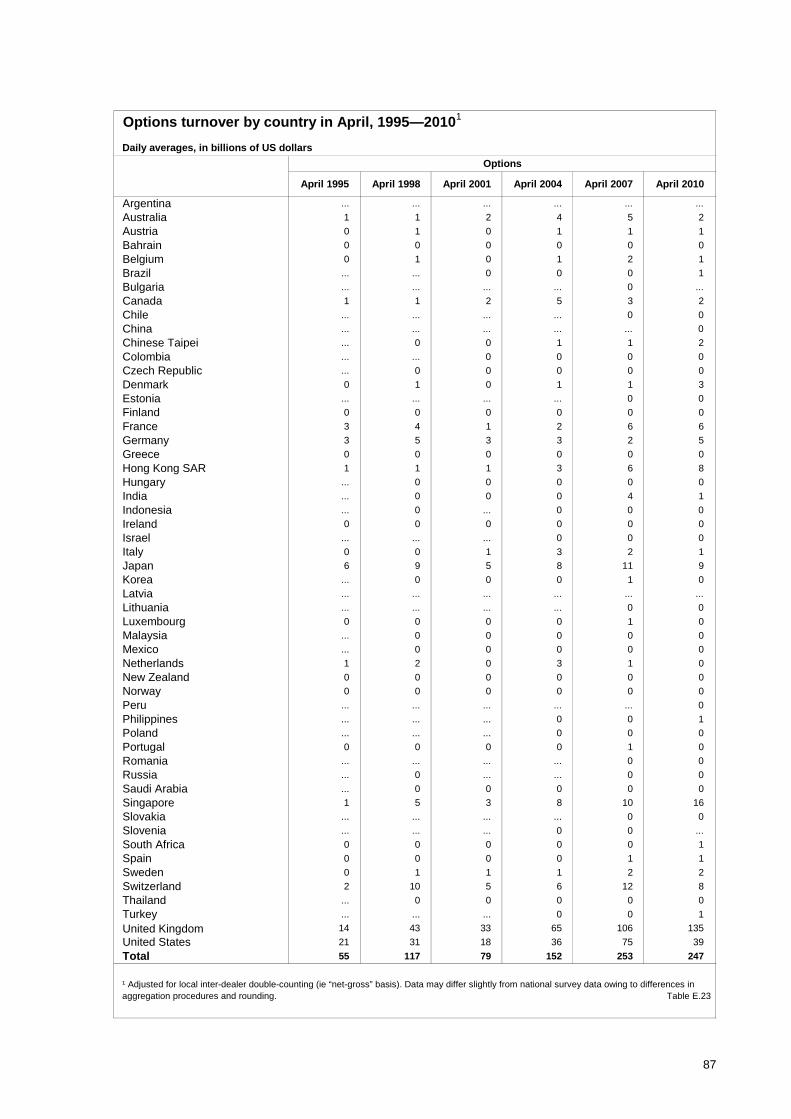
Options turnover by country in April, 1995—20101
Daily averages, in billions of US dollars
... ... ... ... ... ...
1 1 2 4 5 2
0 1 0 1 1 1
0 0 0 0 0 0
0 1 0 1 2 1
... ... 0 0 0 1
... ... ... ... 0 ...
1 1 2 5 3 2
... ... ... ... 0 0
... ... ... ... ... 0
... 0 0 1 1 2
... ... 0 0 0 0
... 0 0 0 0 0
0 1 0 1 1 3
... ... ... ... 0 0
0 0 0 0 0 0
3 4 1 2 6 6
3 5 3 3 2 5
0 0 0 0 0 0
1 1 1 3 6 8
... 0 0 0 0 0
... 0 0 0 4 1
... 0 ... 0 0 0
0 0 0 0 0 0
... ... ... 0 0 0
0 0 1 3 2 1
6 9 5 8 11 9
... 0 0 0 1 0
... ... ... ... ... ...
... ... ... ... 0 0
0 0 0 0 1 0
... 0 0 0 0 0
... 0 0 0 0 0
1 2 0 3 1 0
0 0 0 0 0 0
0 0 0 0 0 0
... ... ... ... ... 0
... ... ... 0 0 1
... ... ... 0 0 0
0 0 0 0 1 0
... ... ... ... 0 0
... 0 ... ... 0 0
... 0 0 0 0 0
1 5 3 8 10 16
... ... ... ... 0 0
... ... ... 0 0 ...
0 0 0 0 0 1
0 0 0 0 1 1
0 1 1 1 2 2
2 10 5 6 12 8
... 0 0 0 0 0
... ... ... 0 0 1
United Kingdom 14 43 33 65 106 135
21 31 18 36 75 39
55 117 79 152 253 247
Slovakia
April 2001April 1995
ArgentinaAustralia
April 1998
RussiaSaudi ArabiaSingapore
PeruPhilippinesPolandPortugalRomania
Total
SloveniaSouth AfricaSpainSwedenSwitzerland
United States
ThailandTurkey
MexicoNetherlandsNew ZealandNorway
Austria
LuxembourgMalaysia
ItalyJapanKoreaLatvia
ChileCanada
Finland
April 2004
Options
April 2010
Hong Kong SAR
Brazil
EstoniaDenmark
Belgium
Czech Republic
China
Israel
Lithuania
IndiaIndonesiaIreland
April 2007
¹ Adjusted for local inter-dealer double-counting (ie “net-gross” basis). Data may differ slightly from national survey data owing to differences in aggregation procedures and rounding. Table E.23
Bahrain
Colombia
Bulgaria
Hungary
France
Chinese Taipei
GermanyGreece
87
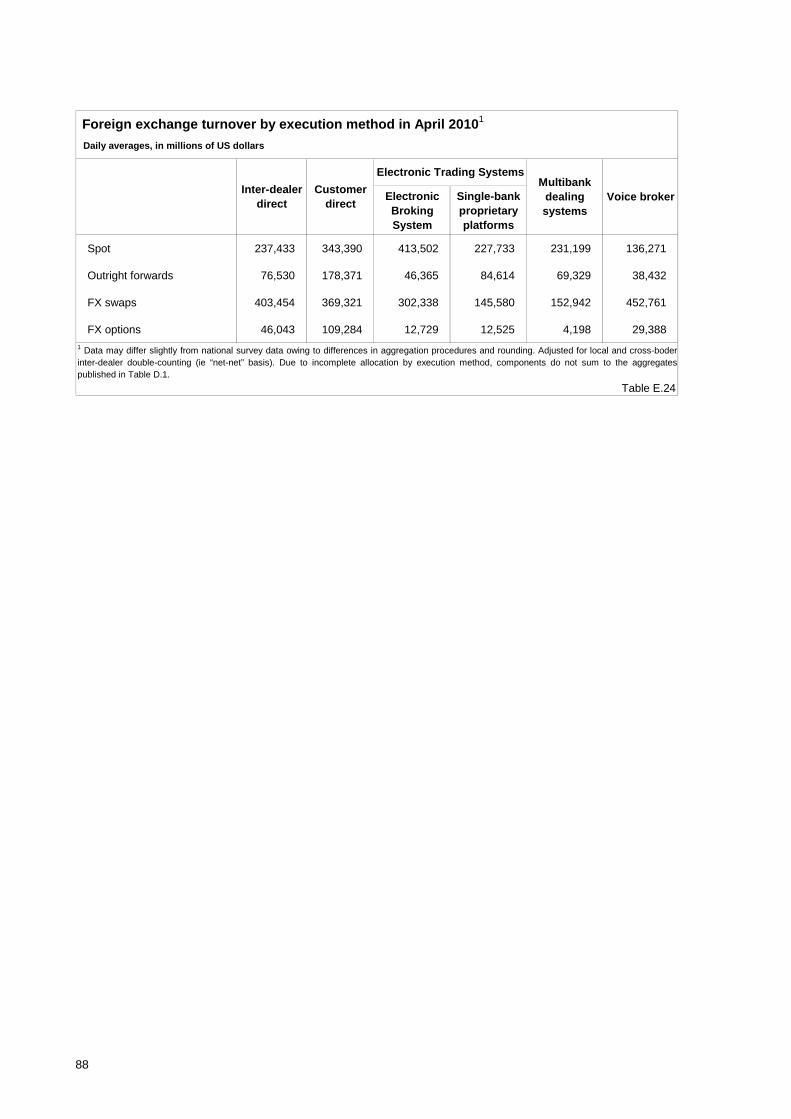
Electronic Broking System
Single-bank proprietary platforms
Spot 237,433 343,390 413,502 227,733 231,199 136,271
Outright forwards 76,530 178,371 46,365 84,614 69,329 38,432
FX swaps 403,454 369,321 302,338 145,580 152,942 452,761
FX options 46,043 109,284 12,729 12,525 4,198 29,388
Table E.24
Voice broker
Foreign exchange turnover by execution method in April 20101
Daily averages, in millions of US dollars
1 Data may differ slightly from national survey data owing to differences in aggregation procedures and rounding. Adjusted for local and cross-boderinter-dealer double-counting (ie “net-net” basis). Due to incomplete allocation by execution method, components do not sum to the aggregatespublished in Table D.1.
Electronic Trading Systems
Inter-dealer direct
Customer direct
Multibank dealing systems
88

2. Amounts outstanding at end-June 2010
89
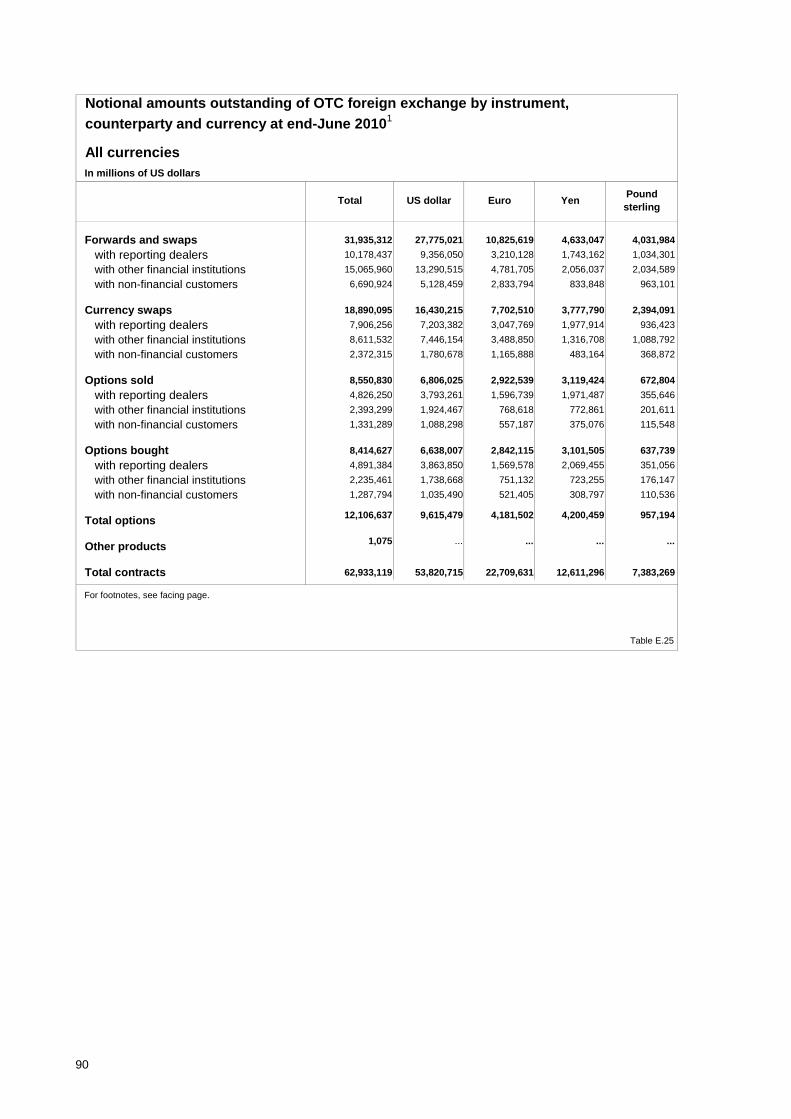
All currenciesIn millions of US dollars
Forwards and swaps 31,935,312 27,775,021 10,825,619 4,633,047 4,031,984
with reporting dealers 10,178,437 9,356,050 3,210,128 1,743,162 1,034,301
with other financial institutions 15,065,960 13,290,515 4,781,705 2,056,037 2,034,589
with non-financial customers 6,690,924 5,128,459 2,833,794 833,848 963,101
Currency swaps 18,890,095 16,430,215 7,702,510 3,777,790 2,394,091
with reporting dealers 7,906,256 7,203,382 3,047,769 1,977,914 936,423
with other financial institutions 8,611,532 7,446,154 3,488,850 1,316,708 1,088,792
with non-financial customers 2,372,315 1,780,678 1,165,888 483,164 368,872
Options sold 8,550,830 6,806,025 2,922,539 3,119,424 672,804
with reporting dealers 4,826,250 3,793,261 1,596,739 1,971,487 355,646
with other financial institutions 2,393,299 1,924,467 768,618 772,861 201,611
with non-financial customers 1,331,289 1,088,298 557,187 375,076 115,548
Options bought 8,414,627 6,638,007 2,842,115 3,101,505 637,739
with reporting dealers 4,891,384 3,863,850 1,569,578 2,069,455 351,056
with other financial institutions 2,235,461 1,738,668 751,132 723,255 176,147
with non-financial customers 1,287,794 1,035,490 521,405 308,797 110,536
Total options 12,106,637 9,615,479 4,181,502 4,200,459 957,194
Other products 1,075 ... ... ... ...
Total contracts 62,933,119 53,820,715 22,709,631 12,611,296 7,383,269
Table E.25
For footnotes, see facing page.
Pound sterling
Total US dollar
Notional amounts outstanding of OTC foreign exchange by instrument,
counterparty and currency at end-June 20101
Euro Yen
90
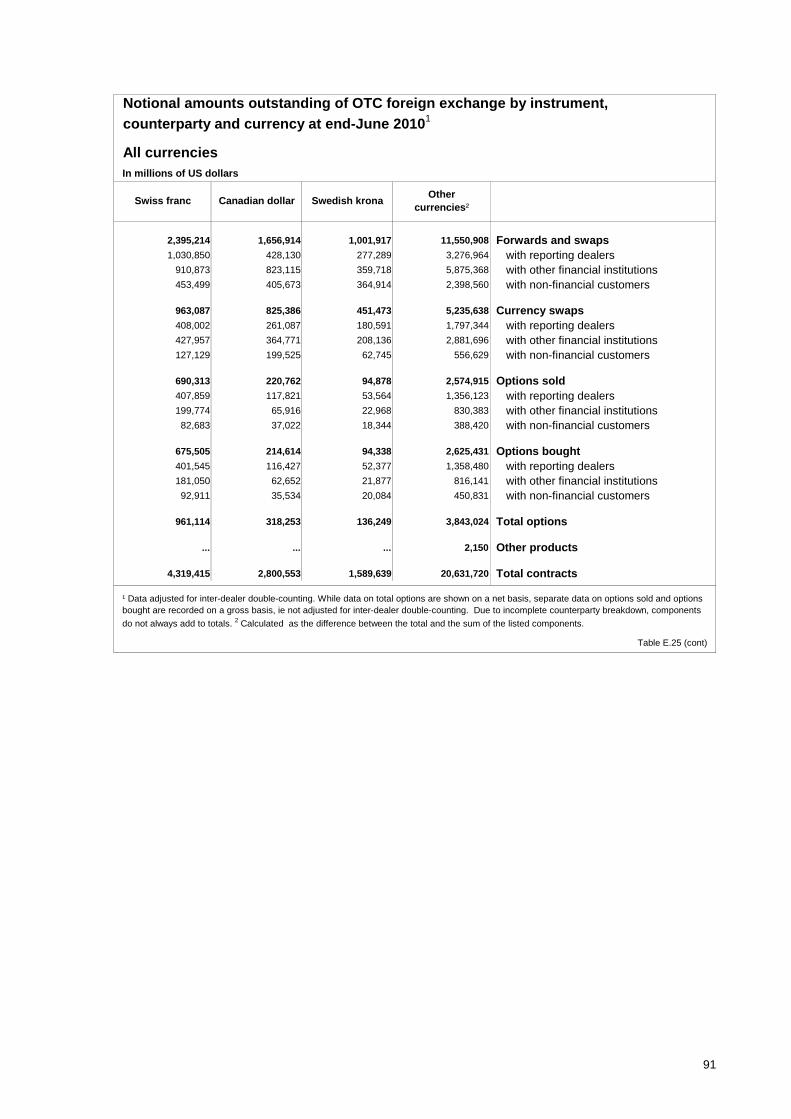
All currenciesIn millions of US dollars
2,395,214 1,656,914 1,001,917 11,550,908 Forwards and swaps 1,030,850 428,130 277,289 3,276,964 with reporting dealers 910,873 823,115 359,718 5,875,368 with other financial institutions 453,499 405,673 364,914 2,398,560 with non-financial customers
963,087 825,386 451,473 5,235,638 Currency swaps 408,002 261,087 180,591 1,797,344 with reporting dealers 427,957 364,771 208,136 2,881,696 with other financial institutions 127,129 199,525 62,745 556,629 with non-financial customers
690,313 220,762 94,878 2,574,915 Options sold 407,859 117,821 53,564 1,356,123 with reporting dealers 199,774 65,916 22,968 830,383 with other financial institutions 82,683 37,022 18,344 388,420 with non-financial customers
675,505 214,614 94,338 2,625,431 Options bought 401,545 116,427 52,377 1,358,480 with reporting dealers 181,050 62,652 21,877 816,141 with other financial institutions 92,911 35,534 20,084 450,831 with non-financial customers
961,114 318,253 136,249 3,843,024 Total options
... ... ... 2,150 Other products
4,319,415 2,800,553 1,589,639 20,631,720 Total contracts
Table E.25 (cont)
Notional amounts outstanding of OTC foreign exchange by instrument,
counterparty and currency at end-June 20101
Other currencies²
¹ Data adjusted for inter-dealer double-counting. While data on total options are shown on a net basis, separate data on options sold and options bought are recorded on a gross basis, ie not adjusted for inter-dealer double-counting. Due to incomplete counterparty breakdown, components
do not always add to totals. 2 Calculated as the difference between the total and the sum of the listed components.
Canadian dollar Swedish kronaSwiss franc
91
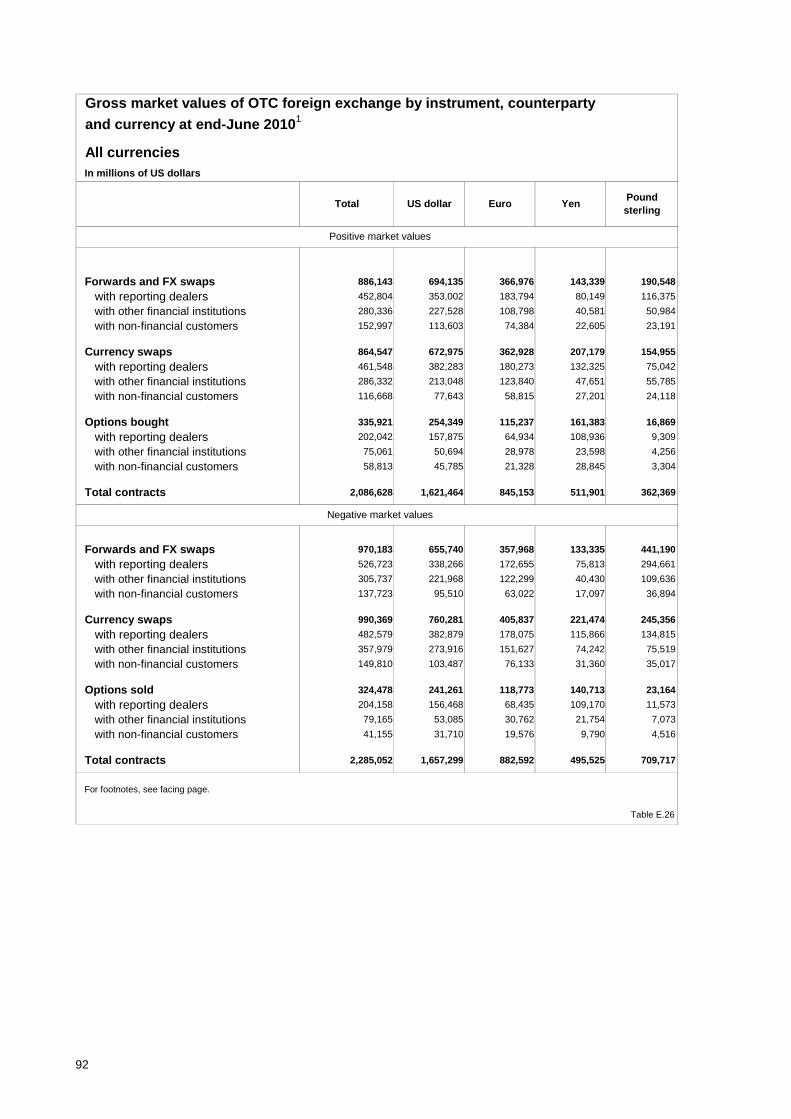
Gross market values of OTC foreign exchange by instrument, counterparty
and currency at end-June 20101
All currenciesIn millions of US dollars
Forwards and FX swaps 886,143 694,135 366,976 143,339 190,548
with reporting dealers 452,804 353,002 183,794 80,149 116,375
with other financial institutions 280,336 227,528 108,798 40,581 50,984
with non-financial customers 152,997 113,603 74,384 22,605 23,191
Currency swaps 864,547 672,975 362,928 207,179 154,955
with reporting dealers 461,548 382,283 180,273 132,325 75,042
with other financial institutions 286,332 213,048 123,840 47,651 55,785
with non-financial customers 116,668 77,643 58,815 27,201 24,118
Options bought 335,921 254,349 115,237 161,383 16,869
with reporting dealers 202,042 157,875 64,934 108,936 9,309
with other financial institutions 75,061 50,694 28,978 23,598 4,256
with non-financial customers 58,813 45,785 21,328 28,845 3,304
Total contracts 2,086,628 1,621,464 845,153 511,901 362,369
Forwards and FX swaps 970,183 655,740 357,968 133,335 441,190
with reporting dealers 526,723 338,266 172,655 75,813 294,661
with other financial institutions 305,737 221,968 122,299 40,430 109,636
with non-financial customers 137,723 95,510 63,022 17,097 36,894
Currency swaps 990,369 760,281 405,837 221,474 245,356
with reporting dealers 482,579 382,879 178,075 115,866 134,815
with other financial institutions 357,979 273,916 151,627 74,242 75,519
with non-financial customers 149,810 103,487 76,133 31,360 35,017
Options sold 324,478 241,261 118,773 140,713 23,164
with reporting dealers 204,158 156,468 68,435 109,170 11,573
with other financial institutions 79,165 53,085 30,762 21,754 7,073
with non-financial customers 41,155 31,710 19,576 9,790 4,516
Total contracts 2,285,052 1,657,299 882,592 495,525 709,717
Table E.26
For footnotes, see facing page.
Negative market values
Positive market values
Pound sterling
Total US dollar Euro Yen
92
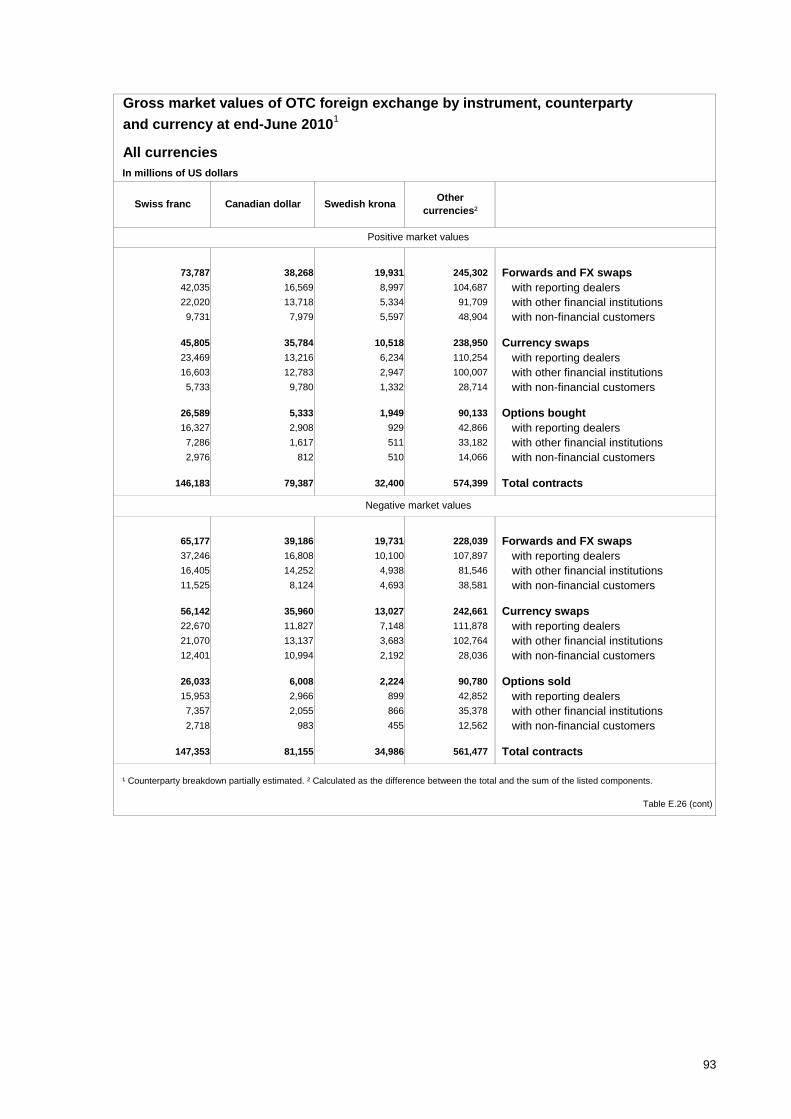
Gross market values of OTC foreign exchange by instrument, counterparty
and currency at end-June 20101
All currenciesIn millions of US dollars
73,787 38,268 19,931 245,302 Forwards and FX swaps 42,035 16,569 8,997 104,687 with reporting dealers 22,020 13,718 5,334 91,709 with other financial institutions 9,731 7,979 5,597 48,904 with non-financial customers
45,805 35,784 10,518 238,950 Currency swaps 23,469 13,216 6,234 110,254 with reporting dealers 16,603 12,783 2,947 100,007 with other financial institutions 5,733 9,780 1,332 28,714 with non-financial customers
26,589 5,333 1,949 90,133 Options bought 16,327 2,908 929 42,866 with reporting dealers 7,286 1,617 511 33,182 with other financial institutions 2,976 812 510 14,066 with non-financial customers
146,183 79,387 32,400 574,399 Total contracts
65,177 39,186 19,731 228,039 Forwards and FX swaps 37,246 16,808 10,100 107,897 with reporting dealers 16,405 14,252 4,938 81,546 with other financial institutions 11,525 8,124 4,693 38,581 with non-financial customers
56,142 35,960 13,027 242,661 Currency swaps 22,670 11,827 7,148 111,878 with reporting dealers 21,070 13,137 3,683 102,764 with other financial institutions 12,401 10,994 2,192 28,036 with non-financial customers
26,033 6,008 2,224 90,780 Options sold 15,953 2,966 899 42,852 with reporting dealers 7,357 2,055 866 35,378 with other financial institutions 2,718 983 455 12,562 with non-financial customers
147,353 81,155 34,986 561,477 Total contracts
Table E.26 (cont)
¹ Counterparty breakdown partially estimated. ² Calculated as the difference between the total and the sum of the listed components.
Positive market values
Negative market values
Swiss franc Canadian dollar Swedish kronaOther
currencies²
93

Notional amounts outstanding of OTC foreign exchange by instrument,
counterparty and remaining maturity at end-June 20101
In millions of US dollars
Forwards and swaps 50,825,407 32,282,575 10,159,882 8,389,912
with reporting dealers 18084693 11,714,146 4,059,140 2,305,296
with other financial institutions 23,677,492 14,051,372 4,514,795 5,102,349
with non-financial customers 9,063,239 6,494,612 1,585,296 982,247
Options sold 8,550,830 6,128,066 1,939,216 483,556
with reporting dealers 4,826,250 3,275,891 1,216,854 330,780
with other financial institutions 2,393,299 1,867,443 440,450 85,375
with non-financial customers 1,331,289 982,604 280,373 67,402
Options bought 8,414,627 5,560,605 1,872,315 981,749
with reporting dealers 4,891,384 3,325,528 1,237,236 327,636
with other financial institutions 2,235,461 1,271,612 391,104 572,726
with non-financial customers 1,287,794 961,463 242,414 81,390
Total options 12,106,637 8,387,966 2,584,491 1,136,101
Other products 1,075 ... ... ...
Total contracts 62,933,119 40,670,527 12,744,367 9,526,012
Total contracts including gold 63,602,498 ... ... ...
Table E.27
¹ Data adjusted for inter-dealer double-counting. While data on total options are shown on a net basis, separate data on options sold and options bought are recorded on a gross basis, ie not adjusted for inter-dealer double-counting. Due to incomplete allocation, the maturity breakdown does not always sum to totals.
Over 5 yearsTotal One year or lessOver 1 year and
up to 5 years
94
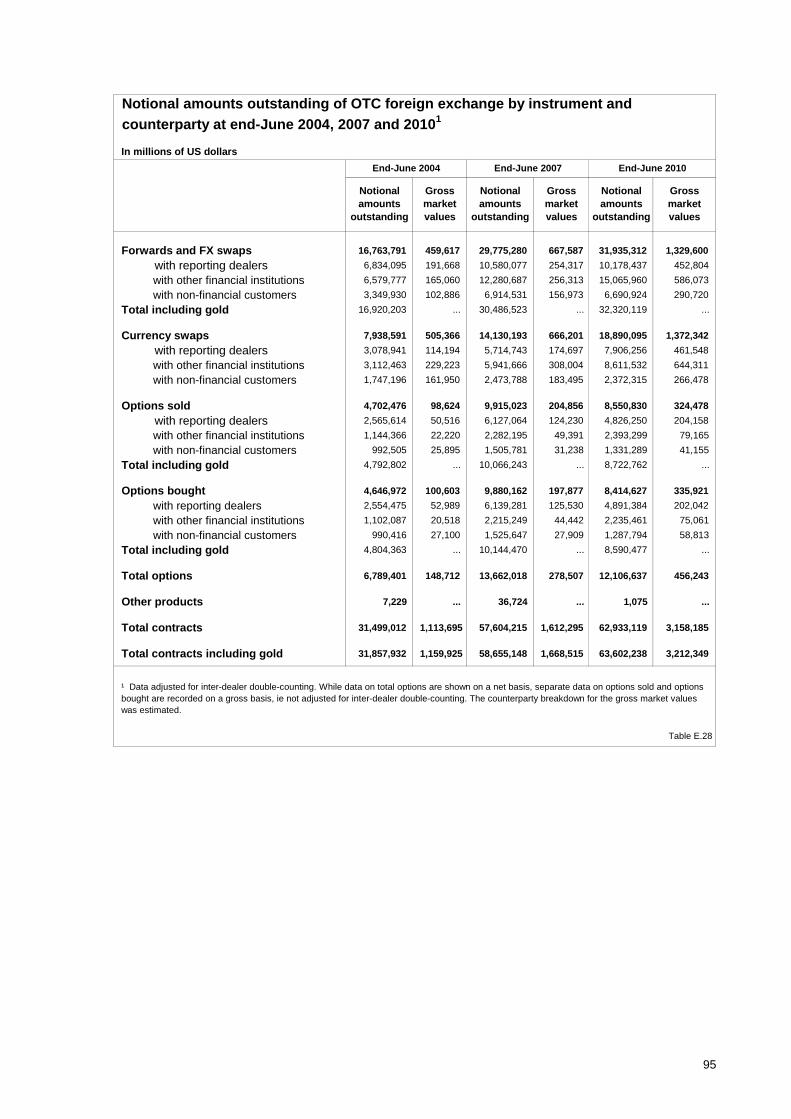
In millions of US dollars
Forwards and FX swaps 16,763,791 459,617 29,775,280 667,587 31,935,312 1,329,600
with reporting dealers 6,834,095 191,668 10,580,077 254,317 10,178,437 452,804
with other financial institutions 6,579,777 165,060 12,280,687 256,313 15,065,960 586,073
with non-financial customers 3,349,930 102,886 6,914,531 156,973 6,690,924 290,720
Total including gold 16,920,203 ... 30,486,523 ... 32,320,119 ...
Currency swaps 7,938,591 505,366 14,130,193 666,201 18,890,095 1,372,342
with reporting dealers 3,078,941 114,194 5,714,743 174,697 7,906,256 461,548
with other financial institutions 3,112,463 229,223 5,941,666 308,004 8,611,532 644,311
with non-financial customers 1,747,196 161,950 2,473,788 183,495 2,372,315 266,478
Options sold 4,702,476 98,624 9,915,023 204,856 8,550,830 324,478
with reporting dealers 2,565,614 50,516 6,127,064 124,230 4,826,250 204,158
with other financial institutions 1,144,366 22,220 2,282,195 49,391 2,393,299 79,165
with non-financial customers 992,505 25,895 1,505,781 31,238 1,331,289 41,155
Total including gold 4,792,802 ... 10,066,243 ... 8,722,762 ...
Options bought 4,646,972 100,603 9,880,162 197,877 8,414,627 335,921
with reporting dealers 2,554,475 52,989 6,139,281 125,530 4,891,384 202,042
with other financial institutions 1,102,087 20,518 2,215,249 44,442 2,235,461 75,061
with non-financial customers 990,416 27,100 1,525,647 27,909 1,287,794 58,813
Total including gold 4,804,363 ... 10,144,470 ... 8,590,477 ...
Total options 6,789,401 148,712 13,662,018 278,507 12,106,637 456,243
Other products 7,229 ... 36,724 ... 1,075 ...
Total contracts 31,499,012 1,113,695 57,604,215 1,612,295 62,933,119 3,158,185
Total contracts including gold 31,857,932 1,159,925 58,655,148 1,668,515 63,602,238 3,212,349
Table E.28
¹ Data adjusted for inter-dealer double-counting. While data on total options are shown on a net basis, separate data on options sold and options bought are recorded on a gross basis, ie not adjusted for inter-dealer double-counting. The counterparty breakdown for the gross market values was estimated.
Notional amounts
outstanding
Notional amounts outstanding of OTC foreign exchange by instrument and
counterparty at end-June 2004, 2007 and 20101
Notional amounts
outstanding
Gross market values
End-June 2004 End-June 2007 End-June 2010
Gross market values
Notional amounts
outstanding
Gross market values
95


