29
1 Corporate Presentation – August 2008 Triveni Engineering & Triveni Engineering & Industries Ltd Industries Ltd

1Corporate Presentation – August 2008
Triveni Engineering & Triveni Engineering & Industries LtdIndustries Ltd

2
Overview
TRIVENI ENGINEERING & INDUSTRIES LIMITED
Diversified Business :
One of the three largest sugar manufacturer in India with integrated operations of co-generation and distillery
Leading manufacturer of engineered to order mechanical equipment
Promoter driven, professionally managed
Eminent and independent Board of Directors
Pan-Indian presence

3
Revenue Composition
Sug
ar -
23%
Eng
g -5
7%
Tota
l -33
%
SalesCAGR FY04 –07
(*) FY 07 data for 18 months ending 30st Sep. 2007. Accounting year extended to 30th Sep. 2007 in line with sugar crushing season.
24%
20%
27%
40%
1,000 5,000 9,000 13,000 17,000 21,000
FY04
FY05
FY06
FY07 (*)
Sugar including Co-generation
Engineering
% Engineering

4
The Engineering Business

5
Engineering Business - Plant Locations
Manufacturing PlantsTurbine Business
Bangalore
Gears Business
Mysore
Water Business
Noida
Mumbai Pune
Kolhapur
Latur
Hyderabad
Vijaywada
Bangalore
Mysore
Naini
Corporate Office
Manufacturing FacilitiesMarketing and Service Centres
Raipur
Nagpur
Noida
Market leader in steam turbines upto 20 MW with current capacity upto 30 MW size
Largest manufacturer of High speed Gears and Gear boxes in India
A leading player in the high technology water & waste water business
AhemdabadKolkata
6
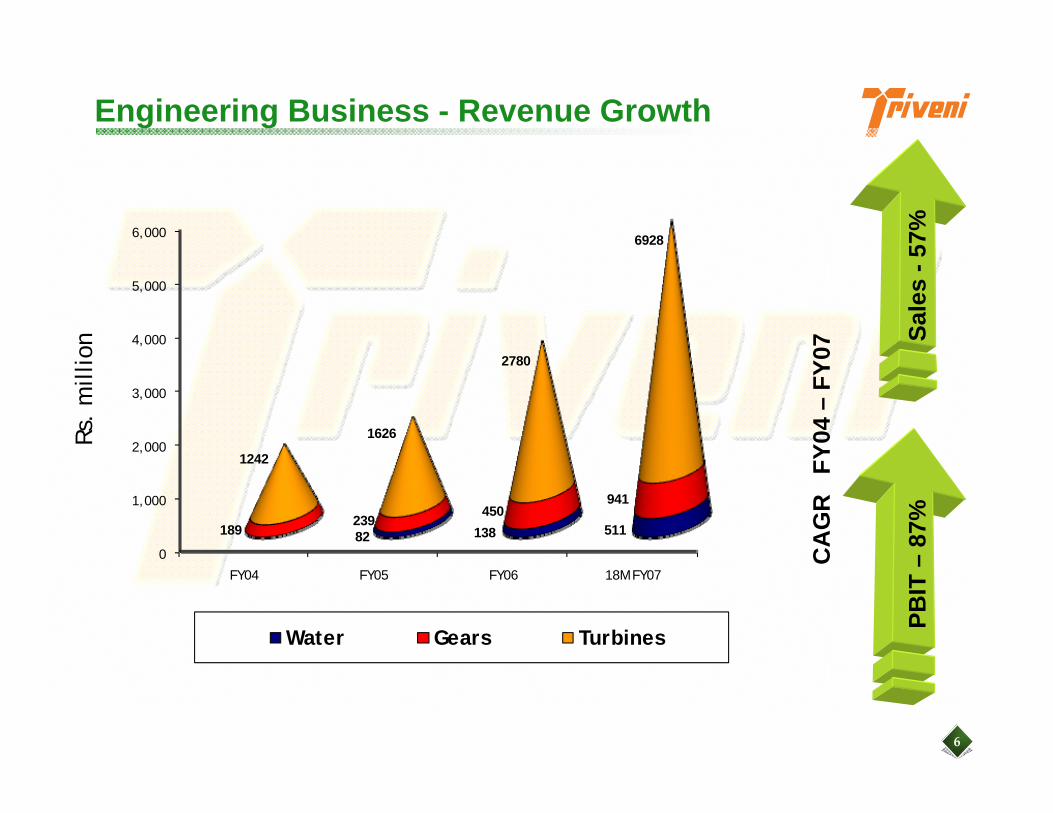
0
1,000
2,000
3,000
4,000
5,000
6,000
FY04 FY05 FY06 18M FY07
82 138 511189239
450941
1242
1626
2780
6928
Water Gears Turbines
CA
GR
FY
04 –
FY07
PBIT
–87
%Sa
les
-57%
Engineering Business - Revenue GrowthRs
. m
illio
n

7
Engineering - Power Generation Market
Sources: Ministry of Power, Powerline, MNES, The Energy Research Institute and Internal projections
The market is price sensitiveMarket demands high levels of technology, efficiency & lower life cycle cost as major factors in purchase decisionMarket places a premium on shorter deliveriesRobust designs, typically suited for the Indian market are in demandRequirement of strong servicing capabilities and lifetime relationship with the customer is expected.
ANNUAL MARKET FOR TURBINES BELOW 30 MW IN YEAR 08-09
Demand is estimated at approx. 1700 MW per annum including additions on account of growth, fulfilment of gap and replacement
ANNUAL MARKET FOR TURBINES BELOW 30 MW IN YEAR 08-09
Demand is estimated at approx. 1700 MW per annum including additions on account of growth, fulfilment of gap and replacement
ANNUAL MARKET FOR TURBINES BETWEEN 30 TO 45 MW IN YEAR 08-09
Conservative domestic demand estimate of about 750 MW per annum including additions on account of growth, fulfilment of gap and replacement
ANNUAL MARKET FOR TURBINES BETWEEN 30 TO 45 MW IN YEAR 08-09
Conservative domestic demand estimate of about 750 MW per annum including additions on account of growth, fulfilment of gap and replacement
Power ShortageIndustrial growthManufacturing growthReplacement marketPower ratesKyoto protocol
MARKET CHARACTERISTICS DRIVERS TO THE DEMAND

8
Engineering - Power Generation – Potential to Grow
Additional power requirement in the country estimated at 76,500 MW in next five years
Current industrial power consumption – generation gap to be bridged
on account of growth
on account of cost of grid power & irregular supplies
Costly fuel source to influence replacement of DG to TG sets
Growing renewable energy market
Estimated demand of 25,000 MW to come in from captive /industrial /co-generation segments in the next five years.
The current gap in the Industrial Segment between consumption (26,800 MW) and generation (19,000 MW) is expected to be addressed in the next four to five years.
Sectors such as metals (sponge iron & mini steel mills), textiles, sugar, cement, paper etc. will use more captive power as grid power is costlier besides the poor quality and irregular supplies from the grid.
Given the rising oil prices, there is tremendous scope for substitution from diesel to steam which will accelerate the growth in demand for steam turbines.
Renewable energy will play a major role in the development of a low carbon energy system
Decentralised power generation and distribution using biomass based raw materials

9
Turbine Business Group
Wide range of customer industries like sugar, cogeneration, steel, paper, textiles, pharmaceuticals
Manufacturing since 1968; over 2,000 turbines manufactured and sold since inception
Turbine manufacturing capacity doubled in FY06 and further increased by 80% in FY07. The current range of products is up to 30MW
Consistently maintained domestic market share of over 65% in the past three years. 18M FY07 market share at 78% for range up to 20 MW
BUSINESS PERSPECTIVES SERVICING & REFURBISHING
Full Speed vacuum Balancing Tunnel for balancing turbines/ compressors/ alternators up to 150 MW commissioned in July 2007
Refurbishment of any make of Turbine upto 150 MW catering to Asia Pacific market
Refurbishing solutions for Expander Turbines, Turbo Compressors, Blowers, Pumps & all Turbo machinery equipment
TECHNICAL PERSPECTIVESHighly efficient turbines with indigenously developed tapered twisted blades. Designed for peak performance under a broad spectrum of operating conditions
Fully integrated operations with strong Engineering & Design team; Facility equipped with state of the art equipments and machine tools best in the industry
Service as a differentiator -An extensive network of Service centres spread across the country
Approx. 30% of the business unit’s personnel dedicated to after sales program
Reaching the customer site within 24 hours of service call
Currently over 700 turbines serviced annually

10
Turbine Business Group
Significant improvement in PBIT margin by over 700 basis point in FY 07. PBIT margin continue to increase in the year also – ~ 300 bps y-o-y
Change in product mix, improved efficiencies, cost reduction etc., also enabled improving margins
FINANCIAL PERSPECTIVES
Outstanding order Book as at 30th June 2008 – Rs. 4.64 billion
Particulars FY04 FY05 FY 06 FY 07 (*) 9M FY 08 9M FY 07Turbines dispatched (MW) 191 232 425 907 548 438Net Sales (Rs. Million) 1,242 1,626 2,780 6,928 3763 3540PBIT ( Rs. Million) 163 153 418 1,539 950 794PBIT Margins (%) 13.1 9.4 15.0 22.2 25.3 22.4
Increase in margins primarily due to :Improved share of servicing, spares & refurbishing
Increased from 8.7% in 9M FY 07 to 11% in 9M FY 08; expected to grow upto 15%
Increased share of exportsShare of exports in total sales increased from 5% in 9M FY 07 to 13% in 9M FY 08
(*) FY 07 is for 18 months ending 30th September 2007 ; other financial years are April- March

11
Turbine Business Group
Strong Research & Development team supported by an eminent team of external advisors from IISc, IIT and other notable institutions
Expanding the range of products –higher MW, higher pressure turbines
Spares & Services to form higher proportion of revenues in view of increased installed base achieved in the last several years; estimated to reach 15% of the revenue in FY 09
Refurbishment of all makes of turbines including overhauling and troubleshooting
Tie-up with GE Oil & Gas for design, manufacture & assembling of High Speed Reciprocating Compressors
FUTURE PERSPECTIVESSetting up of a dedicated Training School for in-house development of skilled design and servicing staff- an unique initiative in human development & technology upgradation
Customised operation and maintenance contracts (O&M) to be a focus area and targeting to double the number of contracts
Focus on Exports – Targeting all high technology markets across the globe. Exports to form 20% of revenue by FY 09
Tie-up with Waukesha for packaging, assembling and distributing Waukesha Gas Engines
Looking for appropriate tie-ups for going into higher ranges of turbines, marketing & servicing network etc.

12
Gears Business Group
Triveni is in the business of design, manufacture and marketing of gears and gearboxes with a capacity of up to 70.0 MW and speed up to 50,000 rpm
Own developed technology for high speed gear boxes upto 7.5 MW including test rigs, hydel gear boxes across range, niche low speed and loose gears for multinationals
The high speed gear range for steam, gas , pumps and compressor applications range above 7.5 MW is manufactured using technology licensed from Lufkin
Above 25MW up to 70MW produced through a joint manufacturing programme with Lufkin
Conforms to international standards such as DIN, API & AGMA
BUSINESS PERSPECTIVESApplications in power turbines, compressors, pumps etc. as a power transmission equipment
State of the art design and manufacturing facility with sophisticated profile grinding and hobbing machines from Gleason Pfauter of Germany and latest softwares for design
Supplied & Commissioned the highest power (54 MW) load gear box by Triveni for a GE frame-6 gas turbine
Highest power (8 MW) indigenous gear box for high speed compressor manufactured and tested for API 613 Vth edition
Highest quality - DIN 3 quality assured

13
Gears Business Group
Over 75% market share in below 25 MW and supplier to all major turbine competitors such as BHEL, Siemens.
Overall ~ 60% market share in high speed gears across the power range
Major retrofitting orders executed for cement industry, steel industry etc.
Outstanding order Book as at 30th June 2008 – Rs. 489 million
FINANCIAL PERSPECTIVESImprovement in margins on account of new products, higher share of servicing, spares & retrofitting
share of servicing & retrofitting gone up from 26% in 9M FY 07 to 29% in 9M FY 08
Increase in sales of over 20% and PBIT improvement of over 600 basis points year on year
Particulars FY04 FY05 FY 06 FY 07 (*) 9M FY 08 9M FY 07Net Sales (Rs. Million) 189 239 450 941 526 435
PBIT (Rs. Million) 25 31 76 233 156.3 102.8
PBIT Margins (%) 13.2 12.8 16.9 24.7 29.7 23.6
(*) FY 07 is for 18 months ending 30th September 2007 ; other financial years are April- March

14
Gears Business Group
Focus on product development in high value added low speed applications
Installation of 2 meter CNC profile grinder and vertical turret lathe with grinding attachments, internal hobbing /milling attachment including assembly bay expansion
Revenue growth through Product diversification into hydel gear boxes, marine gear boxes and niche low speed gear boxes
On the look out for expanding the products and services offered through technology tie-ups and strategic relationships with global players
FUTURE PERSPECTIVESMeeting the growing gear box demand in oil & gas segment & auxiliaries for power plants
Focus on providing retro-fitting and replacement solutions for domestic and export market
Consistently maintain overall gear box quality at world class standards
Source for high precision loose gears for major MNC’s.

15
Water Business Group
Annual estimated market for Water/Waste Treatment market is ~ Rs. 50 billion with an estimated growth of 20-25%
Visible potential for water & waste water business in view of anticipated stringent environmental norms and scarcity of water
Market is increasing substantially in all areas- desalination, water reuse and decentralised solutions
BUSINESS PERSPECTIVESTechnology association with Siemens Water Technology Business for various products & solutions
One of the widest ranges of products & technologies offered in the Indian Market
Product lines include clarifiers, aerators, filters, membrane solutions, de-watering equipment and high purity water systems
Over 2000 numbers of process equipments for water & waste water treatment applications, supplied and commissioned till date

16
Water Business Group
The water business Group (WBG) delivered a 270% increase in turnover for FY 07 at Rs. 511 million (Rs. 138 million). PBIT increased 161% to Rs. 58 million (Rs. 22 million). Significant growth (CAGR of 80% in turnover and 93% in PBIT) achieved during the past four years
Focus on high value jobs like major effluent recycling, installation of high purity water system etc. for major power plants
Currently executing the largest industrial desalination plant, to date in India, for a power plant
FINANCIAL PERSPECTIVESContinue to get larger orders and in the areas of high technology applications
Started getting pre-qualified for high value jobs which will enable to grow faster
During April- June 08, received a single order of Rs. 625 million – more than past 18 month’s turnover, for a municipal project
Own manufacturing workshop cum office facility at NOIDA operational
Particulars FY05 FY 06 FY 07 (*) 9M FY 08 9M FY 07Net Sales (Rs. Million) 81.6 138.1 511.3 448.5 293.5
PBIT (Rs. Million) 5.4 22.2 58.0 88.8 29.7
PBIT Margins (%) 6.6 16.1 11.3 19.8 10.1(*) FY 07 is for 18 months ending 30th September 2007 ; other financial years are April- March
Outstanding order Book as at 30th June 2008 – Rs. 1.55 billion
17
Water Business Group
Visible growth potential in coming years in sectors such as Municipal, power, metals and mining apart from the overall industrial and municipal applications
Jawaharlal Nehru National Urban Renewal Mission (JNNURM ) –schemes to be taken up in all major Indian cities with an annual estimated market size for water related schemes of Rs. 13 – 15 billion
Over 76500 MW new power generation capacities to be added in the next five years – annual estimated market size of Rs. 10-13 billion for water business
Major expansion and capacity additions envisaged in steel, coal etc. – estimated annual market Rs. 7-12 billion
FUTURE PERSPECTIVES
Triveni is capable of providing solutions across the spectrum and is gearing up further by continually looking forward for wider product offerings in association with global technology leaders to strengthen the current technology range and also to add new products & solutions to address the expanding market
With the visibility of a fast growing market, WBG is estimated to grow at a CAGR of 70 -75% in the next five years.
Key technology applications to be used in these sectors are desalination (power & municipal), high purity system, condensate polishing units (both for large sized power plants), biological treatment with nutrient removal (for municipal sector), Anaerobic Treatment (ethanol manufacturing) etc.
With the execution of high value desalination, condensate polishing units and other industrial application orders, WBG will pre-qualify for taking up higher value orders.

18
The Sugar Business

19
Sugar Business
Global production for 2008-09 estimated at 170 million, an increase of 1.8%. Brazil, the leading sugar producing nation, currently processing ~ 60% of the total cane crop for production of ethanol while this was only ~ 55% in the previous crop
For the past few months, sugar prices globally has been volatile and the same is continuing. Sugar prices has been impacted by money inflows from commodity funds.
White Sugar prices after rising to about $ 470 /tonne are currently at $388 (Oct 08 contract) while the raw sugar after touching 18 USc/lb, is currently at 13.6 USc/lb (Oct 08 contract) (Date : 12th August 08)
Introduction of mandatory blending by major countries of World - fuel ethanol consumption to go from 33. 7 billion litres currently to 79.4 billion litres by 2010. This would be further accentuated by the New Renewable Fuel Standards by USA
GLOBAL SUGAR INDUSTRYIndia is the largest consumer & second largest producer of sugar
India’s production of 2007-08 season estimated to be at 26.5 million (lower by 6%). On account of farmers switching to alternate crops because of lower cane prices and less than normal rainfall in major sugar cane growing areas of Maharashtra & Karnataka, the estimated sugar production for 2008-09 season would be 21-22 million tonne, a drop of ~ 20%. This will have an impact during 2009-10 production as well
On account of estimated lower production for 2008-09 and 2009-10 season, sugar, molasses and alcohol prices expected to rise significantly in the coming quarters and to remain high for the next 2-3 years
Expectation of a decision from the Supreme Court to have a mechanism to fix cane pricing for UP on a rational basis taking into consideration cost of production, sugar prices etc. Also expected is the decision on the enhanced deduction of transportation charges on cane from Rs. 5.75 per qtl, to Rs. 10.58 per qtl.
INDIAN SUGAR INDUSTRY

20
Sugar Cycle
Increase in sugar prices, improved
profitability
3 ye
ars
TimeDowncycle Upcycle
Higher sugar production, higher availability of sugar
Decline in sugar prices, lower profitability
Delayed payment to farmers, high
sugarcane arrears
Decline in sugarcane utilization for sugar productionDecline in area
under sugarcane cultivation, lower
productionLower sugar
production, lower sugar availability
Higher and prompt payment from farmers,
lower arrearsIncrease in area under sugarcane cultivation, higher
production
Higher sugarcane utilization for sugar
production
2 ye
ars
Source: Cris-Infac / Company
Profitability Margins :
Profitability Margins :
Sugar
Power / Ethanol
Profitability Margins :
Profitability Margins :
Sugar
Power / Ethanol
Sugar
Power / Ethanol
Sugar
Power / Ethanol

21
Sugar - Domestic Production & Consumption
Sugar 02 –03 03 –04 04 –05 05 –06 06 –07 07 –08 (P) 08 –09 ($)
Opening Stock 11.3 11.6 8.5 4.0(*) 3.6 9.2 9.2
Production 20.2 14.0 12.7 19.3 28.3 26.5 22.0
Imports 0.0 0.4 2.1 0.0 0.0 0.0 0.0
Total Available 31.5 26.0 23.3 23.3 31.9 35.7 31.2
Consumption 18.3 17.3 18.5 18.5 21.0 22.5 23.0
Exports 1.5 0.2 0.0 1.1 1.7 4.0 1.5
Total Despatches 19.8 17.5 18.5 19.6 22.7 26.5 24.5
Closing Stock 11.6 8.5 4.8 3.6 9.2 9.2 6.7
Closing Stock / Consumption (%) 63% 49% 26% 20% 44% 41% 29%
Note: “Years” mentioned are sugar years and not calendar years. The sugar year is from October to September.Source: ISMA for data upto 2007-08 ($) Company Estimates
Closing stock taken as a percent of consumption is one of the indicators of sugar price movement.
(*) Adjustment made as per Central Excise Certificate

22
Sugar – Key Differentiators
Major facilities located in cane rich areas of Western Uttar Pradesh - Western Uttar Pradesh with more than 80% cane intensity – fertile and irrigated land
Sugar cane catchment area for all sugar units under canal irrigation – both in Western & Central Uttar Pradesh - Lower dependency on monsoon
Closer to country’s major sugar consuming markets - better realizations & lower transportation cost
Long term relationship with farmers ~ 250,000 farmers
Extensive sugar cane development programme – to develop new areas under cane cultivation in our new locations; improving yields of cane across the units
SUGAR PLANT LOCATIONS
Deoband (14,000 TCD)
Khatauli(16,000 TCD)
Ramkola(6,500 TCD)
Chandanpur(6,000 TCD)
Sabitgarh(7,000 TCD)
Milak Narainpur(6,000 TCD)
Raninagal (5,500 TCD)

23
Sugar Business
Sugar crushing season for 2007-08 is complete
Crushing started late during this season (2007-08) and on account of lower yield due to climatic factors, the mills operated only for an average of 126 days during this season as against last season’s average of UP mills of 158 days
Triveni crushed 5.86 million tonne of cane producing 580,000 tonne of sugar – a decline of 2% as against decline of ~ 14% in sugar production across the State of Uttar Pradesh
Sugar recoveries for the Group higher at 9.90% as against 9.69% last season
SUGAR MANUFACTURING
For 2006-07 sugar season, Allahabad High Court gave judgment striking down the SAP announced by UP State while for 2007-08, the Lucknow bench of Allahabad High Court upheld SAP. Final decision on the cane pricing for 2006-07 & 2007-08 before the Supreme Court
Accounted and paid for cane in 2007-08 at Rs. 1100 per tonne as per the Interim Order of Lucknow Bench while for 2006-07, paid and accounted at Rs. 1250 per tonne
Particulars FY04 FY05 FY 06 FY 07 (*) 9M FY 08 9M FY 07
Net Sales (Rs. Million) 4470 7676 8649 10963 6450 6053
PBIT (Rs. Million) 437 1404 1357 (518) 105 (878)
PBIT Margins (%) 9.8 18.3 15.7 (4.7) 1.6 (14.5)
(*) FY 07 is for 18 months ending 30th September 2007 ; other financial years are April- March
24
Sugar – Going Forward
Integration of co-generation and distillation of alcohol - counter-cyclical to sugar cycle
Geared up to take up the benefit of upturn in sugar cycle on account of higher volume
Over 65% of current year’s production in inventory as on 30th June 2008 – well positioned to take advantage of current rising prices
With the capex incurred in FY 07, the full benefits of cane crush to accrue in the coming seasons onwards with consistent & full season capacity utilization
New sugar units in relatively low cane intensive area and hence little competition
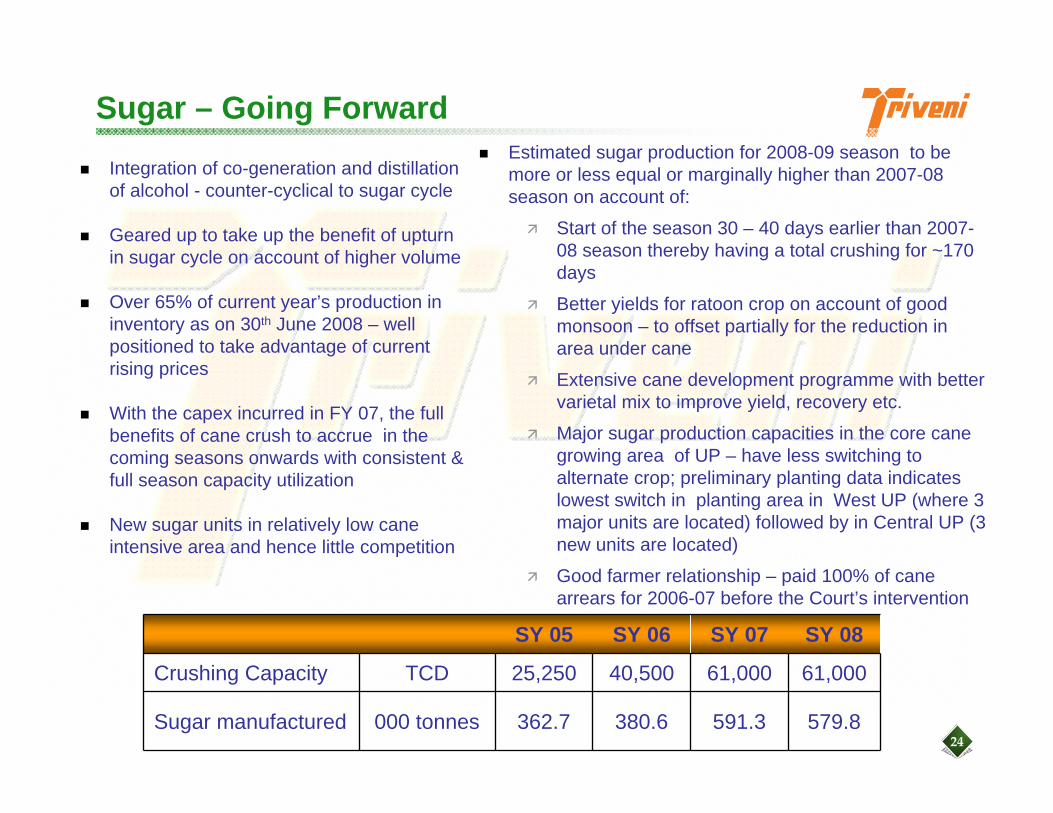
Estimated sugar production for 2008-09 season to be more or less equal or marginally higher than 2007-08 season on account of:
Start of the season 30 – 40 days earlier than 2007-08 season thereby having a total crushing for ~170 days
Better yields for ratoon crop on account of good monsoon – to offset partially for the reduction in area under cane
Extensive cane development programme with better varietal mix to improve yield, recovery etc.
Major sugar production capacities in the core cane growing area of UP – have less switching to alternate crop; preliminary planting data indicates lowest switch in planting area in West UP (where 3 major units are located) followed by in Central UP (3 new units are located)
Good farmer relationship – paid 100% of cane arrears for 2006-07 before the Court’s intervention
SY 05 SY 06 SY 07 SY 08
Crushing Capacity TCD 25,250 40,500 61,000 61,000
Sugar manufactured 000 tonnes 362.7 380.6 591.3 579.8

25
Sugar – Co-Generation Business
This business is counter cyclical to the sugar cycle as the input price of bagasse is counter cyclical to sugar
42 – 43 MW of exportable power for on an average of 250 days from two sugar units; during 2007-08 on account of reduced crushing days, no. of days operations was ~ 215 days
Continual improvements in operational efficiencies - reduced steam consumption resulting in higher bagasse savings, which in turn enables longer operations of the co-generation facility during the off-season
Facilities eligible for carbon credits under “Clean Development Mechanism”
Accounted for the CERs of Deoband for April 07 – March 08 during April- June 08 quarter while verification of Khatauli Phase 1 for the same period is underway and expected to be accounted in the last quarter of this financial year
On an on-going basis, approx. 200,000 CERs per annum to be accrued
Particulars FY 05 FY 06 FY07 (*) 9M FY 08 9M FY 07
Sales (Rs. Million) 188 606 1527 1251 1241
PBIT ( Rs. Million) 45 165 497 562 447
PBIT Margins (%) 24 27 33 45 36
(*) FY 07 is for 18 months ending 30th September 2007 ; other financial years are April- March

26
Sugar - Distillery Business
Integration of Sugar operation – value addition of by-product - molasses
160 KLPD distillery, commissioned in April 2007, is one of the largest single stream molasses based distillery in the country and is located at Muzaffarnagar
Ideally located to use the molasses from two of the major units viz., Khatauli & Deoband
Have achieved full capacity utilisation and operating with good efficiencies
In this short span of time, started producing one of the country’s best quality ENA
Government announcement of mandatory blending of 5% ethanol from October 2007 and 10% blending from October 2008 expected to result in fresh tenders for ethanol
Achieved turnover of Rs. 467 million during the nine month ending June 2008
Alcohol prices went up by ~ 15% during the quarter ending June 2008
Current alcohol prices are on the rise and is approx. 25% higher than last quarter average prices
Given the outlook of lower production of sugarcane in 2008-09 and 2009-10, the alcohol prices are expected to rise significantly in the coming quarters.
27
Retail Business – Triveni Khushali Bazaar
Triveni has launched a chain of stores called “Triveni Khushali Bazaar”, for rural and semi urban customers –currently 42 stores in operation
Operates under three verticals – Agri, Non-Agri and Finance/Service –caters to the entire basket of goods & services required by the semi-urban and rural community including FMCG, groceries, life style products, agricultural inputs such as farm implements, diesel, fertiliser, and services such as facilitating institutional credit, insurance, mutual funds, farm advisory services etc
Triveni’s channel partners include HPCL, Apollo tyres, IFFCO, Chambal, Atlas, Godrej, HLL, etc
The company has signed an MoU with SBI to provide unsecured financing to farmers
The company has tie up with Max New York Life for insurance products
Tie-up with Reliance Money for financial services products
The business is carried out by a wholly owned subsidiary – Triveni Retail Ventures Limited since October 2005

28
Vision Statement
SUGAR MANUFACTURING• Stabilise the installed Capacity• Achieve greater raw material security• Strengthen farmer relationships• Thrust on cane development and
continuously improve technology in sugar manufacturing
CO-GENERATION & DISTILLERY• Value addition of by-products to be
achieved by maximum integration of operations
• Explore organic and inorganic expansions, depending on opportunities and market
TURBINES BUSINESS• Upgrade & maintain manufacturing
excellence• Constant technology & developmental
improvement• Using superior service as a differentiator• Broaden the market for Steam Turbines
GEARS BUSINESS
• Increase product range• Diversify and broaden our customer base
WATER BUSINESS• Focus on Technology• Focus on high margin equipment and
solutions
SUGAR BusinessSUGAR Business ENGINEERING BusinessENGINEERING Business
Our long-term corporate vision is to: (a) Maintain a Top 3 position in each of our businesses within the applicable market segment
The market segment for the Turbines business is the global market while for the sugar business it is India
(b) Create value and delight for our customers and stakeholders(c) Incorporate technology as the key differentiator to deliver growth and to sustain leadership

29
For more details contact:
CN Narayanan
Triveni Engineering & Industries Ltd.
Tel. +91 120 430 8000 Fax : +91 120 431 1010
Gavin Desa/ Saurav Shah
Citigate Dewe Rogerson
Tel: +91 22 4007 5000
Fax: +91 22 2284 4561
[email protected] / [email protected]
www.trivenigroup.com
Some of the statements in this presentation that are not historical facts are forward looking statements. These forward-looking statements include our financial and growth projections as well as statements concerning our plans, strategies, intentions and beliefs concerning our business and the markets in which we operate.
These statements are based on information currently available to us, and we assume no obligation to update these statements as circumstances change. There are risks and uncertainties that could cause actual events to differ materially from these forward-looking statements. These risks include, but are not limited to, the level of market demand for our services, the highly-competitive market for the types of services that we offer, market conditions that could cause our customers to reduce their spending for our services, our ability to create, acquire and build new businesses and to grow our existing businesses, our ability to attract and retain qualified personnel, currency fluctuations and market conditions in India and elsewhere around the world, and other risks not specifically mentioned herein but those that are common to industry.
Further, this presentation may make references to reports and publications available in the public domain. Triveni Industries Ltd. makes no representation as to their accuracy or that the company subscribes to those views / findings.
Disclaimer


