Page 1
T.R.N.C
NEAR EAST UNIVERSITY
GRADUATE SCHOOL OF HEALTH SCIENCES
INHIBITORY EFFECT OF HYPERICIN ON
GLUTATHIONE REDUCTASE PURIFIED FROM
BAKER’S YEAST
Redwan Kawa ABDULLAH
MEDICAL BIOCHEMISTRY PROGRAM
MASTER OF SCIENCE THESIS
NICOSIA
2017
Page 2
T.R.N.C.
NEAR EAST UNIVERSITY
GRADUATE SCHOOL OF HEALTH SCIENCES
INHIBITORY EFFECT OF HYPERICIN ON
GLUTATHIONE REDUCTASE PURIFIED FROM
BAKER’S YEAST
Redwan Kawa ABDULLAH
MEDICAL BIOCHEMISTRY PROGRAM
MASTER OF SCIENCE THESIS
SUPERVISOR
Associate Professor Özlem DALMIZRAK
NICOSIA
2017
Page 3
iii
The Directorate of Graduate School of Health Sciences,
This study has been accepted by the thesis committee in Medical Biochemistry
program as a Master of Science Thesis.
Thesis committee:
Chair: Professor Nazmi ÖZER
Near East University
Member: Professor Nevbahar TURGAN
Ege University
Supervisor: Associated Professor Özlem DALMIZRAK
Near East University
Approval:
According to the relevant article of the Near East University Postgraduate Study –
Education and Examination Regulation, this thesis has been approved by the above
mentioned members of the thesis committee and the decision of the board of Director
of the Institute.
Professor İhsan CALIŞ
Director of the Graduate School of Health Sciences
Page 4
iv
ACKNOWLEDGEMENTS
First, I would like to express earnest appreciation to my supervisor Associate
Professor Özlem Dalmızrak for her commitment, consolation, patience and support.
I am grateful to Professor Nazmi Özer for his instruction and support during
my postgraduate study.
I am grateful to Professor Hamdi Öğüş for his valuable contribution.
I am grateful to my classmate Evelyn Asuquo who was stand by my side
during our thesis.
Finally, my deepest expression to my father Kawa Abdullah and my mother
Pakhshan Abdullah for their encouragement, support and patience during my
education through all these years.
Page 5
v
ABSTRACT
Abdullah R.K. Inhibitory Effect of Hypericin on Glutathione Reductase
Purified from Baker's Yeast. Near East University, Graduate School of Health
Sciences, M.Sc. Thesis in Medical Biochemistry Program, Nicosia, 2017.
Glutathione is the most common non-protein thiol peptide in almost all living
organisms and has a role in antioxidant defense mechanisms and xenobiotic
detoxification. Glutathione reductase (GR) is one of the enzymes that functions in
regeneration of reduced glutathione (GSH) from oxidized glutathione (GSSG).
Hypericin is a naturally occurring substance found in St. John’s Wort (Hypericum
perforatum L.). It has antidepressant, antiviral actions and is used in photodynamic
therapy of several oncological diseases. In this study, the interaction of hypericin
with GR (E C 1.6.4.2) purified from baker’s yeast (S. cerevisiae) was investigated.
Activity measurements were carried out at 340 nm by using different [hypericin] at
either fixed 1 mM [GSSG]-variable [NADPH] or fixed 0.1 mM [NADPH]-variable
[GSSG]. On native and SDS-PAGE gels, GR gave a single protein and activity
bands. Molecular weight of a single subunit was calculated as 49 kDa. The pH
optimum was found to be 7.65 by zero buffer extrapolation method. The temperature
optimum, activation energy and Q10 were calculated as 57oC, 3,544 calories and 1.26,
respectively. Hypericin was found to be as an effective inhibitor of GR with an IC50
value of 15 μM. When the variable substrate is GSSG, inhibition type was
competitive, Km and Ki were found as 190 40 μM and 2.92 0.73 µM,
respectively. On the other hand, when the variable substrate was NADPH, inhibition
type was linear-mixed type competitive and the Ks, Ki and α values were 15.8 1.6
µM, 2.63 0.50 µM and 3.48 1.31, respectively. Competitive inhibition with
GSSG clearly shows that hypericin binds to the GSSG binding site. On the other
hand, linear-mixed type competitive inhibition with NADPH indicates that although
hypericin binds to the GSSG site it is a huge molecule and it also affects the binding
of NADPH because GSSG and NADPH sites are close to each other.
Keywords: Glutathione reductase, hypericin, inhibition kinetics, Ki
Page 6
vi
ÖZET
Abdullah R.K. Hiperisinin Ekmek Mayasından Saflaştırılan Glutatyon
Redüktaz Enzimine İnhibe Edici Etkisi. Yakın Doğu Üniversitesi, Sağlık
Bilimleri Enstitüsü, Tıbbi Biyokimya Programı, Yüksek Lisans Tezi, Lefkoşa,
2017.
Glutatyon bütün organizmalarda yaygın olarak bulunan protein olmayan tiyol
peptididir ve antioksidan savunma mekanizmaları ve ksenobiyotik
detoksifikasyonunda rolü bulunmaktadır. Glutatyon redüktaz (GR) okside
glutatyonun (GSSG) redükte glutatyona (GSH) rejenerasyonunda görev yapmaktadır.
Hiperisin St. John’s Wort (Hypericum perforatum L.)’de bulunan doğal bir bileşiktir.
Antidepresan, antiviral etkileri bulunmaktadır ve birçok onkolojik hastalığın
fotodinamik tedavisinde kullanılmaktadır. Çalışmamızda hiperisin ile ekmek
mayasından (S. cerevisiae) saflaştırılmış GR (E.C. 1.6.4.2) arasındaki etkileşim
araştırılmıştır. Aktivite ölçümleri 340 nm’de farklı hiperisin derişimlerinde, sabit 1
mM [GSSG]-değişken [NADPH] ya da sabit 0.1 mM [NADPH]-değişken [GSSG]
kullanılarak gerçekleştirilmiştir. Natif ve SDS-PAGE jellerinde GR tek bir protein ve
aktivite bandı vermiştir. Altbirim molekül ağırlığı 49 kDa olarak hesaplanmıştır. pH
optimumu sıfır tampon ekstrapolasyonu yapılarak 7.65 olarak bulunmuştur.
Optimum sıcaklık, aktivasyon enerjisi ve Q10 sırasıyla 57oC, 3,544 kalori ve 1.26
olarak hesaplanmıştır. Hiperisinin GR enzimini inhibe ettiği gözlenmiş ve IC50 değeri
15 μM olarak bulunmuştur. Değişken substrat GSSG olduğunda, hiperisin GR’yi
kompetitif olarak inhibe etmektedir. Km ve Ki değerleri sırasıyla 190 40 μM ve 2.92
0.73 µM olarak bulunmuştur. Diğer taraftan, NADPH değişken substrat olarak
kullanıldığında inhibisyonun türü lineer karışık tip kompetitif olarak belirlenmiştir.
Ks, Ki ve α değerleri 15.8 1.6 µM, 2.63 0.50 µM ve 3.48 1.31 olarak
hesaplanmıştır. Değişken GSSG ile gözlenen kompetitif inhibisyon hiperisinin
enzimin GSSG bağlanma bölgesine bağlandığını; lineer karışık tip kompetitif
inhibisyon ise büyük bir molekül olan hiperisinin NADPH’nin de bağlanmasını
etkilediğini göstermektedir.
Anahtar Kelimeler: Glutatyon redüktaz, hiperisin, inhibisyon kinetiği, Ki
Page 7
vii
TABLE OF CONTENTS
Page No
APPROVAL iii
ACKNOWLEDGEMENTS iv
ABSTRACT v
ÖZET vi
TABLE OF CONTENTS vii
ABBREVIATIONS ix
LIST OF FIGURES xii
LIST OF TABLES xiv
1. INTRODUCTION 1
2. GENERAL INFORMATION 3
2.1. Glutathione Reductase 3
2.2. Glutathione 5
2.3. Oxidative Stress 7
2.3.1. Generation Reactive Oxygen Species in the Human Body 8
2.3.2. Generation of Reactive Nitrogen Species 11
2.3.3. Beneficial Activities of ROS and RNS 13
2.4. Antioxidants 13
2.4.1 Antioxidant Enzymes 15
2.5. Hypericin 20
3. MATERIALS AND METHODS 22
3.1. Chemicals 22
3.2. Methods 22
3.2.1. Preparation of Glutathione Reductase 22
3.2.2. Determination of Protein Concentration by Bradford Assay 22
3.2.3. Native-Polyacrylamide Gel Electrophoresis (Native-PAGE) 23
3.2.4. Sodium Dodecyl Sulfate-Polyacrylamide Gel Electrophoresis 26
(SDS-PAGE)
3.2.5. Coomassie Brilliant Blue (CBB) R-250 Staining 28
3.2.6. Silver Staining 28
3.2.7. Activity Staining 29
Page 8
viii
3.2.8. Glutathione Reductase Activity Measurement 29
3.2.9. Determination of Optimum pH by Zero Buffer Extrapolation 30
3.2.10. Determination of Optimum Temperature 30
3.2.11. Effect of Hypericin on Glutathione Reductase Enzyme Activity 31
3.2.12. Inhibitory Kinetic Experiments with Hypericin 31
3.3.13. Statistical Analysis 32
4. RESULTS 33
4.1. Determination of the Protein Concentration 33
4.2. Characterization of Glutathione Reductase Enzyme 34
4.2.1. Purity Control of Glutathione Reductase Enzyme 34
4.2.2. Determination of Optimum pH by Zero Buffer Extrapolation 37
4.2.3. Determination of Optimum Temperature 39
4.3. Substrate Kinetics 39
4.4. Inhibitory Kinetic Behaviour of Glutathione Reductase with Hypericin 43
5. DISCUSSION 54
6. CONCLUSION 60
REFERENCES 61
Page 9
ix
ABBREVIATIONS
2-AAPA : 2-acetylamino-3-[4-(2-acetylamino-2 carboxyethylsulfanyl
thiocarbonylamino) phenylthiocarbamoylsulfanyl] propionic
acid
AIDS : Acquired Immune Deficiency Syndrome
APS : Ammonium persulfate
BCNU :1,3-bis (2-chloroethyl)-1-nitrosourea
BCRP : Breast cancer resistance protein
BSA : Bovine serum albumin
CAT : Catalase
CBB : Coomassie Brilliant Blue
CDNB : 1-chloro-2,4-dinitrobenzene
CuZnSOD : Copper/zinc superoxide dismutase
dH2O : Distilled water
DMSO : Dimethyl sulfoxide
DNA : Deoxyribonucleic acid
E. coli : Escherichia coli
Ea : Energy of activation
FAD : Flavin adenine dinucleotide
G6P : Glucose-6-phosphate
G6PD : Glucose-6-phosphate dehydrogenase
GABA : Gamma-aminobutyric acid
γ-GCG : Gamma-glutamyl-cysteinyl-glycine
GCL : Glutamate-cysteine ligase
GCLC : Glutamate-cysteine ligase catalytic subunit
GCLM : Glutamate-cysteine ligase modifier subunit
Glr1 : Yeast glutathione reductase
GPx : Glutathione peroxidase
GR : Glutathione reductase
GSH : Reduced glutathione
GSSG : Oxidized glutathione
Page 10
x
GST : Glutathione S-transferase
GST-α : Glutathione S-transferase alpha
GST-π : Glutathione S-transferase pi
H. sapiens : Homo sapiens
H2O2 : Hydrogen peroxide
HNO : Nitroxyl
OH. : Hydroxyl radical
HOCl : Hypoclorous acid
HPLC : High-pressure liquid chromatography
IC50 : Half maximum inhibitory concentration
Ki : Inhibitory constant
Km : Michaelis constant
Ks : Dissociation constant
MAO : Monoamine oxidase
MnSOD : Manganese-superoxide dismutase
Mr : Molecular weight
mRNA : Messenger ribonucleic acid
MRP1 : Multidrug resistance-associated protein 1
mtDNA : Mitochondrial DNA
MTT : 3-(4,5-dimethylthiazol-2-yl)-2,5-diphenyltetrazolium bromide
NADH : Nicotinamide adenine dinucleotide
NADPH : Nicotinamide adenine dinucleotide phosphate
Native-PAGE : Native-polyacrylamide gel electrophoresis
nDNA : Nuclear DNA
NO : Nitric oxide
NOS : Nitric oxide synthase
NO2+ : Nitrosonium cation
NPC : Nasopharyngeal carcinoma
O2.-
: Superoxide radical
O22- : Peroxide
ONOO- : Peroxynitrite
PDT : Photodynamic therapy
Page 11
xi
Q10 : Temperature coefficient
RNS : Reactive nitrogen species
RO. : Alkoxy
ROO : Peroxy
ROOH : Organic hydroperoxide
ROS : Reactive oxygen species
RSNOs : S-nitrosothiols
SDS : Sodium dodecyl sulfate
SDS-PAGE : Sodium dodecyl sulfate-polyacrylamide gel electrophoresis
Se-H : Selenol
Se-OH : Selenenic acid
Se-SG : Glutathiolated selenol
SOD : Superoxide dismutase
TEMED : N, N, N’, N’-tetramethylethylenediamine
TRS : Thiol redox state
Trx : Thioredoxin
TrxR : Thioredoxin reductase
Vmax : Maximum velocity
Page 12
xii
LIST OF FIGURES
Page No
Figure 2.1 Action mechanism of glutathione reductase and
glutathione peroxidase
3
Figure 2.2 Top view of the structure of homodimeric Glr1 4
Figure 2.3 Action mechanism of glutathione reductase 5
Figure 2.4 Glutathione synthesis 6
Figure 2.5 Electron structures of common reactive oxygen species 7
Figure 2.6 Oxidative stress and related diseases 9
Figure 2.7 Mitochondrial electron transport chain as a main source
of free radicals and antioxidant defense systems
10
Figure 2.8 The overall antioxidant enzymes, the reactions and
detoxification of free radicals
14
Figure 2.9 Antioxidant systems and their locations 15
Figure 2.10 Detoxification of peroxides by glutathione peroxidase 17
Figure 2.11 Detoxification of xenobiotics by GST 18
Figure 2.12 Mechanism of SOD in scavenging of superoxide (O2•−) 19
Figure 2.13 Mechanism of action of TrxRs 20
Figure 2.14 Structure of hypericin 21
Figure 4.1 Determination of the enzyme concentration by Bradford
assay
33
Figure 4.2 Visualization of GR enzyme on discontinuous native-
PAGE
34
Figure 4.3 Visualization of GR enzyme on discontinous native-
PAGE by silver staining
35
Figure 4.4. A Glutathione reductase enzyme on discontinuous SDS-
PAGE by Coomassie Brilliant Blue R-250 staining
36
Figure 4.4. B Log Mr vs Rf plot 36
Figure 4.5 Glutathione reductase enzyme on discontinuous SDS-
PAGE by silver staining
37
Page 13
xiii
Figure 4.6. Zero buffer extrapolation. ∆A/min vs buffer
concentration
38
Figure 4.7 ∆A/min vs. pH plot 38
Figure 4.8.A Specific activity vs. temperature plot 40
Figure 4.8.B Log (Sp. Act.) U/mg protein vs. 1/T plot 40
Figure 4.9 Kinetic behavior of glutathione reductase with variable
GSSG concentrations
41
Figure 4.10 Kinetic behavior of glutathione reductase with variable
NADPH concentrations
42
Figure 4.11 Dose dependent inhibition of glutathione reductase by
hypericin
43
Figure 4.12 Michaelis-Menten plot for glutathione reductase
enzyme with different concentrations of hypericin using
GSSG as a variable substrate
44
Figure 4.13 Lineweaver-Burk plot for glutathione reductase enzyme
with different concentrations of hypericin using GSSG
as a variable substrate
45
Figure 4.14 Kmapp vs. hypericin and slope of the reciprocal vs.
hypericin plots
46
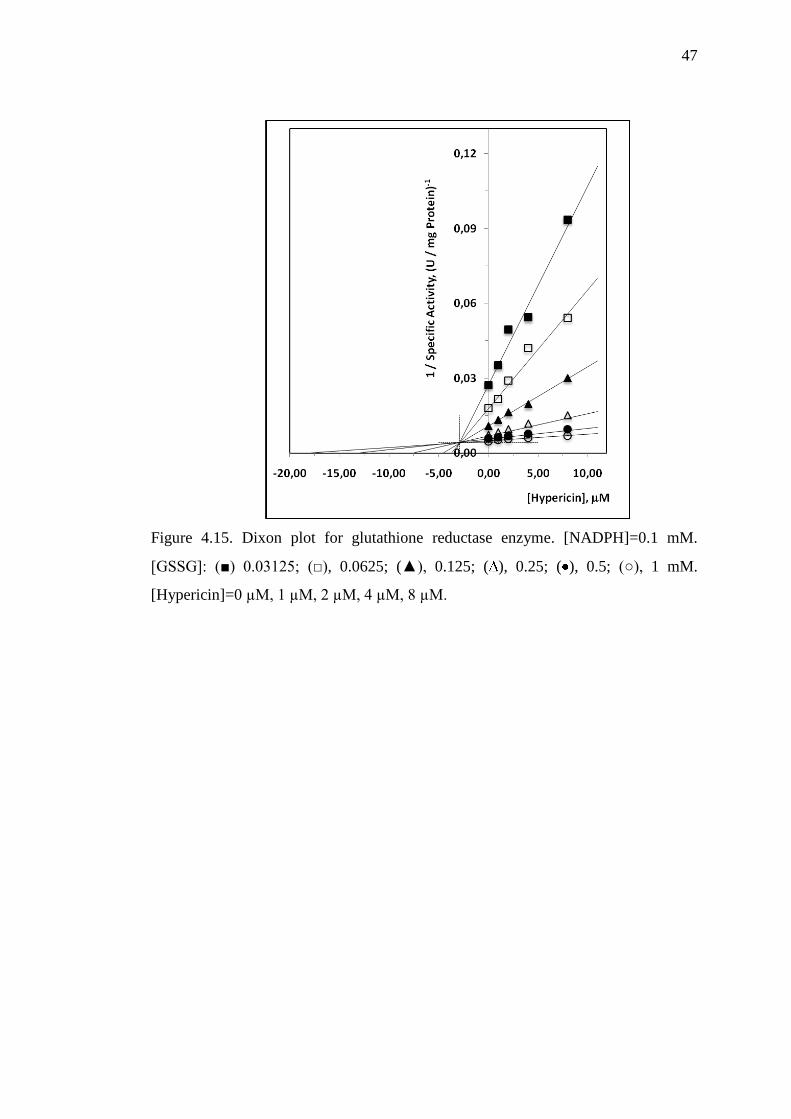
Figure 4.15 Dixon plot for glutathione reductase enzyme 47
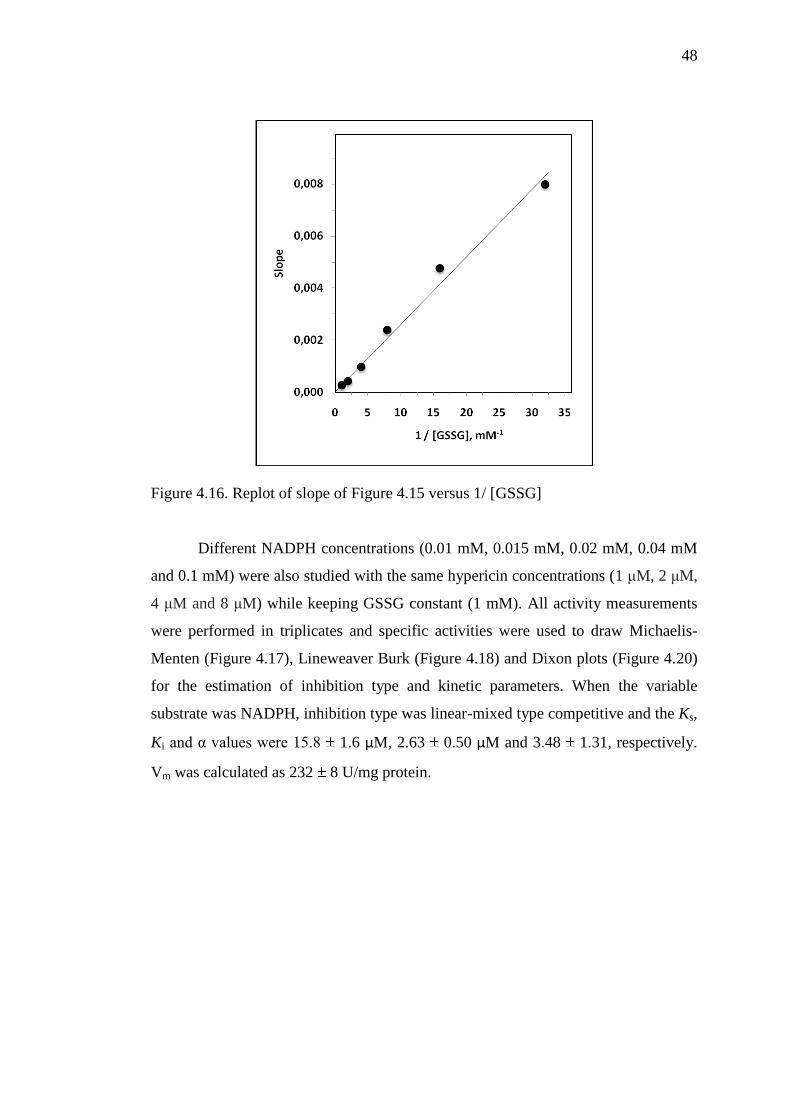
Figure 4.16 Replot of slope of Figure 4.15 versus 1/[GSSG] 48
Figure 4.17 Michaelis-Menten plot for glutathione reductase
enzyme with different concentrations of hypericin using
NADPH as a variable substrate
49
Figure 4.18 Lineweaver-Burk plot for glutathione reductase enzyme
with different concentrations of hypericin using
NADPH as a variable substrate
50
Figure 4.19 Replot of slope and intercept points of Figure 4.18
versus [I]
51
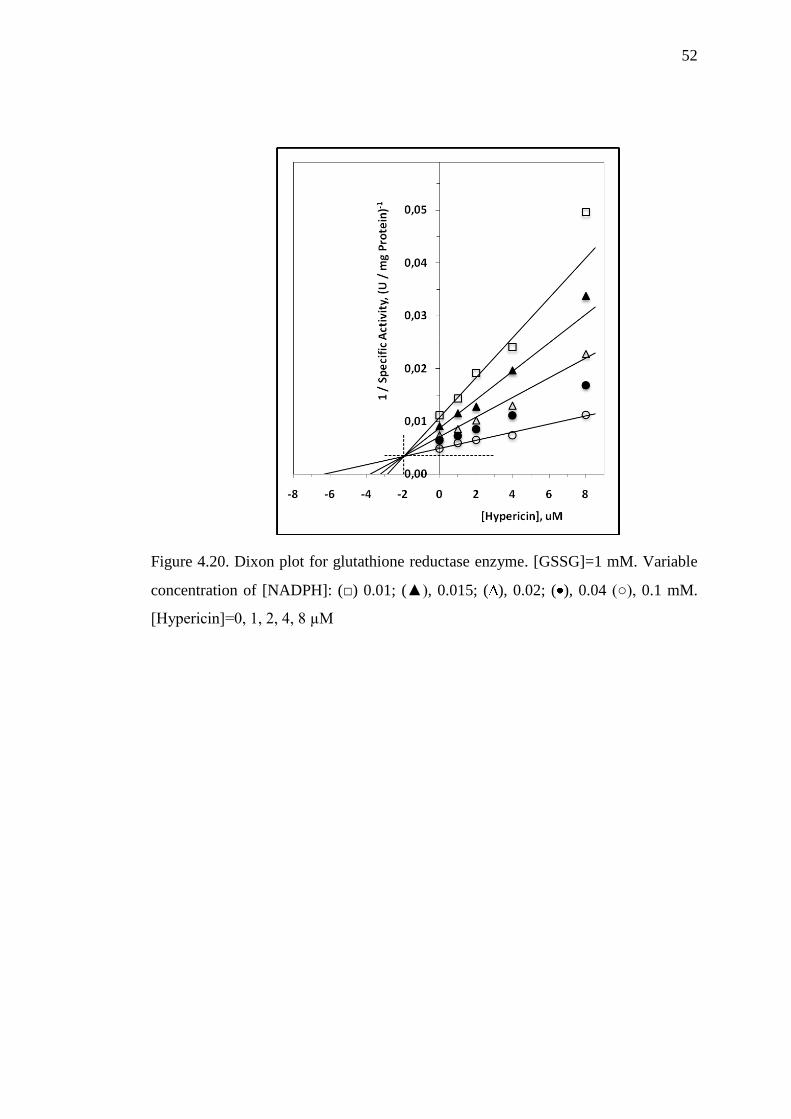
Figure 4.20 Dixon plot for glutathione reductase enzyme 52
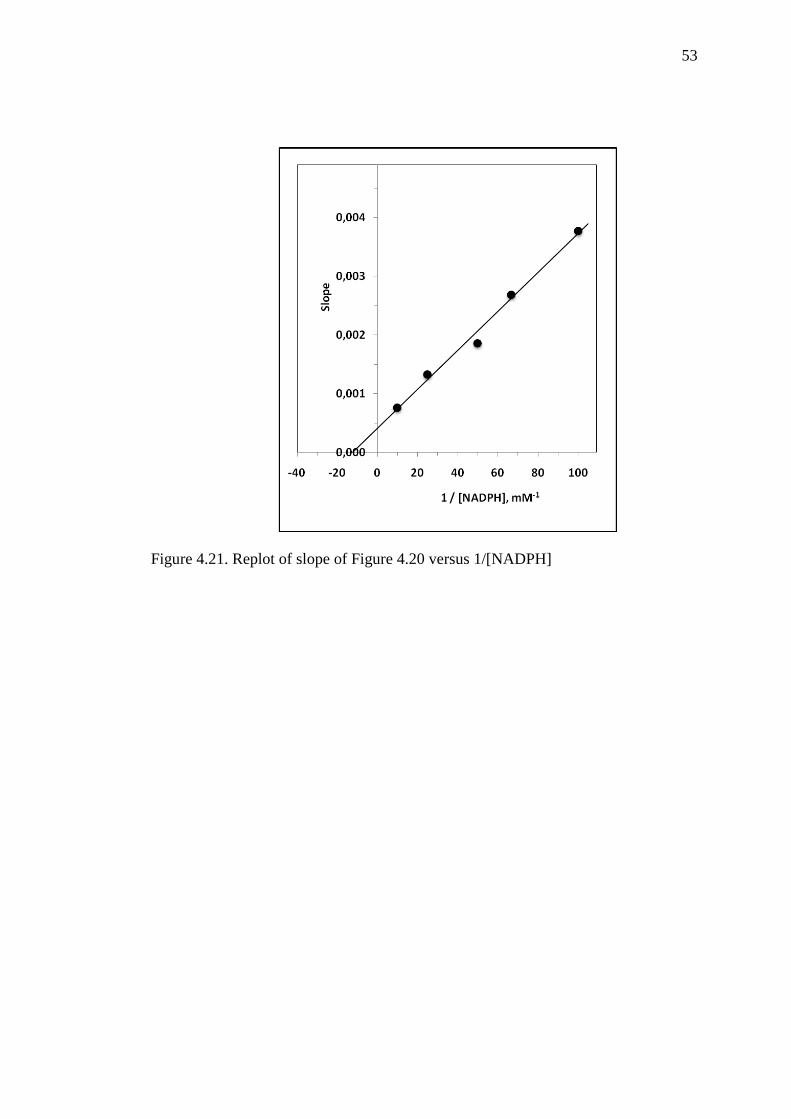
Figure 4.21 Replot of slope of Figure 4.20 versus 1/[NADPH] 53
Page 14
xiv
LIST OF TABLES
Page No
Table 2.1. Description of free radicals 12
Table 3.1. Volumes used in gel preparation of native-PAGE 24
Table 3.2. Volumes used in gel preparation of SDS-PAGE 27
Page 15
1
1. INTRODUCTION
Human body and other organisms including plants are exposed to oxidative
stress which may have exogenous sources such as ultraviolet light, ionizing radiation,
environmental toxins, chemotherapeutics and inflammatory cytokines or endogenous
sources such as cytochrome p450, mitochondria, peroxisomes, lipoxygenases,
photosynthesis and NADPH oxidases. Oxidative stress causes a vital damage to the
cell and tissues in all organisms if it is not controlled by antioxidants enzymatically
(glutathione reductase, catalase, glutathione peroxidase, glutathione-S-transferase) or
non-enzymatically (vitamin C, vitamin D, vitamin E and carotenoids) (Finkel et al.,
2000). Since oxidative stress is responsible for the generation of reactive oxygen
species (ROS) and reactive nitrogen species (RNS), it induces many chronic diseases
including cancer (Valko et al., 2006). It also causes atherosclerosis (Bonomini et al.,
2008), diabetes (Asmat et al., 2016), rheumatoid arthritis (Wruck et al., 2011), post-
ischemic perfusion injury (Raedschelders et al., 2012), ischemic stroke (Allen and
Bayraktutan, 2009), myocardial infarction (Di Filippo et al., 2006), cardiovascular
diseases (Dhalla et al., 2000) and chronic inflammation (Khansari et al., 2009).
Glutathione reductase (GR) is a homodimeric FAD-dependent enzyme and
belongs to the flavoprotein disulfide oxidoreductase family which participates in the
regulation of cellular redox system. The active site of the enzyme contains FAD as a
prosthetic group which is reduced by the cofactor NADPH to semiquinone of FAD (a
sulfur radical and thiol). Then reduced GR reacts with one molecule of oxidized
glutathione (GSSG) leading to the breakdown of disulfide bond which produces a
molecule of reduced glutathione (GSH) and GR-SG complex. The second electron
from NADPH leads to the breakdown of other disulfide bond in GR-SG complex and
second GSH is formed. GR is restored to its oxidizing phase for another enzymatic
mechanism (Berkholz et al., 2008). Despite GR is responsible for regeneration of
oxidized glutathione, it reduces oxidized glutathione peroxidase to scavenge organic
and inorganic peroxides (Igor et al., 2013). Yeast mutant that lack of GR (glr1 delta)
showed 200 fold increase in the level of oxidized glutathione which represents 63%
of total glutathione. Also in case of mutant thioredoxin (trx1 delta, trx2) high level of
oxidized glutathione was observed (Muller, 1996).
Page 16
2
Human GR is encoded by a single gene located on chromosome 8p21.1 and
composed of 13 exons. GR deficiency is a very rare condition only in case of
hemolytic anemia which leads to a decrease or complete absence of the activity of
GR (Kamerbeek et al., 2007).
Hypericin is one of the active compounds in St. John’s Wort, botanically known
as Hypericum perforatum. It has come into prominence in the treatment of depression,
anxiety, injury of burns and wound-healing. Recent studies recommend an adequacy of
this herb in treating different afflictions including cancer, inflammation related
disorders, antibacterial and antiviral infections. Hypericin is highly photoreactive, due
to its four hydroxyl groups that are situated contiguous two carbonyl groups. In the
presence of fluorescent light hydroxyl hydrogen can be transferred between the
hydroxyl oxygen and the carbonyl oxygen (Kenneth et al., 2011). Analysis of the
fluorescence range of hypericin and its analogs shows the presence of a "protonated"
carbonyl group, supporting the H-atom transfer reactions (Petrich, 2000). Hypericin has
a strong potential in photodynamic therapy (PDT) because of its photosensitizing
effects upon irradiation, minimum toxicity and ability to induce necrosis and apoptosis
at very low concentrations in a light dependent manner. It also has role in programmed
cell death by promoting several pathways (Agostinis et al., 2002). Inhibition of GR by
various compounds have been shown before such as 2-acetylamino-3-[4-(2-
acetylamino-2carboxyethylsulfanylthiocarbonylamino) phenylthiocarbamoylsulfanyl]
propionic acid (2-AAPA). Although the inhibition of the enzyme was shown, inhibition
had no effect on the levels of ROS, GSH biosynthesis enzymes and other antioxidant
enzymes, lead to a decline in GSH/GSSG ratio, elevation of NADH/NAD+ and
NADPH/NADP+ ratios and an increase in protein glutathionylation. 1,3-bis (2-
chloroethyl)-1-nitrosourea (BCNU) is a GR inhibitor. It is used in rabbit lenses in order
to indicate the defensive function of GR against oxidative injury. After the lenses were
exposed to a constant concentration of H2O2, a significant decrease in reduced GSH
level was observed.
The aim of this study was to characterize the GR by determining its molecular
mass (Mr), pH and temperature optimum. We also tried to elucidate the effect of
hypericin on the kinetic behavior of GR purified from baker’s yeast.
Page 17
3
2. GENERAL INFORMATION
2.1. Glutathione Reductase
Glutathione reductase (GR, E.C. 1.6.4.2), also known as glutathione-disulfide
reductase, is a homodimeric flavoprotein enzyme with a molecular weight of 104
kDa. It is found in almost all organisms. It has a main role in producing reduced
glutathione (GSH) which has a role in scavenging of free radicals and functions in
the cellular control of reactive oxygen species (ROS) that are generated by oxidative
stress and xenobiotics, especially in cells with aerobic metabolism. GR, by utilizing
NADPH as an electron donor which is generated by pentose phosphate pathway and
using FAD as a prosthetic group, produces two reduced glutathione (GSH) molecules
from oxidized glutathione (GSSG). GR works parallel with glutathione peroxidase
against free radicals and they are the major keys of the antioxidant defense system
(Figure 2.1) and inhibition of these antioxidant enzymes causes cell injury and
probably death (Tandoğan and Ulusu, 2007).
Figure 2.1. Action mechanism of glutathione reductase and glutathione peroxidase.
Glutathione reductase (GR) reduces GSSG to GSH by utilizing NADPH that is
supplied from pentose phosphate pathway by glucose-6-phosphate dehydrogenase
(G6PD) which is necessary to maintain the cofactors for the activation of GPx-1
(Lubos et al., 2011)
Studies showed that inhibition of GR causes a decrease in GSH and increase
in GSSG, and ratios of NADH/NAD+ and NADPH/NADP
+ increase. On the other
hand, inhibition does not influence the development of free radicals and other
enzymes of antioxidant defense system (Zhao et al., 2009). Glutathione reductase
inhibitors were appeared to have anticancer (Li et al., 2010) and antimalarial actions
Page 18
4
(Bauer et al., 2006). The inhibition of GR by Thiram reduces the activity of enzyme
and causes a decrease in GSH and accumulation of GSSG (Cereser et al., 2001).
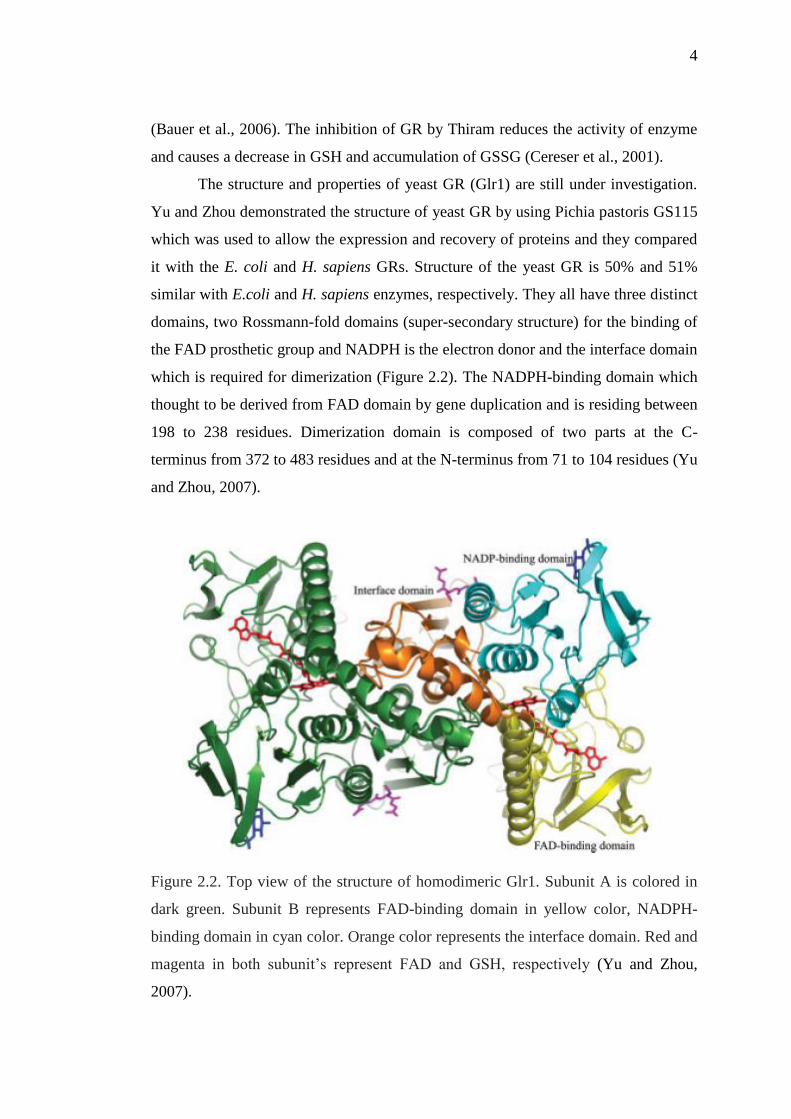
The structure and properties of yeast GR (Glr1) are still under investigation.
Yu and Zhou demonstrated the structure of yeast GR by using Pichia pastoris GS115
which was used to allow the expression and recovery of proteins and they compared
it with the E. coli and H. sapiens GRs. Structure of the yeast GR is 50% and 51%
similar with E.coli and H. sapiens enzymes, respectively. They all have three distinct
domains, two Rossmann-fold domains (super-secondary structure) for the binding of
the FAD prosthetic group and NADPH is the electron donor and the interface domain
which is required for dimerization (Figure 2.2). The NADPH-binding domain which
thought to be derived from FAD domain by gene duplication and is residing between
198 to 238 residues. Dimerization domain is composed of two parts at the C-
terminus from 372 to 483 residues and at the N-terminus from 71 to 104 residues (Yu
and Zhou, 2007).
Figure 2.2. Top view of the structure of homodimeric Glr1. Subunit A is colored in
dark green. Subunit B represents FAD-binding domain in yellow color, NADPH-
binding domain in cyan color. Orange color represents the interface domain. Red and
magenta in both subunit’s represent FAD and GSH, respectively (Yu and Zhou,
2007).
Page 19
5
Studies aimed to demonstrate the catalytic site and the overall mechanism of
glutathione reductase revealed that the reaction takes place in two steps. The first
step is called reductive half state in which NADPH binds to GR, leading to the
reduction of prosthetic group FAD. The reduced flavin then breaks quickly a
disulfide bond between Cys58-Cys63 forming short living covalent bond with Cys63.
This interaction is followed by the charge transfer between flavin and Cys63 thiolate
and oxidized NADP+
is replaced with the new NADPH. In the second step which is
called oxidative half state, Cys58 binds to the GSSG and makes a nucleophilic attact
to the first cysteine of GSSG and forms a mixed disulfide complex Cys58–GS,
leading to a formation of the first reduced glutathione (GSH). After the second GSH
is produced, Cys58-Cys63 form new disulfide bond and are ready for the reduction of
another GSSG (Berkholz et al., 2008) (Figure 2.3).
Figure 2.3. Action mechanism of glutathione reductase (Berkholz et al., 2008)
2.2. Glutathione
The tripeptide gamma-glutamyl-cysteinyl-glycine is the most common non-
protein thiol peptide in almost all living organisms. It plays important roles in
antioxidant defense mechanisms and xenobiotic detoxification because it is a
cofactor for several antioxidant enzymes. It also has a role in several cellular
processes like DNA and protein synthesis, immune response, signal transduction, cell
Page 20
6
proliferation and cytokine production. Glutathione is synthesized by the consequtive
action of two cytosolic enzymes, glutamate-cysteine ligase and glutathione
synthetase (Figure 2.4). Glutathione synthesis is regulated by the presence of
cysteine, glutamate-cysteine ligase activity and also by feedback inhibition of
glutathione (Lu, 2013).
Figure 2.4. Glutathione synthesis (Lu, 2013).
Synthesis of glutathione takes place in two-steps and there is a requirement
for ATP. The first step is catalyzed by glutamate-cysteine ligase (GCL), which
consists of two subunits, the catalytic (GCLC) and modifier (GCLM) subunits. It
integrates cysteine with glutamate, producing γ-glutamylcysteine. The second step is
the addition of glycine to γ-glutamylcysteine to form γ-glutamylcysteinylglycine
(glutathione) which is catalyzed by glutathione synthetase. Glutathione is the
feedback inhibitor of GCL (Lu, 2013).
Glutathione deficiency induces many pathologic diseases including
Kwashiorkor (Becker et al., 2005), seizure (Pence et al., 2009), neurodegenerative
diseases like Alzheimer's disease (Pocernicha et al., 2012), Parkinson's disease
(Smeyne and Smeyne, 2013), cystic fibrosis (Roum et al., 1985), AIDS (Herzenberg
et al., 1997), liver disease (Yuan and Kaplowitz, 2009) and sickle cell anemia (Gizi
et al., 2011). Studies have shown that glutathione has a crucial effect on lifespan and
aging because the concentration of glutathione parallels the telomerase activity
(Borrás et al., 2004). The depletion of glutathione leads to the accumulation of
Page 21
7
mtDNA damage due to the free radicals and mitochondria loose most of their
function (Wei et al., 2001).
2.3. Oxidative Stress
Oxidative stress is an irregularity between the formation of free radicals
(reactive oxygen species) and antioxidant defense system (Betteridge, 2000).
Reactive oxygen species (ROS) are formed as by-products of natural biological
processes during cellular metabolism and additionally, reactive nitrogen species
(RNS) that outcome from the cellular redox processes. Free radicals can be
characterized as any molecule that contain an unpaired electron in their orbits (Figure
2.5). Most of the radicals are very reactive and unstable. They act as oxidizing or
reducing molecules due to their ability to donate or accept an electron from other
molecules (Lobo et al., 2010).
Figure 2.5. Electron structures of common reactive oxygen species. The red •
designates unpaired electron.
Oxidants can influence a number of cell signaling pathways and regulate
multiple gene expressions in eukaryotic cells. Change in the oxidation-mediated gene
expression involves changes in transcription, mRNA stability, flexibility and signal
transduction. Moreover, many genes associated with the oxidation products have
Page 22
8
been identified, including antioxidant enzymes, stress proteins, DNA repair proteins
and proteins of mitochondrial electron transport chain (Powers and Jackson, 2008).
2.3.1. Generation Reactive Oxygen Species in the Human Body
In recent years, there has been a great attention to deal with the field of
chemistry of free radicals. They are generated as reactive oxygen species (ROS) and
reactive nitrogen species (RNS) by various endogenous systems, exposure to
different physical conditions and pathological states. Free radicals and ROS derive
either from basic natural metabolic processes in the human body or from external
sources such as exposure to UV light irradiation, X-rays, gamma rays, ozone,
cigarette smoking, air pollution and industrial chemicals. Continuous formation of
free radicals in cells occurs due to both enzymatic and non-enzymatic reactions.
Enzymatic reactions, which serve as a source of free radicals include respiratory
chain (Cadenas and Davies, 2000), prostaglandin synthesis (Sienko et al., 1991),
phagocytosis (Johnston et al., 1975) and cytochrome P-450 system (Dostalek et al.,
2008). Free radicals can also be formed in the enzymatic reactions in which
molecular oxygen is involved (Lobo et al., 2010).
The generation of ROS can harm multi-organelle cells which could upset
inevitably physiology of numerous molecules, for example, lipids, proteins and
DNA. Additionally, ROS generation is exhibited in an assortment of diseases, for
example, asthma (Henricks and Nijkamp et al., 2001), atherosclerosis (Kisucka et al.,
2008), respiratory fibrosis (Bocchino et al., 2010), hypertension (Kitiyakara and
Wilcox, 1998), apoptosis (Ott et al., 2007), diabetes retinopathy (Kowluru, 2003) and
enactment of proto-oncogenes by starting signal transduction pathways (Korsmeyer
et al., 1995) (Figure 2.6). The nature of the injury will ultimately depend on specific
molecular interactions, cellular locations, and timing of the insult (Auten and Davis,
2009).
Due to the localization of the mitochondrial electron transport chain for
oxygen consuming respiration, mitochondria is a noteworthy hotspot for the
generation of ROS. Other mechanisms such as cytoplasmic enzyme systems, the
surface of the plasma membrane and endoplasmic reticulum-bound catalysts also
contribute to the formation of ROS. Oxygen is a special structure and is fundamental
Page 23
9
Free RadicalsOxidative Stress
a a
for the survival of all aerobic organisms. Its two unpaired electrons in separate orbits
in the outer electron shell makes oxygen favorable for radical formation by accepting
free electrons formed by ordinary oxidative metabolism. Series of sequential steps by
the addition of electrons lead to the formation of several ROS including superoxide,
hydrogen peroxide and hydroxyl radical (Auten and Davis, 2009) (Figure 2.5).
Figure 2.6. Oxidative stress and related diseases (CC treatment 2015).
Since mitochondria are the principal site for the formation of free radicals,
they contain variety of antioxidants which are available on both sides of the
membrane to decrease the ROS and minimize oxidative stress (Figure 2.7). For
example xanthine oxidase is a form of xanthine oxidoreductase that is capable of the
development of superoxide radicals by catalyzing hypoxanthine to xanthine then
xanthine to uric acid conversions. During these steps, molecular oxygen is reduced to
form superoxide anion and further hydrogen peroxide (Chiricolo et al., 1991).
Comparing with nuclear DNA (nDNA), age-related accumulation of oxidative stress
markers in mtDNA were detected in human brain. There was a 10 times difference in
Page 24
10
the 8-OHdG amount between mtDNA and nDNA. The difference further increased
to 15 times when the patients ages were over 70 (Mecocci et al., 1993).
Figure 2.7. Mitochondrial electron transport chain as a main source of free radicals
and antioxidant defense systems. When the electrons pass through the complex I and
complex III, superoxide (O2•–
) radical is produced and it is converted to hydrogen
peroxide (H2O2) by manganese superoxide dismutase (MnSOD) enzyme located in
the mitochondrial matrix or copper zinc superoxide dismutase (CuZnSOD) located in
the intermembrane space. Then H2O2 is reduced by glutathione peroxidase or
catalase enzymes to water. Oxygen molecule is reduced to water as a result of the
electron flow through complex IV and by using the proton (H+) gradient complex V
converts ADP to ATP. Ca2+
has an influence in generation of ROS by accelerating
the Krebs cycle, inducing the loss of cytochrome c and activating nitric oxide
synthase (NOS) in turn it inhibits complex IV, resulting the generation of ROS (Yu
et al., 2012).
Page 25
11
Studies demonstrated that cytochrome p450 enzyme family is a major source
for the generation of free radicals due to its important role in metabolism of drugs,
xenobiotics, fat-soluble vitamins, carcinogens and eicosanoids (Dostalek et al.,
2008). Knockout (CYP2E1-null mice) mice have been developed to understand the
role of cytochrome p450s in toxicity and oxidative stress. Administration of
analgesic drug acetaminophen to null mice resulted in high level toxicity and
elevated production of ROS (Gonzalez, 2005).
Peroxisomes are the other major site of ROS due to their oxygen consuming
metabolic processes. Although peroxisomes have a respiratory pathway, it is not
coupled to ATP synthesis. Instead transfer of electrons in peroxisomes results in heat
production. Peroxisomes also have many enzyme systems that their actions cause the
formation of ROS. For example acyl-CoA oxidase, involved in the β-oxidation of
fatty acids, whose action leads to the formation of H2O2. Since peroxisomes have
ROS scavenging enzyme systems, H2O2 is reduced to water and oxygen molecules
by catalase or by glutathione peroxidase (Schrader and Fahimi, 2006).
2.3.2. Generation of Reactive Nitrogen Species
Reactive nitrogen species (RNS) are a family of molecules derived from nitric
oxide (NO) which is a hybrid of nitrogen and oxygen and it has one unpaired
electron so it is less reactive than molecular oxygen (Pacher et al., 2007). NO is an
intracellular messenger and a physiological regulator of neural and cardiovascular
activity. NO is produced from L-arginine by three main isoforms of nitric oxide
synthase (NOS) enzyme (Adams et al., 2015). RNS include nitroxyl (HNO),
nitrosonium cation (NO+) and higher oxides of nitrogen, S-nitrosothiols (RSNOs),
and dinitrosyl iron complexes (Table 2.1). Interactions of RNS with ROS have been
detected in cell injury and death and their potential cellular targets are lipids, DNA
and proteins. Harmful effects of RNS depend on their concentration under
physiologic conditions (Martínez and Andriantsitohaina, 2009).
Page 26
12
Table 2.1. Description of free radicals (Lobo et al., 2010)
Free radicals Description
O2.-
(Superoxide
radical)
Produced by addition one electron to O2. Formed by the
electron transport chain and several auto-oxidation reactions.
Fe2+
from iron-sulfur proteins and ferritin give one electron
to O2 and form superoxide (Fenton recation). It can form
H2O2 when undergoes dismutation spontaneously or by
enzymatic catalysis and is a precursor for metal-catalyzed
OH.radical formation.
H2O2
(Hydrogen
peroxide)
Two-electron reduced state. Formed by dismutation of O2.-
or by direct reduction of O2. Lipid soluble which is able to
diffuse across the membranes.
OH.
(Hydroxyl radical)
Three-electron reduction state. Formed by Haber-Weiss
reaction and decomposition of peroxynitrite. Very reactive,
attack most cellular components.
ROOH
Organic
hydroperoxide
Produced by radical reactions with cellular components.
RO. Alkoxy
ROO Peroxy
Produced in the presence of oxygen by radical addition to
double bonds or hydrogen abstraction.
HOCl
(Hypochlorous
acid)
Formed from H2O2 by myeloperoxidase. Lipid soluble and
highly reactive. Oxidizes protein molecules including thiol
groups, amino groups and methionine.
ONOO-
(Peroxynitrite)
Formed by rapid reaction between O2.-
and NO. Lipid
soluble. Protonation forms peroxynitrous acid which
undergoes homolytic cleavage to form hydroxyl radical and
nitrogen dioxide.
Page 27
13
2.3.3. Beneficial Activities of ROS and RNS
Low or moderate concentrations of free radicals are crucial for the several
biological processes. They can act as powerful weapons against pathogenic and
invading microbes as a defense system of the body (Tatsuzawa et al., 1999) and are
regulatory mediators in signaling processes (Droge 2002). Because of its high
metabolic activity and high oxygen consumption, brain and neurons are prone to
damaging effects of ROS, but at physiological concentration, ROS have a role in
maintaining the necessary change in synaptic plasticity and therefore for normal
cognitive function (Massaad and Klann, 2011). The immune system produces free
radicals as a part of the defense system to protect the body. Phagocytes releases free
radicals to eliminate foreign invaders. Patients who suffer from granulomatous
diseases are unable to produce superoxide radical (O2•–
) because of the defective
membrane-bound NADPH oxidase system (Tauber et al., 1983). RNS have
physiological roles in the regulation of cellular signaling in various types of
nonphagocytic cells including endothelial cells, muscle cells, cardiac myocytes,
vascular smooth cells and thyroid tissue fibroblasts. Nitric oxide (NO) is an
intercellular messenger that has a role in blood flow, thrombosis and neural activity
(Murad, 1996; Pacher et al., 2007; Bryan et al., 2009).
2.4. Antioxidants
Antioxidants which are normally present in low amounts, are molecules
capable of donating an electron to stabilize and neutralize free radicals. Human body
contains highly complex antioxidant systems (enzymatic and non-enzymatic) which
interact easily with the free radicals to scavenge them and protect cells and organs
against vital damage. Antioxidants may have exogenous and endogenous sources
which means some of the antioxidant molecules can be synthesized during the
normal metabolism of the cell such as glutathione and uric acid; others must be
provided from dietary supplements (Khalid, 2007). Thus, antioxidants can be divided
into three categories: Antioxidant enzymes include catalase (CAT), glutathione
peroxidase (GPx), glutathione reductase (GR), superoxide dismutase (SOD) and
ceruloplasmin (Figure 2.8); chain breaking antioxidants include lipid phase
(tocopherols, ubiquinol, carotenoids and flavonoids) and aqueous phase (ascorbate,
Page 28
14
urate, glutathione and other thiols) and transition metal binding proteins include
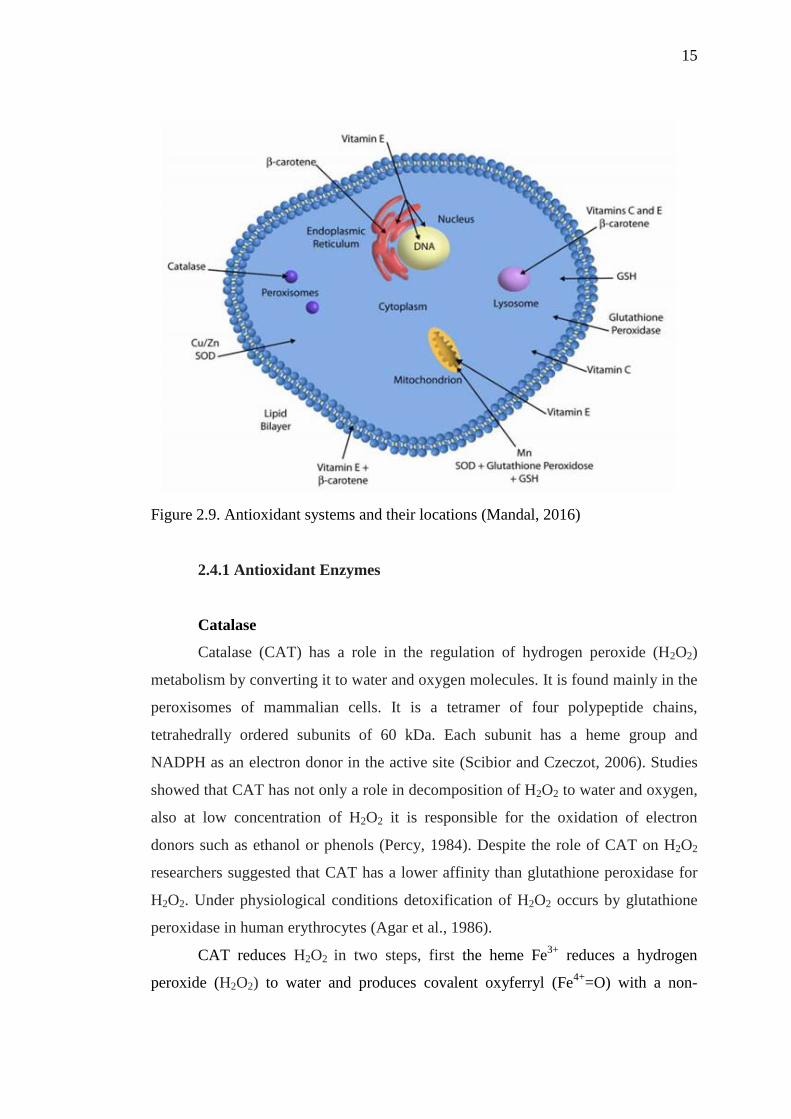
transferrin, ferritin and lactoferrin (Young and Woodside, 2001) (Figure 2.9).
Figure 2.8. The overall antioxidant enzymes, the reactions and detoxification of free
radicals (Weydert and Cullen, 2010). Figure illustrates the synthesis of glutathione,
formation of NADPH from glucose-6-phosphate by glucose-6-phosphate
dehydrogenase, reduction of GSSG to GSH by GR, convertion of O2•–
to H2O2 by
SOD, reduction of H2O2 to water and molecular oxygen by catalase or by GPx.
Page 29
15
Figure 2.9. Antioxidant systems and their locations (Mandal, 2016)
2.4.1 Antioxidant Enzymes
Catalase
Catalase (CAT) has a role in the regulation of hydrogen peroxide (H2O2)
metabolism by converting it to water and oxygen molecules. It is found mainly in the
peroxisomes of mammalian cells. It is a tetramer of four polypeptide chains,
tetrahedrally ordered subunits of 60 kDa. Each subunit has a heme group and
NADPH as an electron donor in the active site (Scibior and Czeczot, 2006). Studies
showed that CAT has not only a role in decomposition of H2O2 to water and oxygen,
also at low concentration of H2O2 it is responsible for the oxidation of electron
donors such as ethanol or phenols (Percy, 1984). Despite the role of CAT on H2O2
researchers suggested that CAT has a lower affinity than glutathione peroxidase for
H2O2. Under physiological conditions detoxification of H2O2 occurs by glutathione
peroxidase in human erythrocytes (Agar et al., 1986).
CAT reduces H2O2 in two steps, first the heme Fe3+
reduces a hydrogen
peroxide (H2O2) to water and produces covalent oxyferryl (Fe4+
=O) with a non-
Page 30
16
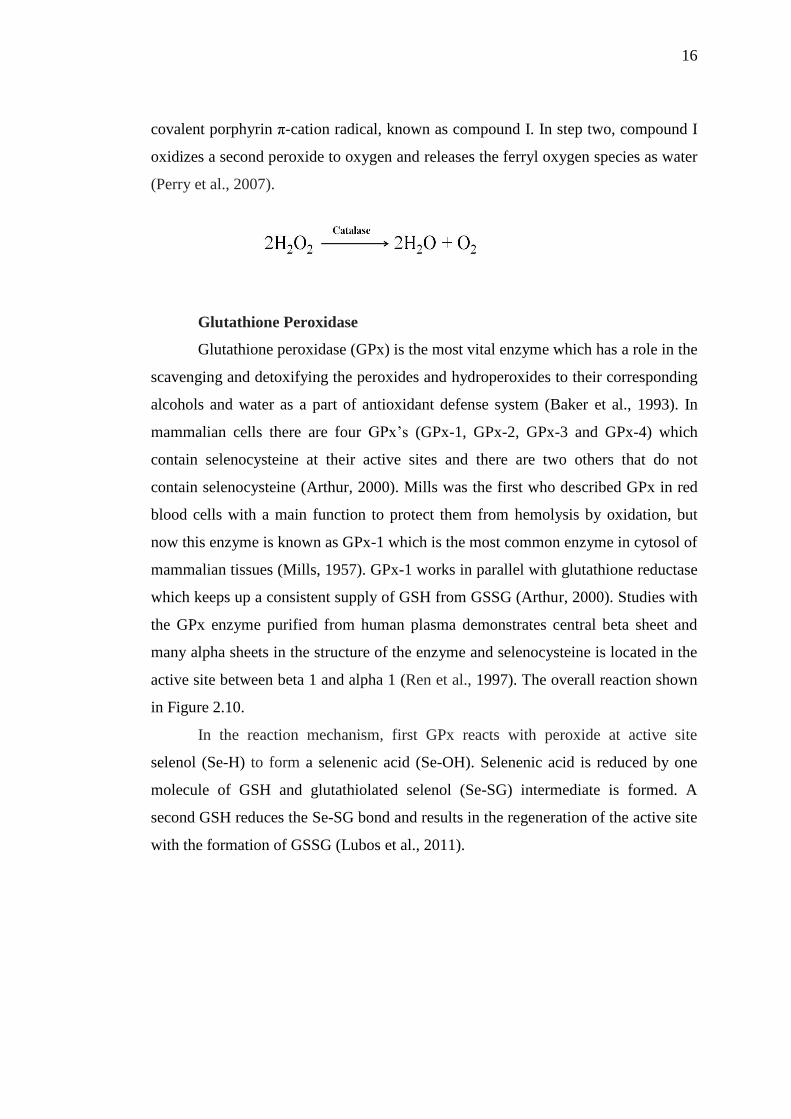
covalent porphyrin π-cation radical, known as compound I. In step two, compound I
oxidizes a second peroxide to oxygen and releases the ferryl oxygen species as water
(Perry et al., 2007).
Glutathione Peroxidase
Glutathione peroxidase (GPx) is the most vital enzyme which has a role in the
scavenging and detoxifying the peroxides and hydroperoxides to their corresponding
alcohols and water as a part of antioxidant defense system (Baker et al., 1993). In
mammalian cells there are four GPx’s (GPx-1, GPx-2, GPx-3 and GPx-4) which
contain selenocysteine at their active sites and there are two others that do not
contain selenocysteine (Arthur, 2000). Mills was the first who described GPx in red
blood cells with a main function to protect them from hemolysis by oxidation, but
now this enzyme is known as GPx-1 which is the most common enzyme in cytosol of
mammalian tissues (Mills, 1957). GPx-1 works in parallel with glutathione reductase
which keeps up a consistent supply of GSH from GSSG (Arthur, 2000). Studies with
the GPx enzyme purified from human plasma demonstrates central beta sheet and
many alpha sheets in the structure of the enzyme and selenocysteine is located in the
active site between beta 1 and alpha 1 (Ren et al., 1997). The overall reaction shown
in Figure 2.10.
In the reaction mechanism, first GPx reacts with peroxide at active site
selenol (Se-H) to form a selenenic acid (Se-OH). Selenenic acid is reduced by one
molecule of GSH and glutathiolated selenol (Se-SG) intermediate is formed. A
second GSH reduces the Se-SG bond and results in the regeneration of the active site
with the formation of GSSG (Lubos et al., 2011).
Page 31
17
Figure 2.10. Detoxification of peroxides by glutathione peroxidase (Lubos et al.,
2011)
Glutathione S-Transferase
Glutathione S-transferases (GSTs) are significant enzymes in phase II
detoxification system and found fundamentally in the cytosol of the mammalian
cells. GSTs catalyze the conjugation of the tripeptide glutathione (GSH) to an
assortment of hydrophobic, electrophilic and generally cytotoxic substrates and have
a role in cellular metabolism and detoxification of numerous xenobiotics such as
drugs, pollutants and pesticides (Figure 2.11). Mammalian cytosolic GSTs have been
classified into eight distinct classes (alpha, mu, pi, theta, kappa, zeta, omega, and
sigma) according to their substrate/inhibitor kinetics, structures and immunological
similarities (Sheehan et al., 2001; Josephy and David, 2010). Natural
hydroperoxides, epoxides, quinones and initiated alkenes are products of oxidative
metabolism and they are conceivable "regular" substrates for the GSTs (Mannervik
and Danielson, 1988).
Page 32
18
Figure 2.11. Detoxification of xenobiotics by GST. By using the reduced form of
glutathione (GSH), GST forms glutathione-S-conjugate via nucleophilic attack which
increases the solubility of the conjugate and leads to the elimination of the
xenobiotics (Townsend and Tew, 2003).
Superoxide Dismutase
Superoxide dismutase (SOD) is one of the vital antioxidant enzymes which
has a crucial role in scavenging of superoxide radical (O2•−) by converting it to the
oxygen molecule and hydrogen peroxide (H2O2) with a sole purpose of protecting
cells from damage during aerobic respiration (Perry et al., 2007). Mammalian SOD
consists of three distinct classes: copper and zinc SOD (Cu/Zn SOD) in cytoplasm,
known as SOD1; manganese SOD (Mn-SOD) in mitochondria, known as SOD2 and
copper and zinc SOD (Cu/Zn SOD) in extracellular medium, known as SOD3. Mn,
Zn and Cu are metals required for their catalytic activities (Fukai and Ushio-Fukai,
2011). In the case of SOD deficiency or inability in other antioxidant mechanisms,
the superoxide has many inflicts on pathogenic diseases such as aging, cancer,
cardiovascular diseases and neuron abnormalities (Perry et al., 2007). In order to
initiate SOD action, active site metals (Cu or Mn) undergo reduction and re-
oxidation to scavenge O2•− (Figure 2.12).
Page 33
19
Figure 2.12. Mechanism of SOD in scavenging of superoxide (O2•−) (Fukai and
Ushio-Fukai, 2011)
Thioredoxin Reductases
The thioredoxin reductases (TrxRs) is a homodimeric flavoprotein (10–12
kDa) of pyridine nucleotide-disulphide oxidoreductase family that includes
lipoamide dehydrogenase. They have an FAD as prosthetic group and NADPH
binding site and an active site with redox-active disulfide. During the reaction one
electron is transferred to the active site disulfide from NADPH via FAD (Figure
2.13). Cysteines in the conserved active site peptide (Trp-Cys-Gly-Pro-Cys-Lys)
undergo oxidation and reduction. In the reaction mechanism by using the electrons
and protons provided by NADPH, thioredoxin (Trx) and/or ascorbate are converted
to their reduced forms. Reduced Trx is essential for the activities of Trx peroxidase
and ribonucleotide reductase enzymes and transcription factors (Mustacich and
Powis, 2000).
Page 34
20
Figure 2.13. Mechanism of action of TrxRs (Mustacich and Powis, 2000)
2.5. Hypericin
Hypericin (C30H16O8) is one of the active ingredient of Hypericum
perforatum (St. John’s Wort). It is a naturally occurring red color pigment with a
molecular weight of 504.45 g/mol. It can be also synthesized from anthraquinon
emodin (Figure 2.14). It is a multi potential drug in medical application which has an
antidepressant, antimicrobial and virostatic effects and is used in photodynamic
therapy (PDT) of several oncological (malignant and some non-malignant) diseases.
Hypericin inhibits the reuptake of the serotonin, dopamine and norepinephrine in a
dose-dependent manner due to its ability to pass through the blood-brain barrier
(Assad et al., 2011). It also has an inhibitory effect on various enzymes such protein
kinase C (PKC) (Sørensen et al., 2010), NADPH oxidase (Nishiuchi et al., 1995) and
TNF-α-induced tyrosyl phosphorylation of neutrophil (Nishiuchi et al., 1995).
Recently it has been shown that hypericin decreases the therapeutic availability of
some chemotherapeutic drugs like cisplatin and mitoxantrone by increasing the
expression of multidrug resistance-associated protein 1 (MRP1) and breast cancer
Page 35
21
resistance protein (BCRP), thus it mediates the development of drug resistance
(Jendželovská et al., 2014).
Figure 2.14. Structure of hypericin (Loren, 1999)
Photodynamic therapy (PDT) involves the utilization of photosensitizing
agent, which is activated by light with a proper wavelength and further leads to the
destruction of the target cell (Abhishek et al., 2012). PDT is initiated by the
accumulation of the photosensitizing agent in the hyperproliferative target cells
selectively. In the presence of oxygen, local irradiation results in the formation of
free radicals. Eventually target cells will die by apoptosis or necrosis (Luksiene,
2003; Maduray and Davids, 2011). Hypericin is a selective anti-cancer
photosensitizing agent with high photon yield without any toxic effects (Barathan et
al., 2013). Photodynamic therapy with hypericin induces apoptosis in human
umbilical vein endothelial cells in the presence of molecular oxygen which is
required to generate ROS (Zhang et al., 2015). In vitro testing of hypericin in
squamous cell carcinoma revealed that hypericin is useful in PDT when it is used in
0.2–0.5 μg/ml concentration range and 593 nm laser light irradiation is applied (Head
et al., 2006). In vivo hypericin administration with laser phototherapy has role in
decreasing pancreatic cancer growth (Kwan et al., 2000). Also hypericin controls
tumor cell growth in nasopharyngeal carcinoma (NPC) in vivo (Yee et al., 2005).
Page 36
22
3. MATERIALS AND METHODS
3.1. Chemicals
Potassium phosphate (monobasic and dibasic), Reduced nicotinamide
adenine dinucleotide phosphate (NADPH), trizma base, ammonium persulfate, silver
nitrate, formaldehyde, dichlorophenol indophenol, 2-mercaptoethanol, glycerol,
bovine serum albumin, bromophenol blue, N,N’-methylenebisacrylamide,
glutathione reductase from baker’s yeast, N,N,N’,N’-tetramethylethylenediamine,
Glycine ,Acrylamide, Ethanol, methanol, sodiumthiosulfate, sodium azide, sodium
carbonate, dimethyl sulphoxide (DMSO) and 3-(4,5-dimethylthiazol-2-yl)-2,5-
diphenyltetrazolium bromide (MTT) were purchased from sigma Aldrich (St. Louis,
MO, USA). Coomassie Brilliant Blue R-250 and Coomassie Brilliant Blue G-250
were procured from Fluka (Steinhein, Germany). Oxidized glutathione was taken
from Fluka (Switzerland). Acetic acid and ethanol were obtained from Riedel-de
Haёn (Germany). Orthophosphoric acid is acquired from Applichem (Darmstadt
Germany). Roti-mark standard was obtained from Carl Roth GmbH (Karlsruhe,
Germany). Hypericin was purchased from Alexis Biochemical (Lausen,
Switzerland).
3.2. Methods
3.2.1. Preparation of Glutathione Reductase
Baker’s yeast glutathione reductase (GR) was procured from Sigma Aldrich
(St. Louis, MO, USA). Enzyme suspension contained 3.6 M ammonium sulfate and
0.1 M dithiothreitol. Enzyme was centrifuged at 20800 xg for 20 minutes at 4oC in
order to remove ammonium sulfate. After centrifugation, supernatant was separated,
pellet was dissolved in 20 mM phosphate buffer pH 7.4 and used in the experiments.
3.2.2. Determination of Protein Concentration by Bradford Assay
Bradford assay is the most common method used to determine the protein
concentration (Bradford, 1976). The Coomassie Brilliant Blue G-250 is acidic dye
which specifically binds basic amino acids (histidine, lysine and arginine). Upon
formation of dye-protein complex the wavelength shifts from 470 nm to 595 nm.
Page 37
23
Bradford reagent was prepared as follows: Coomassie Brilliant Blue G-250
(25 mg) was was mixed with 12.5 ml of absolute ethanol in order to dissolve the dye.
Then 25 ml of 85% of orthophosphoric acid was added and final volume was brought
to 250 ml with distilled water. The reagent was filtered by Whatman No: 1 filter
paper and stored in dark at room temperature.
As a standard bovine serum albumin (BSA) was used. Six different BSA
concentrations (50 μg/ml, 100 μg/ml, 200 μg/ml, 300 μg/ml, 400 μg/ml and 500
μg/ml) were prepared by diluting 1 mg/ml of stock BSA solution. Twenty μl of
standard BSA solutions and samples were mixed with 1 ml of Bradford reagent.
After keeping all the samples at dark for 5 min at room temperature, absorbances of
standards and samples were measured at 595 nm by using Perkin Elmer Lambda 25
UV/VIS Spectrophotometer (Perkin Elmer, Singapore). The standards and samples
were prepared in triplicates. Concentration of GR was determined by using standard
curve.
3.2.3. Native-Polyacrylamide Gel Electrophoresis (Native-PAGE)
Purity of GR was confirmed by discontinuous native-PAGE (Hames, 1998).
Coomassie Brilliant Blue (CBB) R-250, silver and activity stainings were performed
to visualize protein and activity bands. The final concentrations of gels to be used in
CBB and silver stainings were 6% for separating gel and 4% for stacking gel. For
activity staining, separating and stacking gels were prepared as 10% and 4%,
respectively.
Reagents used in Discontinuous Native-PAGE
- 30% Acrylamide/Bisacrylamide solution (29.4% acrylamide/0.6% N,N-
methylenebisacrylamide)
- Separating gel buffer: 1.5 M Tris/HCl, pH 8.8
- Stacking gel buffer: 0.5 M Tris/HCl, pH 6.8
- 10x Electrode (running) buffer: 25 mM Tris (Base), 192 mM glycine
- 2x Sample buffer: 1.25 ml of 0.5 M Tris/HCL pH 6.8, 4 ml glycerol, 10 mg
bromophenol blue and the volume was adjusted to 10 ml with distilled water.
- 10% ammonium persulfate (APS), prepared daily
- N,N,N,’N’-tetramethylethylenediamine (TEMED)
Page 38
24
Preparation of Gel for Native-PAGE
The spacer (1.5 mm) and the plain glasses were placed vertically on the
casting stand. The separating gel mixture (6.5 ml) was loaded into the plain glasses
and distilled water was layered on in order to have a smooth surface. Gel was left for
about 1 hour for polymerization. After polymerization of the separating gel, layered
water is discarded. Stacking gel mixture was added onto separating gel and the 10
well comb was immediately placed in the gel and kept for about 1 hour 30 minutes
for complete polymerization. The plain glasses were removed from the casting stand
and placed in the electrophoresis assembly and transferred into the electrophoresis
tank. Tank was filled with running buffer and the 10 well combs were removed.
Before loading the samples into the wells, the wells were washed with the running
buffer solution.
Table 3.1. Volumes used in gel preparation of Native-PAGE
Separating Gel
(6% or 10%)
Stacking gel
(4%)
30% Acrylamide / Bisacrylamide 3 ml (for 6%)
5 ml (for 10%) 1.33 ml
1.5 M Tris/HCL, pH 8.8 3.75 ml -
0.5 M Tris/HCL, pH 6.8 - 2.5 ml
Distilled water 8.25 ml (for 6%)
6.17 ml (for 10%) 6.12 ml
10% APS 75 μl 40 μl
TEMED 7.5 μl 10 μl
Total Volume 15 ml 10 ml
Page 39
25
Sample Preparation for Native-PAGE
Three different sample preparation methods were employed according to the
staining method. First, the reducing agent, 2-mercaptoethanol (2-ME) was diluted
100 times. To the stock enzyme (15 μl) 1.13 μl of diluted 2-ME is added and
incubated for 1 hr at room temperature. Final enzyme concentration in each well was
adjusted to 5 µg, 3.75 µg, 2.5 µg and 1.25 µg for CBB staining; 0.5 µg, 0.375 µg,
0.25 µg and 0.125 µg for silver staining and 4 µg, 8 µg and 12 µg for activity
staining.
- Sample preparation for CBB staining
1. 1 μl of stock enzyme + 3.8 μl of 20 mM phosphate buffer pH 7.4
2. 1 μl of stock enzyme + 5.4 μl of 20 mM phosphate buffer pH 7.4
3. 1 μl of stock enzyme + 8.6 μl of 20 mM phosphate buffer pH 7.4
4. 1 μl of stock enzyme + 18.2 μl of 20 mM phosphate buffer pH 7.4
Sample was mixed with sample loading buffer at 1:1 ratio just before the application
into the gel, 20 μl of sample was loaded into the wells.
- Sample preparation for silver staining
First the enzyme was diluted 10 times.
1. 4 μl of diluted enzyme + 15.2 μl 20 mM phosphate buffer pH 7.4
2. 3 μl of diluted enzyme + 16.2 μl 20 mM phosphate buffer pH 7.4
3. 2 μl of diluted enzyme + 17.2 μl 20 mM phosphate buffer pH 7.4
4. 1 μl of diluted enzyme + 18.2 μl 20 mM phosphate buffer pH 7.4
Sample was mixed with sample loading buffer at 1:1 ratio just before the application
into the gel, 20 μl of sample was loaded into the wells.
- Sample preparation for activity staining
1. 10 μl of stock enzyme + 20 μl dH20 + 10 μl sample loading buffer
2. 20 μl of stock enzyme + 10 μl dH20 + 10 μl sample loading buffer
3. 30 μl of stock enzyme + 10 μl sample loading buffer
Twenty μl of sample was loaded into the wells.
Page 40
26
Bio-Rad Miniprotean Tetra Cell electrophoresis system was used.
Electrophoresis was initiated with 120V and when the samples migrated into the
separating gel, the voltage was increased to 150 V. Electrophoresis was completed
when the bromophenol blue dye reached about 1 cm to the end of the gel. Gels were
transferred into petri dishes for staining processes.
3.2.4. Sodium Dodecyl Sulfate-Polyacrylamide Gel Electrophoresis (SDS-
PAGE)
Purity and relative molecular weight (Mr) of GR were confirmed by SDS-
PAGE. Concentrations of separating and stacking gels were 7% and 4%, respectively
(Laemmli, 1970).
Reagents used in discontinuous SDS-PAGE
- 30% Acrylamide/Bisacrylamide solution (29.4% acrylamide/0.6% N,N-
methylenebisacrylamide)
- Separating gel buffer: 1.5 M Tris/HCl, pH 8.8
- Stacking gel buffer: 0.5 M Tris/HCl, pH 6.8
- 5x Electrode (running) buffer pH 8.3 was taken from already prepared native
gel running buffer (10 x) containing 15g/L Tris Base and glycine 72 g/L. To
the 5x electrode buffer, 6 gr of SDS was added.
- 2x Sample buffer: 3 ml 1.5 M Tris pH 6.8, 5 gr glycerol i.e 4 ml, 1.6 ml of
BPB, 2.8 μl of β-ME (added immediately during sample preparation), 0.37 ml
of dH2O, 1 ml of 10% SDS
- 10% SDS solution
- 10% ammonium persulfate (APS), prepared daily.
- N,N,N,’N’-tetramethylethylenediamine (TEMED)
Preparation of Gel for SDS-PAGE
The spacer (1.5 mm) and the plain glasses were placed vertically on the
casting stand. The separation gel mixture (6.5 ml) was loaded into the plain glasses
and distilled water was layered in order to have a smooth surface. The gel was left
for about 1 hour for polymerization. After polymerization of the separating gel,
Page 41
27
layered water is discarded. Stacking gel was also added onto the separating gel and
the 10 well comb was immediately placed in the gel and kept for about 1 hour 30
minutes for complete polymerization. The plain glasses were removed from the
casting stand and placed in the electrophoresis assembly and transferred into the
electrophoresis tank. Tank was filled with running buffer containing SDS and the 10
well combs were removed. Before loading the samples, wells were washed with the
running buffer solution.
Table 3.2. Volumes Used in Gel Preparation of SDS-PAGE
Separating Gel
(7%)
Stacking Gel
(4%)
30% Acrylamide/Bisacrylamide 3.5 ml 1.33 ml
1.5 M Tris/HCL, pH 8.8 3.75 ml -
0.5 M Tris/HCL, pH 6.8 - 2.5 ml
Distilled water 7.57 ml 6.07 ml
10% SDS 100 μl 100 μl
10% APS 75 μl 50 μl
TEMED 7.5 μl 10 μl
Total Volume 15 ml 10 ml
Sample Preparation for SDS-PAGE
According to the staining method, sample was prepared in two different ways.
Final enzyme concentration in each well for CBB staining was adjusted to 4 µg, 8 µg
and 12 µg. For silver staining, enzyme concentrations were 0.4 µg, 0.8 µg and 1.2
µg. Roti-mark protein molecular weight marker was used.
- Sample preparation for CBB staining
1. 10 μl of stock enzyme + 20 μl of dH2O + 10 μl of sample loading buffer
2. 20 μl of stock enzyme + 10 μl of dH2O + 10 μl of sample loading buffer
3. 30 μl of stock enzyme + 10 μl of sample loading buffer
Page 42
28
Samples were incubated at 95oC for 3 min and 20 μl of sample was loaded into the
wells.
- Sample preparation for silver staining
1. 1 μl of stock enzyme + 29 μl of dH2O + 10 μl of sample loading buffer
2. 2 μl of stock enzyme + 28 μl of dH2O + 10 μl of sample loading buffer
3. 3 μl of stock enzyme + 27 μl of dH2O + 10 μl of sample loading buffer
Samples were incubated at 95oC for 3 min and 20 μl of sample was loaded into the
wells.
Bio-Rad Miniprotean Tetra Cell electrophoresis system was used.
Electrophoresis was initiated with 150 V and when the samples migrated into the
separating gel, the voltage was increased to 200 V. Electrophoresis was completed
when the bromophenol blue dye reached about 1 cm to the end of the gel. Gels were
transferred into petri dishes for staining processes.
3.2.5. Coomassie Brilliant Blue (CBB) R-250 Staining
After native and SDS-PAGE, CBB staining protocol was carried out in order
to visualize the protein bands on the gel. Staining solution was prepared from 0.1%
Coomassie Brilliant Blue R-250, 40% methanol and 10% acetic acid. After native
and SDS-PAGE, gels were incubated with the staining solution for 30 minutes or
overnight and then transferred into destaining solution. The destaining solution was
consist of 40% methanol and 10% acetic acid. Destaining solution was replaced
every 30 minutes till the background was clear. Then gels were stored in 5% acetic
acid at 4oC (Wilson et al., 1979).
3.2.6. Silver Staining
Upon completing the native and SDS-PAGE, silver staining was carried out
according to the method described by Blum et al. with slight modifications (Blum et
al., 1987). Gels were fixed with 50% methanol, 12% glacial acetic acid and 0.005%
formalin solution for 2 hours or overnight. Then the fixation solution was discarded
and gels were washed three times with 50% ethanol for 20 minutes. Gels were
sensitized with 0.02% sodium thiosulfate (Na2S2O3) for 2 minutes and then washed
Page 43
29
with distilled water three times for 20 seconds. Gels were stained with 0.2% silver
nitrate (AgNO3) and 0.076% formalin solution for 20 minutes. After staining, gels
were washed with distilled water twice for 20 seconds. Gels were kept in 6% sodium
carbonate (Na2CO3), 0.05 formalin and 0.0004% sodium thiosulfate solution until the
bands were visible. When the bands were clearly seen, gels were washed with
distilled water twice for 2 minutes. Staining was finalized by the addition of a stop
solution which was made up of 40% methanol, 10% glacial acetic acid and gels were
embedded in this solution for 20 minutes. After completion of the staining procedure,
gels were stored in 1% glacial acetic acid solution at 4oC.
3.2.7. Activity Staining
After native-PAGE was carried out, activity staining procedure of Graubaum
on cellulose acetate was modified and applied to native-PAGE (Graubaum, 1981).
Three different solutions were used for activity staining. Gel was first incubated in
15 ml of 100 mM potassium phosphate buffer pH 7.5 for 2 minutes. Then, gel was
incubated in 100 mM potassium phosphate buffer pH 7.5 containing 1.0 mg MTT,
0.100 mg of dichlorophenol indophenol for 10 minutes. Finally, gel was incubated in
100 mM potassium phosphate buffer pH 7.5 containing 2.5 mg NADPH and 18 mg
GSSG until color developed.
3.2.8. Glutathione Reductase Activity Measurement
Glutathione reductase activity was measured according to method of Carlberg
and Mannervik by using Perkin Elmer Lambda 25 UV/VIS Spectrophotometer
(Carlberg and Mannervik, 1985). The reaction mixture contained 100 mM potassium
phosphate buffer pH 7.4, 1 mM GSSG, 0.1 mM NADPH and 25 μl of enzyme. GR
was added last to initiate the reaction. Increase in the absorbance at 340 nm was
followed for 30 seconds at 37°C. Each activity measurement was repeated in
triplicates. Average activity (U/L) values were converted to specific activity (U/mg
protein) and specific activity values were used to draw the following plots: Optimum
temperature, Michaelis-Menten, Lineweaver-Burke and Dixon (Segel, 1975).
Page 44
30
Specific Activity (Unit/mg protein) = Abs340 x Vt x 1000
6.22 x Vs x [Protein]
∆Abs340/min : Absorbance change per minute at 340 nm
Vt : Volume of total activity measurement mixture (500 μl)
Vs : Enzyme volume (μl) used in the measurement of enzyme
activity
6.22 : Extinction coefficient of NADPH (mM)
1000 : A factor used to convert ml to liter
Kinetic parameters for GR were determined by using variable concentrations
of GSSG (0.0625 mM, 0.125 mM, 0.25 mM, 0.5 mM and 1 mM) while keeping the
NADPH concentration constant (0.1 mM) and also by using variable concentrations
of NADPH (0.01 mM, 0.015 mM, 0.02 mM, 0.04 mM and 0.1 mM) while keeping
GSSG concentration constant (1 mM) (Carlberg and Mannervik, 1985).
3.2.9. Determination of Optimum pH by Zero Buffer Extrapolation
To determine the pH optimum of GR, “zero buffer extrapolation” was carried
out in order to eliminate the effect of potassium phosphate buffer on enzyme activity.
The activity measurements were carried out in phosphate buffers at different pH
values (6, 6.5, 7, 7.5, 8, 8.5, 9) and at different concentrations (50 mM, 100 mM, 150
mM, 200 mM). From the activity versus buffer concentration graph the activities at
zero buffer were determined by extrapolation and the activity at zero buffer
concentration versus pH graph was performed. From the second graph the pH
optimum for GR was found. Final GSSG and NADPH concentrations were 1 mM
and 0.1 mM, respectively. Each pH value and buffer concentration was tested three
times at 37°C and the reaction was monitored at 340 nm for 30 seconds. Average
A/min was calculated for each pH value.
3.2.10. Determination of Optimum Temperature
Activity measurement of the glutathione reductase enzyme was performed at
different temperature values to determine the effect of temperature on enzyme
Page 45
31
activity. Reaction mixture contained 100 mM potassium phosphate buffer pH 7.5, 1
mM GSSG, 0.1 mM NADPH and 25 μl of glutathione reductase enzyme.
Temperature of the reaction medium was adjusted to certain points (20°C, 25°C,
30°C, 35°C, 40°C, 45°C, 50°C, 55°C, 60°C, 65°C, and 70°C) by using water bath.
The reaction was monitored at 340 nm for 30 sec. Each temperature point was tested
three times. Average specific activity was calculated and used to draw graphics
(Carlberg and Mannervik, 1985).
3.2.11. Effect of Hypericin on Glutathione Reductase Enzyme Activity
Hypericin was dissolved in dimethyl sulphoxide (DMSO). Reaction mixture
consisted of 100 mM potassium phosphate buffer pH 7.5, 1 mM GSSG, 0.1 mM
NADPH, 25 μl of GR and 10 μl of hypericin prepared in different concentrations
(1.5625 μM, 3.1275 μM, 6.25 μM, 12.5 μM, 25 μM, 50 μM and 100 μM). Enzyme
activity for each hypericin concentration was measured at 340 nm for 30 seconds at
37oC (Carlberg and Mannervik, 1985). Each activity measurement was performed in
triplicates. Average specific activity was calculated and used to draw related
graphics.
3.2.12. Inhibitory Kinetic Experiments with Hypericin
Kinetic studies were carried out to determine Km and Vmax values for
glutathione reductase enzyme in the presence of variable hypericin concentrations.
Four hypericin concentrations (1 μM, 2 μM, 4 μM and 8 μM) were tested while
[GSSG] (0.03125 mM, 0.0625 mM, 0.125 mM, 0.25 mM, 0.5 mM and 1mM) and
[NADPH] (0.01 mM, 0.015 mM, 0.02 mM, 0.04 mM and 0.1 mM) were the variable
substrates. First the activity of the enzyme was tested with variable hypericin and
GSSG concentrations at constant [NADPH] (0.1 mM). Then by using same hypericin
concentrations, activity measurements were performed with variable [NADPH] and
constant [GSSG] (1 mM). Each measurement was repeated three times. Decrease in
absorbance at 340 nm was monitored for 30 seconds at 37oC (Carlberg and
Mannervik, 1985). Average specific activity was calculated and used to related draw
graphics.
Page 46
32
3.3.13. Statistical Analysis
SPSS version 22 was used in the estimation of inhibition type and calculation
of kinetic parameters.
Page 47
33
4. RESULTS
4.1. Determination of the Protein Concentration
Glutathione reductase purified from baker’s yeast was purchased from Sigma
Aldrich and used in further experiments. The protein concentration was determined
by Bradford assay (Bradford, 1976). Bovine serum albumin (BSA) was used as a
standard with final concentrations of 50 μg, 100 μg, 200 μg, 300 μg, 400 μg and 500
μg. Samples (20 μl) were mixed with 1 ml of Bradford reagent, followed by 5 min
incubation at dark and the absorbances of standards and samples were read at 595
nm. Protein concentration of GR was determined from the standard curve (Figure
4.1).
Figure 4.1. Determination of the enzyme concentration by Bradford assay
Glutathione reductase was separated from its solvent ammonium sulphate
(AmSO4) and thereafter dissolved in 20 mM potassium phosphate buffer pH 7.4. The
enzyme concentration was calculated as 813 μg/ml.
Page 48
34
B 1 2 3
1 2 3 4
A 1 2 3 4
1 2 3 4
4.2. Characterization of Glutathione Reductase Enzyme
4.2.1. Purity Control of Glutathione Reductase Enzyme
Determination of the purity and molecular weight of the GR enzyme was
carried out by native and SDS-PAGE. Coomassie Brilliant Blue R-250, silver and
activity stainings were performed in order to visualize protein bands. In native gel,
purity of the enzyme was confirmed by the visualization of a single protein band
after CBB (Figure 4.2.A), activity (Figure 4.2.B) and silver stainings (Figure 4.3).
Figure 4.2. Visualization of GR enzyme on discontinuous native-PAGE. A.
Coomassie Brilliant Blue G-250 staining of glutathione reductase. Separating and
stacking gels were prepared 6% and 4%, respectively. Protein concentration in lane
1, 5 μg; lane 2, 3.75 μg; lane 3, 2.5 μg; lane 4, 1.25 μg. B. Activity staining of
glutathione reductase. Separating and stacking gels were prepared 10% and 4%,
respectively. Protein concentration in lane 1, 4 μg; lane 2, 8 μg; lane 3, 12 μg.
Page 49
35
Figure 4.3. Visualization of GR enzyme on discontinouse native-PAGE by silver
staining. Separating and stacking gels were prepared 6% and 4%, respectively.
Protein concentration in lane 1, 0.5 μg; lane 2, 0.375 μg; lane 3, 0.25 μg; lane 4,
0.125 μg.
Subunit molecular weight of the GR was determined by SDS-PAGE. Protein
band belongs to the subunits of the GR was identified in gels stained with both CBB
(Figure 4.4A) and silver staining (Figure 4.5). Molecular weight of each subunit was
calculated as 49 kDa by using molecular weight marker proteins and their migration
distances (Figure 4.4.B).
1 2 3 4
1 2 3 4
Page 50
36
4,0
4,3
4,6
4,9
5,2
5,5
0,0 0,2 0,4 0,6 0,8
Log M
rRF
Figure 4.4.A. Glutathione reductase enzyme on discontinuous SDS-PAGE by
Coomassie Brilliant Blue R-250 staining. Separating and stacking gels were prepared
7% and 4% respectively. Concentration of glutathione reductase enzyme was 4μg.
Figure 4.4.B. Log Mr vs Rf plot.
A
B
Page 51
37
M 1 2 3 M
-212 kDa Myosin
-66 kDa Albumin
-43 kDa Ovalbumin
-29 kDa Carbonic anhydrase-20 kDa Trypsin inhibitor-14 kDa Cytochrome c
Figure 4.5. Glutathione reductase enzyme on discontinuous SDS-PAGE by silver
staining. Separating and stacking gels were prepared 7% and 4% respectively.
Glutathione reductase enzyme concentrations in lane 1, 1.2 μg; lane 2, 0.8 μg; lane 3,
0.4 μg.
4.2.2. Determination of Optimum pH by Zero Buffer Extrapolation
To determine the pH optimum of GR, “zero buffer extrapolation” was carried
out in order to eliminate the effect of potassium phosphate on enzyme activity. The
activity measurements were carried out in phosphate buffers at different pH values
(6, 6.5, 7, 7.5, 8, 8.5, 9) and at different concentrations (50 mM, 100 mM, 150 mM,
200 mM). From the activity versus buffer concentration graph the activities at zero
buffer concentration were determined by extrapolation (Figure 4.6) and the activity
at zero buffer concentration versus pH graph was performed. From the second graph
the pH optimum for GR was found to be 7.65 (Figure 4.7) (Landquist, 1955).
Page 52
38
Figure 4.6. Zero buffer extrapolation. ∆A/min vs buffer concentration.
Figure 4.7. ∆A/min vs. pH plot
Page 53
39
4.2.3. Determination of Optimum Temperature
The effect of the temperature on the activity of glutathione reductase enzyme
was studied by incubating the reaction medium at different temperature points (20°C,
25°C, 30°C, 35°C, 37°C, 40°C, 45°C, 50°C, 55°C, 60°C, 65°C and 70°C). Each
measurement was repeated three times and for each temperature point specific
activity (U/mg protein) was determined. A graph of specific activity (U/mg protein)
versus temperature (°C) was drawn (Figure 4.8.A) and the optimum temperature was
found to be 57°C. For the determination of activation energy (Ea), logarithms of
specific activities versus reciprocal of temperature in Kelvin was plotted (Figure
4.8.B). On below equations, energy of activation (Ea) and Q10 were calculated as
3544 calories and 1.26, respectively,
-Slope = -Ea /2.3R
Ea: Activation energy
R: Gas constant
Ea = 2.3R T1T2log Q10/10
Q10: Temperature coefficient
T1 and T2 temperatures in kelvin
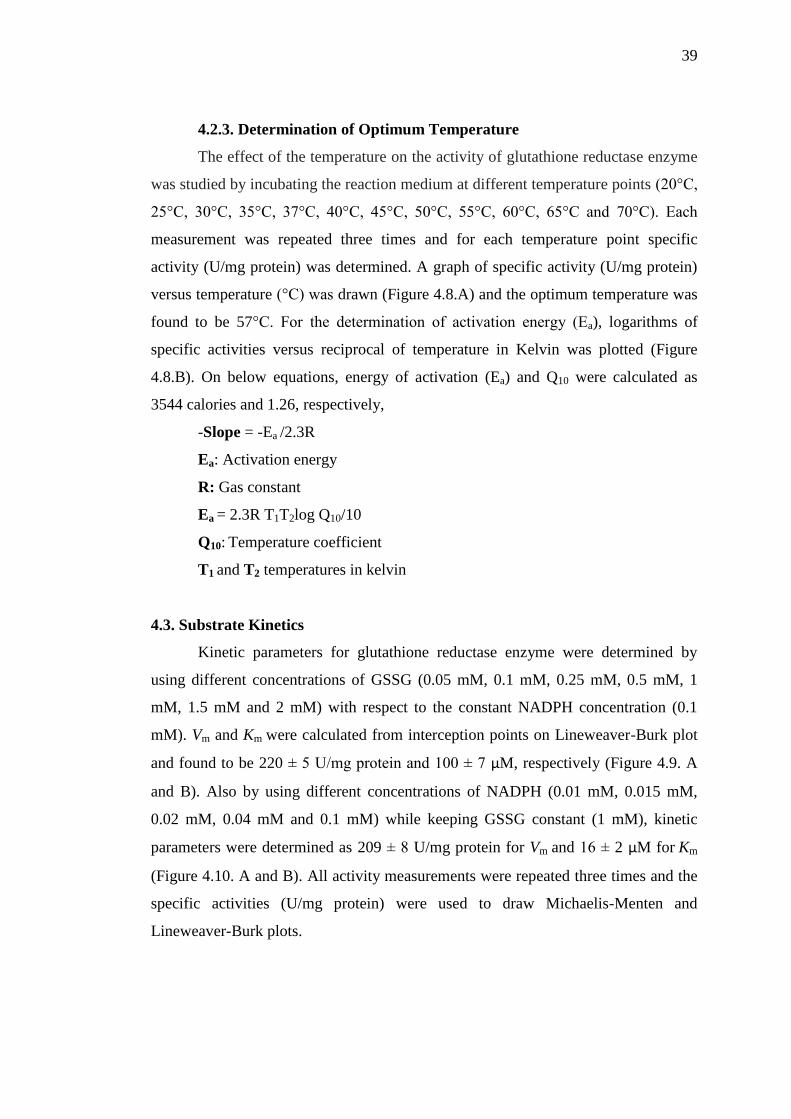
4.3. Substrate Kinetics
Kinetic parameters for glutathione reductase enzyme were determined by
using different concentrations of GSSG (0.05 mM, 0.1 mM, 0.25 mM, 0.5 mM, 1
mM, 1.5 mM and 2 mM) with respect to the constant NADPH concentration (0.1
mM). Vm and Km were calculated from interception points on Lineweaver-Burk plot
and found to be 220 ± 5 U/mg protein and 100 ± 7 μM, respectively (Figure 4.9. A
and B). Also by using different concentrations of NADPH (0.01 mM, 0.015 mM,
0.02 mM, 0.04 mM and 0.1 mM) while keeping GSSG constant (1 mM), kinetic
parameters were determined as 209 ± 8 U/mg protein for Vm and 16 ± 2 μM for Km
(Figure 4.10. A and B). All activity measurements were repeated three times and the
specific activities (U/mg protein) were used to draw Michaelis-Menten and
Lineweaver-Burk plots.
A
Page 54
40
Figure 4.8.A. Specific activity vs. temperature plot. B. Log (Sp. Act.) U/mg protein
vs. 1/T plot.
A
B
B
Page 55
41
Figure 4.9. Kinetic behavior of glutathione reductase with variable GSSG
concentrations (0.05 mM, 0.1 mM, 0.25 mM, 0.5 mM, 1 mM, 1.5 mM and 2 mM).
A. Michaelis-Menten plot. B. Lineweaver-Burk plot.
A
B
Page 56
42
Figure 4.10. Kinetic behavior of glutathione reductase with variable NADPH
concentrations (0.01 mM, 0.015 mM, 0.02 mM, 0.04 mM and 0.1 mM). A.
Michaelis-Menten plot. B. Lineweaver-Burk plot.
B
A
Page 57
43
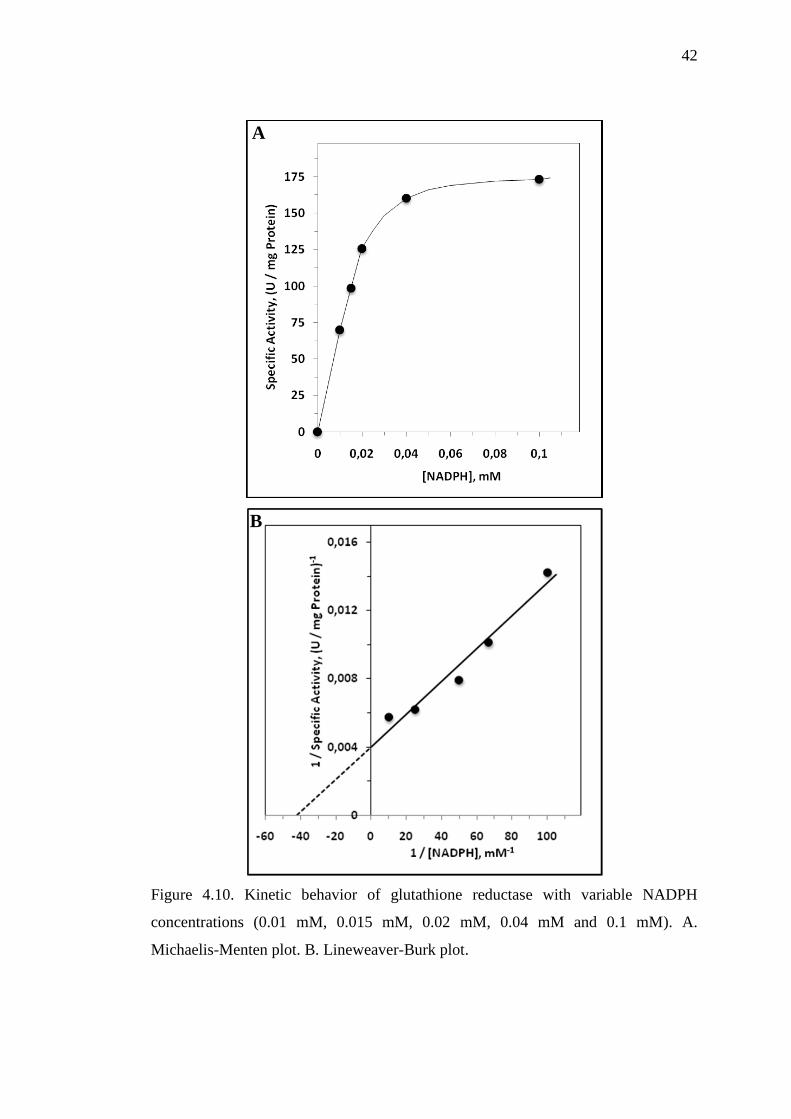
4.4. Inhibitory Kinetic Behaviour of Glutathione Reductase with Hypericin
Glutathione reductase activity was measured by using eight different
hypericin concentrations (1 μM, 1.5625 μM, 3.1275 μM, 6.25 μM, 12.5 μM, 25 μM,
50 μM and 100 μM). In the reaction mixture final concentrations of GSSG and
NADPH were 1 mM and 0.1 mM, respectively. Each hypericin concentration was
studied three times and average specific activities were calculated. As shown in
Figure 4.11 hypericin inhibited glutathione reductase enzyme in a dose dependent
manner. Although there was a gradual decrease in enzyme activity, inhibition did not
reach zero in the concentration range studied. IC50 was calculated as 15 μM. In the
inhibitory kinetic experiments, four different hypericin concentrations (1 μM, 2 μM,
4 μM and 8 μM) were selected from the area in which linear inhibition was observed.
Figure 4.11. Dose dependent inhibition of glutathione reductase by hypericin.
[GSSG] = 1 mM, [NADPH] = 0.1 mM, [Hypericin] = 0 μM, 1 μM, 1.5625 μM,
3.1275 μM, 6.25 μM, 12.5 μM, 25 μM, 50 μM and 100 μM.
Page 58
44
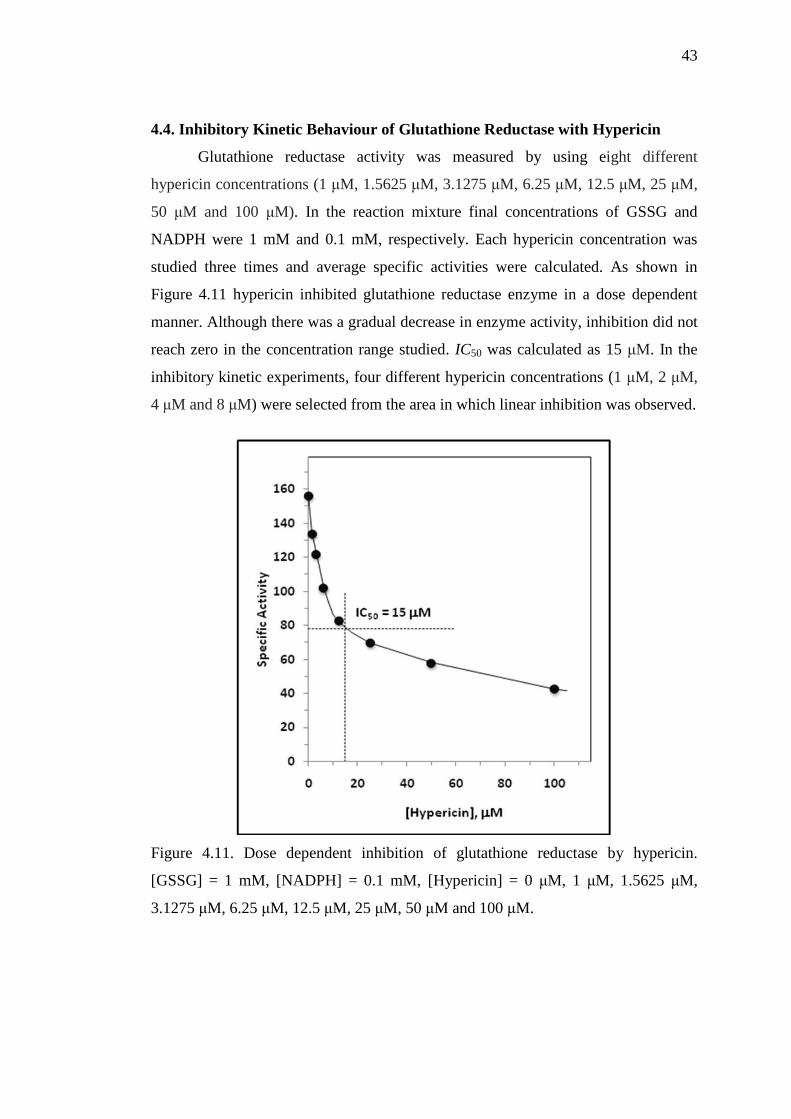
In inhibitory kinetic experiments with hypericin, first NADPH concentration
was kept constant (0.1 mM) and variable GSSG (0.03125 mM, 0.0625 mM, 0.125
mM, 0.25 mM, 0.5 mM and 1 mM) and hypericin (1 μM, 2 μM, 4 μM and 8 μM)
concentrations were studied. All activity measurements were performed in triplicates
and calculated specific activities were used to draw Michaelis-Menten (Figure 4.12),
Lineweaver Burk (Figure 4.13) and Dixon plots (Figure 4.15). When GSSG was the
variable substrate, hypericin inhibited glutathione reductase enzyme competitively
(Figure 4.13). Km and Ki were found as 190 40 μM and 2.92 0.73 μM,
respectively. Vm was calculated as 242 15 U/mg protein (Figure 4.12 and 4.13).
Figure 4.12. Michaelis-Menten plot for glutathione reductase enzyme with different
concentrations of hypericin using GSSG as a variable substrate (0.03125 mM, 0.0625
mM, 0.125 mM, 0.25 mM, 0.5 mM and 1 mM). Hypericin concentrations were (○)
without hypericin, (●) 1μM, ( ) 2 μM, (▲) 4 μM, (□) 8 μM.
Page 59
45
Figure 4.13. Lineweaver-Burk plot for glutathione reductase enzyme with different
concentrations of hypericin using GSSG as a variable substrate (0.03125 mM, 0.0625
mM, 0.125 mM, 0.25 mM, 0.5 mM and 1 mM). Hypericin concentrations were (○)
without hypericin, (●) 1μM, ( ) 2 μM, (▲) 4 μM, (□) 8 μM
Page 60
46
Figure 4.14. Kmapp vs. hypericin and slope of the reciprocal vs. hypericin plots
Page 61
47
Figure 4.15. Dixon plot for glutathione reductase enzyme. [NADPH]=0.1 mM.
[GSSG]: (■) 0.03125; (□), 0.0625; (▲), 0.125; ( ), 0.25; ( ), 0.5; (○), 1 mM.
[Hypericin]=0 µM, 1 µM, 2 µM, 4 µM, 8 µM.
Page 62
48
Figure 4.16. Replot of slope of Figure 4.15 versus 1/ [GSSG]
Different NADPH concentrations (0.01 mM, 0.015 mM, 0.02 mM, 0.04 mM
and 0.1 mM) were also studied with the same hypericin concentrations (1 μM, 2 μM,
4 μM and 8 μM) while keeping GSSG constant (1 mM). All activity measurements
were performed in triplicates and specific activities were used to draw Michaelis-
Menten (Figure 4.17), Lineweaver Burk (Figure 4.18) and Dixon plots (Figure 4.20)
for the estimation of inhibition type and kinetic parameters. When the variable
substrate was NADPH, inhibition type was linear-mixed type competitive and the Ks,
Ki and α values were 15.8 1.6 μM, 2.63 0.50 μM and 3.48 1.31, respectively.
Vm was calculated as 232 8 U/mg protein.
Page 63
49
Figure 4.17. Michaelis-Menten plot for glutathione reductase enzyme with different
concentrations of hypericin using NADPH as a variable substrate Hypericin
inhibition by using NADPH as a variable substrate (0.01 mM, 0.015 mM, 0.02 mM,
0.04 mM and 0.1 mM). [GSSG]=1 mM. Hypericin concentrations were (○) without
hypericin, (●) 1μM, ( ) 2 μM, (▲) 4 μM, (□) 8 μM.
Page 64
50
Figure 4.18. Lineweaver-Burk plot for glutathione reductase enzyme with different
concentrations of hypericin using NADPH as a variable substrate. NADPH
concentrations were 0.01 mM, 0.015 mM, 0.02 mM, 0.04 mM and 0.1 mM and
[GSSG]=1 mM. Hypericin concentrations were (○) without hypericin, (●) 1μM, ( )
2 μM, (▲) 4 μM, (□) 8 μM.
Page 65
51
Figure 4.19. Replot of slope and intercept points of Figure 4.18 versus [I]
Page 66
52
Figure 4.20. Dixon plot for glutathione reductase enzyme. [GSSG]=1 mM. Variable
concentration of [NADPH]: (□) 0.01; (▲), 0.015; ( ), 0.02; ( ), 0.04 (○), 0.1 mM.
[Hypericin]=0, 1, 2, 4, 8 µM
Page 67
53
Figure 4.21. Replot of slope of Figure 4.20 versus 1/[NADPH]
Page 68
54
5. DISCUSSION
Glutathione reductase (GR) gene in yeast (known as GLR1) encodes both
mitochondrial and cytosolic forms of the enzyme. Any mutation or deletion will lead
to an accumulation of the oxidized glutathione (GSSG) and a loss of reduced
glutathione (GSH). GLR1 gene has two in-frame start codons. The first translation
codon (AUG1) creates mitochondrial form and has mitochondrial targeting signal.
The second translation codon (AUG17) generates cytosolic form whose translation is
more effective that results in abundant cytosolic form. Studies with mutant GLR1
gene revealed that same mRNA molecule containing these two different start codons
is used in the translation of both forms. Based on these findings it was suggested that
subcellular distribution of glutathione reductase in mammalian cells might have been
conserved as well (Caryn et al., 2013). Amino acid similarity (49.8%) between
human and yeast also supported this finding (Collinson and Dawes, 1995). Human
GR contains 461 amino acids (Karplus and Schulz, 1987), while yeast form was
found to have 467 residues (Collinson and Dawes, 1995). Both forms have an FAD
as a prosthetic group and they use NADPH as an electron donor to reduce oxidized
glutathione (Untucht-Grau et al., 1981; Takenaka et al., 1988). Distribution of GR in
rats has been investigated by using Hilger-Gilford recording spectrophotometer.
High GR activity was observed especially in kidney and small intestine. Other tissues
and organs like cardiac muscle, skeletal muscle, testis, liver and a number of
different glands exhibited low GR activity. Also there was a moderate activity in
brain, bladder and adipose tissue (Wendell, 1968).
In this study, GR from baker’s yeast was obtained commercially. Before we
started our experiments, ammonium sulfate was removed from the enzyme sample
by centrifugation. Pellet was used in all following experiments. The purity and the
subunit molecular weight of the enzyme were determined by native-polyacrylamide
gel electrophoresis (native-PAGE) and SDS-polyacrylamide gel electrophoresis
(SDS-PAGE). Coomassie Brilliant Blue R-250, silver and activity stainings were
carried out to visualize protein bands on native-PAGE. In native–PAGE, single
protein band was observed (Figures 4.2 and 4.3). In SDS-PAGE, protein markers are
used for the estimation of subunit molecular weight of GR. Coomassie Brilliant Blue
R-250 and silver stainings also revealed a single protein band and by comparing the
Page 69
55
migration distance of GR and the protein markers, subunit molecular weight was
calculated as 49 kDa (Figures 4.4 and 4.5) which is consistent with the literature.
Previously, researchers found the subunit molecular weight of yeast GR as 51 kDa
(Hou et al., 2004). Can et al. calculated the subunit Mr of rat kidney GR as 53 kDa
(Can B et al., 2010), and for human and bovine erythrocytes subunit molecular
weight of GR was found as 58 kDa (Ogüs and Ozer, 1998; Erat et al., 2003). Mavis
and Stellwagen first calculated the subunit molecular weight of yeast GR as 64 kDa,
but in the presence of 5 M guanidine hydrochloride they observed that the molecular
weight of the enzyme was reduced to 51.5 kDa (Mavis and Stellwagen, 1968). This
must be due to the breakdown of more hydrogen bonds and more SDS molecules are
bound to the enzyme resulting in the increase of charge mass ratio.
In order to determine the pH optimum and to eliminate the buffer effect,
“zero buffer extrapolation method” was applied. The activity measurements were
carried out in phosphate buffers at different pH values (6, 6.5, 7, 7.5, 8, 8.5, 9) and at
different concentrations (50 mM, 100 mM, 150 mM, 200 mM). From the activity
versus buffer concentration graph the activities at zero buffer were determined by
extrapolation (Figure 4.6) and the activity at zero buffer concentration versus pH
graph was performed. From the second graph the pH optimum for GR was found to
be as 7.65 (Figure 4.7) (Landqvist, 1955). This result is close to pH optimum of
human erythrocyte GR (pH 7.20) and bovine erythrocyte GR (pH 7.3) but higher
than the pH optimum reported for rat kidney GR (pH 6.5) (Ogüs and Ozer, 1998;
Erat al., 2003: Can et al., 2010). This discrepancy could be explained by the
differences in the functions of the tissues.
To evaluate the optimum temperature of the enzyme, the activity of the
enzyme was measured at different temperatures (20°C, 25°C, 30°C, 35°C, 40°C,
45°C, 50°C, 55°C, 60°C, 65°C and 70°C). The temperature optimum, activation
energy (Ea) and Q10 were calculated as 57oC, 3,544 calories and 1.26, respectively
(Figure 4.8.A and B). In comparison with the previously published data our findings
are consistent with the report of Erat et al. in which optimum temperature of bovine
erythrocyte GR was found to be 55°C (Erat et al., 2003). GR purified from rat kidney
had an optimum temperature of 65°C, the activation energy (Ea) and the temperature
Page 70
56
coefficient (Q10) were found to be 7.02 kcal/mol and 1.42, respectively (Can et al.,
2010). These results shows GR has stability and tolerance to high temperature points.
The values of kinetic parameters in the absence of inhibitor were determined
as KmGSSG 100 ± 7 μM, KmNADPH 16 ± 2 μM. In the other kinetic studies with yeast
GR KmGSSG and KmNADPH were calculated as 90±12 μM and 30±4 μM, respectively
(Tandoğan and Ulusu, 2007). Same kinetic parameter (Km) for yeast GR at variable
GSSG and NADPH were also determined as 55 μM and 3.8 μM, respectively
(Massey and Williams, 1965). GR purified from rat liver revealed KmGSSG as 56.7 ±
0.4 μM and KmNADPH as 7.9 ± 0.6 μM (Carlberg and Mannervik, 1975). KmGSSG and
KmNADPH were determined for GR from E coli as 97 ± 12 μM and 22 ± 2 μM,
respectively (Bashir et al., 1995).
Hypericin inhibition was tested by using different hypericin concentrations
ranging between 1-100 μM while keeping the concentration of NADPH (0.1 mM)
and GSSG (1 mM) constant. The activity of the enzyme was gradually decreasing as
hypericin concentration increased meaning that hypericin has an inhibitory effect on
GR with quite low half maximal inhibitory concentration (IC50) which was calculated
as 15 μM (Figure 4.11). Considering the half-lives of hypericin and pseudohypericin
which were found as 24.8 to 26.5 hours and 16.3 to 36.0 hours, respectively
(Staffeldt et al., 1994), low IC50 indicated hypericin could have long term inhibitory
effect on GR.
The enzyme was further tested in inhibitory kinetic experiments in which 1,
2, 4, 8 μM hypericin concentrations were chosen to be used. Competitive type of
inhibition was observed when the GSSG was the variable substrate with Km, Ki and
Vm values of 190 40 μM, 2.92 0.73 μM and 242 15 U/mg protein, respectively
(Figure 4.12 and 4.13). Inhibition type was linear-mixed type competitive with
variable NADPH concentrations and the Ks, Ki, α and Vm values were 15.8 1.6 μM,
2.63 0.50 μM, 3.48 1.31 and 232 8 U/mg protein, respectively (Figure 4.17 and
4.18). The competitive inhibition shows that hypericin binds to the substrate binding
site and prevents the binding of GSSG. Therefore it increases appearent Km. Since
the binding sites of NADPH and GSSG are close to each other, linear-mixed type
Page 71
57
competitive inhibition was observed with variable NADPH, which means hypericin
affects binding of NADPH, too.
GR is considered as one of the major components of antioxidant enzyme
system for cellular defense against oxidative stress (Willmore and Storey, 2007). It is
a promising target for the improvement of antimalarial agents which could be used to
decrease anti-malarial resistance (Seefeldt et al., 2005). Malaria parasite has its own
glutathione (GSH) redox in which any alteration in the GSH level is associated with
the resistance to antimalarial drugs. Several enzymes in this redox system have been
investigated as a target for anti-malarial drugs including GR. Inhibition of the GR by
methylene blue (MB) and eosin B leads to death of the parasite (Pastrana-Mena et
al., 2010). GR has a critical role in the thiol redox state (TRS) hemostasis by
maintaining a high GSH/GSSG ratio. It could be an important parameter for
increasing the level of TRS because inhibition of the enzyme leads to a decrease in
GSH/GSSG ratio (Asmis et al., 2005).
In the literature, anti-depressant drugs have been elucidated to act as an
inhibitor on the antioxidant enzymes such as inhibition of human placental
glutathione S-transferase-π by fluoxetine (Dalmizrak et al., 2016), amitriptyline and
clomipramine (tricyclic antidepressants) (Dalmizrak et al., 2011) and sertraline
(Dalmizrak et al., 2012). Amitriptyline by inhibiting both glutathione S-transferase pi
and alpha may have role in cancer treatment (Kulaksiz-Erkmen et al., 2013).
Hypericin has an inhibitory effect on other antioxidant enzymes such as
glutathione S-transferase pi (GST-pi). GST-pi purified from human placenta was
inhibited competitively by hypericin when reduced glutathione and 1-chloro-2,4-
dinitrobenzene (CDNB) were used as variable substrates (Dalmizrak et al., 2012). On
other hand noncompetitive type of inhibition was demonstrated when erythrocyte
GST-pi enzyme was inhibited by hypericin (Turk et al., 2015). Tuna et al. studied the
effect of hypericin on rat small intestine GST isoenzymes, alpha and pi and
demonstrated that when the variable substrate was GSH, inhibition type was
uncompetitive for GST-alpha and noncompetitive for GST-pi. Noncompetitive and
competitive inhibitions were observed for GST-alpha and GST-pi, respectively,
when the variable substrate was CDNB (Tuna, G et al., 2010).
Page 72
58
In the presence of visible light and oxygen molecule, hypericin has a
powerful photosensitizer action which can be used in photodynamic therapy to kill
cancer cells by generating singlet oxygen and superoxide anion (Thomas et al., 1992;
Diwu and Lown, 1993) which leads to apoptosis (Ali and Olivo, 2002; Mikeš et al.,
2007), autophagy (Buytaert et al., 2006; Rubio et al., 2012) and necrosis (Du et al.,
2003; Mikeš et al., 2007). The uptake mechanism of hypericin into cellular system is
not well known yet but there is a promising study shows hypericin might enter the
cells through passive transcellular diffusion (temperature-dependent diffusion)
(Sattler et al., 1997) or by partitioning, pinocytosis and endocytosis (Siboni et al.,
2002). Co-labeling with hypericin and fluorescent dyes which are specific for
organelles demonstrated that hypericin fuses and accumulates in the cell membranes
of the endoplasmic reticulum, the Golgi apparatus, lysosomes and mitochondria (Ali
and Olivo, 2002; Galanou et al., 2008; Mikeš et al., 2011). However hypericin might
be affected during cellular uptake and subcellular localization depending on its
lipophilicity, incubation concentrations and/or interaction with serum lipoproteins
(Crnolatac et al., 2005; Galanou et al., 2008; Kascakova et al., 2008).
Researchers proposed that hypericin have an antidepressant activity for those
who suffer from depression (Kenneth et al., 2011). Studies on the rat brain
mitochondria shows that hypericin has great inhibitory potential on monoamine
oxidase (MAO-A and –B) enzymes (Suzuki et al., 1984; Awang, 2009). MAO is
responsible for the inhibition of amine neurotransmitter degradation which increases
their levels in synaptic cleft. Hypericin has a strong affinity for sigma receptors,
which regulate dopamine levels. It also acts as a receptor antagonist at adenosine,
benzodiazepine, GABA-A, GABA-B and inositol triphosphate receptors which
regulate action potentials caused by neurotransmitters (Chavez and Chavez 1997;
Jellin et al., 2002). Further study showed that long-term administration of St. John's
wort and its active constituent hypericin modifies the levels of neurotransmitters in
brain regions (Butterweck et al., 2002).
Hypericin has been shown to inhibit the growth of viruses by preventing
budding and shedding or it has influence on the cell membranes of murine Friend
leukemia virus in vitro (Meruelo Da et al., 1988), equine infectious anemia virus
(EIAV) (Kraus et al., 1990), influenza virus (Tang et al., 1990), duck hepatitis B
Page 73
59
virus (Moraleda et al., 1993), murine immunodeficiency virus (Lavie et al., 1989).
Vesicular stomatitis viruses were photodynamically inactivated by hypericin (Lenard
et al., 1993). In the presence of light hypericin completely inhibits bovine diarrhea
virus (BVDV) in vitro (Jeffrey et al., 2001).
It was found that GR is inhibited by micromolar concentrations of hypericin.
As a result, in addition of producing ROS to kill cancer cells in PDT, inhibition of
GR will also contribute to the sensitization of cancer cells and thus will potentiate the
therapeutic effect of hypericin but these results still need conformation by in vivo
studies (animal studies).
Page 74
60
6. CONCLUSION
In this study, characterization and inhibitory effect of hypericin on
glutathione reductase (GR) was explored. The purity of enzyme was confirmed by
native and SDS-PAGE. The enzyme was further used for characterization in terms of
its optimum pH and optimum temperature. Kinetic experiments were performed by
using different concentrations of GSSG and NADPH to calculate Vm and Km values
of the enzyme. Finally, possible inhibitory behavior of hypericin on GR was tested
by using different inhibitor concentrations and inhibitory kinetic parameters were
calculated for variable GSSG and NADPH concentrations.
In both native and SDS-PAGE single protein band was observed confirming
the purity of the enzyme sample. SDS-PAGE was also used to appraise the subunit
molecular weight of the enzyme and it was calculated as 49 kDa. Optimum pH and
optimum temperature of GR were found to be 7.65 and 57oC, respectively. Energy of
activation (Ea) and temperature coeffiecient (Q10) were found to be 3,544 calories and
1.26, respectively. Hypericin was found to inhibit GR in a dose dependent manner
with an IC50 value of 15 µM. Inhibitory kinetic studies revealed competitive and
linear-mixed type competitive inhibitions when GSSG and NADPH were used as
variable substrates, respectively. When the variable substrate was GSSG, Km and Ki
were found as 190 40 μM and 2.92 0.73 µM, respectively. On the other hand,
when the variable substrate was NADPH, Ks, Ki and α values were 15.8 1.6 μM,
2.63 0.50 µM and 3.48 1.31, respectively.
Further in vivo studies should be performed on glutathione reductase and its
inhibition mechanism by hypericin in order to understand the role of GR on the level
of GSH/GSSG and to evaluate its anticancer or antimalarial properties.
Page 75
61
REFERENCES
Adams, L., Franco, M.C., Estevez, A.G. (2015). Reactive nitrogen species in cellular
signaling. Exp Biol Med (Maywood). 240(6):711-7.
Agar, N.S., Sadrzadeh, S.M., Hallaway, P.E., Eaton, J.W. (1986). Catalase. A
somatic oxidant defense. J Clin Invest. 77(1):319–321.
Agostinis, P., Vantieghem A., Merlevede, W., de Witte, P.A.M. (2002). Hypericin in
cancer treatment: More light on the way. Int J Biochem Cell Biol. 34:221–41.
Ali, S.M., Olivo, M. (2002). Bio-distribution and subcellular localization of
Hypericin and its role in PDT induced apoptosis in cancer cells. Int J Oncol. 21,
531–540.
Allen, C.L., Bayraktutan, U. (2009). Oxidative stress and its role in the pathogenesis
of ischaemic stroke. Int J Stroke. 4(6):461-70.
Arthur, J.R. (2000). The glutathione peroxidases. Cell Mol Life Sci. 57.1825–1835.
Asmat, U., Abad, K. and Ismail, K. (2016). Diabetes mellitus and oxidative stress-A
concise review. Saudi Pharm J. 24(5):547–553.
Asmis, R., Wang, Y., Xu, L., Kisgati, M., Begley, J.G. and Mieyal, J.J. (2005). A
novel thiol oxidation-based mechanism for adriamycin-induced cell injury in human
macrophages. FASEB J. 19:1866–1868.
Assad, A., Mohammad, Reza, Z., Abolghasem, J. and Morteza, S. (2011).
Comparing of the effects of hypericin and synthetic antidepressants on the expression
of morphine-induced conditioned place preference. Iran J Pharm Res. 10(3):619–
626.
Auten, R.L. and, Davis J.M. (2009). The nature of the injury will ultimately depend
on specific molecular interactions, cellular locations, and timing of the insult (2009).
Pediatric Research. 66(2):121-7.
Page 76
62
Awang D.V.C. (2009). Tyler's Herbs of Choice: The Therapeutic Use of
Phytomedicinals. Boca Raton, Florida: CRC Press, Taylor and Francis Group.
Baker, R.D., Baker, S.S., LaRosa, K., Whitney, C., Newburger, P.E. (1993).
Selenium regulation of glutathione peroxidase in human hepatoma cell line Hep3B.
Arch Biochem Biophys. 304(1):53-7.
Barathan, M., Mariappan, V., Shankar, E.M., Abdullah, B.J., Goh, K.L., Vadivelu, J.
(2013). Hypericin-photodynamic therapy leads to interleukin-6 secretion by HepG2
cells and their apoptosis via recruitment of BH3 interacting domain death agonist and
caspases. Cell Death Dis. 27;4:e697.
Bashir, A., Perham, R.N., Scrutton, N., Berry, A. (1995). Altering kinetic mechanism
and enzyme stability by mutagenesis of the dimer interface of glutathione reductase.
Biochem J. 312:527–533.
Bauer, H., Fritz-Wolf, K., Winzer, A., Kühner, S., Little, S., Yardley, V., Vezin, H.,
Palfey, B., Schirmer, R.H., Davioud-Charvet, E. (2006). A fluoro analogue of the
menadione derivative 6-[2'-(3'-methyl)-1', 4’-naphthoquinolyl] hexanoic acid is a
suicide substrate of glutathione reductase. Crystal structure of the alkylated human
enzyme. J Am Chem Soc. 128(33):10784-94.
Becker, K., Pons-Kühnemann, J., Fechner, A., Funk, M., Gromer, S., Gross, H.J.,
Grünert, A., Schirmer, R.H. (2005). Effects of antioxidants on glutathione levels and
clinical recovery from the malnutrition syndrome kwashiorkor-a pilot study. Redox
Rep. 10(4):215-26.
Berkholz, D.S., Faber, H.R., Savvides, S.N., Karplus, P.A. (2008). Catalytic cycle of
human glutathione reductase near 1 Å resolution. J Mol Biol. 382(2):371–384.
Betteridge, D.J. (2000). What is oxidative stress. Metabolism. 49(2 Suppl 1):3-8.
Blum, H., Beier, H. and Gross, H.J. (1987). Improved silver staining of plant protein,
RNA and DNA in polyacrylamide gels. Electrophoresis. 8(2):93-99.
Page 77
63
Bocchino, M., Agnese, S., Fagone, E., Svegliati, S., Grieco, D., Vancheri, C.,
Gabrielli, A., Sanduzzi, A., Avvedimento, E.V. (2010). Reactive oxygen species are
required for maintenance and differentiation of primary lung fibroblasts in idiopathic
pulmonary fibrosis. PLoS One. 16;5(11):e14003.
Bonomini, F., Tengattini, S., Fabiano, A., Bianchi, R., Rezzani, R. (2008).
Atherosclerosis and oxidative stress. Histol Histopathol. 23(3):381-90.
Borrás, C., Esteve, J.M., Viña, J. R., Sastre, J., Viña, J., Pallardó, F.V. (2004).
Glutathione regulates telomerase activity in 3T3 fibroblasts. J Biol Chem.
279(33):34332-5.
Bradford, M.M. (1976). A rapid and sensitive method for the quantitation of
microgram quantities of protein utilizing the principle of protein-dye binding. Anal
Biochem. 72:248-54.
Bryan, N.S., Bian, K., Murad, F. (2009). Discovery of the nitric oxide signaling
pathway and targets for drug development. Front Biosci (Landmark Ed). 14:1-18.
Butterweck, V., Böckers, T., Korte, B., Wittkowski W., Winterhoff, H. (2002).
Long-term effects of St. John's wort and hypericin on monoamine levels in rat
hypothalamus and hippocampus. Brain Res. 930(1-2):21-9.
Buytaert, E., Callewaert, G., Hendrickx, N., Scorrano, L., Hartmann, D., Missiaen, L.
(2006). Role of endoplasmic reticulum depletion and multidomain proapoptotic BAX
and BAK proteins in shaping cell death after hypericin-mediated photodynamic
therapy. FASEB J. 20:756–758.
Cadenas, E., Davies, K.J. (2000). Mitochondrial free radical generation, oxidative
stress, and aging. Free Radic Biol Med. 29(3-4):222-30.
Can, B., Kulaksiz Erkmen, G., Dalmizrak, O., Ogus, I., Ozer, N. (2010). Purification
and characterization of rat kidney glutathione reductase. Protein J. 29(4):250-6.
Carlberg, I., Mannervik, B. (1975). Purification and characterization of the
flavoenzyme glutathione reductase from rat liver. J Biol Chem. 250(14):5475–5480.
Page 78
64
CC treatment. (2015). Free Radicals in the Body–Oxidative Stress and the
Antioxidant Response. http://cancercelltreatment.com/2015/08/13/free-radicals-in-
the-body-oxidative-stress-and-the-antioxidant-response/. 20/11/2016.
Cereser, C., Boget, S., Parvaz, P., Revol, A.Y. (2001). Thiram-induced cytotoxicity
is accompanied by a rapid and drastic oxidation of reduced glutathione with
consecutive lipid peroxidation and cell death. Toxicology. 163(2-3):153-62.
Chavez, M.L., Chavez, P.I. (1997). Saint John's Wort. Hosp Pharm. 32(12):1621–32.
Chiricolo, M., Tazzari, P.L., Abbondanza, A., Dinota, A., Battelli M.G. (1991).
Cytotoxicity of, and DNA damage by, active oxygen species produced by xanthine
oxidase. FEBS Letters. 1291(2):173–176.
Collinson, L.P., Dawes, I.W. (1995). Isolation, characterization, and overexpression
of the yeast gene, GLR1, encoding glutathione reductase. Gene. 156(1):123-7.
Crnolatac, I., Huygens A., van Aerschot A., Busson R., Rozenski J., de Witte P.A.
(2005). Synthesis, in vitro cellular uptake and photo-induced antiproliferative effects
of lipophilic hypericin acid derivatives. Bioorg Med Chem. 13:6347–6353.
Dalmizrak, O., Kulaksiz-Erkmen G., Ozer, N. (2016). Fluoxetine-induced toxicity
results in human placental glutathione S-transferase-π (GST-π) dysfunction. Drug
Chem Toxicol. 39(4):439-44.
Dalmizrak, O., Kulaksiz-Erkmen, G., Ozer, N. (2011). The inhibition characteristics
of human placental glutathione S-transferase-π by tricyclic antidepressants:
amitriptyline and clomipramine. Mol Cell Biochem. 355(1-2):223-31.
Dalmizrak, O., Kulaksiz-Erkmen, G., Ozer, N. (2012). Evaluation of the in vitro
inhibitory impact of hypericin on placental glutathione S-transferase pi. Protein J.
31(7):544-9.
Dalmizrak, O., Kulaksiz-Erkmen, G., Ozer, N. (2012). Possible prenatal impact of
sertraline on human placental glutathione S-transferase-π. Hum Exp Toxicol.
31(5):457-64.
Page 79
65
Dhalla, N.S., Temsah, R.M., Netticadan, T. (2000). Role of oxidative stress in
cardiovascular diseases. J Hypertens. 18(6):655-73.
Di Filippo, C., Cuzzocrea, S., Rossi, F., Marfella, R., D'Amico, M. (2006). Oxidative
stress as the leading cause of acute myocardial infarction in diabetics. Cardiovasc
Drug Rev. 24(2):77-87.
Diwu, Z., Lown, J.W. (1993). Photosensitization with anticancer agents. 17. EPR
studies of photodynamic action of hypericin: formation of semiquinone radical and
activated oxygen species on illumination. Free Radic Biol Med. 14:209–215.
Dostalek, M., Hardy, K.D., Milne, G.L., Morrow, J.D., Chen, C., Gonzalez, F J., Gu,
J., Ding X, Johnson D.A, Johnson J.A, Martin M.V, Guengerich F.P. (2008).
Development of oxidative stress by cytochrome P450 induction in rodents is
selective for barbiturates and related to loss of pyridine nucleotide-dependent
protective systems. J Biol Chem. 283(25):17147-57.
Droge, W. (2002). Free radicals in the physiological control of cell function. Physiol
Rev. 82:47–95.
Du, H.Y., Olivo, M., Tan B.K., Bay, B.H. (2003). Hypericin-mediated photodynamic
therapy induces lipid peroxidation and necrosis in nasopharyngeal cancer. Int J
Oncol. 23:1401–1405.
Erat, M., Sakiroglu, H., Ciftci, M. (2003). Purification and characterization of
glutathione reductase from bovine erythrocytes. Prep Biochem Biotechnol.
33(4):283-300.
Finkel, T., Nikki, J. Holbrook. (2000). Oxidants, oxidative stress and the biology of
ageing. Nature. 408:239-247.
Fukai, T., Ushio-Fukai, M. (2011). Superoxide dismutases: Role in redox signaling,
vascular function, and diseases. Antioxid Redox Signal. 15(6):1583–1606.
Galanou, M.C., Theodossiou, T.A., Tsiourvas, D., Sideratou, Z., Paleos, C.M.
(2008). Interactive transport, subcellular relocation and enhanced phototoxicity of
Page 80
66
hypericin encapsulated in guanidinylated liposomes via molecular recognition.
Photochem. Photobiol. 84:1073–1083.
Garg, A.D., Bose, M., Ahmed, M.I, Bonass, W.A., Wood, S.R. (2012). In vitro
studies on erythrosine-based photodynamic therapy of malignant and pre-malignant
oral epithelial cells. PLoS One. 7(4):e34475.
Gizi, A., Papassotiriou, I., Apostolakou, F., Lazaropoulou, C., Papastamataki, M.,
Kanavaki, I., Kalotychou, V., Goussetis, E., Kattamis, A., Rombos, I., Kanavakis, E.
(2011). Assessment of oxidative stress in patients with sickle cell disease: The
glutathione system and the oxidant-antioxidant status. Blood Cells Mol Dis.
46(3):220-5.
Gonzalez, F.J. (2005). Role of cytochromes P450 in chemical toxicity and oxidative
stress: studies with CYP2E1. Mutat Res. 569(1-2):101-10.
Graubaum, W.B. (1981). Handbook for Forensic Individualization of Human Blood
and Blood Stains. Berkeley, CA: Sartorius.
Hames, B.D. (1998). Gel Electrophoresis of Protein. New York: Oxford University
Press.
Head C.S., Luu, Q., Sercarz, J., Saxton, R. (2006). Photodynamic therapy and tumor
imaging of hypericin-treated squamous cell carcinoma. World J Surg Oncol. 4:87.
Henricks, P.A., Nijkamp, F.P. (2001). Reactive oxygen species as mediators in
asthma. Pulm Pharmacol Ther. 14(6):409-20.
Herzenberg, A.L., De Rosa, C.S., Dubs, J.G., Roederer, M., Anderson,T.M., Ela,
W.S. and Deresinski, C.S. (1997). Glutathione deficiency is associated with impaired
survival in HIV disease. Proc Natl Acad Sci U S A. 4;94(5):1967–1972.
Hou, W.C., Liang, H.J., Wang, C.C., Liu, D.Z. (2004). Detection of glutathione
reductase after electrophoresis on native or sodium dodecyl sulfate-polyacrylamide
gels. Electrophoresis. 25(17):2926-31.
Page 81
67
Iskusnykh, I.Y., Popova, T.N., Agarkov, A.A, Pinheiro de Carvalho, M.Â., Rjevskiy,
S.G. (2013). Expression of glutathione peroxidase and glutathione reductase and
level of free radical processes under toxic hepatitis in rats. Journal of Toxicology.
13:1-9.
Jacobson, J.M., Feinman, L., Liebes, L., Ostrow, N., Koslowski, V., Tobia. A.,
Bernard, E., Lee, C.D., Spritzler J. and Prince A.M. (2001). Pharmacokinetics,
safety, and antiviral effects of hypericin, a derivative of St. John's wort plant, in
patients with chronic hepatitis C virus infection. Antimicrob Agents Chemother.
45(2) 517–524.
Jendželovská, Z., Jendželovský, R., Hiľovská, L., Kovaľ, J., Mikeš, J., Fedoročko, P.
(2014). Single pre-treatment with hypericin, a St. John’s Wort secondary metabolite,
attenuates cisplatin- and mitoxantrone-induced cell death in A2780, A2780cis and
HL-60 cells. Toxicol In Vitro. 28(7):1259-73.
Jellin, J.M., Gregory, P.J., Batz, F., Hitchen, K. (2002). Pharmacist's
Letter/Prescriber's Letter Natural Medicines Comprehensive Database. Stockton,
CA: Therapeutic Research Faculty.
Johnston, R.B., Keele, B.B., Misra, H.P., Lehmeyer, J.E., Webb, L.S., Baehner, R.L.,
RaJagopalan, K.V. (1975). The role of superoxide anion generation in phagocytic
bactericidal activity. Studies with normal and chronic granulomatous disease
leukocytes. J Clin Invest. 55(6):1357-72.
Josephy, P.D. (2010). Genetic variations in human glutathione transferase enzymes:
significance for pharmacology and toxicology. Hu Genomics Proteomics.
2010:876940.
Kamerbeek, N.M., van Zwieten, R., de Boer, M., Morren, G., Vuil, H., Bannink, N.,
Lincke, C., Dolman, K.M., Becker, K., Schirmer, R.H., Gromer, S., Roos, D. (2007).
Molecular basis of glutathione reductase deficiency in human blood cells. Blood.
109:3560-3566.
Page 82
68
Karplus, P.A., Schulz, G.E. (1987). Refined structure of glutathione reductase at 1.54
A resolution. J Mol Biol. 195(3):701-29.
Kascakova, S., Nadova Z., Mateasik, A., Mikes, J., Huntosova, V., Refregiers, M.
(2008). High level of low-density lipoprotein receptors enhance hypericin uptake by
U-87 MG cells in the presence of LDL. Photochem Photobiol. 84:120–127.
Kenneth, M., Klemow, Andrew Bartlow., Justin, Crawford, NeiL, Kocher, Jay.,
Shah., and Michael, Ritsick. (2011). Medical Attributes of St. John’s Wort
(Hypericum perforatum). Herbal Medicine: Biomolecular and Clinical Aspects.
Boca Raton, Florida: CRC Press Taylor & Francis.
Khalid, R. (2007). Studies on free radicals, antioxidants, and co-factors. Clin Interv
Aging. 2(2):219–236.
Khansari, N., Shakiba, Y., Mahmoudi, M. (2009). Chronic inflammation and
oxidative stress as a major cause of age-related diseases and cancer. Recent Pat
Inflamm Allergy Drug Discov. 3(1):73-80.
Kisucka, J., Chauhan, A.K., Patten, I.S., Yesilaltay, A., Neumann, C., Van Etten,
R.A., Krieger, M., Wagner, D.D. (2008). Peroxiredoxin 1 prevents excessive
endothelial activation and early atherosclerosis. Circ Res. 103(6):598-605.
Kitiyakara, C., Wilcox, C.S. (1998). Antioxidants for hypertension. Curr Opin
Nephrol Hypertens. 7(5):531–538.
Korsmeyer, S.J., Yin, X.M., Oltvai, Z.N., Veis-Novack, D.J., Linette, G.P. (1995)
Reactive oxygen species and the regulation of cell death by the Bcl-2 gene family.
Biochim Biophys Acta. 1271(1):63-6.
Kowluru, R.A. (2003). Effect of reinstitution of good glycemic control on retinal
oxidative stress and nitrative stress in diabetic rats. Diabetes. 52(3):818-23.
Kraus, G.A., Pratt D, Tossberg, J., Carpenter, S. (1990). Antiretroviral activity of
synthetic hypericin and related analogies. Biochem Biophys Res Commun. 172:149–
153.
Page 83
69
Kulaksiz-Erkmen, G., Dalmizrak, O., Dincsoy-Tuna, G., Dogan, A., Ogus, H., Ozer,
N. (2013). Amitriptyline may have a supportive role in cancer treatment by inhibiting
glutathione S-transferase pi (GST-π) and alpha (GST-α). J Enzyme Inhib Med Chem.
28(1):131-6.
Laemmli, U.K. (1970). Cleavage of structural proteins during the assembly of the
head of bacteriophage T4. Nature. 227(5259):680–685.
Landqvist, N. (1955). On the reaction between urea and formaldehyde in neutral and
alkaline Solutions III experimental studies of the rates of hydrolysis of
monomethylol urea. Acta Chemica Scandinavica. 9(9):1466-1470.
Lavie, G., Valentine, F., Levin, B., Mazur, Y., Gallo, G., Lavie, D., Weiner, D.,
Meruelo, D. (1989). Studies of the mechanisms of action of the antiretroviral agents
hypericin and pseudohypericin. Proc Natl Acad Sci USA. 6:5963–5967.
Lenard, J., Rabson, A., Vanderoef, R. (1993). Photodynamic inactivation of
infectivity of human immunodeficiency virus and other enveloped viruses using
hypericin and rose bengal. Proc Natl Acad Sci USA. 90:158–162.
Li, S., Zhang, J., Li, J., Chen, D., Matteucci, M., Curd, J., Duan, J.X. (2010).
Inhibition of both thioredoxin reductase and glutathione reductase may contribute to
the anticancer mechanism of TH-302. Biol Trace Elem Res. 136(3):294-301.
Liu, C.D., Kwan, D., Saxton, R.E., McFadden, D.W. (2000). Hypericin and
photodynamic therapy decreases human pancreatic cancer in vitro and in vivo. J Surg
Res. 93:137-143.
Lobo, V., Patil, A., Phatak, A., Chandra, N. (2010). Free radicals, antioxidants and
functional foods: Impact on human health. Pharmacogn Rev. 4(8):118–126.
Loren, W. (1999). A Review of the Hypothetical Biogenesis and Regulation of
Hypericin synthesis via the Polyketide Pathway in Hypericum perforatum and
Experimental Methods Proposed to Evaluate the Hypothesis. Portland, OR: Portland
State University.
Page 84
70
Lu, S.C. (2013). Glutathione synthesis. Biochim Biophys Acta. 1830(5): 3143–3153.
Lubos, E., Loscalzo, J., Handy, D.E. (2011). Glutathione peroxidase-1 in health and
disease: From molecular mechanisms to therapeutic opportunities. Antioxid Redox
Signal. 15(7):1957–1997.
Luksiene, Z. (2003). Photodynamic therapy: mechanism of action and ways to
improve the efficiency of treatment. Medicina (Kaunas). 39(12):1137-50.
Maduray, K., and Davids, L.M. (2011) The anticancer activity of hypericin in
photodynamic therapy. J Bioanal Biomed. 6:1-4.
Mandal A. (2016). Antioxidant Enzyme Systems. http://www.news-medical.net/
health / Antioxidant-Enzyme-Systems.aspx, 9/11/2016.
Mannervik, B., Danielson, U.H. (1988). Glutathione transferases-structure and
catalytic activity. CRC Crit Rev Biochem. 23(3):283-337.
Martínez, M.C., Andriantsitohaina, R. (2009). Reactive nitrogen species: molecular
mechanisms and potential significance in health and disease. Antioxid Redox Signa.
11(3):669-702.
Massaad, C.A., Klann, E., (2011). Reactive oxygen species in the regulation of
synaptic plasticity and memory. Antioxid Redox Signal. 14(10): 2013–2054.
Massey, V., Williams C.H, Jr. (1965). On the reaction mechanism of yeast
glutathione reductase. J Biol Chem. 240(11):4470–448.
Mavis, R.D., Stellwagen, E. (1968). Purification and subunit structure of glutathione
reductase from bakers' yeast. J Biol Chem. 243(4):809-14.
Mecocci, P., MacGarvey, U., Kaufman, A.E., Koontz, D., Shoffner, J.M., Wallace,
D.C., Beal, M.F. (1993). Oxidative damage to mitochondrial DNA shows marked
age-dependent increases in human brain. Ann Neurol. 34(4):609-16.
Page 85
71
Meruelo, D., Lavie, G., Lavie, D. (1988). Therapeutic agents with dramatic
antiretroviral activity and little toxicity at effective doses: aromatic polycyclic diones
hypericin and pseudohypericin. Proc Natl Acad Sci USA. 85(14):5230-4.
Mikeš, J., Hýžd'alová, M., Kočí, L., Jendželovský, R., Koval', J., Vaculová, A.
(2011). Lower sensitivity of FHC fetal colon epithelial cells to photodynamic therapy
compared to HT-29 colon adenocarcinoma cells despite higher intracellular
accumulation of hypericin. Photochem Photobiol Sci. 10:626–632.
Mikeš, J., Kleban, J., Sacková V., Horváth, V., Jamborová, E., Vaculová, A. (2007).
Necrosis predominates in the cell death of human colon adenocarcinoma HT-29 cells
treated under variable conditions of photodynamic therapy with hypericin.
Photochem Photobiol Sci. 6:758–766.
Mills, G.C. (1957). Hemoglobin catabolism. I. Glutathione peroxidase, an
erythrocyte enzyme which protects hemoglobin from oxidative breakdown. J Biol
Chem. 229(1):189-97.
Moraleda, G., Wu, T.T., Jilbert, A.R., Aldrich, C.E., Condreay, L.D., Larsen, S.H.,
Tang, J.C., Colacino, M., Mason, W.S., (1993). Inhibition of duck hepatitis B virus
replication by hypericin. Antivir Res. 20:235–247.
Muller, E.G. (1996). A glutathione reductase mutant of yeast accumulates high levels
of oxidized glutathione and requires thioredoxin for growth. Mol Biol Cell.
7(11):1805–1813.
Murad, F. (1996). Signal transduction using nitric oxide and cyclic guanosine
monophosphate. JAMA. 279:1189–1189.
Mustacich, D. and Powis, G. (2000). Thioredoxin reductase. Biochem J. 346(Pt 1):1–
8.
Nishiuchi, T., Utsumi, T., Kanno, T., Takehara, Y., Kobuchi, H., Yoshioka, T.,
Horton, A. A., Yasuda, T., Utsumi, K. (1995). Inhibition of neutrophil superoxide
generation by hypericin, an antiretroviral agent. Arch Biochem Biophys. 323(2):335-
42.
Page 86
72
Ogüs, H., Ozer N. (1998). Purification of NADPH-free glutathione disulfide
reductase from human erythrocytes. Protein Expr Purif. 13(1):41-4.
Ott, M., Gogvadze, V., Orrenius, S., Zhivotovsky, B. (2007). Mitochondria,
oxidative stress and cell death. Apoptosis. 12(5):913-22.
Outten, C.E., Culotta, V.C. (2013). Alternative Start Sites in the S. cerevisiae GLR1
Gene are Responsible for Mitochondrial and Cytosolic Isoforms of Glutathione
Reductase. J Biol Chem. 27:279(9).
Pacher, P., Beckman, J.S., Liaudet L. (2007). Nitric oxide and peroxynitrite in health
and disease. Physiol Rev. 87(1):315-424.
Pastrana-Mena, R., Dinglasan, R.R., Franke-Fayard, B., Vega-Rodríguez, J.,
Fuentes-Caraballo, M., Baerga-Ortiz, A., Coppens, I., Jacobs-Lorena, M., Janse C.J.,
Serrano, A.E. (2010). Glutathione reductase-null malaria parasites have normal blood
stage growth but arrest during development in the Mosquito. J Biol Chem.
285(35):27045-56.
Pence, S., Erkutlu, I., Kurtul, N., Bosnak, M., Alptekin, M., Tan, U. (2009).
Antiepileptogenic effects of glutathione against increased brain ADA in PTZ-
induced epilepsy. Int J Neurosci. 119(5):616-29.
Percy, M.E. (1984).Catalase: an old enzyme with a new role. Can J Biochem Cell
Biol. 62(10):1006-14.
Perry, J.J., Fan, L., Tainer, J.A. (2007). Developing master keys to brain pathology,
cancer and aging from the structural biology of proteins controlling reactive oxygen
species and DNA repair. Neuroscience. 145(4):1280-99.
Petrich J.W. (2000) Excited-state intramolecular H-atom transfer in nearly
symmetrical perylene quinones: Hypericin, hypocrellin, and their analogues. Int Rev
Phys Chem. 19:479–500.
Pocernicha, C.B. and Butterfield D.A. (2012). Elevation of glutathione as a
therapeutic strategy in Alzheimer disease. Biochim Biophys Acta. 1822(5):625–630.
Page 87
73
Powers, S.K. and Jackson, M.J. (2008). Exercise-induced oxidative stress: cellular
mechanisms and impact on muscle force production. Physiol Rev. 88(4):1243-1276.
Raedschelders, K., Ansley, D.M., Chen, D.D.Y. (2012). The cellular and molecular
origin of reactive oxygen species generation during myocardial ischemia and
reperfusion. Pharmacol Ther. 133:230–25.
Ren, B., Huang, W., Akesson, B., Ladenstein, R. (1997). The crystal structure of
seleno-glutathione peroxidase from human plasma at 2.9 A resolution. J Mol Biol.
268(5):869-85.
Roum, J.H., Buhl, R., McElvaney, N.G., Borok, Z., Crystal, R.G. (1985). Systemic
deficiency of glutathione in cystic fibrosis. J Appl Physiol. 75(6):2419-24.
Rubio, N., Coupienne, I., Di, V.E., Heirman I., Grooten J., Piette J. (2012).
Spatiotemporal autophagic degradation of oxidatively damaged organelles after
photodynamic stress is amplified by mitochondrial reactive oxygen species.
Autophagy. 8:1312–132.
Sattler, S., Schaefer, U., Schneider, W., Hoelzl, J., Lehr, C.M. (1997). Binding,
uptake, and transport of hypericin by Caco-2 cell monolayers. J Pharm Sci. 86:
1120–1126.
Schrader, M., Fahimi, D. (2006). Peroxisomes and oxidative stress. Biochim Biophys
Acta. 1763(12):1755-66.
Scibior, D., Czeczot, H. (2006).Catalase: structure, properties. Functions Postepy
Hig Med Dosw (Online). 60:170-80.
Seefeldt, T., Dwivedi, C., Peitz, G., Herman, J., Carlson, L., Zhang, Z., Guan, X.J.
(2005). Acetylamino-3-[4-(2-acetylamino-2-carboxyethyl-) phenylcarbamoyl
sulfanyl] propionic acid and its derivatives as a novel class of glutathione reductase
inhibitors. Med Chem. 48(16):5224–5231.
Segel, I.R. (1975). Enzyme Kinetics: Behavior and Analysis of Rapid Equilibrium
and Steady-State Enzyme Systems. Toronto: Wiley.
Page 88
74
Sheehan, D., Meade, G., Foley, V.M., Dowd, C.A. (2001). Structure, function and
evolution of glutathione transferases: implications for classification of non-
mammalian members of an ancient enzyme superfamily. Biochem J. 360:1–16.
Siboni, G., Weitman, H., Freeman, D., Mazur, Y., Malik, Z., Ehrenberg, B. (2002).
The correlation between hydrophilicity of hypericins and helianthrone:
internalization mechanisms, subcellular distribution and photodynamic action in
colon carcinoma cells. Photochem Photobiol Sci. 1(7):483-91.
Sienko, S., Eis-Hübinger, A.M., Schneweis, K.E. (1991). The role of free radical
scavengers, inhibitors of prostaglandin synthesis, and hypomethylating agents in
reactivation of latent herpes simplex virus. Med Microbiol Immunol. 180(5):249-59.
Smeyne, M., Smeyne, R.J. (2013). Glutathione metabolism and Parkinson's disease.
Free Radic Biol Med. 62:13-25.
Sørensen, M.G., Karsdal, M.A., Dziegiel, M.H., Boutin, J.A., Nosjean, O.,
Henriksen, K. (2010). Screening of protein kinase inhibitors identifies PKC
inhibitors as inhibitors of osteoclastic acid secretion and bone resorption. BMC
Musculoskelet Disord. 11(250):1-11.
Staffeldt, B., Kerb, R., Brockmöller, J., Ploch, M., Roots, I. (1994).
Pharmacokinetics of hypericin and pseudohypericin after oral intake of the
hypericum perforatum extract LI 160 in healthy volunteers. J Geriatr Psychiatry
Neurol. 10(3):114-8.
Suzuki, O., Oya, M., Bladt, S., Wagner, H. (1984). Inhibition of monoamine oxidase
by hypericin. Planta Med. 2:272.
Takenaka, A., Kizawa, K., Hata, T., Sato, S., Misaka, E., Tamura, C., Sasada, Y.
(1988). X-ray study of baker's yeast lipoamide dehydrogenase at 4.5 A resolution by
molecular replacement method. J Biochem. 103(3):463-9.
Tandoğan, B., Ulusu, N. (2007). The inhibition kinetics of yeast glutathione
reductase by some metal ions. J Enzyme Inhib Med Chem. 22(4):489-95.
Page 89
75
Tang, J., Colacino, J.M., Spitzer, W. (1990). Virucidal activity of hypericin against
enveloped and non-enveloped DNA and RNA viruses. Antivir Res. 3:313–326.
Tatsuzawa, H., Maruyama, T., Hori, K. (1999). Singlet oxygen as the principal
oxidant in myeloperoxidase-mediated bacterial killing in neutrophil phagosomes.
Biochim Biophys Res Commun. 262:647–50.
Tauber, A.I., Borregaard, N., Simons, E., Wright, J. (1983). Chronic granulomatous
disease: a syndrome of phagocyte oxidase deficiencies. Medicine (Baltimore).
62(5):286-309.
Thomas, C., MacGill, R.S., Miller, G.C., Pardini, R.S. (1992). Photoactivation of
hypericin generates singlet oxygen in mitochondria and inhibits succinoxidase.
Photochem Photobiol. 55(1):47-53.
Townsend, D.M. and Tew, K.D. (2003). The role of glutathione-S-transferase in anti-
cancer drug resistance. Oncogene. 22:7369-737.
Tuna, G., Kulaksiz Erkmen, G., Dalmizrak, O., Dogan, A., Ogus, H., Ozer, N.
(2010). Inhibition characteristics of hypericin on rat small intestine glutathione-S-
transferases. Chem Biol Interact. 188(1):59-65.
Turk, S., Kulaksiz Erkmen, G., Dalmizrak, O., Ogus, H., Ozer, N. (2015).
Purification of glutathione S-transferase pi from erythrocytes and evaluation of the
inhibitory effect of hypericin. Protein J. 34(6):434-43.
Untucht-Grau, R., Schirmer, R.H., Schirmer, I., Krauth-Siegel, R.L. (1981).
Glutathione reductase from human erythrocytes: amino-acid sequence of the
structurally known FAD-binding domain. Eur J Biochem. 120(2):407-19.
Valko, M., Rhodes, C.J., Moncol, J., Izakovic, M., Mazur, M. (2006). Free radicals,
metals and antioxidants in oxidative stress-induced cancer. Chem Biol Interact.
160(1):1-40.
Page 90
76
Wei, Y.H., Ma, Y.S., Lee, H.C., Lee, C.F., Lu, C.Y. (2001). Mitochondrial theory of
aging matures--roles of mtDNA mutation and oxidative stress in human aging.
Zhonghua Yi Xue Za Zhi (Taipei). 64(5):259-70.
Wendell, P.L. (1968). Distribution of glutathione reductase and detection of
glutathione-cysteine transhydrogenase in rat tissues. Biochim Biophys Acta.
159(1):179-81.
Weydert, C.J., Cullen, J.J. (2010). Measurement of superoxide dismutase, catalase
and glutathione peroxidase in cultured cells and tissue. Nature Protocols. 5(1):51-66.
Willmore, W.G., Storey, K.B. (2007). Purification and properties of glutathione
reductase from liver of the anoxia-tolerant turtle Trachemys Scripta Elegans.
Biochem. 297: 139.
Wilson, C.M. (1979). Studies and critique of Amido Black 10B, Coomassie
Brilliant Blue R and fast Green FCF as stains for proteins after polyacrylamide
gel electrophoresis. Anal Biochem. 96(2):263-273.
Wruck, C.J., Fragoulis, Gurzynski, Brandenburg, L.O., Kan, Y.W., Chan, K.,
Hassenpflug, J., Freitag-Wolf, S., Varoga, D., Lippross, S., Pufe, T. (2011). Role of
oxidative stress in rheumatoid arthritis: insights from the Nrf2-knockout mice. Ann
Rheum Dis. 70(5):844-50.
Yee, K.K., Soo, K.C., Olivo, M. (2005). Anti-angiogenic effects of Hypericin-
photodynamic therapy in combination with Celebrex in the treatment of human
nasopharyngeal carcinoma. Int J Mol Med. 16:993-1002.
Young, I.S., Woodside, J.V. (2001). Antioxidants in health and disease. J Clin
Pathol. 54(3):176-86.
Yu, E., Mercer, J., Bennett, M. (2012). Mitochondria in vascular disease.
Cardiovascular Research. 95:173–182.
Yu, J., Zhou, C.Z. (2007). Crystal structure of glutathione reductase Glr1 from the
yeast Saccharomyces cerevisiae. Proteins. 68(4):972-9.
Page 91
77
Yuan, L., Kaplowitz, N. (2009). Glutathione in liver diseases and hepatotoxicity. Mol
Aspects Med. 30(1-2):29-41.
Zhang, Q., Li, ZH., Li, Y.Y., Shi, S.J., Zhou, S.W., Fu, Y.Y., Zhang, Q., Yang, X.,
Fu, R.Q., Lu, L.C. (2015). Hypericin-photodynamic therapy induces human
umbilical vein endothelial cell apoptosis. Sci Rep. 5:18398.
Zhao, Y., Seefeldt, T., Chen, W., Wang, X., Matthees, D., Hu, Y., Guan, X. (2009).
Effects of glutathione reductase inhibition on cellular thiol redox state and related
systems. Arch Biochem Biophy. 485(1):56–62.