FINAL REPORT for Edmonton Transit System Trolley Operations Review Strategic Alternatives Edmonton January 23 rd , 2004 This document is confidential and is intended solely for the use and information of the client to whom it is addressed. Edmonton Transit System
Transcript
FINAL REPORT forEdmonton Transit System
Trolley Operations ReviewStrategic Alternatives
EdmontonJanuary 23rd, 2004
This document is confidential and is intended solely for the use and information of the client to whom it is addressed.
Edmonton Transit System
1
Edmonton Transit System
DISCLAIMERThis Report was prepared by Booz Allen Hamilton to assist Edmonton Transit System (ETS) with evaluating operational, environmental, and cost impacts associated with continued operation of it's trolley bus system. The information presented was developed to facilitate comparative analyses, and to help frame the long term consequences of alternative bus procurement decisions. In this context, the data presented was not developed to support detailed budgetary, operational, or financial planning. Further, the Report does not address issues associated with customer preferences for specific types of buses, perceived historical value of the trolley system, or other subjective preference measures. This Report is focused on analyzing alternative bus procurement strategies specifically for the City of Edmonton given the particular cost, environmental, operational, infrastructure, institutional, duty cycle and regulatory factors that are “in-play” in Edmonton. The observations and analyses therefore cannot, and should not, be generalized or applied to support decisions for other transit agencies operating in North America or internationally. The particular economic factors, service environments and regulations in other cities, (or in other parts of the world), may indeed support differing observations and conclusions related to bus technologies.
2
Edmonton Transit System
Table of Contents
Study background and issuesIndustry overviewEvaluation issuesRegional emissions perspectiveRegulations and diesel emissionsCalculation of emissions factorsTwo future scenariosScenario analysis and comparisonSummary observations
3
Study Background and Issues
4
Edmonton Transit System
Study background and issues….Edmonton Transit System (ETS) currently operates nearly 740 diesel buses and 59 electric trolley buses (ETBs)
The diesel bus fleet is old overall, (average age of nearly 13 years; 40% are over 20 years old), and ETS is now engaged in a sustained bus replacement and rehabilitation program in an effort to renew the fleet
The trolley fleet is also old (purchased in 1982) and is currently scheduled to be retired and replaced with new trolleys in the 2010 timeframe
ETS has long recognized that overall costs for operating trolleys are somewhat higher than for diesels—but that trolleys have traditionally offered environmental advantages as well as reduced noise
Operating a trolley system presents special challenges for public transit agencies relative to service and route design, maintenance operations, as well as responding to various incidents that might temporarily disrupt trolley service. Historically, ETS has met these challenges and has provided reliably trolley service. However, utilization of the trolley network has suffered in recent years
ETS is also aware that diesel engine technology continues to improve and that emission regulations are becoming more stringent. Further, ETS is actively involved in programs to reduce emissions from their current fleet (Particulate Trap demonstration and testing)
Finally, ETS is under considerable pressure to reduce both capital and operating costs—with this background, Booz Allen Hamilton was retained to assist ETS with evaluating the costs and benefits of continuing to offer trolley service
5
Edmonton Transit System
Background and issues…
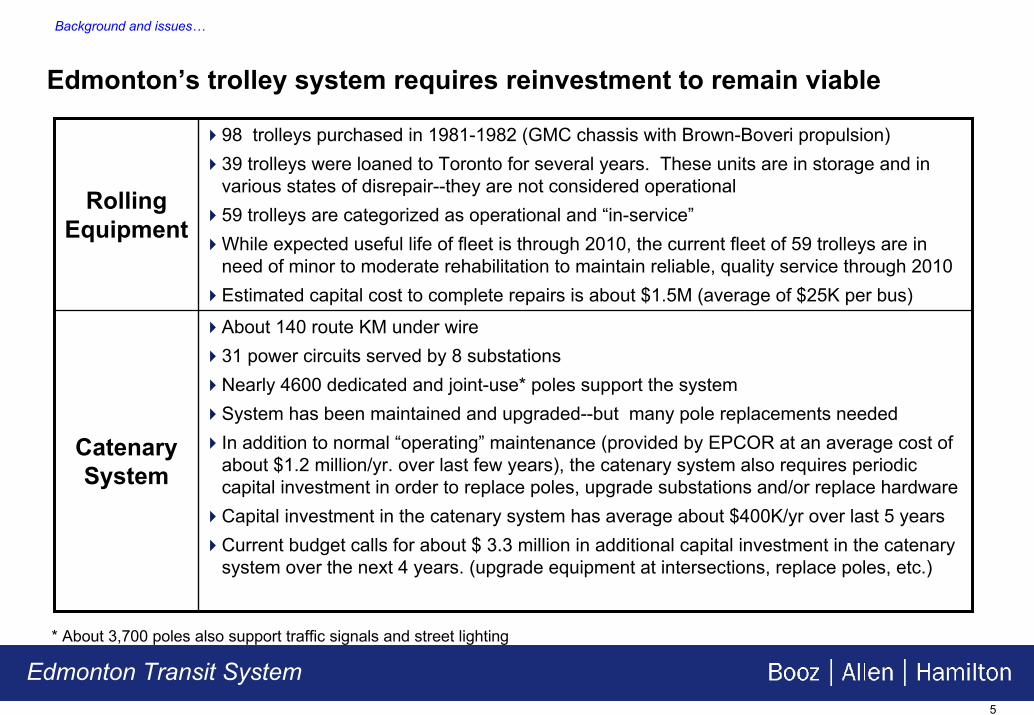
Edmonton’s trolley system requires reinvestment to remain viable
About 140 route KM under wire31 power circuits served by 8 substationsNearly 4600 dedicated and joint-use* poles support the systemSystem has been maintained and upgraded--but many pole replacements neededIn addition to normal “operating” maintenance (provided by EPCOR at an average cost of about $1.2 million/yr. over last few years), the catenary system also requires periodic capital investment in order to replace poles, upgrade substations and/or replace hardware Capital investment in the catenary system has average about $400K/yr over last 5 yearsCurrent budget calls for about $ 3.3 million in additional capital investment in the catenary system over the next 4 years. (upgrade equipment at intersections, replace poles, etc.)
Catenary System
98 trolleys purchased in 1981-1982 (GMC chassis with Brown-Boveri propulsion)39 trolleys were loaned to Toronto for several years. These units are in storage and in various states of disrepair--they are not considered operational59 trolleys are categorized as operational and “in-service”While expected useful life of fleet is through 2010, the current fleet of 59 trolleys are in need of minor to moderate rehabilitation to maintain reliable, quality service through 2010Estimated capital cost to complete repairs is about $1.5M (average of $25K per bus)
Rolling Equipment
* About 3,700 poles also support traffic signals and street lighting
6
Edmonton Transit System
Background and issues…
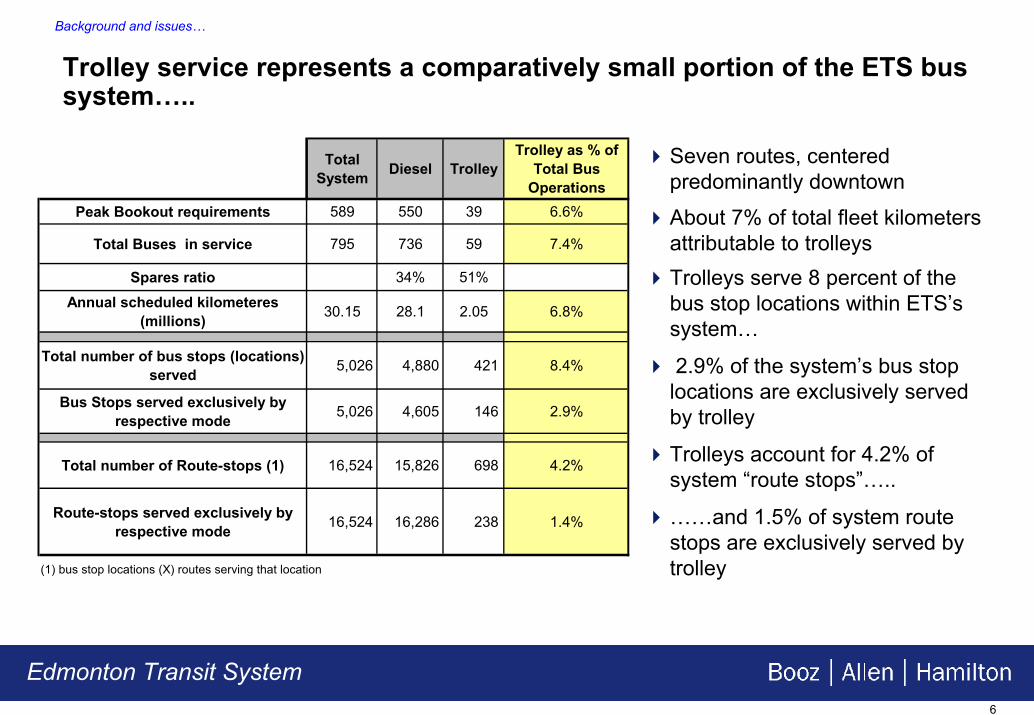
Trolley service represents a comparatively small portion of the ETS bus system…..
Seven routes, centered predominantly downtownAbout 7% of total fleet kilometers attributable to trolleysTrolleys serve 8 percent of the bus stop locations within ETS’s system…
2.9% of the system’s bus stop locations are exclusively served by trolley
Trolleys account for 4.2% of system “route stops”…..
……and 1.5% of system route stops are exclusively served by trolley
Source: APTA statistics, Interviews with transit agencies
Three N.A. cities, (Vancouver, San Francisco and Seattle) operate substantial, growing trolley systems
Dayton operates a similarly sized system as Edmonton
Boston’s system is quite small (peak bookout of 28 buses) and serves the Cambridge area exclusively
Vancouver is in the process of purchasing 205 new 40ft low floor trolleys as well as 40 articulated trolleys
Seattle has recently renewed it’s commitment to trolley bus service. To keep down new bus costs, they have taken a unique approach of salvaging electric propulsion systems from old ETBs and installing it in new chassis/bodies
9
Edmonton Transit System
Industry overview and trends…
Electric Trolley Buses were once the dominant mode of public transportation in North America…
City Date Opened
Date Closed Fleet City Date
OpenedDate
Closed FleetAkron OH 12-Nov-41 6-Jun-59 12 Brill, 20 Twin, 38 ACF-Brill Little Rock AR 26-Dec-47 1-Mar-56 29 ACF-Brill, 6 Marmon-HerringtonAtlanta GA 28-Jun-37 27-Sep-63 171 St. Louis, 194 Pullman, 40 ACF-Brill Louisville KY 27-Dec-36 7-May-51 60 BrillBaltimore MD 6-Mar-38 21-Jun-59 10 Brill, 11 Mack, 106 Pullman, 63 ACF-Brill Los Angeles CA 3-Aug-47 31-Mar-63 110 ACF-BrillBirmingham AL 30-Apr-47 22-Nov-58 148 Pullman Memphis TN 8-Nov-31 22-Apr-60 14 St. Louis, 184 Pullman, 45 ACF-BrillBoston MA 11-Apr-36 present 438 Pullman, 5 Twin, 25 ACF-Brill, 50 Flyer Mexico City 6-Apr-52 present 581 MASA/Toshiba Brooklyn NY 23-Jul-30 26-Jul-60 1 ACF, 1 Twin, 13 Pullman, 200 St. Louis Milwaukee WI 8-Nov-36 20-Jun-65 179 Pullman, 142 Marmon-HerringtonCalgary, Alberta 1-Jun-47 8-Mar-75 85 CCF-Brill, 20 ACF-Brill Minneapolis MN 5-May-22 22-May-23 1 Lansden/AC-Brill, 1 TCRTCamden NJ 1-Sep-35 1-Jun-47 [included in Newark fleet] Montréal, Québec 29-Mar-37 18-Jun-66 7 AEC, 105 CCF-BrillChicago IL 17-Apr-30 25-Mar-73 121 ACF-Brill, 349 Marmon-Herrington New Orleans LA 2-Dec-29 26-Mar-67 154 St. Louis, 49 Marmon-HerringtonCincinnati OH 1-Dec-36 18-Jun-65 60 St. Louis, 244 Marmon-Herrington Newark NJ 15-Sep-35 10-Nov-48 1 Mack, 582 Yellow, 1 GMCleveland OH 1-Mar-36 14-Jun-63 175 St. Louis, 125 Marmon-Herrington, 1 Twin Ottawa, Ontario 15-Dec-51 27-Jun-59 10 CCF-BrillColumbus OH 3-Dec-33 3-May-65 15 Pullman, 165 Marmon-Herrington Peoria IL 13-Nov-31 3-Oct-46 5 Brill Ohio, 2 St. LouisCornwall, Ontario 8-Jun-49 31-May-70 16 CCF-Brill Petersburg VA 19-Jun-23 31-Dec-26 5 BrillCovington KY 11-Jul-37 17-Mar-58 10 Mack, 5 Marmon-Herrington, 6 ACF-Brill Philadelphia PA 14-Oct-23 27-Jun-03 71 Marmon-Herrington, 110 AMG-FlyerDallas TX 25-Nov-45 28-Jul-66 54 ACF-Brill, 26 Marmon-Herrington Portland OR May-35 23-Oct-58 141 Mack, 50 KenworthDayton 25-Mar-38 present 64 Flyer, 2 BBC-GMC, 57 ETI/Skoda Providence RI 26-Dec-31 14-Jun-55 31 Brill, 323 PullmanDenver CO 2-Jun-40 10-Jun-55 80 ACF-Brill, 66 Marmon-Herrington Regina, Saskatchewan 4-Sep-47 28-Feb-66 55 CCF-BrillDes Moines IA 9-Oct-38 24-Jan-64 60 Brill, 85 ACF-Brill, 2 St. Louis Rochester NY 1-Nov-23 22-Mar-32 12 BrockwayDuluth MN 5-Oct-31 15-May-57 20 Brill, 9 Twin, 3 Pullman Rockford IL 10-Dec-30 6-Jun-47 4 BrillEdmonton, Alberta 24-Sep-39 present 92 CCF-Brill, 37 Flyer, 100 BBC-GMC Saint Joseph MO 1-Aug-32 22-Nov-66 1 Brill Ohio, 34 Brill, 25 ACF-BrillFitchburg MA 10-May-32 30-Jun-46 8 Brill Ohio San Francisco CA 7-Sep-41 present 345 Flyer, 60? New Flyer, ? ETI/Skoda Flint MI 1-Mar-37 26-Mar-56 46 Yellow, 30 ACF-Brill Saskatoon 22-Nov-48 13-May-74 30 CCF-BrillFort Wayne IN 7-Jul-40 12-Jun-60 68 Brill, 10 ACF-Brill Seattle WA 28-Apr-40 present 109 AMG-Flyer, ? M.A.N., 236 Breda, 100 Gillig Greensboro NC 15-Jul-34 5-Jun-56 2 Perly Thomas, 5 Brill, 8 Pullman, 1 Twin Shreveport LA 15-Dec-31 26-May-65 36 ACF-Brill, 5 Marmon-HerringtonGreenville SC 19-Aug-34 20-Feb-56 8 Brill, 13 Pullman, 15 Mack, 4 Twin, 1 Southern Staten Island NY 8-Oct-21 16-Oct-27 7 Atlas, 15 BrockwayHalifax, Nova Scotia 27-Mar-49 31-Dec-69 81 CCF-Brill, 6 Pullman Thunder Bay, Ontario 1-Jan-70 16-Jul-72 20 CCF-BrillHamilton, Ontario 10-Dec-50 30-Dec-92 48 CCF-Brill, 56 Flyer Toledo OH 1-Feb-35 28-May-52 18 Mack, 3 St. Louis, 1 WestramHonolulu 1-Jan-38 22-Jun-57 90 Brill, 25 ACF-Brill Topeka KS 27-Mar-32 30-Jun-40 4 BrillIndianapolis IN 4-Dec-32 10-May-57 190 Brill, 90 Marmon-Herrington, 10 ACF-Brill Toronto, Ontario 19-Jun-47 19-Jul-93 152 Western Flyer, 40 BBC-GMCJohnstown PA 20-Nov-51 11-Nov-67 10 Brill, 6 ACF-Brill, 5 Marmon-Herrington Vancouver, BC 16-Aug-48 present 364 CCF-Brill, 24 Pullman, 296 FlyerKansas City MO 29-May-38 4-Jan-59 20 ACF-Brill, 60 Marmon-Herrington Wilkes-Barre PA 15-Dec-39 29-Aug-47 19 Mack, 14 Brill, 34 ACF-Brill, 1 WestramKenosha WI 15-Feb-32 Mar-52 12 Yellow, 10 St. Louis Wilmington DE 24-Sep-39 6-Dec-57 69 Brill, 3 MackKitchener, Ontario 1-Jan-47 26-Mar-73 21 CCF-Brill Winnipeg, Manitoba 21-Nov-38 30-Oct-70 26 Pullman, 104 CCF-Brill, 10 ACF-BrillKnoxville TN 28-Apr-30 1-Jul-45 4 Cincinnati Youngstown OH 11-Nov-36 10-Jun-59 54 Twin, 13 ACF-Brill, 10 Marmon-Herrington
Source: “Electric Trolley Bus” website_ Richard DeArmand
10
Edmonton Transit System
Industry overview and trends…
…and although trolleys were preferred in the 1930’s through the early 1960’s, most have now been replaced by diesel service
Early gasoline powered transit buses generally did not have the power needed to meet the demanding transient duty cycles (heavy start/stops) typical of city bus service. Reliability and durability of gasoline and early diesel engines was also poor—and, transmissions also did not perform well under such transient conditions
In contrast, trolley’s equipped with high-torque electric motors were well suited for transit bus applications. They exhibited excellent acceleration under heavy load—and good reliability in heavy start/stop service
In the late 1950’s and 60’s Detroit Diesel Allison introduced their 2-stroke diesel engines to the transit market. These engines had significantly improved reliability and power over previous (gasoline) engine offerings. Within a decade and a half, the large majority of public transit properties abandoned their trolley systems in favor of the more flexible, and less expensive, diesel powered buses. In that era, environmental impacts of such decisions were largely ignored—so the increased emissions from diesels was not a “show-stopper”
The public transit industry has benefited from the fact that the same diesel powered drivetrains used in trucks are also used in buses. Diesel engines and transmissions have dramatically improved over the last 30 years—largely because of the huge R&D budgets (and manufacturing economies-of-scale) that are being driven by a very large heavy-duty truck market. (There are about 200,000 heavy-duty class 8 trucks sold each year compared with about 3,500 public transit buses.). Today, the heavy duty diesel drivetrain market in North America is extremely competitive with several major engine manufacturers including Detroit Diesel Corporation, Caterpillar, Cummins, International, Ford, Mack, Volvo, and John Deere
By comparison, the market for electric powered buses has all but disappeared in North America. We are not aware of any major North American firms who are actively engaged in the development and manufacture of electric drivetrains for transit bus applications
11
Edmonton Transit System
Industry overview and trends…
The downward trend for trolley appears to be continuing…
Toronto shut down in 1993
Hamilton shut down in 1992
Philadelphia suspended trolley service this past summer– Initially service was suspended to accommodate major bus terminal construction– Philadelphia’s fleet of trolley buses are old (20 years+) and will need to be replaced soon– The overhead system requires continuous capital investment in addition to “normal”
maintenance– With this background, and because of severe financial pressures, Philadelphia is
considering their long-term trolley system plans
12
Edmonton Transit System
Industry overview and trends…
While overall costs of providing trolley service varies from city to city…cost considerations generally do not favor trolleys today…
Acquisition costs have been driven up by the limited market for ETBs, and by the very intermittent demand for them. Auxiliary power units (APUs) can also drive costs up considerably
Energy/fuel costs (diesel versus electricity) can tilt either way, but are within a relatively small range – and they are a relatively small part of the overall ownership and operating cost equation
Vehicle maintenance costs are also similar between trolley and diesel buses…and would appear to be linked more to particular bus designs and quality of the manufacturer rather than inherent differences between diesel and trolley technology
Maintenance and renewal of the overhead catenary system are a significant costs that accrue only to ETBs:– Substation maintenance– Poles and support system– Overhead wire
13
Edmonton Transit System
Industry overview and trends…
Nevertheless, trolleys offer operating and service advantages for some transit agencies, depending on local or regional conditions…
Geography -- Trolley buses generally perform well on steep grades under heavy loads—making them a good choice for cities such as San Francisco or Seattle
Service level– Trolleys work best on high density routes with frequent service—(e.g. little or no change in service frequency between peak and off-peak hours)—thus increasing the utilization and investment in the catenary system
Environmental and Energy impact – Trolleys’ environmental advantages are best leveraged in cities supplied predominantly by nuclear and/or hydro power—or where electric power is comparatively inexpensive
Politics and service demographics – There is often strong popular support and historic preference for trolleys in selected urban settings:– University and park areas– Long-term attachment to trolleys as part of neighborhood “character”– Aversion to the condition, quality, and performance of diesel services locally available
14
Evaluation issues
15
Edmonton Transit System
Evaluation issues…
For Edmonton, several issues should be considered in evaluating the disposition of the Trolley fleet
Operating costs – Energy Efficiency– Fuel costs– Bus maintenance– Overhead (catenary) maintenance
Capital costs– Buses– Overhead (poles, substations, etc.)
Air quality in the Edmonton area—and Regional versus localized emissions considerations
Emissions considerations– Future regulations– Projected emission inventories from bus operations
Noise impacts
These issues are addressed in the following pages
16
Edmonton Transit System
Evaluation issues…
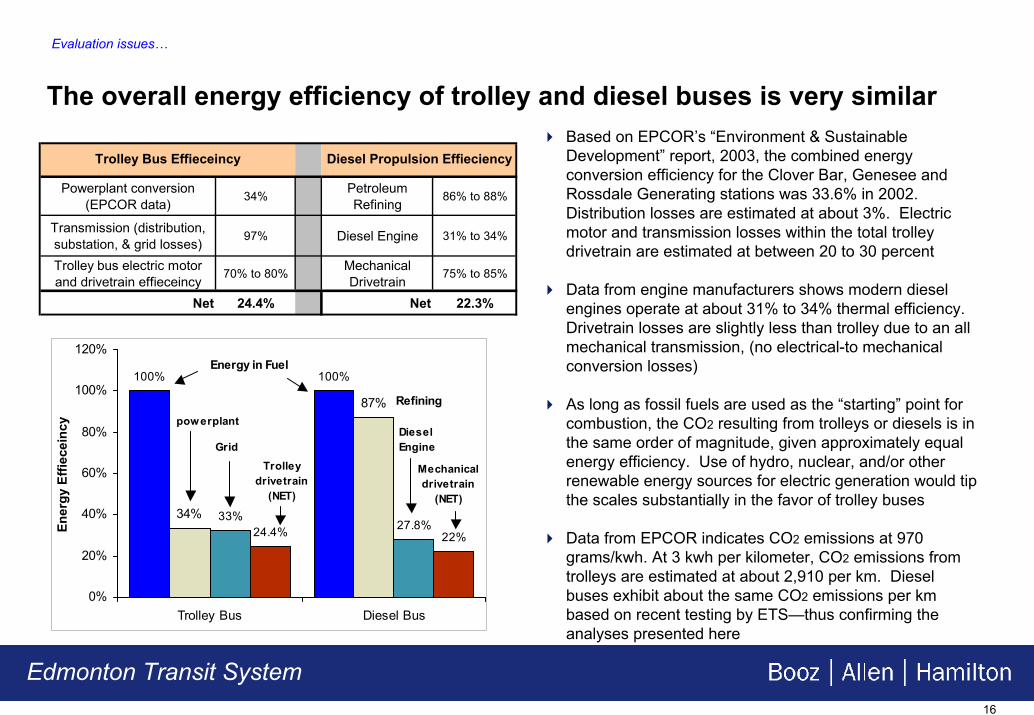
The overall energy efficiency of trolley and diesel buses is very similarBased on EPCOR’s “Environment & Sustainable Development” report, 2003, the combined energy conversion efficiency for the Clover Bar, Genesee and Rossdale Generating stations was 33.6% in 2002. Distribution losses are estimated at about 3%. Electric motor and transmission losses within the total trolley drivetrain are estimated at between 20 to 30 percent
Data from engine manufacturers shows modern diesel engines operate at about 31% to 34% thermal efficiency. Drivetrain losses are slightly less than trolley due to an all mechanical transmission, (no electrical-to mechanical conversion losses)
As long as fossil fuels are used as the “starting” point for combustion, the CO2 resulting from trolleys or diesels is in the same order of magnitude, given approximately equal energy efficiency. Use of hydro, nuclear, and/or other renewable energy sources for electric generation would tip the scales substantially in the favor of trolley buses
Data from EPCOR indicates CO2 emissions at 970 grams/kwh. At 3 kwh per kilometer, CO2 emissions from trolleys are estimated at about 2,910 per km. Diesel buses exhibit about the same CO2 emissions per km based on recent testing by ETS—thus confirming the analyses presented here
Trolley bus electric motor and drivetrain effieceincy 70% to 80% Mechanical
Drivetrain 75% to 85%
Net 24.4% Net 22.3%
Trolley Bus Effieceincy Diesel Propulsion Effieciency
17
Edmonton Transit System
Evaluation issues…
Edmonton’s per-kilometer energy (fuel) costs for diesels and trolleys are close…and this is likely to hold true in the future
Petroleum prices (diesel) are forecasted to remain stable for foreseeable future. However, international conflicts, embargos and other market disruptions could alter “natural” supply and demand economics for world wide oil
Fuel Use and Energy Price Assumptions
Fuel economy (km per liter) 1.95 Fuel economy (kwh per km) 3.00
Diesel fuel cost per liter $0.47 Electricity cost per kwh $0.08
Fuel cost per km $0.24 Fuel cost per km $0.24
Diesel Fuel Costs Trolley Fuel Costs
Historically, electricity and petroleum pricing tend to track each (other over the long term) since a large portion of electric power is supplied from coal and natural gas—and, to a significant degree, these fossil fuels compete with (i.e. can be substituted for) petroleum in several markets
ETS has recently renegotiated it’s electricity rates with suppliers—and is now enjoying comparatively low costs per kilowatt-hour
ETS could negotiate with electric power suppliers to purchase a higher percentage of power derived from “renewable” sources such as biomass, wind, or solar—but pricing per kwh would of course increase. (In reality, ETS would not actually receive power supplied from these sources since both suppliers and consumers share the distribution grid. Rather, ETS would simply be investing in such sources. ETS could choose to support these renewable energy sources by purchasing such power for it’s “base load”. In other words, such a decision is somewhat independent of whether to expand or contract the trolley system.)
18
Edmonton Transit System
Evaluation issues…
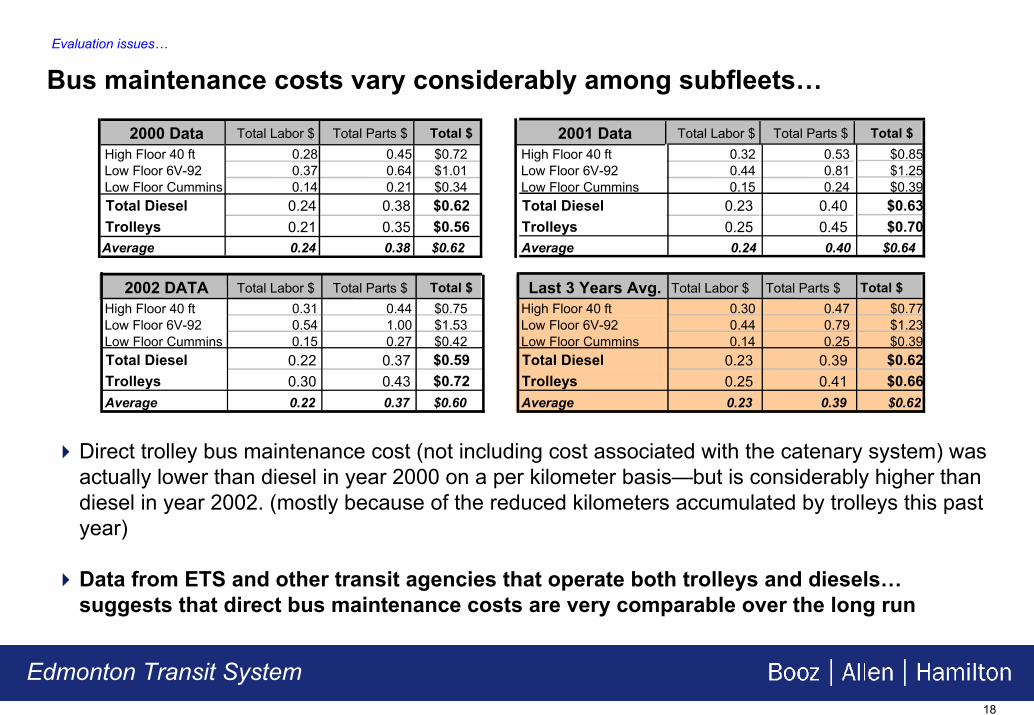
Bus maintenance costs vary considerably among subfleets…
2000 Data Total Labor $ Total Parts $ Total $ 2001 Data Total Labor $ Total Parts $ Total $High Floor 40 ft 0.28 0.45 $0.72 High Floor 40 ft 0.32 0.53 $0.85 Low Floor 6V-92 0.37 0.64 $1.01 Low Floor 6V-92 0.44 0.81 $1.25 Low Floor Cummins 0.14 0.21 $0.34 Low Floor Cummins 0.15 0.24 $0.39 Total Diesel 0.24 0.38 $0.62 Total Diesel 0.23 0.40 $0.63 Trolleys 0.21 0.35 $0.56 Trolleys 0.25 0.45 $0.70 Average 0.24 0.38 $0.62 Average 0.24 0.40 $0.64
2002 DATA Total Labor $ Total Parts $ Total $ Last 3 Years Avg. Total Labor $ Total Parts $ Total $High Floor 40 ft 0.31 0.44 $0.75 High Floor 40 ft 0.30 0.47 $0.77 Low Floor 6V-92 0.54 1.00 $1.53 Low Floor 6V-92 0.44 0.79 $1.23 Low Floor Cummins 0.15 0.27 $0.42 Low Floor Cummins 0.14 0.25 $0.39 Total Diesel 0.22 0.37 $0.59 Total Diesel 0.23 0.39 $0.62 Trolleys 0.30 0.43 $0.72 Trolleys 0.25 0.41 $0.66 Average 0.22 0.37 $0.60 Average 0.23 0.39 $0.62
Direct trolley bus maintenance cost (not including cost associated with the catenary system) was actually lower than diesel in year 2000 on a per kilometer basis—but is considerably higher than diesel in year 2002. (mostly because of the reduced kilometers accumulated by trolleys this past year)
Data from ETS and other transit agencies that operate both trolleys and diesels… suggests that direct bus maintenance costs are very comparable over the long run
19
Edmonton Transit System
Evaluation issues…
Total operating costs for ETBs are strongly linked to utilization of the overhead system…
Catenary system maintenance (including the overhead wire, substations, poles, and all special equipment) represents a substantial and unique cost for operating trolleys
While some maintenance costs associated with the catenary system are linked to usage rates, (i.e.,number of bus-kilometers operated underneath the wire), most costs are fixed
….therefore, the utilization of the catenary system (which can be defined as the annual number of bus-kilometers per kilometer of overhead wire) becomes an important driver of system cost
Unfortunately, utilization of ETS’s trolley network has declined over the past few years– Year 2000: 1.36 million kilometers accumulated by trolleys– Year 2001: 1.15 million kilometers accumulated by trolleys– Year 2002: 0.92 million kilometers accumulated by trolleys
The scheduled (planned) kilometers for all trolley routes in ETS’s system is 2.05 million kilometers annually. This indicates that the trolley system has been operating at about 45 to 70 percent utilization over the past few years
The low utilization in 2002 was due primarily to major infrastructure construction projects in the downtown area that were required to be completed during the summer months—thus hampering trolley operation significantly during this period
20
Edmonton Transit System
Evaluation issues…
Overall, operating costs for trolleys are higher than for diesel buses…and they remain so even if trolley bus utilization is increased
Mainteance cost per km $0.62 Mainteance cost per km $0.66Fuel economy (km per liter) 1.95 Fuel economy (kwh per km) 3.00 Diesel fuel cost per liter $0.47 Electricity cost per kwh $0.08Fuel cost per km $0.24 Fuel cost per km $0.24Annual Maintenance Cost ($M) $17.41 Annual Maintenance Cost ($M) $0.78Fuel Cost Total ($M) $6.77 Fuel Cost Total ($M) $0.28Total Annual Operating ($M) $24.18 Total Annual Operating ($M) $1.06Diesel Operating per km $0.86 Trolley Operating per km $0.90
Annual Overhead Maintenance ($) $1.10Overhead Maintenance per km $0.81Total Operating per km $1.71
Total fuel and bus maintenance costs for diesel and trolleys are about the same on a per kilometer basis
Overhead maintenance costs for the trolley system have averaged about $1.2 million the last few years. This does not include “capital costs” for pole replacement, substation upgrades and other periodic capital improvements. These capital costs have averaged about $350,000 annually over the past few years
At 65 percent utilization, operating costs for trolleys are about double that of diesels on a per kilometer basis. Even at 95% utilization, trolleys are still about 1.65 times more expensive to operate than a comparable diesel fleet
21
Edmonton Transit System
New trolley acquisition cost is arguably the biggest disadvantage versus motorized buses...
As previously noted, the market for ETBs in North America is both small and intermittent. This has caused prices for new ETBs to become exceedingly high
Vancouver’s recent purchase of 205 low floor (40ft.) ETBs and 88 articulated ETBs probably provides the best benchmark for comparative pricing. This was an open, competitive procurement and Vancouver received multiple bids. The winning bidder was New Flyer with pricing at about $850,000 to $900,000 for the 40 ft. buses. These buses will be equipped with AC drive systems, state-of-the-art control systems, and, auxiliary power units (APUs) which permit limited off-wire operation in order to maneuver around obstacles as well as in maintenance yards. This was a comparatively large order for trolleys and is representative of market pricing
By contrast, ETS recently purchased a number of standard, low floor diesel buses at a price of about $400,000
To control trolley acquisition costs, Seattle recently took a unique approach of salvaging electric propulsion systems from old ETBs and installing them in new chassis/bodies. Some assembly work was contracted out, while some was completed in-house by Seattle Metro mechanics. The final reported price for the “new” trolleys was about $440,000 US (about $580,000 Canadian)
Evaluation issues…
22
Edmonton Transit System
Evaluation issues…
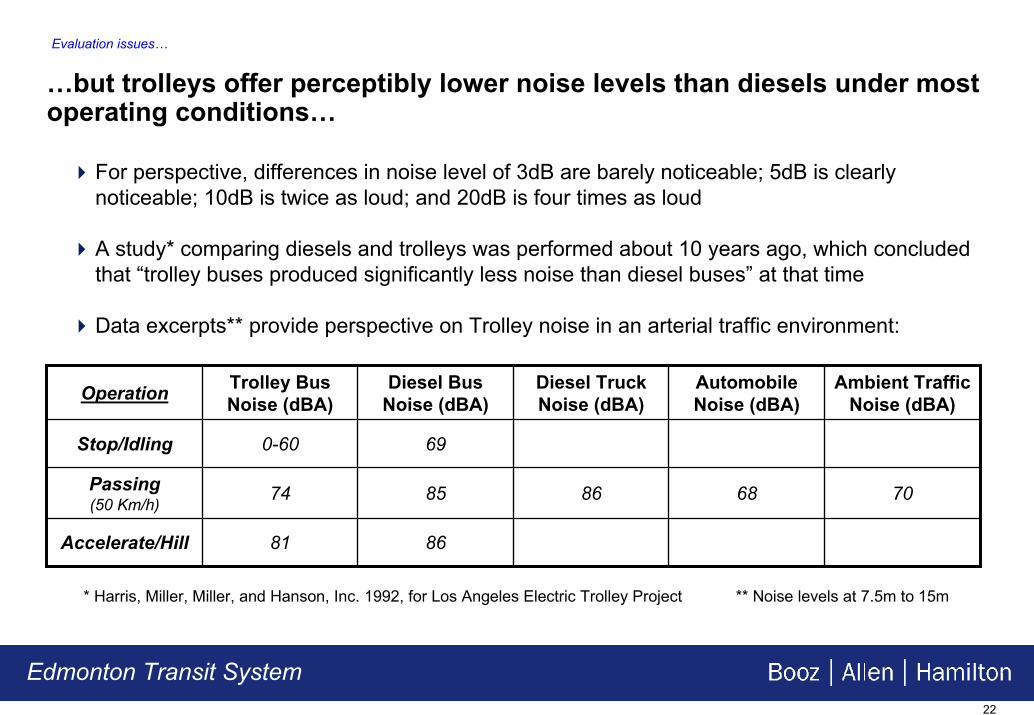
…but trolleys offer perceptibly lower noise levels than diesels under most operating conditions…
For perspective, differences in noise level of 3dB are barely noticeable; 5dB is clearly noticeable; 10dB is twice as loud; and 20dB is four times as loud
A study* comparing diesels and trolleys was performed about 10 years ago, which concluded that “trolley buses produced significantly less noise than diesel buses” at that time
Data excerpts** provide perspective on Trolley noise in an arterial traffic environment:
* Harris, Miller, Miller, and Hanson, Inc. 1992, for Los Angeles Electric Trolley Project ** Noise levels at 7.5m to 15m
68
Automobile Noise (dBA)
8681Accelerate/Hill
70868574Passing (50 Km/h)
690-60Stop/Idling
Ambient Traffic Noise (dBA)
Diesel Truck Noise (dBA)
Diesel Bus Noise (dBA)
Trolley Bus Noise (dBA)Operation
23
Regional Emissions Perspective
Edmonton Transit System
24
Edmonton Transit System
Regional emissions perspective…
Edmonton’s ambient air quality is not perceived as a major problem, as it is for many other North American cities…
Dust and chemicals from agricultural activity in the region are perceived as a greater concern than combustion emissions and particulate matter
Air quality in Edmonton (and Alberta overall) was reported as “Good” over 95% of the time --and “Fair” for the rest of the time -- in 2001
Good air quality is the best possible rating and means that there are no known harmful effects to human or environmental health.
Fair air quality means that there is adequate protection against harmful effects.
Poor air quality indicates that not all aspects of the environment are adequately protected from possible adverse effects.
Very Poor air quality means that continued high readings could pose a risk to human health.Source : CASA Data Warehouse
25
Edmonton Transit System
Regional emissions perspective…
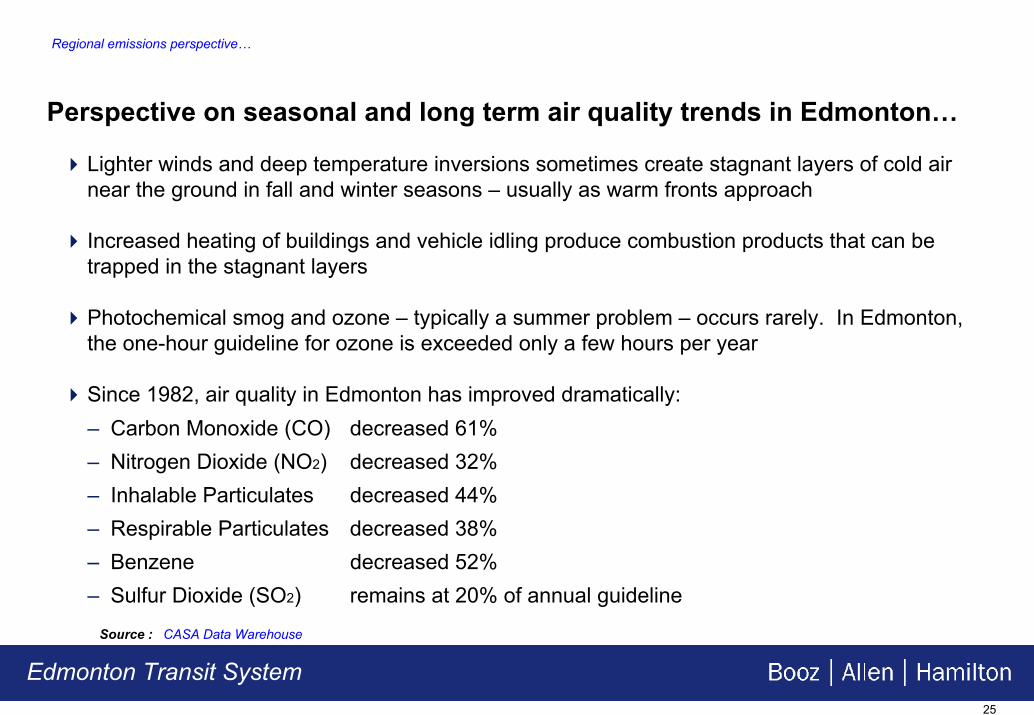
Perspective on seasonal and long term air quality trends in Edmonton…
Lighter winds and deep temperature inversions sometimes create stagnant layers of cold air near the ground in fall and winter seasons – usually as warm fronts approach
Increased heating of buildings and vehicle idling produce combustion products that can be trapped in the stagnant layers
Photochemical smog and ozone – typically a summer problem – occurs rarely. In Edmonton, the one-hour guideline for ozone is exceeded only a few hours per year
Since 1982, air quality in Edmonton has improved dramatically:– Carbon Monoxide (CO) decreased 61%– Nitrogen Dioxide (NO2) decreased 32%– Inhalable Particulates decreased 44%– Respirable Particulates decreased 38%– Benzene decreased 52%– Sulfur Dioxide (SO2) remains at 20% of annual guideline
Source : CASA Data Warehouse
26
Edmonton Transit System
Regional emissions perspective…
Perspective on regional and localized emissions conditions…
When evaluating regional air quality tradeoffs, it should be remembered that localized conditions near heavily traveled bus stops reflect higher concentrations of all engine emissions from all passing vehicles
Near busy bus stops, and for old technology diesels, it has been shown* that CO, NOx, and diesel odors can be considerably higher than ambient levels when buses are close by
At 6m to 10m from stops, the transient levels can be 10 times greater than ambient levels for short periods, and may increase by an additional factor of 4 times for distances of less than 6m
At a distance of about 30m, levels are close to ambient
Emission standards for new technology buses should provide significant improvement on both ambient and localized effects
* Concentrations of CO and NOx were predicted at 99 receptor locations in the vicinity of a busy intersection, using the US/EPA’s CAL3QHC dispersion model under mean meteorological conditions for alternative fuel technologies –Performed for Toronto Transit Commission 1995 by Rowan, Williams, Davies & Irwin Inc.
27
Regulations and diesel emissions
28
Edmonton Transit System
Regulations and diesel emissions…
The key Criteria Air Contaminants (CACs) regulated by EPA and Environment Canada include:
PM -- Particulate matter (PM) from internal combustion engines is composed of a combination of carbon particles, on the surface of which, organic compounds are adsorbed. If there is sulfur in the fuel, sulfur compounds will also be present on the particulate along with some metals from the fuel, lubricating oil and wear products. Because the carbon particles are generally less than 2.5 microns (greater than 90% by mass are less than 1 micron), they typically remain airborne and can be inhaled into the lungs where the adsorbed organic compounds can potentially cause health risks. The California Air Resources Board (CARB) for example has recently classified particulate matter from engines exhaust has a carcinogen. The specific health risks, and how risk is affected by various exposure levels (as well as length of exposure), continues to be the subject of considerable research and debate
NOx -- primarily NO, it is a non-toxic invisible tailpipe gas that is rapidly reduced to NO2 in the atmosphere. NO2 is a precursor to ozone and in high concentrations can irritate and damage lung tissue. NO2 combines with water to form nitric acid, which is damaging to trees and other plants. Particulates, NOx and SOx react in the atmosphere to form acid rain
29
Edmonton Transit System
Regulations and diesel emissions…
CACs regulated by EPA/Environment Canada…cont’dHydrocarbons (HC) are partially unburned elements in the fuel that are emitted in small quantities from diesel engines because of excess of air in the combustion process. The odor in diesel exhaust comprises aldehyde species of HC. Certain hydrocarbon species are carcinogenic or otherwise toxic and are also ozone precursors. Volatile Organic Compounds (VOCs) are defined in a regulatory sense as any compound of carbon that participates in atmospheric photochemical reactions. By definition, VOCs are the subset of organic compounds that are considered ozone precursors. For transportation sector purposes, HCs can generally be used synonymously with the VOC designation
Carbon Monoxide (CO) is also a product of incomplete combustion that is also emitted in small quantities from diesel engines because of excess air in the combustion process. In high concentrations CO is a poisonous gas, however, in the atmosphere it reduces to Carbon Dioxide (CO2)
Carbon Dioxide (CO2), unregulated at the present time, is considered the primary “greenhouse gas” and may promote the "greenhouse effect" by increasing atmospheric absorption of infrared radiation. CO2 emissions are (more or less) directly proportional to the efficiency of a propulsion system to convert the energy in fuel to motive power. CO2 is thus generally proportional to fuel economy
30
Edmonton Transit System
Regulations and diesel emissions…
The CACs of most concern for heavy duty diesel vehicles are NOx and PM
Diesel engines used in mobile vehicles (trucks, buses, construction and agricultural equipment, locomotives and other off-highway vehicles) represent a large source of Particulate Matter(PM) and Nitrogen Oxides (NOx) emissions in most urban areas of the country. By contrast, diesel engines are a fairly small contributor of Carbon Monoxide (CO) and Hydrocarbons (HC) emissions
In developing overall air quality improvement plans EPA and Environment Canada therefore have targeted diesel engines for a reduction in NOX and PM. The CO and HC emissions from diesel engines are of little consequence relative to overall air quality planning and emission control strategies. To this extent, the focus of this report is centered on assessing the impacts of future fleet strategies on NOX and PM
31
Edmonton Transit System
Regulations and diesel emissions…
Diesel exhaust is made up of many gases and fine particles – including some that have raised concern as health hazards…
The exact composition varies with engines, operating conditions, fuel and lube oil composition, and emission control systems in use. The main diesel exhaust components are:
PAH and PAH derivatives, and nitrobenzanthrones are considered carcinogens**
Primarily air quality/smog issuesNitrogen, oxygen, carbon dioxide, water vaporCommon combustion gases
Concerns/RisksMain ContentEmission Type
* PAH = Polycyclic aromatic hydrocarbons ** About 40 substances in these groups are listed by EPA as hazardous
32
Edmonton Transit System
Regulations and diesel emissions…
Many studies have been performed on cancer risk associated with diesel exposure – with mixed results…
Toxicity is highly variable with the composition of diesel exhaust—concentration of particulates is the most reliable predictor
Most study work has focused on lung cancer effects and occupational exposure
Average exposure of 1 microgram/cubic meter over two years have produced statistically significant cancer incidence in several studies with rats. Various study results with mice have been mixed, and negative with hamsters
NIOSH and IARC concluded there is evidence of human carcinogenic effects, and:
– California Proposition 65 identified diesel exhaust as”…known to cause cancer” in 1986
– U.S. EPA concluded diesel exhaust “…considered a probable human carcinogen…” in 1998
In their studies, HEI (1995) and WHO (1996) found only a weak association between exposure and human lung cancer, concluding (for example) that the rat studies were species-specific
Viewed overall, collective epidemiological study weighs in favor of causality in humans, but quantitative risk computations range widely – by more than an order-of-magnitude
The California ARB 1998 report stopped short of setting an exposure threshold for diesel
33
Edmonton Transit System
Regulations and diesel emissions…
In addition to potential cancer effects, other health effects of diesel exhaust products have been studied…
EPA has established a chronic inhalation reference concentration value of 5 micrograms/cubic meter for non-cancer effects of diesel exhaust
Diesel exhaust contains genotoxic substances with potential genotoxic effects, such as altered DNA synthesis and bacterial mutation, and it is likely these substances would be “bioavailable” at some level in humans with chronic diesel exposure.
Genotoxic**
Articles postulate allergic response and higher incidence of asthma. Studies have confirmed increased antigen response to allergens. Animal studies using chronic diesel exposure have produced lung infection and chronic inflammatory responses.
Immunological
Insufficient information to determine whether or not humans are affected. Heritable point mutations and sperm abnormality studies have been negative for rats, mice, monkeys; sperm abnormalities detected in hamsters.
Reproductive, developmental, teratogenic*
Indications of Available Chronic Exposure StudiesHuman and Animal Effects
* Affecting fetal development and growth ** Affecting genetic materials and processes
34
Edmonton Transit System
Regulations and diesel emissions…
Overall, there is consensus that numerous component ingredients of diesel emissions – by themselves – can have a causal link to cancer…but
Determining risk levels requires predicting the extent of exposure “needed” (in time and quantity) to do damage, as well as predicting the amount and form of the carcinogenic products produced
Exposure thresholds to diesel emissions products have not been determined for cancer risk, despite a great many studies intended to do so. Risk exposure is thought to vary considerably with susceptibility (age, health, chronic non-cancer conditions, etc.)
Predictions of specific diesel emissions are also uncertain, because there are many variables:– Fuel composition and emissions control systems in use– Engine type, performance, and operational duty cycle– Effects of climate, sunlight, and other pollutants on diesel emissions products
Environmental protection agencies have nonetheless focused on aggressive regulation of small-particle particulates as an effective surrogate for other thresholds
35
Edmonton Transit System
Regulations and diesel emissions…
Heavy-duty diesel engine emission regulations will be dramatically reduced in 2007
EPA NOX Emissions Standards
10.7
6.0
5.0
4.0
2.5
0.20.0
2.0
4.0
6.0
8.0
10.0
12.0
1988
1990
1992
1994
1996
1998
2000
2002
2004
2006
2008
gram
s pe
r bhp
-hr
NOX from 2007 forward diesel engines to be reduced by 95% compared to todays diesels
EPA Paticulate Emissions Standards
0.60
0.25
0.100.07 0.05 0.05 0.05
0.010.00
0.10
0.20
0.30
0.40
0.50
0.60
0.70
1988
1990
1992
1994
1996
1998
2000
2002
2004
2006
2008
gram
s pe
r bhp
-hr
PM from 2007 forward diesel engines to be reduced by 80% compared to todays diesels
These regulations will be met using a combination of sophisticated engine controls, particulate traps, NOX reduction catalysts…and most importantly, the use of ultra low sulfur fuel.
36
Calculation of Emission Factors
Edmonton Transit System
37
Edmonton Transit System
Calculation of emissions factors…
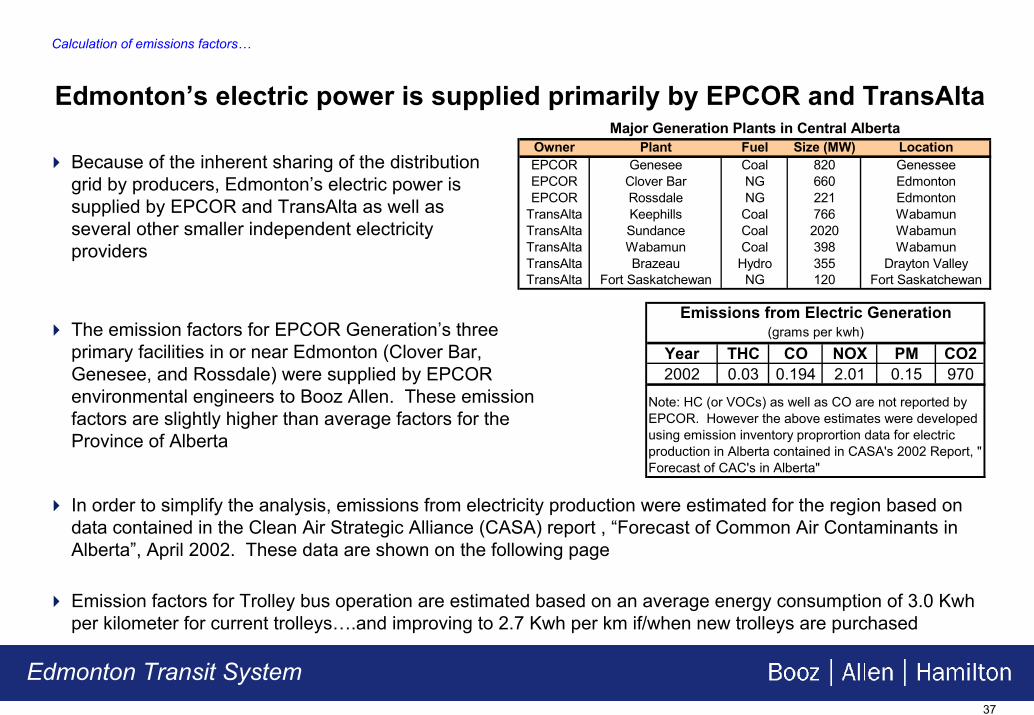
Edmonton’s electric power is supplied primarily by EPCOR and TransAltaOwner Plant Fuel Size (MW) LocationEPCOR Genesee Coal 820 GenesseeEPCOR Clover Bar NG 660 EdmontonEPCOR Rossdale NG 221 Edmonton
TransAlta Keephills Coal 766 WabamunTransAlta Sundance Coal 2020 WabamunTransAlta Wabamun Coal 398 WabamunTransAlta Brazeau Hydro 355 Drayton ValleyTransAlta Fort Saskatchewan NG 120 Fort Saskatchewan
Major Generation Plants in Central Alberta
Because of the inherent sharing of the distribution grid by producers, Edmonton’s electric power is supplied by EPCOR and TransAlta as well as several other smaller independent electricity providers
Year THC CO NOX PM CO22002 0.03 0.194 2.01 0.15 970
Emissions from Electric Generation(grams per kwh)
Note: HC (or VOCs) as well as CO are not reported by EPCOR. However the above estimates were developed using emission inventory proprortion data for electric production in Alberta contained in CASA's 2002 Report, " Forecast of CAC's in Alberta"
The emission factors for EPCOR Generation’s three primary facilities in or near Edmonton (Clover Bar, Genesee, and Rossdale) were supplied by EPCOR environmental engineers to Booz Allen. These emission factors are slightly higher than average factors for the Province of Alberta
In order to simplify the analysis, emissions from electricity production were estimated for the region based on data contained in the Clean Air Strategic Alliance (CASA) report , “Forecast of Common Air Contaminants in Alberta”, April 2002. These data are shown on the following page
Emission factors for Trolley bus operation are estimated based on an average energy consumption of 3.0 Kwh per kilometer for current trolleys….and improving to 2.7 Kwh per km if/when new trolleys are purchased
38
Edmonton Transit System
Calculation of emissions factors…
Future electric generation in Alberta will continue to be dominated by coal fired plants…..but average emissions per kwh should drop
Emission Rates from Electric Generation in Alberata (grams per kwh)
Electic Power Generation Emission Rates as a Percent of 1995 Baseline
Trolley Bus Emission Factors
PM and NOx emissions from power generation are forecasted to drop by 50% and 30% respectively by 2020 (from 1995 levels) according to CASA’s most recent emissions inventory report
39
Edmonton Transit System
Calculation of emissions factors…
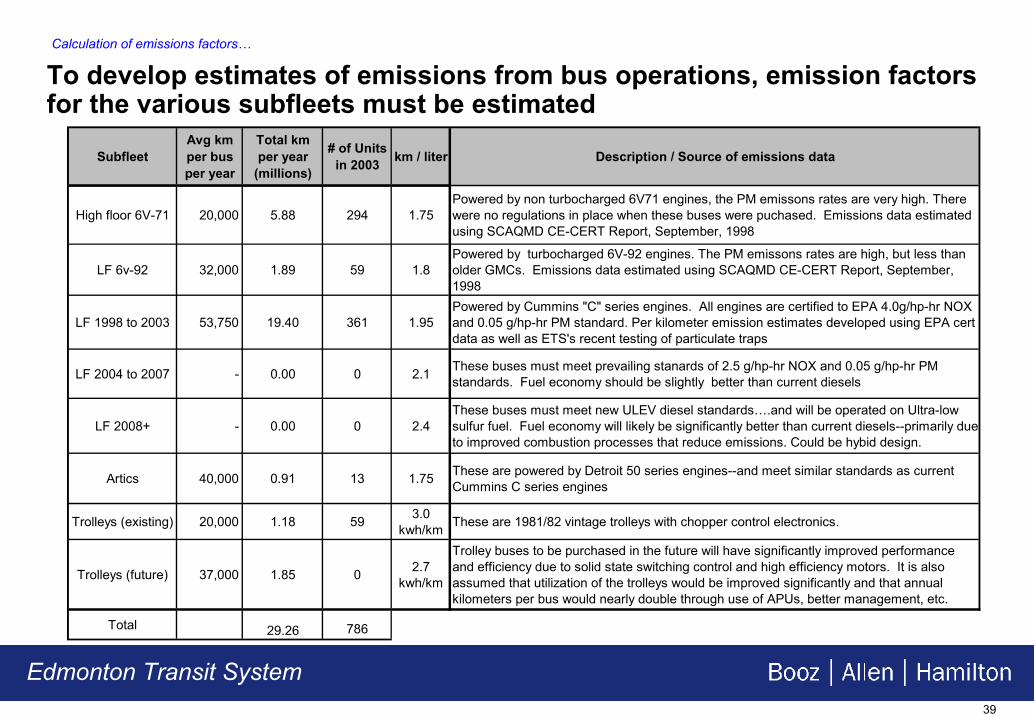
To develop estimates of emissions from bus operations, emission factors for the various subfleets must be estimated
SubfleetAvg km per bus per year
Total km per year
(millions)
# of Units in 2003 km / liter Description / Source of emissions data
High floor 6V-71 20,000 5.88 294 1.75Powered by non turbocharged 6V71 engines, the PM emissons rates are very high. There were no regulations in place when these buses were puchased. Emissions data estimated using SCAQMD CE-CERT Report, September, 1998
LF 6v-92 32,000 1.89 59 1.8Powered by turbocharged 6V-92 engines. The PM emissons rates are high, but less than older GMCs. Emissions data estimated using SCAQMD CE-CERT Report, September, 1998
LF 1998 to 2003 53,750 19.40 361 1.95Powered by Cummins "C" series engines. All engines are certified to EPA 4.0g/hp-hr NOX and 0.05 g/hp-hr PM standard. Per kilometer emission estimates developed using EPA cert data as well as ETS's recent testing of particulate traps
LF 2004 to 2007 - 0.00 0 2.1 These buses must meet prevailing stanards of 2.5 g/hp-hr NOX and 0.05 g/hp-hr PM standards. Fuel economy should be slightly better than current diesels
LF 2008+ - 0.00 0 2.4These buses must meet new ULEV diesel standards….and will be operated on Ultra-low sulfur fuel. Fuel economy will likely be significantly better than current diesels--primarily due to improved combustion processes that reduce emissions. Could be hybid design.
Artics 40,000 0.91 13 1.75 These are powered by Detroit 50 series engines--and meet similar standards as current Cummins C series engines
Trolleys (existing) 20,000 1.18 59 3.0 kwh/km These are 1981/82 vintage trolleys with chopper control electronics.
Trolleys (future) 37,000 1.85 0 2.7 kwh/km
Trolley buses to be purchased in the future will have significantly improved performance and efficiency due to solid state switching control and high efficiency motors. It is also assumed that utilization of the trolleys would be improved significantly and that annual kilometers per bus would nearly double through use of APUs, better management, etc.
Total 29.26 786
40
Edmonton Transit System
Calculation of emissions factors…
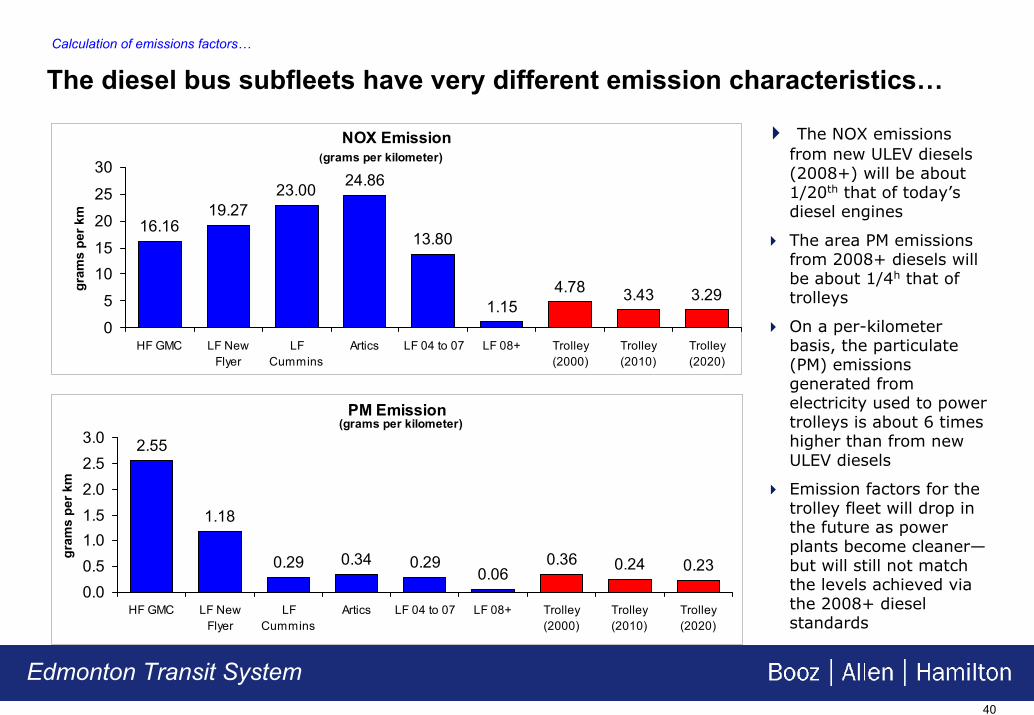
The diesel bus subfleets have very different emission characteristics…
The NOX emissions from new ULEV diesels (2008+) will be about 1/20th that of today’s diesel engines
The area PM emissions from 2008+ diesels will be about 1/4h that of trolleys
On a per-kilometer basis, the particulate (PM) emissions generated from electricity used to power trolleys is about 6 times higher than from new ULEV diesels
Emission factors for the trolley fleet will drop in the future as power plants become cleaner—but will still not match the levels achieved via the 2008+ diesel standards
NOX Emission
16.1619.27
23.00 24.86
13.80
1.154.78 3.43 3.29
05
1015202530
HF GMC LF NewFlyer
LFCummins
Artics LF 04 to 07 LF 08+ Trolley(2000)
Trolley(2010)
Trolley(2020)
gram
s pe
r km
(grams per kilometer)
PM Emission
2.55
1.18
0.29 0.34 0.290.06
0.36 0.24 0.230.00.51.01.52.02.53.0
HF GMC LF NewFlyer
LFCummins
Artics LF 04 to 07 LF 08+ Trolley(2000)
Trolley(2010)
Trolley(2020)
gram
s pe
r km
(grams per kilometer)
41
Edmonton Transit System
Calculation of emissions factors…
Overall fleet emission inventories are calculated based on subfleet emission factors and annual kilometers accumulated
The old GMCs represent only 19% of total fleet kilometers, but account for 62% of the PM emissions
The low floor Cummins sub-fleet represents 69% of total fleet kilometers but only 26% of PM emissions
CO2 (greenhouse emissions) are roughly proportional to the kilometers accumulated by the various subfleets
Trolleys represent a comparatively small percentage of fleet emissions
Overall, the bus fleet generates a small fraction of the overall emissions from transportation sources in Edmonton
NOX and PM emissions from ETS bus fleet operations are estimated at 1.8% and 1.6% respectively of the total emissions from transportation sources in Edmonton
HC and CO emissions from the ETS fleet are approximately 0.16% and 0.11% respectively of total transportation emissions. Gasoline vehicles are the primary contributor to HC and CO
HC (VOC) CO NOX PM10All Mobile and Stationary Sources 306,750 259,200 115,650 258,300
All Transportation Sources 11,385 114,060 34,110 1,500 Gasoline Vehicles
Total Diesel 1,580 9,402 23,645 1,255 Diesel as % of total transp. 14% 8% 69% 84%
Edomonton Transit System (2003) 18 122 614 24
ETS as % of all Sources 0.006% 0.047% 0.531% 0.009%ETS as % of all Transportation 0.16% 0.11% 1.80% 1.57%
Note: Assumes Edmonton (Census Region 11) represents approximately 15% of Alberta total
Edmonton Regional 2000 Emissions (Tonnes per Year)
Source: Forecast of CAC’s in Alberta, CASA Report, April, 2002, and, BAH analysis of ETS fleet emissions
43
Two Future Scenarios
44
Edmonton Transit System
Future scenarios…
Edmonton’s bus service is expanding… our assumptions
The current diesel bookout requirement is 550 units…and trolley is 39 units
The average annual kilometers per bookout is about 51,000 for diesel and 25,000 for trolley
Average growth in bookout requirements will be 2.5% per year for next 10 years (results in additional 13 to 16 bookouts per year)…….and growth will be 2.0% per year thereafter
Bookout requirements are reduced by 6 units, 27 units, and 8 units in 2006, 2008, and 2010 respectively due to implementation of LRT service
Old GMCs are being rehabilitated at a rate of 15 per year for 6 years (total of 90 buses rehabilitated)
All 1993/94 low floor buses will be rehabilitated by end of 2004
The fleet will be managed to an overall spares ratio of 25 percent
45
Edmonton Transit System
Future scenarios…
We have evaluated two alternative plans for Edmonton’s transit fleet to help frame the diesel versus trolley decision…
# 1 -- “Baseline” (continued and enhanced ETB service)
# 2 -- “All-Motorized” (ETB service phased out by 2010)
Both scenarios are projected out over next 20 years (2003 through 2023)
Results of the two scenarios are presented in the following pages along with various assumptions that apply to all scenarios
Environmental and economic impacts of the two scenarios are then summarized
46
Edmonton Transit System
Future scenarios…
# 1 -- “Baseline” ….maintain and enhance trolley service
Purchase 49 new low-floor ETBs with Auxiliary Power Units (APUs) which allow off-wire operation. (39 pullout X 1.25 spares)
Rehabilitate 30 existing trolleys that are in need of repair to ensure safe / efficient operation. These can become “extra” spares after 2010
ETB Purchase and Rehabilitation
Retire all old ETBs except those that were rehabilitatedRetire any ETBs needing major rehabilitation. ETB Retirements
Continue wire and pole rehabilitation programAggressively complete wire and pole rehabilitation program to improve overhead reliability.Trolley Overhead
Leverage (APUs) of new fleet to help further limit shutdowns. Manage trolley fleet with goal of 37,000 kilometers per trolley.
Maximize 7-day ETB operations. Strictly limit shutdowns with improved mngt & scheduling of trolleys. Km/ year to increase from 16K to 30K with better policies.
ETB Operations Management
Retire at a rate to meet pullout growth and transition to 25% spares plus only 10 backup for ETBs
Retire at a rate to meet pullout growth and transition to 25% spares plus 39 backup for ETBsDiesel Retirements
Continue to purchase 35 new buses each yr. Rehab a total of 90 buses. nue to purchase 35 new buses each yearConti
15 GMCs per year for Diesel Purchase and
Rehabilitation
20102004 through 2009Feature
47
Edmonton Transit System
Future scenarios…
# 2 -- “All-Motorized” …ETB service phased out in 2010
No new purchasesPhase out ETB rehabilitation by designating best available ETBs to complete service thru 2007
ETB Purchase and Rehabilitation
Retire all ETBsRetire any ETBs needing major rehabilitation. Adjust service if needed ETB Retirements
Decommission overhead wire and substations.
Phase out wire and pole rehabilitation program. Maintenance and repair only.Trolley Overhead
N/AMaximize 7-day ETB operations with available ETBs. Strictly limit shutdowns
ETB Operations Management
Retire at a rate to meet new pullout requirement and transition to 25% spares
Retire at a rate to meet pullout growth and transition to 25% spares plus 39 backup for ETBs
Continue to purchase 35 new and rehabilitate 15 GMCs per year
Diesel Purchase and Rehabilitation
20102004 through 2009Feature
48
Edmonton Transit System
Future scenarios…
Additional assumptions for both scenarios…capital cost
The capital cost of diesel buses is estimated at $400,000 for 2003. For 2008, the cost of a diesel bus is estimated to increase to $500,000 (in current dollars) to cover possible escalation due to more stringent emission controls needed on future diesels
The capital cost of a trolley bus is estimated at $900,000 for 2003. This includes a trolley equipped with an Auxiliary Power Unit (APU) that would permit limited off-wire operation in order to maneuver around street construction, and maintenance garages
While cities like Seattle have reduced the costs of “new” trolley buses by using the electric drive systems from older units, this strategy is not recommended– The drive systems in the current New Flyer trolleys are older technology—and
drawbacks include limited/no parts availability, inefficient voltage regulation and speed control, and compromised reliability
– New trolleys (such as those being purchased by Vancouver) offer significantly better fuel efficiency, improved performance, full warranties, good availability of parts, improved reliability, and an APU
If a “low cost” trolley procurement strategy were selected using parts from existing buses, Edmonton could expect a reduced useful life and/or higher operating costs compared to new trolleys, (i.e. no free lunch)
49
Edmonton Transit System
Future scenarios…
Additional assumptions …operating cost
For the Baseline scenario, maintenance costs for 2010 trolley buses are estimated to be reduced significantly compared to current trolleys to reflect improved reliability and design
Fuel efficiency of new trolleys is estimated to be about 10% better than current trolleys
As previously noted, future NOX and PM emissions from electricity generation will be significantly reduced from today’s levels…(using CASA data)
Overhead maintenance costs will increase marginally (about 1%/yr) to account for the aging system. On-going capital improvements to the trolley overhead system (including substation related costs) will average $350,000 per year in the long term. (this is actually less than recent history would suggest)
For Scenario’s #2, the cost of dismantling the trolley overhead system is $10 million—and would be spent in year 2010
Costs to Rehab existing trolleys will be about $50,000 per unit. This would be a moderate level rehab to ensue safe and efficient operation through 2010 and beyond
Diesel fuel costs will likely increase by about 2 cents per liter in 2007 due to ultra low sulfur requirements. The cost of electricity will remain relatively constant on a per kwh basis
50
Scenario Analysis and Comparison
51
Edmonton Transit System
Scenario analysis…
Projected fleet bookout requirements will reach over 1000 buses by 2023
A “baseline” procurement and retirement plan has been developed
New bus procurements are fixed at 35 units per year
Oldest buses are retired to maintain 25% spares ratio
In 2010, 59 old trolleys are retired and 49 new trolleys are purchased, (trolley pullout requirements stay constant at 39)
Trolley system (by use of APUs and better management of catenary disruptions), will have 25% diesel backup after 2010 (we have assumed 100% diesel backup until then)
Annual Kilometers by subfleet
0.0
5.0
10.0
15.0
20.0
25.0
30.0
35.0
40.0
45.0
2003
2004
2005
2006
2007
2008
2009
2010
2011
2012
2013
2014
2015
2016
2017
2018
2019
2020
2021
2022
2023
kilo
met
ers
(mill
ions
)
HF GMC
Existing fleet of LF CumminsLF 6v-92
New 04 to 07 buses
2008+ ULEV diesels
HF GMC
Trolleys
Artics
The annual kilometers accumulated by the various subfleets are adjusted slightly each year to ensure the total “system” kilometer requirements are met along with peak pullouts
Based on this plan, annual system kilometers increase to over 41 million by 2023…a 41% increase in Vehicle Kilometers Traveled (VKT)
53
Edmonton Transit System
Scenario analysis…
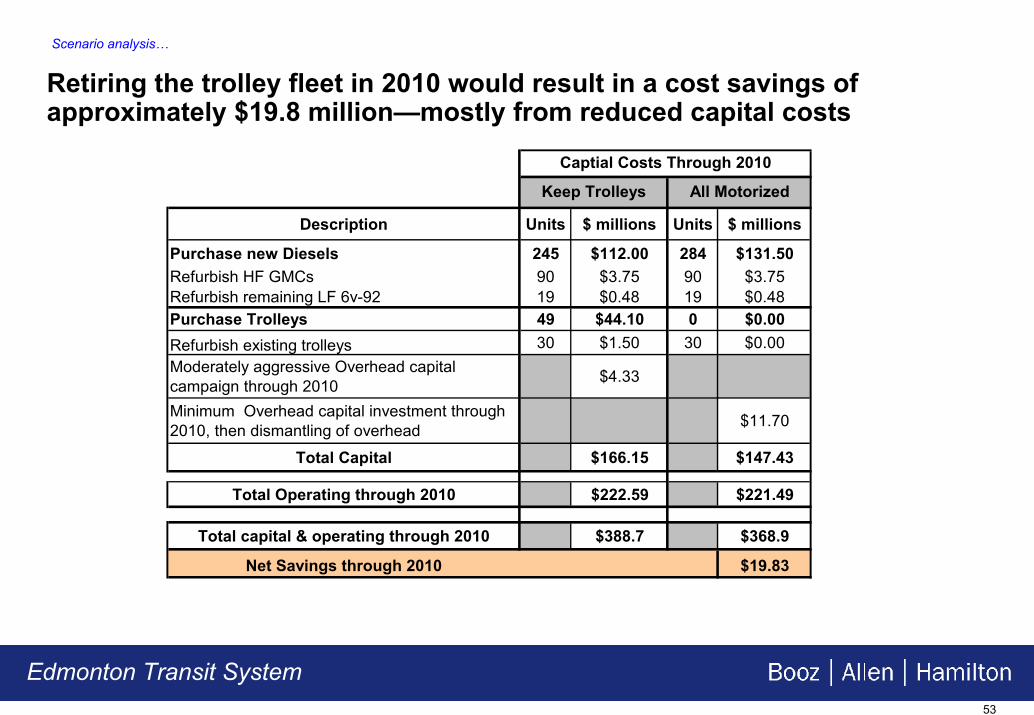
Retiring the trolley fleet in 2010 would result in a cost savings of approximately $19.8 million—mostly from reduced capital costs
Minimum Overhead capital investment through 2010, then dismantling of overhead $11.70
Total Capital $166.15 $147.43
Total Operating through 2010 $222.59 $221.49
Total capital & operating through 2010 $388.7 $368.9
Net Savings through 2010 $19.83
Keep Trolleys All Motorized
Captial Costs Through 2010
54
Edmonton Transit System
Scenario analysis…
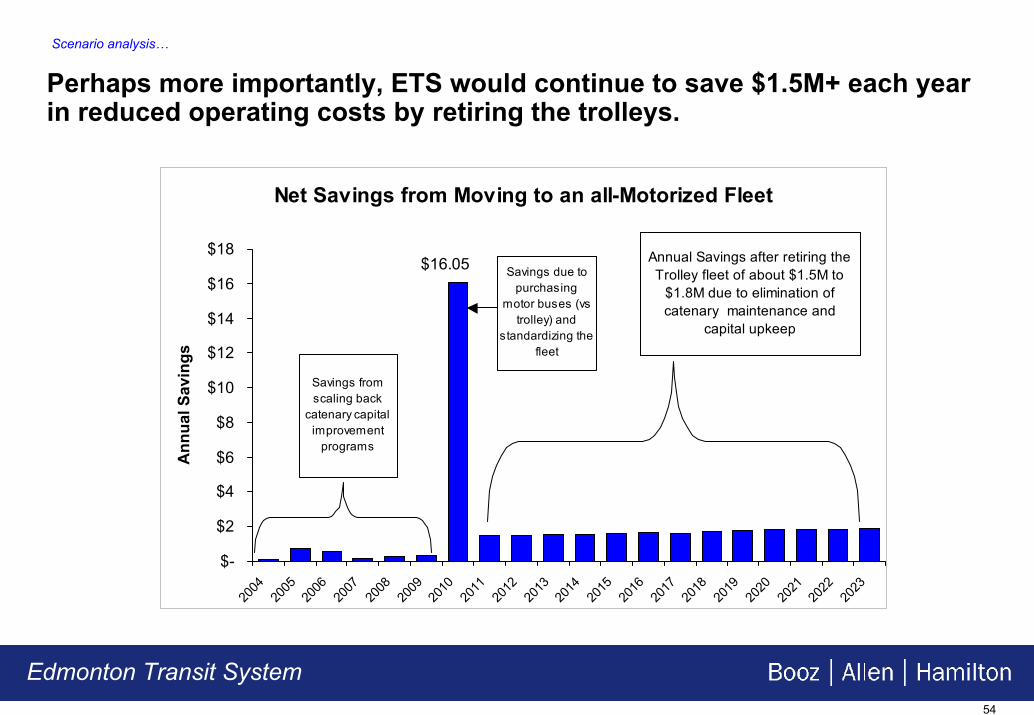
Perhaps more importantly, ETS would continue to save $1.5M+ each year in reduced operating costs by retiring the trolleys.
Net Savings from Moving to an all-Motorized Fleet
$-
$2
$4
$6
$8
$10
$12
$14
$16
$18
2004
2005
2006
2007
2008
2009
2010
2011
2012
2013
2014
2015
2016
2017
2018
2019
2020
2021
2022
2023
Ann
ual S
avin
gs
Annual Savings after retiring the Trolley fleet of about $1.5M to
$1.8M due to elimination of catenary maintenance and
capital upkeep
Savings from scaling back
catenary capital improvement
programs
Savings due to purchasing
motor buses (vs trolley) and
standardizing the fleet
$16.05
55
Edmonton Transit System
Scenario analysis…
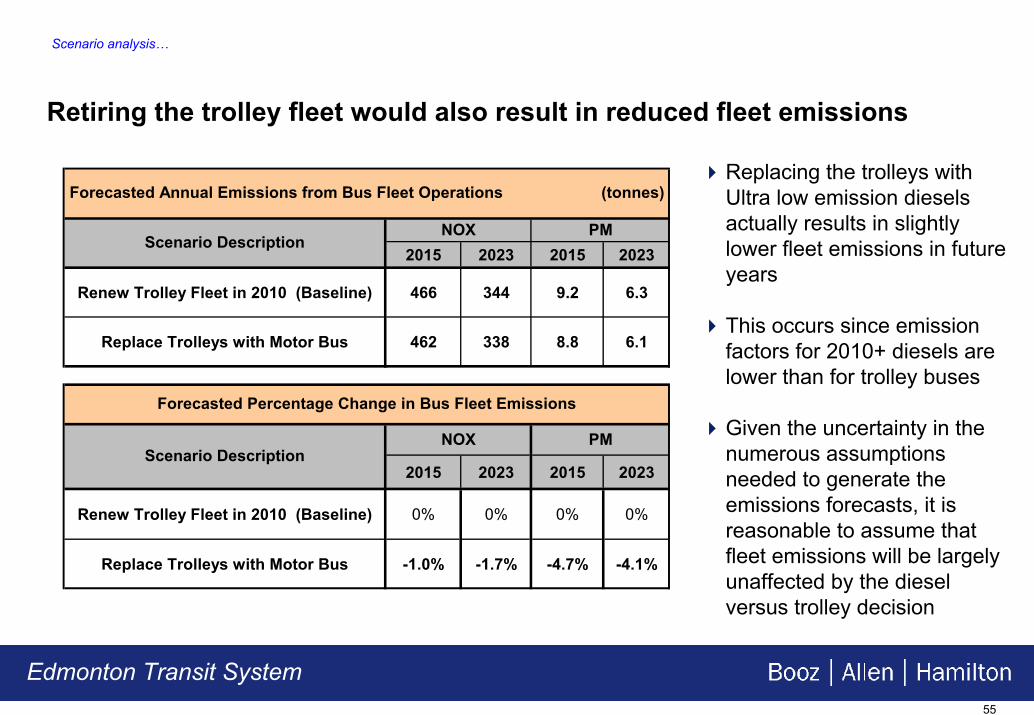
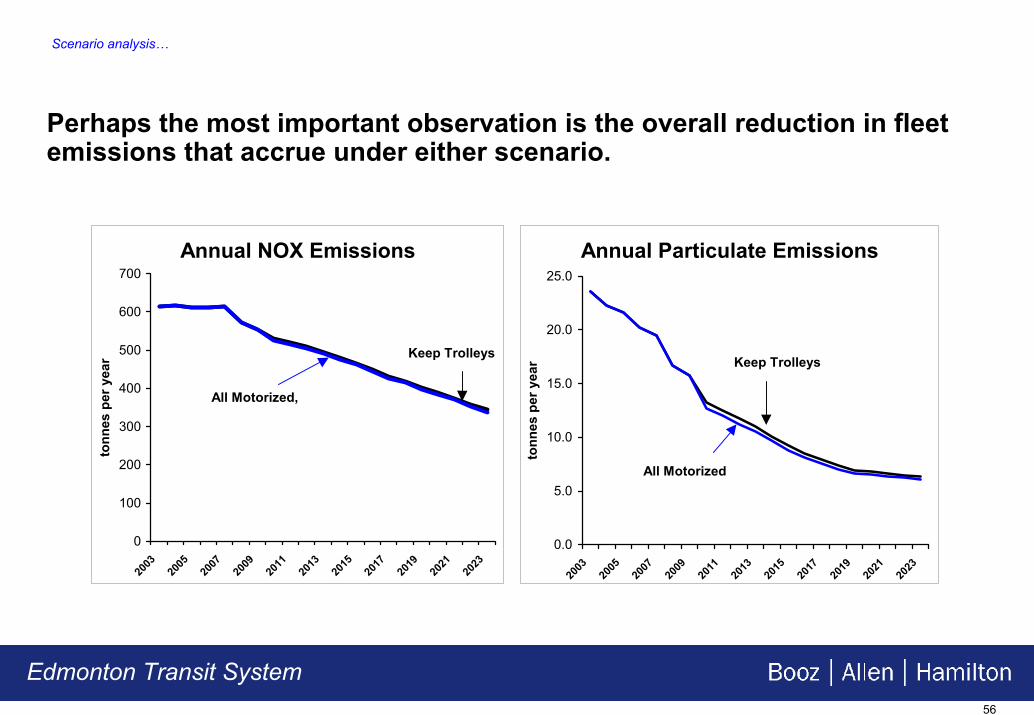
Retiring the trolley fleet would also result in reduced fleet emissions
Replacing the trolleys with Ultra low emission diesels actually results in slightly lower fleet emissions in future years
This occurs since emission factors for 2010+ diesels are lower than for trolley buses
Given the uncertainty in the numerous assumptions needed to generate the emissions forecasts, it is reasonable to assume that fleet emissions will be largely unaffected by the diesel versus trolley decision
2015 2023 2015 2023
Renew Trolley Fleet in 2010 (Baseline) 466 344 9.2 6.3
Replace Trolleys with Motor Bus 462 338 8.8 6.1
2015 2023 2015 2023
Renew Trolley Fleet in 2010 (Baseline) 0% 0% 0% 0%
Replace Trolleys with Motor Bus -1.0% -1.7% -4.7% -4.1%
NOX PM
Forecasted Annual Emissions from Bus Fleet Operations (tonnes)
Scenario Description
NOX PM
Forecasted Percentage Change in Bus Fleet Emissions
Scenario Description
56
Edmonton Transit System
Scenario analysis…
Perhaps the most important observation is the overall reduction in fleet emissions that accrue under either scenario.
Annual NOX Emissions
0
100
200
300
400
500
600
700
2003
2005
2007
2009
2011
2013
2015
2017
2019
2021
2023
tonn
es p
er y
ear Keep Trolleys
All Motorized,
Annual Particulate Emissions
0.0
5.0
10.0
15.0
20.0
25.0
2003
2005
2007
2009
2011
2013
2015
2017
2019
2021
2023
tonn
es p
er y
ear Keep Trolleys
All Motorized
57
Edmonton Transit System
Scenario analysis…
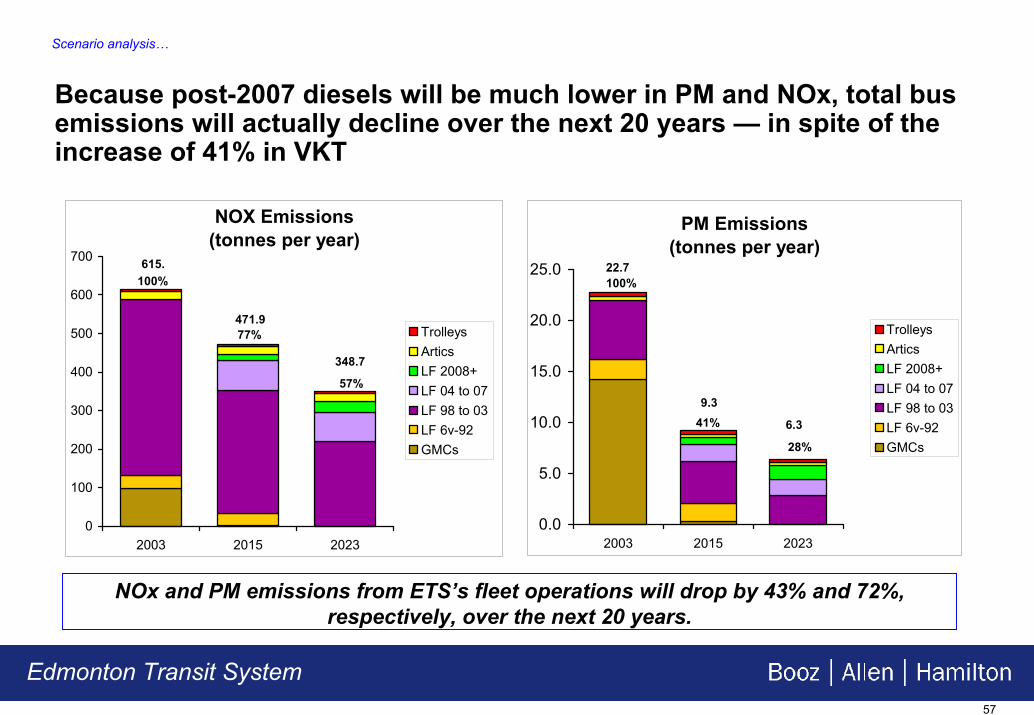
Because post-2007 diesels will be much lower in PM and NOx, total bus emissions will actually decline over the next 20 years — in spite of the increase of 41% in VKT
NOX Emissions (tonnes per year)
0
100
200
300
400
500
600
700
2003 2015 2023
TrolleysArticsLF 2008+LF 04 to 07LF 98 to 03LF 6v-92GMCs
100%
77%
57%
615.
471.9
348.7
PM Emissions (tonnes per year)
0.0
5.0
10.0
15.0
20.0
25.0
2003 2015 2023
TrolleysArticsLF 2008+LF 04 to 07LF 98 to 03LF 6v-92GMCs
100%
41%
28%
6.3
9.3
22.7
NOx and PM emissions from ETS’s fleet operations will drop by 43% and 72%, respectively, over the next 20 years.
58
Edmonton Transit System
Summary Observations….
Edmonton’s trolley fleet is old, and the trolley system is underutilized. ETS must decide to either renew or abandon it’s trolley operations
Because of dramatic improvements in diesel engine emissions controls (spurred by the impending 2007 exhaust regulations), trolleys no longer will offer advantages in area-wide emissions compared to diesel buses
Localized emission considerations (at downtown street corners) will continue to favor trolleys,– but the perceived difference is likely to be very small, given expected reductions in diesel bus
tailpipe emissions, and– Trolley service only accounts for about 7% of total fleet kilometers, only 4.2% of total route-
stops, and only 1.4% of system route stops are exclusively served by trolleys
The trolley system has been -- and will continue to be -- more expensive to operate and maintain than equivalent diesel service